Article

Benefit Transfer for Water Management along the Han River in South Korea Using Meta-Regression Analysis

1
Department of Agricultural and Resource Economics, Kangwon National University, 200-701 Chuncheon, Korea
2
Environmental Policy Research Group, Korea Environment Institute, 30147 Sejong, Korea
3
Korea Forest Research Institute, 130-712 Seoul, Korea
4
Division of Forest Industry Research, National Institute of Forest Science, 02455 Seoul, Korea
5
Institute for Environmental Economics and World Trade, Leibniz University, 30167 Hannover, Germany
6
Department of Plant Ecology, University of Bayreuth, 95440 Bayreuth, Germany
*
Author to whom correspondence should be addressed.
Water 2016, 8(11), 492; https://doi.org/10.3390/w8110492
Submission received: 19 June 2016 / Revised: 20 October 2016 / Accepted: 21 October 2016 / Published: 31 October 2016
(This article belongs to the Special Issue Water Economics and Policy)

Abstract

:
This study estimates the magnitude of economic benefits that are justified in transfer from downstream users to upstream users for the use of the Han River in South Korea in terms of foregone economic benefits by regulations. Based on the existing non-market valuation studies associated with water management issues in South Korea from 1997 to 2014, a meta-regression analysis was performed to provide alternatives for regional benefit sharing of water resource use. The benefits from the use of water resource along the Han River are estimated on average to be KRW 7,728 (US $7.7) per household per month. The total net benefits are estimated to be about KRW 449 billion (US $449 million) per year. Following the principle regarding equal distribution of benefits, the stakeholders who received more net benefits than others should return their extra net benefits to other stakeholders through a policy tool such as tradable development rights. The results of our study provide economic indicators useful for the establishment of common resource policy and to consider stakeholders’ rights within the framework of regional benefits. This study also provides practical solutions that could be used as a valid policy instrument to mediate the conflicts and disputes associated with water resource use.

1. Introduction

According to the principles suggested by international organizations such as the World Commission on Dams (WCD), the Food and Agriculture Organization (FAO), and the United Nations (UN), benefits from water resource use should be equally distributed among river basin stakeholders because water along the river should be considered as their common goods, while its costs should be equitably shared among them [1]. These principles potentially indicate that downstream users (DU) and, partially midstream users (MU) are, in general, economically well-developed while upstream users (UU) may not be. In other words, UU are often related to rural areas while MU and DU are associated with urban or metropolitan areas. If economic activities are restricted only to UU in order to protect water quality and to maintain adequate water yield for MU and DU, then UU lose their opportunities for potential economic development in terms of using water resources. In such cases, some measures could be possibly taken in order to achieve equal distribution of benefits from the use of water resources among stakeholders and for the sake of partial compensation for foregone economic benefits due to restriction in upstream economic activities. In other words, DU and/or MU, who benefit more from the water use, should return their extra net benefits to MU and/or UU who benefit less as a consequence of regulations related to management of water resources.
In South Korea, there are four major river basins, e.g., belonging to the Han River, the Geum River, the Nakdong River, and the Yeongsan River. These four major rivers are an important environmental resource to provide many direct and indirect beneficial services, such as providing sources of drinking water, provision of recreational activities and aesthetic amenities, and driving economic development. Water resources, however, have some specific features. For example, the management is not solely determined by one authority since hydrological boundaries are different from administrative boundaries. Consequently, water management involves various stakeholders, and the structural complexity can cause conflicts and disputes, especially for the regional distribution of water use. Since the importance of water management has been recognized, the Korean government has been seeking ways to solve the issues associated with the allocation of water resource among its users and to ensure the fair distribution of water use within the river basin. Of the four major river basins, the Han River is an example of the case above. The regional allocation of water use along the Han River basin has long been an issue but no systematic efforts have been made to find final solutions. This motivates us to suggest practical solutions for the allocation problems related to the water use among stakeholders in this case study.
The Han River Basin includes five administrative districts and is formed by the watersheds of the Namhan River (South Han River) and the Bukhan River (North Han River). The extent of the Han River Basin is 24,988 km2 which accounts for 69.6% of the total areas of five administrative districts (35,927 km
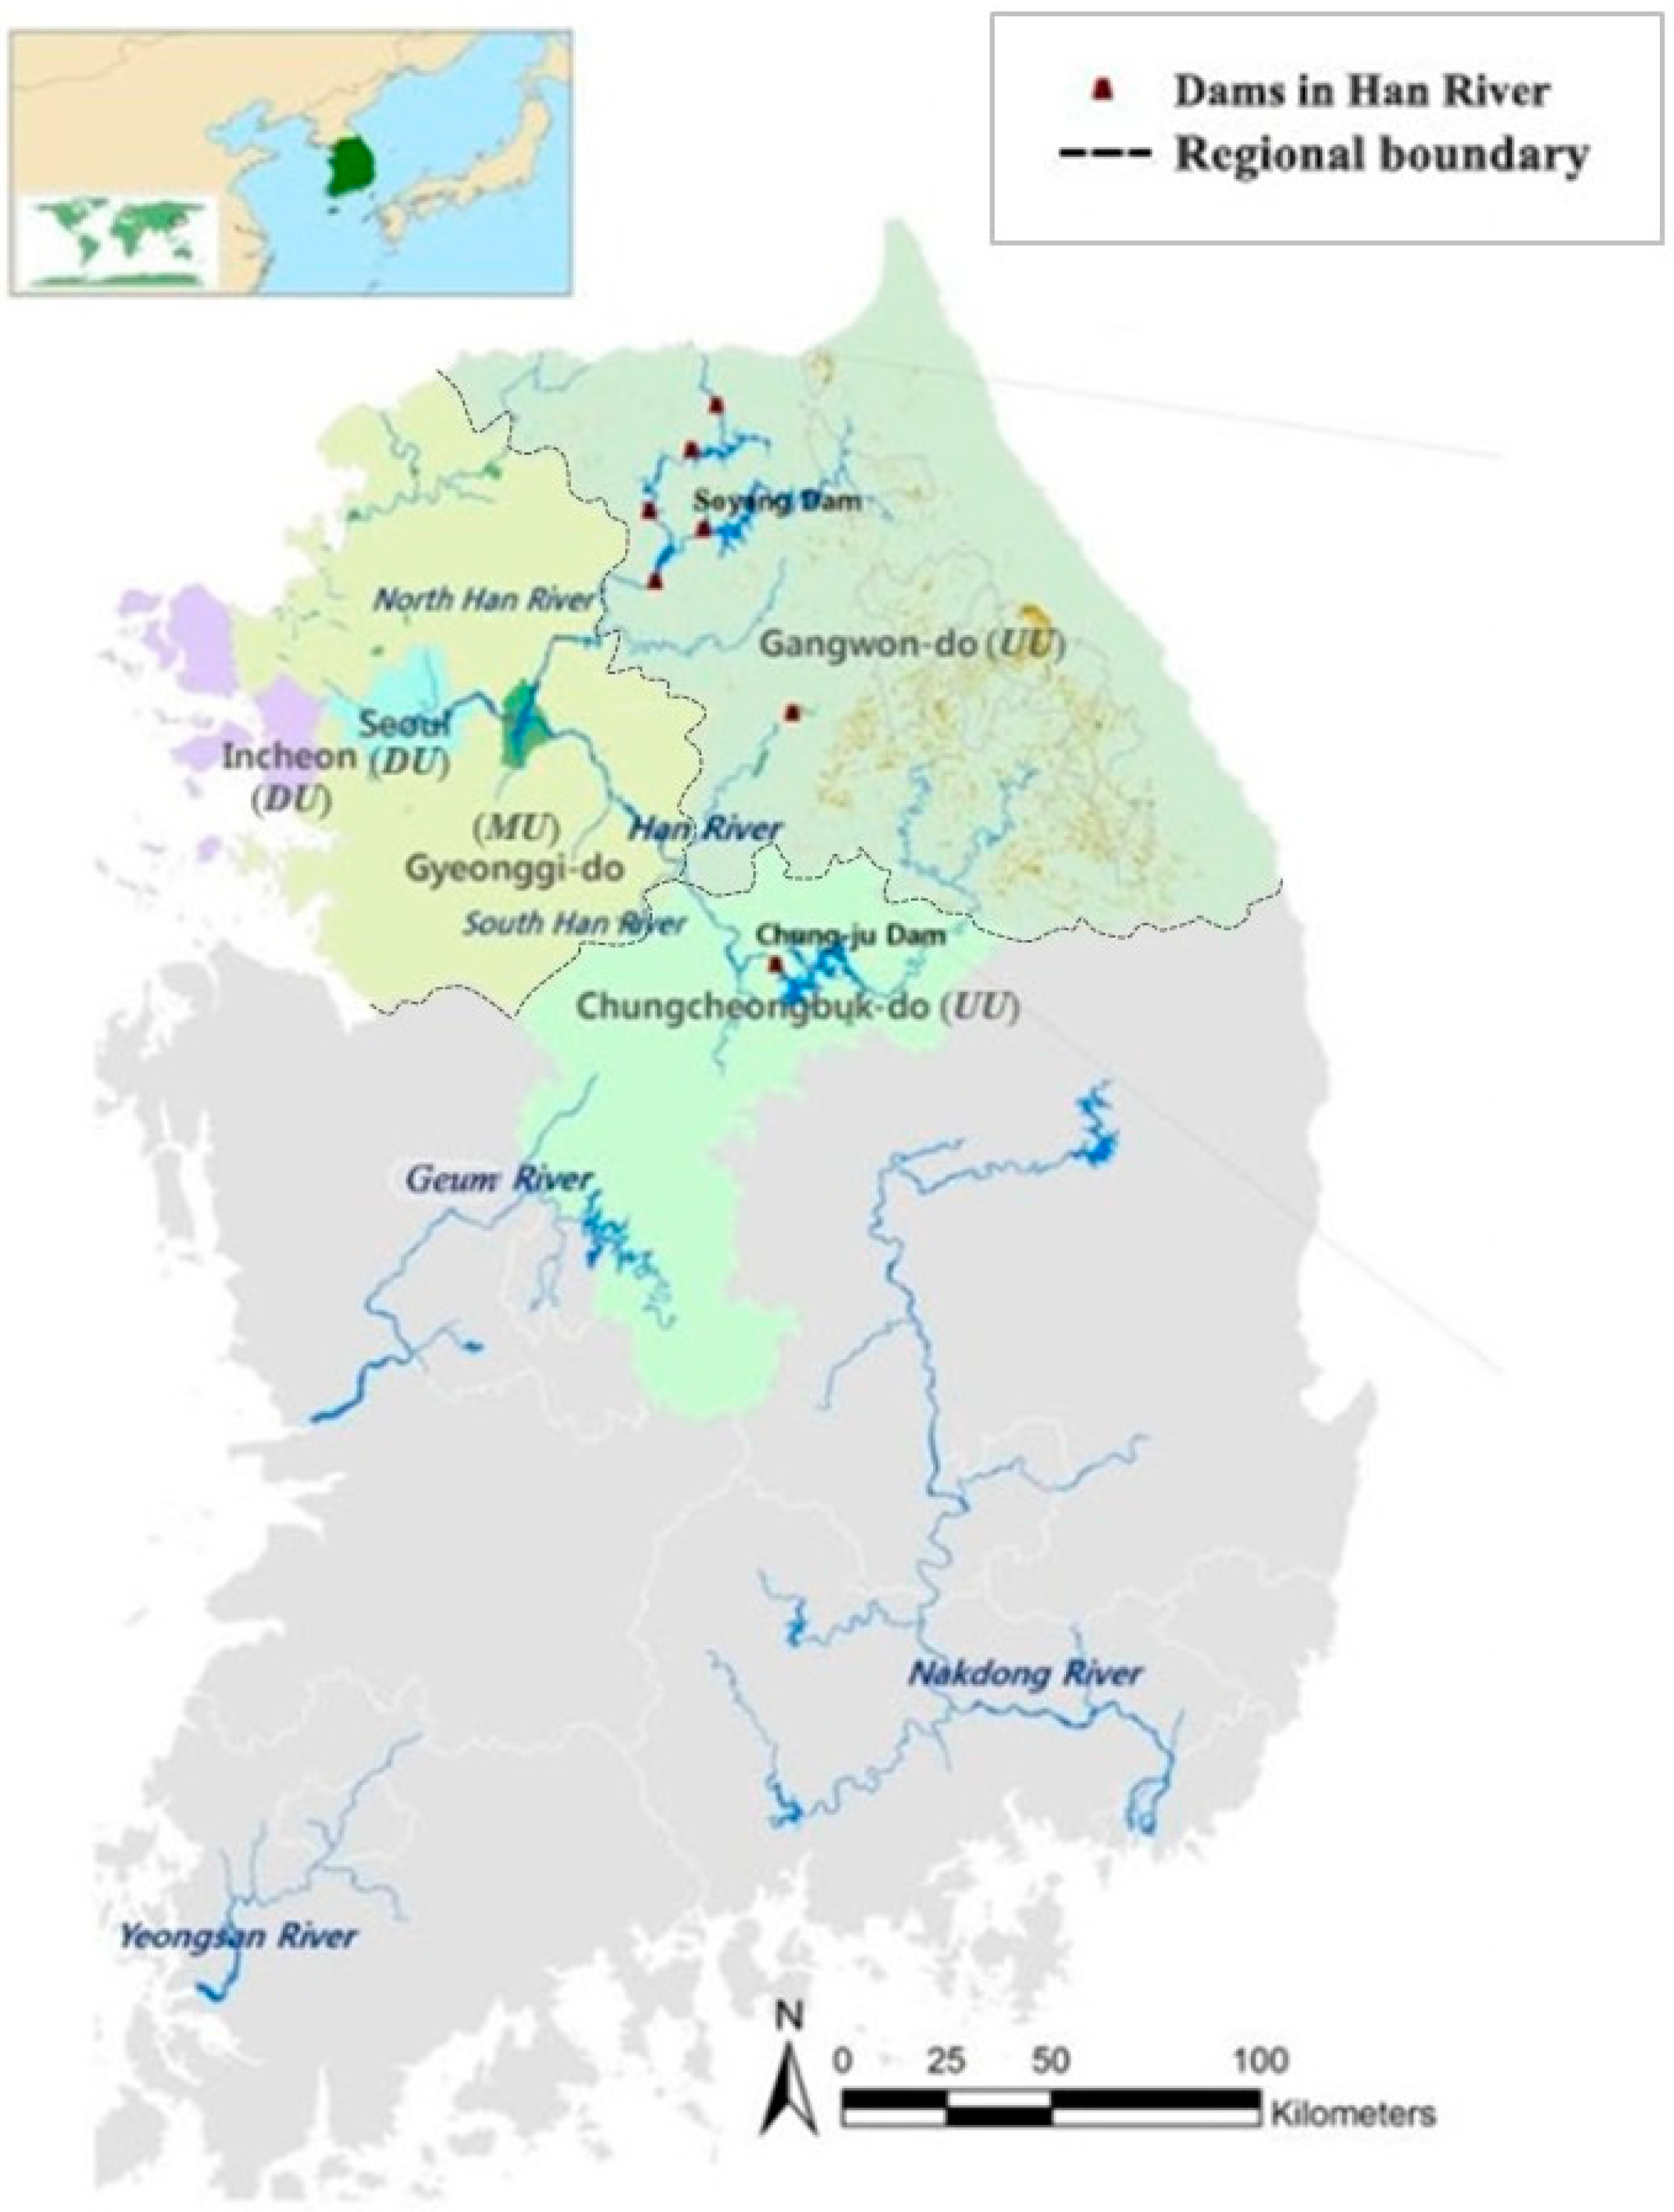
2). The Bukhan River is a tributary of the Han River that traverses Gangwon_do and Gyeonggi_do in South Korea. Its headwaters lie in North Korea and enter Hwacheon_gun, Gangwon_do running south through Chunchoen_si, Gangwon_do and then west through Gapyung_gun, Gyeonggi_do. In Yangpyeong_gun, Gyeonggi_do, it joins with the Namhan River along Gangwon_do, Chungcheongbuk_do, and Gyeonggi_do to build the Han River which passes through Seoul and Incheon and flows into the Yellow sea. Thus, the stakeholders along the Han River by geographical locations include some areas of Gangwon_do and Chungcheongbuk_do (UU), Gyeonggi_do (MU), and Seoul and Incheon (DU). A map showing the course of the Han River and stakeholders by geographical locations is presented in Figure 1. According to the Water Information System provided by the Ministry of Environment in South Korea [2], the historical measure of the water quality in the Han River Basin has exhibited Biochemical Oxygen Demand (BOD) levels between below 1 and below 5 depending on the geographical locations along the river.
The Han River is used not only as a major drinking water source but also for recreational activities and aesthetic amenities yielding positive externalities for the stakeholders. As South Korea carried forward its industrialization during the 1970s, however, multi-purpose dams were constructed in the upstream areas of the Han River to develop water resources and to provide water and electrical energy to the mid- and downstream regions of the Han River, which has led to many controversies and disputes [3]. The Soyang Dam in the upstream regions of the Han River, located 10 km northeast of Chuncheon_si, Gangwon_do is an example of the case above. Since its establishment in 1973, its nearby areas have been designated as protected areas to stabilize water conditions in terms of water quantity and quality [4]. This restriction has resulted in unfair economic growth from the use of water resources among stakeholders along the Han River. There are five regulations ((1) Water Supply and Waterworks Installation Act for protected areas of tap water source; (2) National Land Planning and Utilization Act for nature conservation zones; (3) Act on the Improvement of Water Quality and Support for Residents of the Han River Basin for waterside zones; (4) Forest Protection Act for watershed conservation zones; and (5) Water Quality and Aquatic Ecosystem Conservation Act for designation of zones for application of allowance standards of wastewater emission; while the first four regulations apply to 521.9 km2 that covers only 3.1% of Gangwon_do, the last covers 73.0% of it, which means 76.1% of Gangwon_do is regulated by several acts related to water management for DU and MU) maintained on water management associated with economic activities along the Han River in upstream areas. Especially, while MU and DU have gained many tangible and intangible benefits from the Han River, UU have lost their opportunities to achieve economic growth as well as to enjoy recreational activities in the Bukhan River and the Namhan River.
Since the Han-River Act enacted in 1999 in South Korea, MU and DU have paid water use charges based on Beneficiary Pays Principle to support residents living in the restricted areas and to cover the costs required to stabilize the water quantity and quality in the upstream regions of the Han River Basin. For example, MU and DU have paid about KRW 80–170/269.013 gallon for water use and about KRW 5,187.6 billion (about US $5,187.6 million at a exchange rate of US $1 = KRW 1,000 won) for the 15 years from 1999 to 2014 [5]. Recently, MU and DU, however, refused to pay water use charges, arguing that there are several problems associated with the water use charge system. One of the issues they have emphasized is that they have paid more costs than benefits received from the use of the Han River.
Several previous studies have examined the water management issues in the Han River Basin but these studies have been implemented only including some of the stakeholders, which has led to many controversies and disputes among stakeholders in terms of the assessment of benefits provided by the Han River. Thus, one stakeholder does not accept the other’s results grounded on their non-objectivity and irrationality. What is needed most to settle down these on-going debates among stakeholders would be to perform the economic analysis that explores more reasonable evaluation of benefits that all relevant stakeholders could reach some agreement on.
Consequently, the purpose of this study is to provide more convincing evidence with respect to the assessment of benefits provided by the Han River and to compare these benefits to costs, applying scientific methods with which all stakeholders should be satisfied. This study applies a meta-analysis approach which provides a technique that can contribute to the solutions with objective validity. We employed a meta-regression analysis which can bring all relevant study results and information together that have been gathered on UU, MU, and DU. Although a meta-regression analysis has been mainly used as a method for transferring the benefit from the existing sites (study site) to new sites (policy site), this method is also applicable to our study since the objective of our study is to present credible evidence all relevant stakeholders can agree with based on involving not only all previous studies independently conducted along the Han River Basin but also other similar studies related to water management in South Korea. The number of benefit transfer case studies using a meta-regression analysis has been conducted in other countries ([6,7,8,9,10,11,12] among many others) but has not been used in South Korea. To the best of our knowledge, this study may be the first attempt to apply meta-analysis to strive for more efficient allocation of benefits when the economic problems associated with water resource use between stakeholders exist.
Using the coefficients estimated by meta-regression models, we derived the total benefits arising from the use of the Han River and estimated possible benefit transfers between stakeholders along the Han River Basin. The results of this study would provide an economic indicator useful in determining the rationality of fair distribution of benefits from the use of environmental resources, which would be helpful for those who are interested in conducting a similar study.
This paper is organized as follows. The next section describes the methods that include concept of benefit transfer and empirical specification of meta-regression analysis. This is followed by the data employed in the analysis. The empirical results are then presented and discussed followed by a section that outlines benefit derivations. This article closes with a brief conclusion.

2. Method

2.1. Benefit Transfer and Meta-Regression Analysis

The economic benefits of water resources or water management policy can be evaluated via many types of non-market valuation methods such as contingent valuation method (CVM), hedonic property methods, discrete choice methods, choice experiment, etc. [13,14,15]. However, implementing such an independent primary research often requires a great deal of time and money to assess the expected benefits provided by environmental resources. In addition, despite the fact that the economic values estimated by the original research are generally favored, the use of primary research is in some cases precluded for benefit–cost analysis due to time, budget, or other restrictions [8,16].
Benefit transfer has been regarded as an alternative method when it is unfeasible to conduct the original research due to constraints on time, budget, or data availability [11,17,18]. In other words, benefit transfer refers to the application of research results from pre-existing studies to predict benefits or other economic information for a similar location [19,20]. When such constraints are omnipresent, benefit transfer approach would be the only option feasible to provide practical estimates for the particular issue of research, mostly for the benefit–cost analysis [16].
Since the Water Framework Directive in the European Union has recognized the importance of benefit–cost comparison for the river basin management regardless of the size of the water bodies, the literature has increasingly utilized benefit transfer approaches [21,22]. Some examples using benefit transfer for applied benefit–cost analysis include Bateman et al. [23], Brisson and Pearce [24], Brouwer [25], Ruijrok [26], Smith et al. [20], Griffiths and Wheeler [7], Iovanna and Griffiths [8], McComb et al. [9], and Columbo and Hanley [6].
Meta-regression analysis (MRA) attempts to estimate the impact of quantifiable factors on benefits via regression analysis. In MRA, the dependent variable is represented by a valued benefit measured as consumer surplus (CS) or willingness to pay (WTP) obtained from the previous studies or from the related literatures. The independent variables include characteristics of sample population, methodology applied, and factors related to specific sites. The majority of variables are in general coded as a dummy variable (0 or 1). The appeal of the MRA is its ability to extract the apparent influences on the desired benefit that occur due to particular factors, the estimation methods applied, the study design, and data characteristics, even to statistically identify differences in individual study results due to the differences in summarized statistics.
As discussed by Shrestha and Loomis [12] benefit transfer based on meta-regression analysis has some advantages which are: (1) it can provide more robust measures of central tendency susceptible to the intrinsic distribution of study values; (2) the alternative methodology can be utilized when forecasting the values from the meta-regression model; and (3) the differences between the actual study site and the new policy site can be controlled for by adjusting the level of explanatory variables peculiar to the new site.
Data for the MRA has a similar structure to panel data. If a number of observations extracted by individual studies are different (e.g., number of value estimates in our case), it is similar to unbalanced panel structure. The panel nature of the data can be controlled for by employing either a fixed effect model (FEM) or a random effect model (REM), which are the common models used in panel data analysis. Assuming variation shared by observations in the same study to reflect their structural differences, the FEM includes dummy variables for each individual study which may have a limit in actual applications because the degrees of freedom may be significantly decreased in comparison to the case with a number of individual studies. On the other hand, individual studies are regarded to be randomly sampled from a mother distribution of observations in REM [18]. That is, it can be assumed that variation between observations in the same study could be a stochastic variable in the REM. The error terms in the REM are expressed by the sum of an error related to individual observations and an error related to specific studies. Compared to FEM, REM would not cause problems such as loss in the degrees of freedom. From the theoretical point of view, thus, REM appears to be more appropriate for empirical analyses than FEM.
To choose the appropriate model between FEM and REM, we performed a Hausman test where the null hypothesis is that the preferred model is REM which is based on generalized least squares estimation and the alternative one is FEM which is estimated by ordinary least squares (OLS). The test results indicate that the null hypothesis cannot be rejected implying the REM is preferred to FEM ( χ 2 (5) = 7.39, p-value = 0.286)). Given the selection of REM, we then conducted Breusch and Pagan Lagrangian Multiplier (LM) test for the presence of random effects (i.e., the presence of variation between observations in the same study). The null hypothesis of this LM test is that variances across individual studies are zero while they are not in the alternative hypothesis. If the null hypothesis is rejected, the REM is statistically better than a classical OLS regression model. As a result of LM test, the null hypothesis is rejected in favor of a REM ( χ 2 (1) = 7.09, p-value = 0.008)). Based on these statistical tests for the panel effects, we estimated the following meta-regression model.
l n w t p i j = α + β x i j + μ i + ε i j
where l n w t p i j is the log transformation of willingness to pay for i from the study j (in this case, willingness to pay per month per household), x i j is a vector of independent variables including methodology, site, and socio-economic variables. α is constant and β are the vector of parameters to be estimated. μ i is an error related to specific studies with mean zero and variance σ u 2 and ε i j represents an error related to individual observations with mean zero and variance σ ε 2 .

2.2. Evaluating the Validity of Meta-Regression Model

Following Shrestha and Loomis [12], we performed some statistical tests to evaluate the validity of our meta-regression model. First, we compared predicted WTP values to the original WTP values and verified whether these two values are statistically the same using paired t-tests. The null and alternative hypothesis for this test is specified as follows.
H 0 :   W T P i p v W T P i o v = 0   H 1 :   W T P i p v W T P i o v 0
where in Equation (2) W T P i p v is the predicted WTP values from meta-regression model for i observation and W T P i o v is the original WTP values from the original studies.
Whether to accept H 0 or not will be determined by the statistical significance of a paired t-test. The null hypothesis will be accepted if a paired t-test is statistically significant implying two WTP values appear to be convergent, which demonstrates the validity of our meta-regression model for benefit transfer. The testable hypotheses used in this study can be re-expressed in Equation (3)
H 0 :   μ D = 0    H 1 :   μ D 0
where μ D is the mean of the difference between W T P i p v and W T P i o v .
The t-statistic used for hypothesis testing in Equation (3) is calculated as follows.
t = ( D ¯ μ D ) S D / n p 1   with d.f. = n p 1
where in Equation (4) D is the difference between each pair of W T P p v and W T P o v , D ¯ is the mean of the sample difference scores, n p is the number of matched pairs of scores in the sample, and S D is the sample standard deviation of the difference scores. The validity of predicted values from the meta-regression model will be supported if the null hypothesis in Equation (3) is not rejected (i.e., t-value is statistically insignificant).
Second, we also conducted correlation analysis to test the statistical significance of the relationship between predicted WTP values and original WTP values, which can be regarded as another way to assess their statistical similarity [12]. The correlation coefficient analysis we employed is based on Pearson’s correlation coefficient which provides the relationship in terms of direction and degree of correlation between these two values. For this analysis, the following hypothesis testing is formulated.
H 0 :   γ = 0   H 1 :   γ 0
where γ represents Pearson’s correlation coefficient between W T P p v and W T P o v . If H 0 is rejected it means that statistically significant relationship between W T P p v and W T P o v exists, which similar to a paired t-test case advocates reliability of a meta-regression model for benefit transfer. With respect to the direction of two values the positive (negative) γ indicates as the original studies produce high (low) WTP values, high (low) predicted WTP values are estimated by the meta-regression model.

3. Data

The data used for this study are based on a search of the previous studies which measured the WTPs with respect to water management in South Korea. As mentioned above, since the Han River has been used as a primary source for drinking water as well as for recreational activities and aesthetic amenities for the stakeholders, this study aims to estimate total economic value which includes direct and indirect use value provided by the Han River. Included are, therefore, all previous studies in the meta-regression analysis which estimated economic values for consumptive use and/or non-consumptive use of water resources in South Korea. Of thirty studies, twelve studies evaluated the WTPs for change in water quality grades presented in Table 1 while eighteen studies estimated the WTPs for water quality improvement (see Table A1). Of twelve studies, eleven studies measured the economic impact of improvement in water quality grades starting with Grade 2 or 3 and ending with Grade 1 or 2. In other words, most of the studies evaluated the economic values for the maintenance of water quality beyond Grade 2, which implies to some extent the alignment between the prior studies and the current study. The relationship between water quality grade and scientific characteristics and the definition of each grade is displayed in Table 1. We found 30 relevant studies which reported 55 value estimates in total. The number of WTP estimates per study ranged from 1 to 8. The list of original study used in meta-regression analysis is presented in Table A1 in the Appendix A (We also provide in Table A1 the quantitative information for each study such as valuation technique employed, water user surveyed, survey mode used, change in water quality grade measured, and economic value evaluated).
The database in these previous studies included the information such as study area, methodology used, survey mode applied, sample size collected, and the mean of respondents’ characteristics. Table 2 presents the definition of the variables used in our meta-regression model (Following Shrestha and Loomis [12], we first estimated a fully specified meta-regression model including dummy variables for study area (whether study area was based on river, lake, dam, wetland, or tap water) but these variables are removed from our optimized model taking their statistical significance and theoretical point of view for benefit transfer into consideration). The WTP values from all studies were adjusted to constant 2010 Korean currency (KRW) by applying a Consumer Price Index (CPI) provided by Statistics Korea [27] to account for inflationary effects. For independent variables, ten variables are included in the optimized meta-regression model of which five variables are socio-economic variables (edu, age, gender, fano, and income). In Table 2, han, ftf, and cvmoe variables are qualitative dummy variables coded as 0 or 1, where 1 means the study has its characteristic and 0 otherwise. Trend variable reflects any systematic changes in WTP values that are not accounted for and is included in order to capture indirect effects of time on WTP values.

4. Results

4.1. Meta-Regression Results

Table 3 shows the results of optimized random effects meta-regression model presented in Equation (1). For benefit transfer analysis, we only include the explanatory variables which are important factors in terms of statistical and/or economic significance to have an influence on WTP values based on meta-analysis literatures in the optimized model. The meta-regression model does a reasonable job of explaining variation in WTP values (R2 = 0.68). Except for a few variables, most of the parameters are statistically significant at 10% level and their signs are consistent with the results of previous benefit transfer literature. The estimated coefficient for the dummy variable on han is positive in sign and statistically significant implying the studies aimed at the Han River Basin produce higher WTP values than other studies. The variable cvmoe is negative and significant, indicating the CVM studies using OE elicitation technique yield relatively lower estimates of WTP than other studies. This is consistent with the findings by Shrestha and Loomis [12]. In terms of socio-economic variables, all variables are statistically significant meaning that these variables have influences on WTP values. For instance, the variables edu, age, and fano are positively related to the WTP values while gender and income have a negative effect on WTP values. Of these socio-economic variables, the coefficients of edu and age variables are large enough to play an economically significant role on deriving WTP values.
The sign of income variable is not of the expected sign (i.e., the sign of this variable was expected to be positive suggesting the higher households’ income the more WTP values but it is negative) and this deserves some discussion in more detail. The negative impact of income on WTP values seems to give a counter-intuitive result but this result can be reinterpreted as low and middle income households would be willing to pay more for the improvement of water quality than high income households. In other words, low and middle income households are more sensitive to the water quality conditions. For example, if the water quality is improved, low and middle income households can reduce the costs to purify the water for drinking as well as moving costs to enjoy recreational activities in other areas. On the other hand, the high income households can be less affected by the change in water quality conditions since they are relatively more affordable to find substitutes than low and middle income households. Similar cases were also found by Stevens et al. [28] and Shin [29]. Stevens et al. [28] found the negative sign of log of income in both dichotomous and open-ended tobit models in measuring the existence value of wildlife using CVM. They argued that most of those who would pay exhibited behavior that appears inconsistent with the neoclassical theory underlying the CVM [28] (p. 399). Shin [29] also found the negative impact of income on identifying preservation values of environmental resources implying option value as indirect use in transacting activities for possible future use of wilderness resources seems to be more important to low and middle income people. In this study, the estimated coefficient of the income variable is both statistically and economically significant on the outcome.

4.2. Results of t-Tests and Correlation Tests

The results of meta-regression model presented in Table 3 were used to calculate the predicted WTP values and these values were compared against the original values to evaluate the validity of the meta-regression model. The mean values of the meta-model predicted WTP and original WTP are presented in the first row in Table 4. The average values of predicted and original WTP are very similar. The mean percentage difference between predicted WTP and original WTP values in the second row in Table 4 is only 0.64, which implies a relatively small error of our prediction. The insignificant t-statistics of the paired t-test in the third row in Table 4 indicates the meta-predicted WTP values and original WTP values are not statistically different. This is further confirmed by Pearson’s correlation coefficient shown in the fourth row in Table 4. The result of Pearson’s correlation test indicated that there were positive and significant correlations between the predicted WTP and original WTP values. Therefore, our meta-regression model is inclinable to predict high WTP values when original WTP values are higher and vice versa. Based on both paired t-test and correlation analysis, we are fairly confident that our meta-regression model is suitable for benefit transfer application.

5. Benefit Calculations

Using the coefficients in Table 3, we derived the benefits arising from the use of the Han River. In benefit calculations, we used the coefficients of all variables presented in Table 3 because while some of the variables are not statistically significant they are economically significant. This case is likely to be attributed to the small sample sizes as is in our case [30]. Readers can also refer to Rosenberger and Loomis [11] and Shrestha and Loomis [12] for the similar application. To calculate those benefits, we applied adjusted values of the variables. For example, we employed average values of the Korea Socio-Economic Index in 2010 provided by Statistics Korea [27] for socio-economic variables. For ssize and trend variables, since these variables were included in the model estimation to account for study specific effects and time effects they are not directly pertinent to benefit estimation provided by the Han River [11,12]. Thus, we set the value of those variables at their mean used in the meta-regression model. For ftf and cvmoe variables, these two variables are used as the methodology for the elicitation of WTP values in the stated preference method which has the potential to exhibit hypothetical bias [31]. This can result in overestimating or underestimating the true WTP values. To eliminate the hypothetical bias in benefit estimation, we set the value of these two variables equal to zero for the revealed preference (RP) measure and one for the stated preference (SP) measure. The comparison between RP and SP measure may provide useful information to the benefit transfer literature on the issue of hypothetical bias.
Table 5 shows the result of benefits estimated from the use of water resource along the Han River. The benefits are extrapolated to be KRW 7,728 (about US $7.7) per household per month on the basis of RP case while they are estimated to be KRW 4,348 (about US $4.3) based on SP case. The estimated benefits in the case of RP measure are about 1.8 times higher than those in SP case, which means if the natural environment (river) is in actual use, e.g., economic gains such as water related recreation activities in rivers, views of clean water to attract tourists, reliability in the supply of drinking water occurred, then the level of water conditions would play a very significant role in water-related decision making. In RP case, more positive relationship between WTPs and betterment of water conditions should be recognized since the respondents’ WTPs are closely related to their actual use of water resources. Therefore, the estimated benefits based on RP case would be more reasonable than those in SP case.
Benefit calculations presented in Table 5 resulted in one estimated value that applies to all stakeholders in the river basin. However, benefits provided by water resources along the river basin could vary by regions depending on its regional characteristics and purpose of usage. Therefore, we applied different value of locational characteristics (e.g., mean value of education, age, gender, family number, and income) to produce different benefit values by each region (The gross regional national income (GRNI) per capita provided by Statistics Korea in 2010 is US $34,374, $24,918, $22,582, $18,619, and $22,285 in Seoul, Gyeonggi_do, Incheon, Gangwon_do, and Chungcheongbuk_do, respectively). The results applying RP case are presented in Table 6, which is used for the benefit–cost comparison presented in the next section. To measure total benefits, we applied total number of households by each region in 2010 provided by Statistics Korea. The sum of total benefits from water use along the Han River is estimated to be about KRW 70.1 billion (about US $70.1 million) per month.

5.1. Comparison of Total Benefit and Total Water Use Charge

We then compared these benefits to the water use charges that each region paid in 2010. The results are presented in Table 7. In Table 7, total cost is the water use charges that each region paid in 2010 [5]. The comparison of benefits to costs shows that there are relatively large differences in terms of extra benefits between regions (i.e., last column of Table 7). The largest net benefits account for about 55% of the total net benefits and are assigned to Gyeonggi_do. Seoul which paid the most water use charges makes up about 20% of total net benefits. Chungcheongbuk_do and Gangwon_do take up third place (16%) and forth place (5%), respectively. Incheon makes up the least proportion (4%) of total net benefits.

5.2. Redistribution of Net Benefits

As mentioned, since South Korea has accelerated its industrialization, the government undertook the multi-purpose dam construction projects to develop the water resources. As a result, many dams were constructed in upstream regions of the Han River Basin to secure stable water supply, manage floods and droughts, and improve water quality. In addition, as the demand for water use by downstream regions of the Han River Basin increases, five regulations associated with water management along the Han River Basin were enacted in upstream areas. Since the establishment of dams and regulations, however, upstream water users including Gangwon_do and Chungcheongbuk_do have had little net benefits from the Han River due to the opportunity costs of forgone economic development.
According to the WCD [1] based on Agenda 21, benefits from water resource use should be equally distributed among all stakeholders. Thus, not only all stakeholders with various disadvantages including water resource related regulation should be included in benefit distribution, but also the stakeholder with the more net benefits from water use should return their extra net benefits to the other stakeholders who received fewer net benefits.
Following the WCD [1], we calculated adjusted benefits for each region by applying equal distribution of total net benefits (See Table 8). The total net benefits that the Han River has provided to all stakeholders along the river basin are about KRW 449 billion (US $449 million) per year. This implies these benefits should be equally distributed to the all stakeholders, which results in allocating about KRW 89.8 billion (US $89.8 million) per each region per year. In Table 8, Gyeonggi_do is the only area which has gained more net benefits than adjusted net benefits while other areas have less, which means they have been losing their benefits (opportunity costs). Therefore, Gyeonggi_do should return their extra net benefits to the other four communities through a policy tool such as tradable development rights. Consequently, Gyeonggi_do should pay about KRW 71.5 billion (US $71.5 million) to Incheon, about KRW 69.2 billion (US $69.2 million) to Gangwon_do, about KRW 15.9 billion (US $15.9 million) to Chugcheongbuk_do, and about KRW 1.6 billion (US $1.6 million) to Seoul.

5.3. Recalculation of Net Benefit Transfer Assuming Water Management Regulations Implemented in Mid- and Downstream Areas

The economic activities using water resource in upstream areas along the Han River Basin would be restricted to some extent due to the regulations implemented in order to stabilize the condition of water quality and quantity in downstream areas. This can lead to unfair economic development between upstream and mid- and downstream areas. To verify difference in economic growth between two areas, we compare households’ average incomes in mid- and downstream areas with those in upstream areas. Compared to upstream areas which include Gangwon_do and Chungcheongbuk_do, household’s average annual income in Seoul, Gyeonggi_do, and Incheon is about 25%, 21.5%, and 4.8% higher, respectively (Readers may wonder why the difference in household’s income is relatively small in Incheon: this is probably due to the fact that the historical development of economic policy implemented by the Korean government has mainly focused on Seoul and Gyeonggi_do areas). This potentially illustrates imbalanced economic development using water resources between administrative areas along the Han River Basin.
To measure monetary amounts of net benefit transfer between stakeholders, we recalculate benefit transfer for hypothetical situation assuming the economic activity using water resource is regulated in mid- and downstream areas as is in upstream areas. In other words, the households’ income in mid- and downstream areas could be reduced due to the degradation of economic development because of regulations associated with water use. For the hypothetical situation, we assume that the difference in households’ income is entirely attributed to the use of water resources. Therefore, we consider reduction of households’ income in mid- and downstream areas by difference in income compared to upstream areas while holding income levels in upstream areas unchanged.
The results are presented in Table 9. When considering 25%, 21.5%, and 4.8% decrease in households’ income in Seoul, Gyeonggi_do, and Incheon, respectively, the total net benefits are estimated to be KRW 830 billion (US $830 million) per year, which results in KRW 166 billion (US $166 million) of adjusted net benefits for each region. In this case, not only Gyeonggi_do but also Seoul should return their extra net benefits to the other three communities.

6. Summary and Conclusions

The benefit transfer approach has been used as a valid technique for the non-market valuation of environmental resources when there is a limitation to gather the information about a new policy site where resources are being valued due to time or budget constraints. This paper applied the logic of benefit transfer approach to the Han River case in South Korea where controversies and disputes associated with water resource use among stakeholders exist.
With the total of 55 observations from 30 studies, we estimated random effects meta-regression model including methodology, site, and socio-economic variables. We then tested the convergent validity of our meta-regression models as benefit transfer tool using paired t-test and correlation analysis. From the paired t-test of means of meta-predicted WTP values and means of original WTP values, it is identified that these two values are not statistically different. Based on the correlation analysis, we found there were positive and significant correlations between these two values. Thus, both paired t-test and correlation analysis revealed that in general, our meta-regression model is suitable for a benefit transfer application.
Using the coefficients obtained from the meta-regression model, we computed the potential benefits from the use of the Han River, adjusting the value of regression variables. We derived the total benefits by applying total number of households by each region and then suggested a justifiable framework for redistribution of net benefits based on the principle with respect to the equal distribution of the water resource use. The main study results are as follows. The benefits from the use of water resource along the Han River are estimated to be KRW 7,728 (US $7.7) per household per month. The total net benefits are estimated to be about KRW 449 billion (US $449 million) per year. Of total net benefits, more than 75% are assigned to Gyeonggi_do and Seoul. Based on the equity principle of benefit distribution, however, extra net benefits in Gyeonggi_do beyond adjusted benefits should be reallocated to other stakeholders who received fewer net benefits.
In the case of 100% achievement of benefit transfer, management costs for water quality and quantity of the Han River should be paid by the polluter’s pay principle. Otherwise, its costs should be determined according to agreements between stakeholders based on the fairly shared principle of cost, and independently of amounts of transferred benefits. The estimates for transferred benefits are not the exact amounts of money that stakeholders should pay and be paid, but the size of benefits could be a plausible value for negotiation. Thus, our estimates should be used as scientific and economic indicators related to equal benefit distribution between stakeholders along the river. An economic incentive such as tradable (transferable) development rights could be applied to obtain the economic justice of benefit transfer. Such policy suggestions are based on results from independent studies by many stakeholders, which implies they would have rational and objective validity. The study results, therefore, might contribute to the abatement of serious disputes which have occurred along all river basins in Korea as well as to achieving sustainable development.
Since property rights are a function of economic yields [32] (p. 16), the use of water and its maintenance substantially depend on the definition of water resources in terms of property rights. Thus, insecurity of water rights and their unequal distribution are frequent sources of conflicts [33]. The water resource in other countries, for example in Australia, is owned by the state and the regulatory decisions are determined by the committees consisting of state representatives and its users [34] (p. 23). In South Korea, however, stream waters are legally owned by the government, but the regulatory decisions are made by committees only including some of the stakeholder groups. This has led to significant gap in economic development between the upstream areas where the economic activities using water resources are restricted and others where they are not, as well as serious conflicts between upstream communities and their people and others.
Therefore, recommended would be to introduce the balanced sheet approach and the benefit sharing approach, which would be a basis for establishing the water governance. In order to apply the former approach, not only the costs to affected groups need to be minimized but also an equitable share of benefits should be ensured [1] (p. 126). The latter approach requires progressive national legislation and policies to provide the legal framework and to standardize the benefit sharing [1] (p. 127). It may include economic incentives for the regulations associated with the water quality stabilization in terms of forgone opportunity costs of economic development such as tradable (transferable) development rights which can be considered as to be common property if the institutional system for allocation and transfer is introduced by a stakeholder group committee [35] (pp. 66–67). This might be a preponderant way-out as well as the water governance to resolve a long and bitter feud between the government and the upstream communities and their people, and between upstream communities and their people and others. We note that two approaches suggested above could be used as a valid policy instrument to mediate the conflicts and disputes associated with water resource use between countries, states, or stakeholder groups depending on the relevance of policy application.
Overall, given relatively thin database on non-market valuation studies, this analysis should be updated in the future to improve the reliability of meta-regression analysis and benefit transfer when more databases on non-market valuation studies associated with water management in Korea are constructed.

Acknowledgments

This study was supported by the 2011 Research Grant from Kangwon National University, Korea Republic and the TERRECO program of University of Bayreuth, Germany.

Author Contributions

Hio-Jung Shin conceived the study and supervised the process of manuscript development. Hyun No Kim analyzed the data, performed econometric analysis, and wrote main text. Chul-Hyun Jeon contributed to data analysis in pilot study and theoretical background. Min-Woo Jo collected and prepared data for empirical analysis. Trung Thanh Nguyen contributed to manuscript format and econometric application. John Tenhunen gave important input to logical flow in water use policy scheme and English correction.

Conflicts of Interest

The authors declare no conflict of interest.

Appendix A

Table A1. The list of original studies used in meta-regression analysis.
IdStudy AreaYearValuation Technique aSurvey Mode bWater User cWQ Grade dValue MeasuredNo. of Estimates
1Han River199701DirectG3→G2Total Value2
2Han River199701DirectG3→G2Total Value2
3Paldang Lake199701Directn/aDrinking1
4Geum River199801Directn/aTotal Value1
5Namdae River200111DirectG3→G1Total Value1
6Dong River200101Directn/aTotal Value5
7Ulsan Water-Supply200101DirectG3→G1Drinking1
8Paldang Lake200101DirectG3→G1Drinking1
9Upo Wetland200201Potentialn/aTotal Value2
10Seoul Water-Supply200201DirectG3→G1Drinking1
11Youngwol Dam200301Potentialn/aTotal Value1
12Mangyeong River200301DirectG5→G3Total Value1
13Soyang Lake200511DirectG2→G1Drinking2
14Soyang Dam200611Directn/aTotal Value1
15Wonju Water-Supply200601Directn/aDrinking2
16Seomjin River200611Directn/aTotal Value8
17Han River200601Directn/aTotal Value1
18Soyang Lake200611DirectG2→G1Drinking1
19Ulsan Water-Supply200601Directn/aDrinking1
20Taehwa River200701Directn/aTotal Value1
21Zillal Wetland20071,01Directn/aTotal Value2
22Seomjin River200711Directn/aTotal Value2
23Soyang Dam200710DirectG2→G1Total Value4
24Nakdong River200701DirectG2→G1Drinking2
25Bukhan River200810Directn/aTotal Value2
26Bukhan River200910Directn/aTotal Value4
27Namdae River201011Directn/aTotal Value1
28Busan Tap Water201101DirectG2→G1Drinking1
29Ulsan Tap Water201211Directn/aDrinking1
30Busan Water-Supply201401Directn/aDrinking2
Notes: a 1 for CVM and OE technique, 0 otherwise; b 1 for ftf, 0 otherwise; c survey respondents: direct user or potential user; d change in water quality grade: baseline grade to hypothetical grade, n/a: not available.

References

  1. World Commission on Dam. Dams and Development: A New Framework for Decision-Making; The Report of the World Commission on Dams; Earthscan: London, UK; Sterling, VA, USA, 2000. [Google Scholar]
  2. Water Information System. Ministry of Environment. Available online: http://water.nier.go.kr/front/waterEasy/information02.jsp (accessed on 1 October 2016).
  3. Nguyen, T.T.; Hoang, V.N.; Seo, B. Cost and environmental efficiency of rice farms in South Korea. Agric. Econ. 2012, 43, 369–378. [Google Scholar] [CrossRef]
  4. Nguyen, T.T.; Ruidisch, M.; Koellner, T.; Tenhunen, J. Synergies and trade-offs between nitrate leaching and net farm income: The case of nitrogen best management practices in South Korea. Agric. Ecosyst. Environ. 2014, 186, 160–169. [Google Scholar] [CrossRef]
  5. Han River Management Office. Available online: http://www.hanriver.or.kr/ (accessed on 3 January 2016).
  6. Columbo, S.; Hanley, N. How can we reduce the errors from benefits transfer? An investigation using the choice experiment method. Land Econ. 2008, 84, 128–147. [Google Scholar] [CrossRef]
  7. Griffiths, C.; Wheeler, W. Benefit–cost analysis of regulations affecting surface water quality in the United States. In Cost–Benefit Analysis and Water Resources Management; Edward Elgar: Cheltenham, UK, 2005. [Google Scholar]
  8. Iovanna, R.; Griffiths, C. Clean water, ecological benefits, and benefits transfer: A work in progress at the U.S. EPA. Ecol. Econ. 2006, 60, 473–482. [Google Scholar] [CrossRef]
  9. McComb, G.; Lantz, V.; Nash, K.; Rittmaster, R. International valuation databases: Overview, methods and operational issues. Ecol. Econ. 2006, 60, 461–472. [Google Scholar] [CrossRef]
  10. Muthke, T.; Holm-Mueller, K. National and international benefit transfer testing with a rigorous test procedure. Environ. Resour. Econ. 2004, 29, 323–336. [Google Scholar] [CrossRef]
  11. Rosenberger, R.S.; Loomis, J.B. Benefit Transfer of Outdoor Recreation Use Values: A Technical Document Supporting the Forest Service Strategic Plan (2000 Revisions); No. RMRS-GTR-72; U.S. Department of Agriculture, Forest Service: Washington, DC, USA, 2001. [Google Scholar]
  12. Shrestha, R.; Loomis, J. Testing a meta-analysis model for benefit transfer in international outdoor recreation. Ecol. Econ. 2001, 39, 67–83. [Google Scholar] [CrossRef]
  13. Kim, H.N. The Demonstration and Capture of an Ecosystem Service Value: Three Different Methodological Approaches. Ph.D. Thesis, University of Alberta, Edmonton, AB, Canada, January 2015. [Google Scholar]
  14. Kim, H.N.; Boxall, P.C.; Adamowicz, W.L. The demonstration and capture of the value of an ecosystem service: A quasi-experimental hedonic property analysis. Am. J. Agric. Econ. 2016, 98, 819–837. [Google Scholar] [CrossRef]
  15. Shin, H.-J.; Sung, M.; Kang, J.; Park, S; Jeon, C. Estimation of groundwater conservation values. J. Rural Dev. 2011, 34, 71–94. [Google Scholar]
  16. Johnston, R.J.; Rosenberger, R.S. Methods, trends and controversies in contemporary benefit transfer. J. Econ. Surv. 2010, 24, 479–510. [Google Scholar] [CrossRef]
  17. Boutwell, J.L.; Westra, J.V. Benefit transfer: A review of methodologies and challenges. Resources 2013, 2, 517–527. [Google Scholar] [CrossRef]
  18. Desvousges, W.H.; Johnson, F.R.; Banzhaf, H.S. Environmental Policy Analysis with Limited Information: Principles and Application of the Transfer Method; Edward Elgar: Cheltenham, UK, 1998. [Google Scholar]
  19. Johnston, R.J.; Rolfe, J.; Rosenberger, R.S.; Brouwer, R. Benefit Transfer of Environmental and Resource Values: A Guide for Researchers and Practitioners; Springer: Dordrecht, The Netherlands, 2015. [Google Scholar]
  20. Smith, V.K.; van Houtven, G.; Pattanayak, S.K. Benefit transfer via preference calibration: Prudential algebra for policy. Land Econ. 2002, 78, 132–152. [Google Scholar] [CrossRef]
  21. Hanley, N.; Wright, R.E.; Alvarez-Farizo, B. Estimating the economic value of improvements in river ecology using choice experiments: An application to the water framework directive. J. Environ. Manag. 2006, 78, 183–193. [Google Scholar] [CrossRef] [PubMed]
  22. Hanley, N.; Colombo, S.; Tinch, D.; Black, A; Aftab, A. Estimating the benefits of water quality improvements under the water framework directive: Are benefits transferable? Eur. Rev. Agric. Econ. 2006, 33, 391–413. [Google Scholar] [CrossRef]
  23. Bateman, I.J.; Brainard, J.S.; Lovett, A.A. Modeling Woodland Recreation Demand Using Geographical Information Systems: A Benefit Transfer Study; Global Environmental Change Working Paper 95-06; Center for Social and Economic Research on the Global Environment (CSERGE); University College London and University of East Anglia: Norwich, UK, 1995. [Google Scholar]
  24. Brisson, I.; Pearce, D. Benefit Transfer for Disamenity from Waste Disposal; Global Environmental Change Working Paper WM 95-06; Center for Social and Economic Research on the Global Environment (CSERGE); University College London and University of East Anglia: Norwich, UK, 1995. [Google Scholar]
  25. Brouwer, R. Environmental value transfers: State of the art and future prospects. Ecol. Econ. 2000, 32, 137–152. [Google Scholar] [CrossRef]
  26. Ruijrok, E. Transferring economic values on the basis of an ecological classification of nature. Ecol. Econ. 2001, 39, 399–408. [Google Scholar] [CrossRef]
  27. Statistics Korea. 2010 Socio-Economic Index. 2010. Available online: http://kosis.kr/ (accessed on 20 March 2016).
  28. Stevens, T.H.; Echeverria, J.; Glass, R.J.; Hager, T.; More, T.A. Measuring the existence value of wildlife: What do CVM estimates really show? Land Econ. 1991, 67, 390–400. [Google Scholar] [CrossRef]
  29. Shin, H. Identifying the Relationship Between Preservation Values of Environmental Resources. Ph.D. Thesis, Colorado State University, Fort Collins, CO, USA, 1994. [Google Scholar]
  30. Andrews, D.W.K. Power in econometric applications. Econometrica 1989, 57, 1059–1090. [Google Scholar] [CrossRef]
  31. Loomis, J.B. What’s know about the hypothetical bias in stated preference valuation studies? J. Econ. Surv. 2011, 25, 363–370. [Google Scholar] [CrossRef]
  32. Bromley, D.W. Economic Interests and Institutions: The Conceptual Foundations of Public Policy; Blackwell: New York, NY, USA, 1989. [Google Scholar]
  33. United Nations Development Programme (UNDP). Water Governance Facility. 2010. Available online: http://www.watergovernance.org/ (accessed on 1 October 2016). [Google Scholar]
  34. Challen, R. Institutions, Transaction Costs and Environmental Policy: Institutional Reform for Water Resources; Edward Elgar: Northampton, MA, USA, 2000. [Google Scholar]
  35. Stevenson, G.G. Common Property Economics: A General Theory and Land Use Applications; Cambridge University Press: Cambridge, UK, 1991. [Google Scholar]
Figure 1. The Han River Basin, study area.
Water 08 00492 g001
Table 1. Definition and relationship between water quality grade and scientific measures.
Water Quality GradeScientific Characteristics
GradeDefinitionBODCODDO
1The most clean waterBelow 1Below 1Above 7.5
(drinkable water after simple purification process)
2Clean water in generalBelow 3Below 3Above 5
(swimmable; drinkable after general purification process)
3For industrial useBelow 6Below 6Above 5
(drinkable after heavy purification process)
4Polluted waterBelow 8Below 8Above 2
(no fish; industrial use after heavy purification process)
5Industrial use after special purification processBelow 10Below 10Above 2
Source: Water Quality and Aquatic Ecosystem Conservation Act, Ministry of Environment, South Korea; Notes: BOD (Biochemical Oxygen Demand), COD (Chemical Oxygen Demand), DO (Dissolved Oxygen).
Table 2. Variable definitions and descriptive statistics of variables used in the meta-regression model.
VariableDescriptionMean (Std. Dev.)
ln(WTP)log of WTP per household per month (2010 KRW)10.13 (1.26)
han1 if study area belonged to the Han River basin, 0 otherwise (DV)0.35 (0.48)
ftf1 if survey mode was face-to face (ftf), 0 otherwise (DV)0.82 (0.39)
cvmoe1 if CVM and open ended (OE) technique was used, 0 otherwise (DV)0.51 (0.50)
ssizeNumber of sample size each study collected555.04 (440.33)
trendThe year when WTP was recorded (1997 = 1, 2014 = 18)9.33 (3.87)
eduThe mean of respondents’ education level each study reported (years)13.06 (1.24)
ageThe mean of respondents’ age each study reported (years)37.79 (3.58)
genderThe mean of respondents’ sex each study reported (0: female, 1: male)0.49 (0.07)
fanoThe mean of number of respondents’ family member3.22 (0.54)
incomeThe mean of respondents’ household annual income each study reported (2010 KRW in 1,000)32,480.25 (10,047.87)
Notes: DV denotes dummy variable. CVM and OE refer to contingent valuation method and open-ended elicitation, respectively.
Table 3. Optimized random effects meta-regression model.
VariableCoefficientStd. Err.Mean of Variables
lnWTP--10.13
constant−4.14583.7797
han1.1719 **0.48220.35
ftf0.52210.83720.82
cvmoe−1.0974 ***0.36470.51
ssize0.00040.0002555.04
trend0.04850.05329.33
edu0.6626 ***0.175313.06
age0.1574 ***0.042437.79
gender−5.3637 **2.53390.49
fano1.0599 ***0.36933.22
income−0.00006 **0.0000232,480.25
No. of observations55--
No. of study30--
R20.68--
Notes: **, ***: significant at 5% and 1% level, respectively.
Table 4. Mean, percent difference, paired t-test, and Pearson’s correlation coefficient of the meta-model predicted WTP (willingness to pay) vs. original WTP values.
CategoryPredicted WTPOriginal WTP
Mean10.1910.13
Percent difference of mean a0.64
Paired t-test (N)−0.675 (55)
Pearson’s correlation coefficient0.8228 *
Notes: a calculated as [(predicted WTP − original WTP)/predicted WTP] × 100; * γ significant at 1% level.
Table 5. The result of benefit calculations based on revealed preference and stated preference case.
VariableCoefficientRPSP
constant−4.145811
han1.171911
ftf0.522101
cvmoe−1.097401
ssize0.0004555.04555.04
trend0.04859.339.33
edu0.662611.611.6
age0.157437.937.9
gender−5.36370.500.50
fano1.05992.72.7
income (in 1,000)−0.0000642,509.242,509.2
Estimated benefits * 7,727.84,347.5
Note: * Benefits are in 2010 KRW/household/month.
Table 6. Total benefit calculations generated by the Han River by each region.
RegionBenefits per Household (Won/Month)No. of HouseholdTotal Benefit (mil. Won/Month)
Seoul6,234.63,504,29721,847.8
Gyeonggi_do9,116.13,831,13434,925.1
Incheon5,917.3918,8505,437.1
Gangwon_do13,309.7128,6671,712.5
Chungcheongbuk_do11,020.3558,7966,158.1
Total-8,941,74470,080.6
Notes: Note that Gangwon_do includes the number of households in Chuncheon_si, Hwacheon_gun, Inje_gun, and Yanggu_gun because the Han River is used only by these regions [5].
Table 7. Comparison of benefits and costs from the use of the Han River by each region based on RP measures.
RegionTotal Benefit (A) (mil. Won/Year)Total Cost (B) (mil. Won/Year)Net Benefit (A − B)
Seoul262,174174,01188,163
Gyeonggi_do419,101171,046248,055
Incheon65,24546,92218,323
Gangwon_do20,550020,550
Chungcheongbuk_do73,897073,897
Total840,967391,979448,988
Table 8. Equal distribution of net benefits and amount of benefit transfer.
RegionNet Benefit (mil. Won/Year)Adjusted Net Benefit a (mil. Won/Year)Benefit Transfer b (mil. Won/Year)
Seoul88,16389,7981,635
Gyeonggi_do248,05589,798−158,257
Incheon18,32389,79871,475
Gangwon_do20,55089,79869,248
Chungcheongbuk_do73,89789,79815,901
Total448,988448,9880
Notes: a calculated by total net benefits divided by 5; b calculated as net benefit minus adjusted net benefit for each region.
Table 9. Recalculation of net benefit transfer associated with decrease in households’ income in mid- and downstream areas.
RegionNet Benefit (mil. Won/year)Adjusted Net Benefit a (mil. Won/Year)Benefit Transfer b (mil. Won/Year)
Seoul363,413165,908−197,505
Gyeonggi_do299,662165,908−133,754
Incheon72,017165,90893,891
Gangwon_do20,550165,908145,358
Chungcheongbuk_do73,897165,90892,011
Total829,540829,5400
Notes: a calculated by total net benefits divided by 5; b calculated as net benefit minus adjusted net benefit for each region.

