Article

Soil Water Storage Changes within Deep Profiles under Introduced Shrubs during the Growing Season: Evidence from Semiarid Loess Plateau, China

1
College of Resources Science & Technology, Beijing Normal University, Beijing 100875, China
2
Department of Earth Sciences, Indiana University-Purdue University Indianapolis, Indianapolis, IN 46202, USA
*
Author to whom correspondence should be addressed.
Water 2016, 8(10), 475; https://doi.org/10.3390/w8100475
Submission received: 15 June 2016 / Revised: 13 September 2016 / Accepted: 17 October 2016 / Published: 22 October 2016

Abstract

:
Water stored deep in the soil profile is the primary bio-available reservoir for regional vegetation in the semiarid Loess Plateau of China. However, the planting of introduced shrubs over many years as part of the “Grain to Green Program (GGP)” has consistently lead to dried soil in areas with severe water scarcity. Knowledge of soil water storage (SWS) changes within deep profiles in water-deficient regions is critical for the sustainable development of vegetation restoration. Caragana korshinskii K. (CK) and Hippophae rhamnoides L. (HR) are widely planted in the Loess Plateau to control soil erosion. We selected these two shrubs for a study on variations in deep soil water (100–500 cm) and identified the main factors affecting deep soil water storage replenishment (SWSR) during their growing seasons. The results indicated that the mean SWS at 100–500 cm depth under HR was significantly higher than that under CK at both the beginning (352.74 mm for CK and 644.79 mm for HR) and end of the growing season (311.95 mm for CK and 529.05 mm for HR) (p < 0.01). In these ecosystems, SWS was only recharged below 340 cm under CK, which was due to vegetation characteristics. Under HR, however, soil water consumption exceeded recharge throughout the whole 100–500 cm profile. The SWSR at the 100–340 cm depth was mainly affected by sand content, which explained 28% of the variability of SWSR. At the 340–500 cm depth, the variability in SWSR was due to vegetation type. Therefore, expansion of the GGP should pay more attention to both soil water conditions and influencing factors, including appropriate vegetation selection and the altering of the microtopography.

1. Introduction

Semiarid regions collectively cover approximately 17.7% of the terrestrial land surface of the planet and support more than one billion people [1]. Semiarid regions frequently suffer from years of below-average rainfall and severe drought [2]. Soil water in semiarid areas plays an important role in ecological hydrological processes, including evapotranspiration, infiltration, runoff, and erosion [3,4]. Soil water shortages are becoming extremely severe due to global climate change and improper management of vegetation restoration in semiarid regions [5,6,7,8]. In addition, the population continues to increase. Ecological and environmental problems caused by the ever-increasing extent and intensity of anthropogenic activities have been and will continue to be the most perplexing challenges in the sustainability of water management [9,10].
Knowledge of the behavior of soil water storage (SWS) and its distribution provides important information on various general circulation models, evapotranspiration and runoff, precipitation and atmospheric variability [11,12]. A number of factors contribute to the variability in the distribution of SWS in space and time, and the scaling heterogeneity of factors makes the SWS variations highly scale-dependent [13,14,15]. For instance, how soil type, tree cover, and micro-landform influence SWS have been studied, and the results show that soil properties exert a stronger influence than vegetation on SWS dynamics and fluxes, at both the plot and catchment scale [16,17]. Other studies indicated that topography, parent material, climate and vegetation influenced the distribution of SWS within a field [15,18]. However, at large scales, such studies have proven to be very challenging due to many factors, such as human activities, geologic variability, and costly sampling [19,20]. Most studies on SWS at large scales did not systematically consider the changes in SWS (i.e., soil water storage replenishment) influenced by vegetation and environment, especially during the growing season.
The semiarid Loess Plateau of China is well-known for having the most severe soil erosion in the world [21]. Because of the low water-holding capacity and high evaporation from loess soil in the Loess Plateau, soil available water is the most important factor controlling vegetation restoration [22,23]. Plants, in turn, affect soil water via their root systems, which results in interactions between physiological and ecological processes [24]. In arid and semiarid environments, water shortage occurs seasonally [25]. The growing seasons are often dictated by the duration of water availability. In the semiarid Loess Plateau, water availability in the growing season is critical for plant growth. As precipitation is limited for extended periods and the depth to groundwater typically limits plant available water, water stored deep in the soil profile can be the primary bio-available reservoir [26,27]. The “Grain to Green Program (GGP)” was initiated in China in 2000 to address environmental degradation through cropland afforestation and grassland exclosure [28]. Currently, the GGP has produced significant achievements [29,30]. For instance, in Shaanxi Province over a 10-year period (2000–2010), the forest and grass-land coverage expanded from 95,737.9 to 97,017.4 km2 and from 37,235.9 to 40,613.1 km2, respectively, while the cropland coverage decreased from 59,222.8 to 54,007.6 km2 [31]. Without adequate planning and monitoring, however, the continued expansion of the GGP may negatively affect the sustainable development of the Loess Plateau [32]. Studies have reported that deep soil moisture depletion has been influenced by large-scale vegetation restoration in the Loess Plateau [27]. Vegetation type is one of the most important factors influencing soil water consumption [33]. Previous studies showed that restoration with introduced vegetation was not always the most appropriate choice compared with natural vegetation types [34]. A negative relationship between deep soil moisture and the age of plants has been found in a recent study [35]. In many parts of semiarid regions, introduced shrubs cannot obtain sufficient water for their growth due to limited rainfall [36]. These shrubs are forced to develop deep root systems to utilize deep soil moisture [6,37]. Evapotranspiration is higher in shrub-lands than in grass-lands, which results in less water being available for streamflow and groundwater recharge [38]. The planting of introduced shrubs over many years has consistently led to dry soil layers in areas with severe water scarcity [39]. Therefore, information on the relationships between introduced shrubs and soil water storage could help to ensure the proper management of water resources and vegetation restoration.
Introduced vegetation consistently exhibits high evapotranspiration rates due to deep roots that allow access to deeper soil water compared with annual pastures and crops [40,41]. Caragana korshinskii K. (C. korshinskii) and Hippophae rhamnoides L. (H. rhamnoides) are introduced leguminous shrubs that have been planted in the semiarid Loess Plateau; they have good economic benefits and high ecological value. They are deciduous shrubs, which are usually maintained for a long time to reduce soil erosion and increase soil fertility in the Loess Plateau and have rapidly become the dominant species with their well-developed root systems (i.e., more than 1 m deep). However, they aggravate water scarcity and lead to soil desiccation in deeper layers compared with abandoned land [37]. Studies have shown that plant available water changed under introduced shrubs during the growing season and a soil water deficit occurred deep in the profile across most of the semiarid Loess Plateau [7,42]. Because introduced shrubs and SWS are extremely important for restoration in the Loess Plateau of China, it is necessary to identify the factors that affect soil water storage replenishment during the growing season.
Based on the above-mentioned research background, we selected C. korshinskii (CK) and H. rhamnoides (HR) for this study. Abandoned lands were chosen for comparative analysis. The specific objectives of this study were to: (1) compare the deep soil water content under introduced shrubs and abandoned lands in the Loess Plateau; (2) analyze the deep soil water storage replenishment (SWSR) during the growing season of these species; and (3) assess the main factor affecting the spatial variation in deep SWSR. The overall goal of the project was to provide a better understanding of the environment-water interaction relationships for further implementation and management of the GGP.

2. Materials and Methods
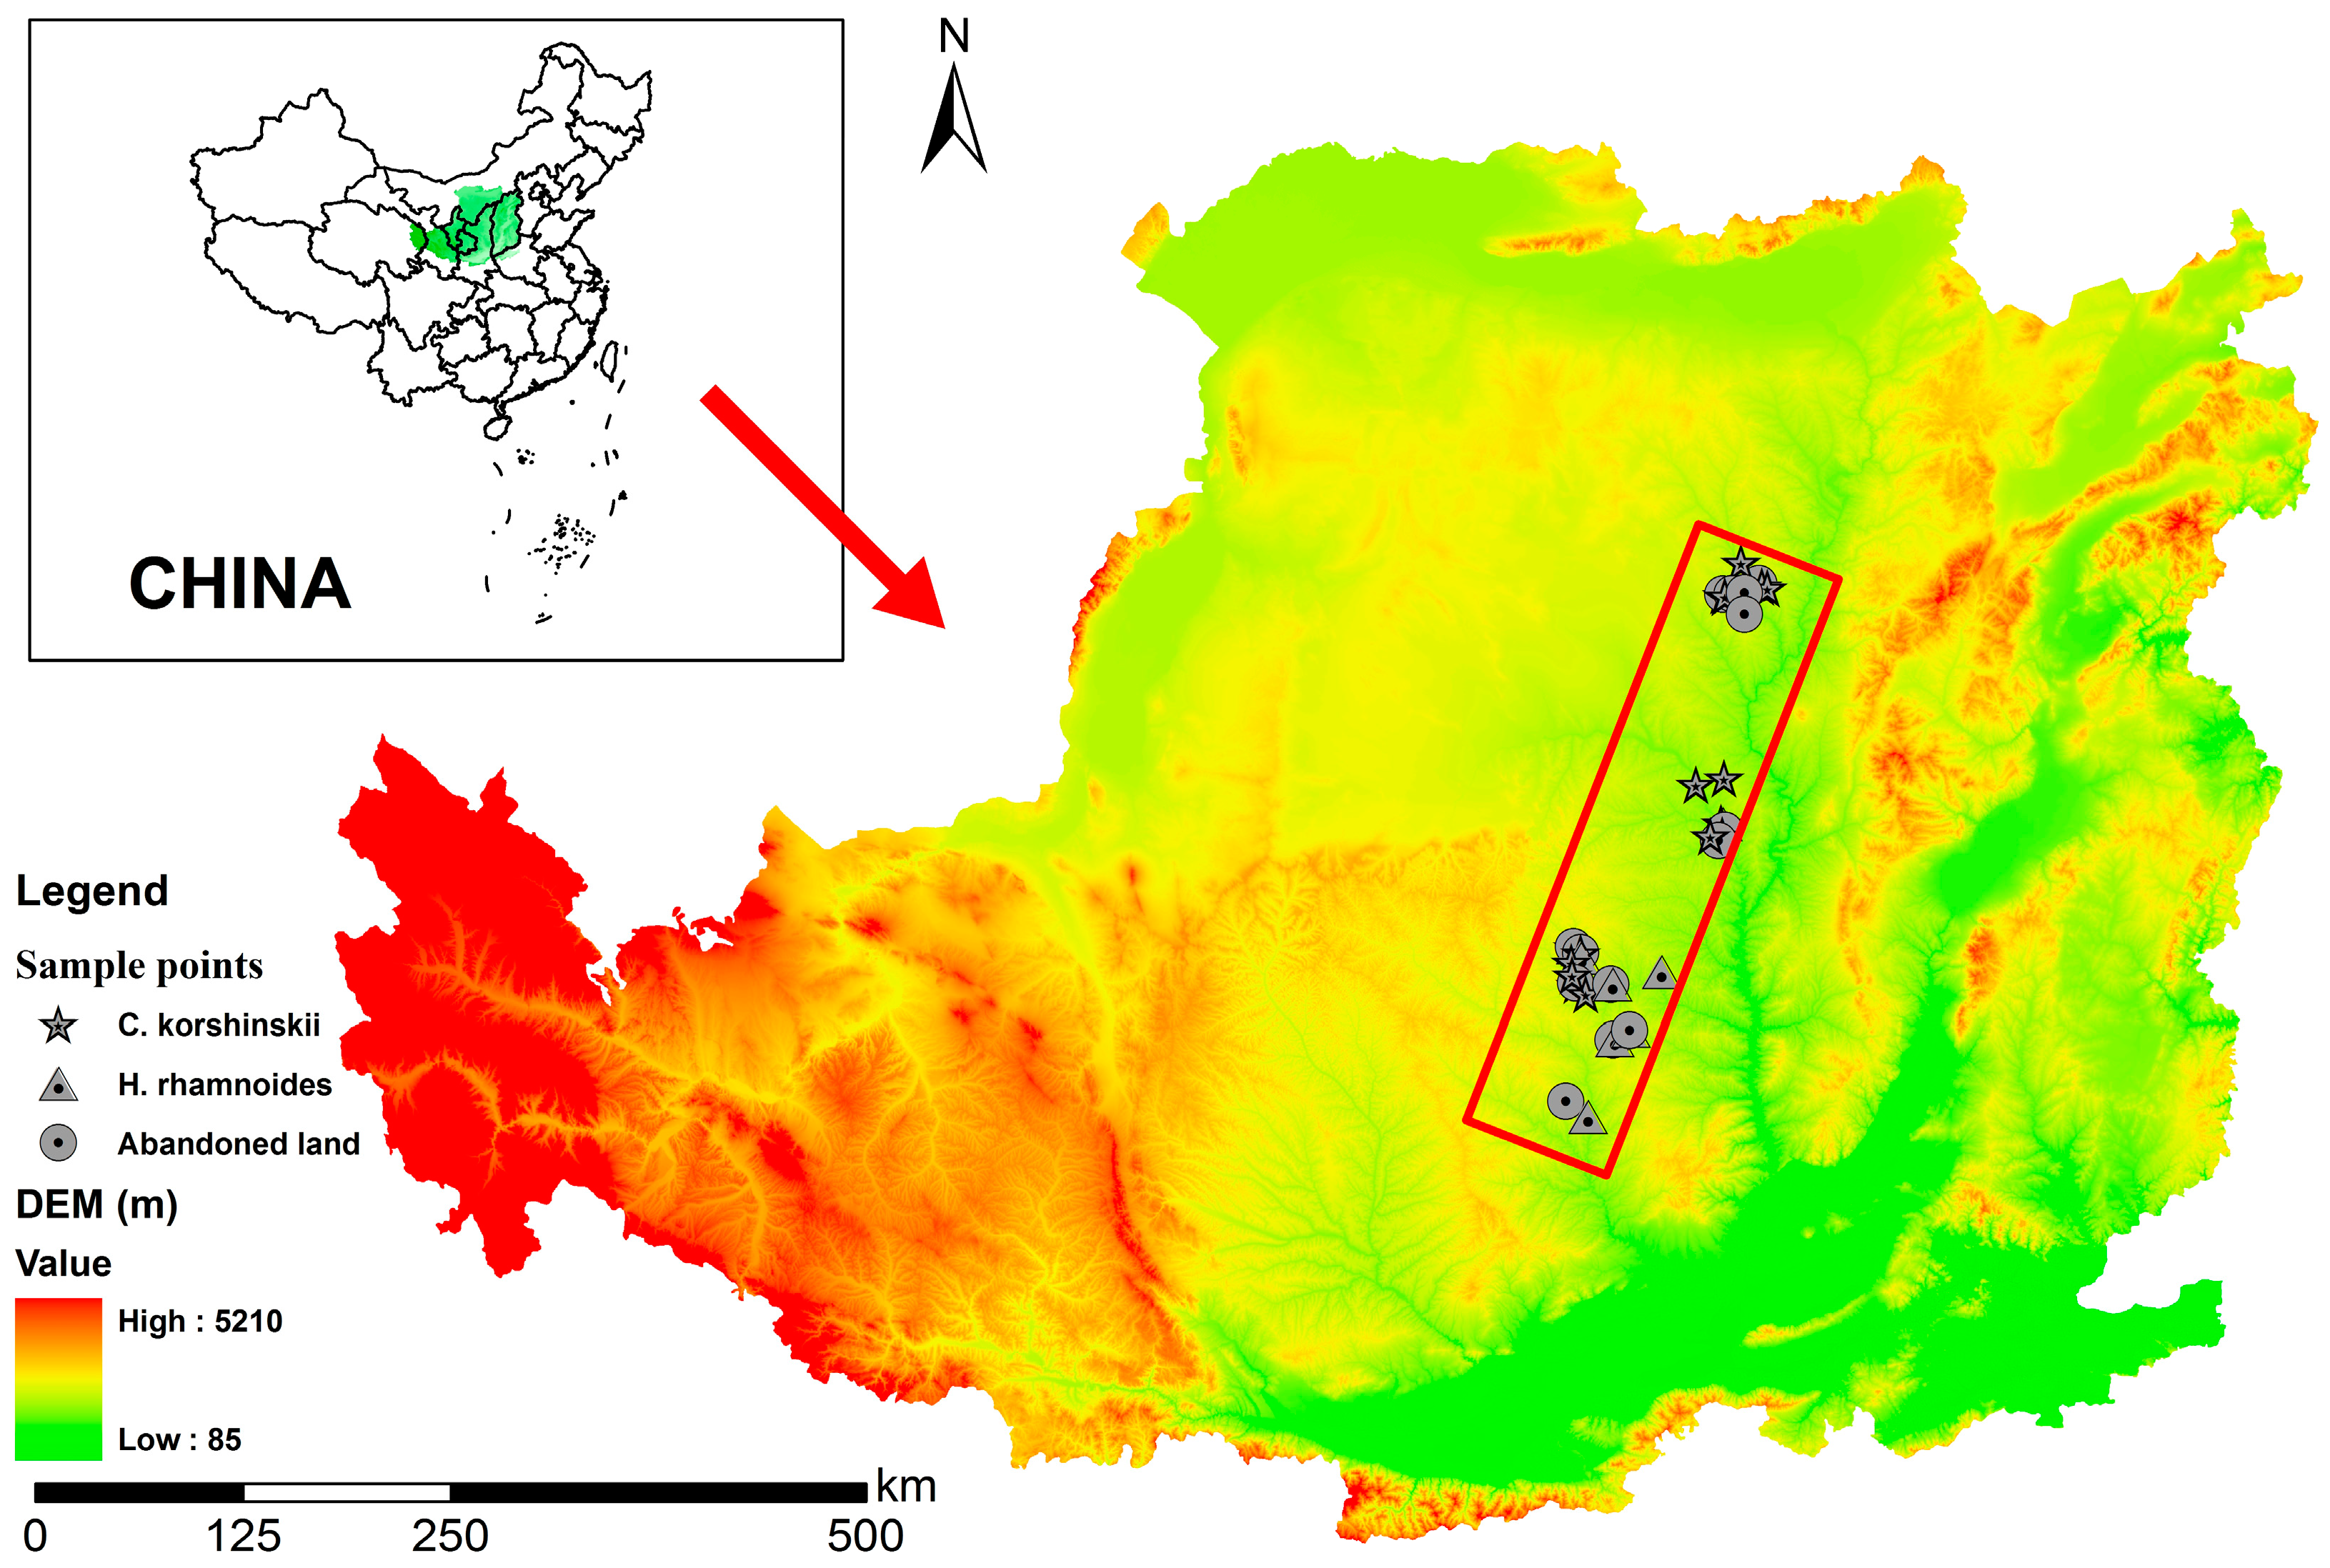
2.1. Study Area

The Loess Plateau in China covers a total area of 620,000 km2, extending from a longitude of 100°54′ to 114°33′ E and a latitude of 33°43′ to 41°16′ N [43]. It is mostly covered by loess-paleosol layers that are 30–80 m thick [44]. Main broad groups of soils formed in the loess are dark loessial soil, loessial soil, lou soil, sierozem soil, castanozem soil, and drab soil. The average annual soil loss resulting from both wind and water erosion is as much as 15,000 t·km−2 [42]. We conducted this study in an area of the semiarid climatic region of the Loess Plateau, located in Shaanxi province, which is undergoing severe fragmentation (Figure 1). The topography of the study area is hilly, with an altitude of sampling points ranging from 873.5 to 1415 m (Table 1). The study area is located in a continental monsoon region where the average annual precipitation of the sampling points ranges from 401.7 to 584.6 mm, 70% of which falls from June to September [45]. The main soil in this area is loess and it is vulnerable to erosion [46,47]. The dominant shrub species are C. korshinskii, H. rhamnoides, Sophora viciifolia, Vitex negundo var. heterophylla, Rosa xanthina, and Syringa oblate.

2.2. Field Sampling

To study the SWS under typical shrubs, we chose sampling routes across the semiarid regions of the Loess Plateau according to the actual distribution of shrubs. The area of each shrubland should be more than 900 m2 (30 m × 30 m). Seventeen 5 m × 5 m CK plots and eight HR plots were established. Because abandoned land (AL) was regarded as natural vegetation restoration, its soil water condition was used for comparative analysis. Fourteen abandoned lands were randomly selected from the surrounding areas as the control group. The ages of the shrubs and the abandoned lands were estimated according to interviews with local farmers and the SWS was calculated for both shrubs and the control plots. As the shrub roots were mainly distributed in the 0–100 cm soil layer [42,48] and the annual rainfall infiltration depth in re-vegetated lands hardly reaches 100 cm in the study area, the deep soil layer was defined as the 100–500 cm layer for this study.
Soil samples were collected at the beginning and end of the growing season of each species—i.e., 27 April to 20 May and 5 September to 1 October 2014, respectively. Soil moisture measurements were conducted for the 100–500 cm profile in 20 cm increments for both introduced shrub-lands and abandoned lands. Soil samples were collected using a drill and were stored in a sealed aluminum case; the soil water content was calculated using a gravimetric approach—i.e., oven-dry method at 105 °C for 24 h. For each sampling period, three profiles were randomly selected to calculate the average soil moisture for each site. At each sampling location, basic topographic information (longitude, latitude, altitude, slope gradient, slope aspect, slope position) was collected using a Garmin eTrex 30 GPS (Garmin, Taiwan, China) and a DQL-8 compass (DQL, Harbin, China). In addition, six undisturbed soil cores were collected using metal cylinders (diameter 5 cm, length 5 cm) to measure bulk density (BD) and field capacity (FC). Disturbed soil samples were also collected to determine soil organic carbon (SOC) and soil particle size (USDA triangle classification system) under introduced shrubs. Vegetation coverage (VC) and crown width (CW) were estimated by vegetation investigation at each site. Similarly, soil penetration (SP) was measured for each sampling site using a pocket penetrometer (Eijkelkamp0603, Royal Eijkelkamp, Giesbeek, The Netherlands). Mean annual temperature (MAT) and mean annual precipitation (MAP) data were collected from 1998 to 2012.

2.3. Statistical Methods

In this study, SWS (mm) was calculated using Equation (1):
S W S = B D ρ w × S W C × D
where BD is bulk density (g/cm3); ρw is water density (the value is 1 g/cm3); SWC is the mass of the soil water content (g/g); and D is the depth of the soil profile (mm).
The SWSR (mm) was calculated using Equation (2):
S W S R = S W S b S W S a  
where SWSb is the SWS at the end of the growing seasons (mm) and SWSa is the SWS at the beginning of the growing seasons (mm).
One-way ANOVA was used to assess the contribution of different vegetation types to the SWC. Multiple comparisons were made using the least significant difference (LSD) method. The SWS was compared between shrubs and at different time by means of independent sample t-test and paired sample t-test, respectively. Pearson correlation analysis was used to examine the relationships between SWSR and the environmental variables. However, some of the environmental variables may be linearly correlated and cannot be detected through Pearson correlation analysis. Multiple linear regressions and principal component analysis have been used for environmental pattern recognition and ecological factor analysis in many studies [49,50]. Principle component analysis (PCA) was performed to obtain a minimum set of environmental variables. Only principal components with eigenvalues >1.0 and variables with highly weighted factors (higher than 7.0) were selected. Then, stepwise multiple linear regressions were run using the environmental variables as inputs to explore the factors controlling SWSR. The above analyses were performed using SPSS 18.0 (IBM, New York, NY, USA). The graphs were drawn using Origin 9.2 (OriginLab, Northampton, MA, USA) and SigmaPlot 10.0 (Systat Software, San Jose, CA, USA).

3. Results

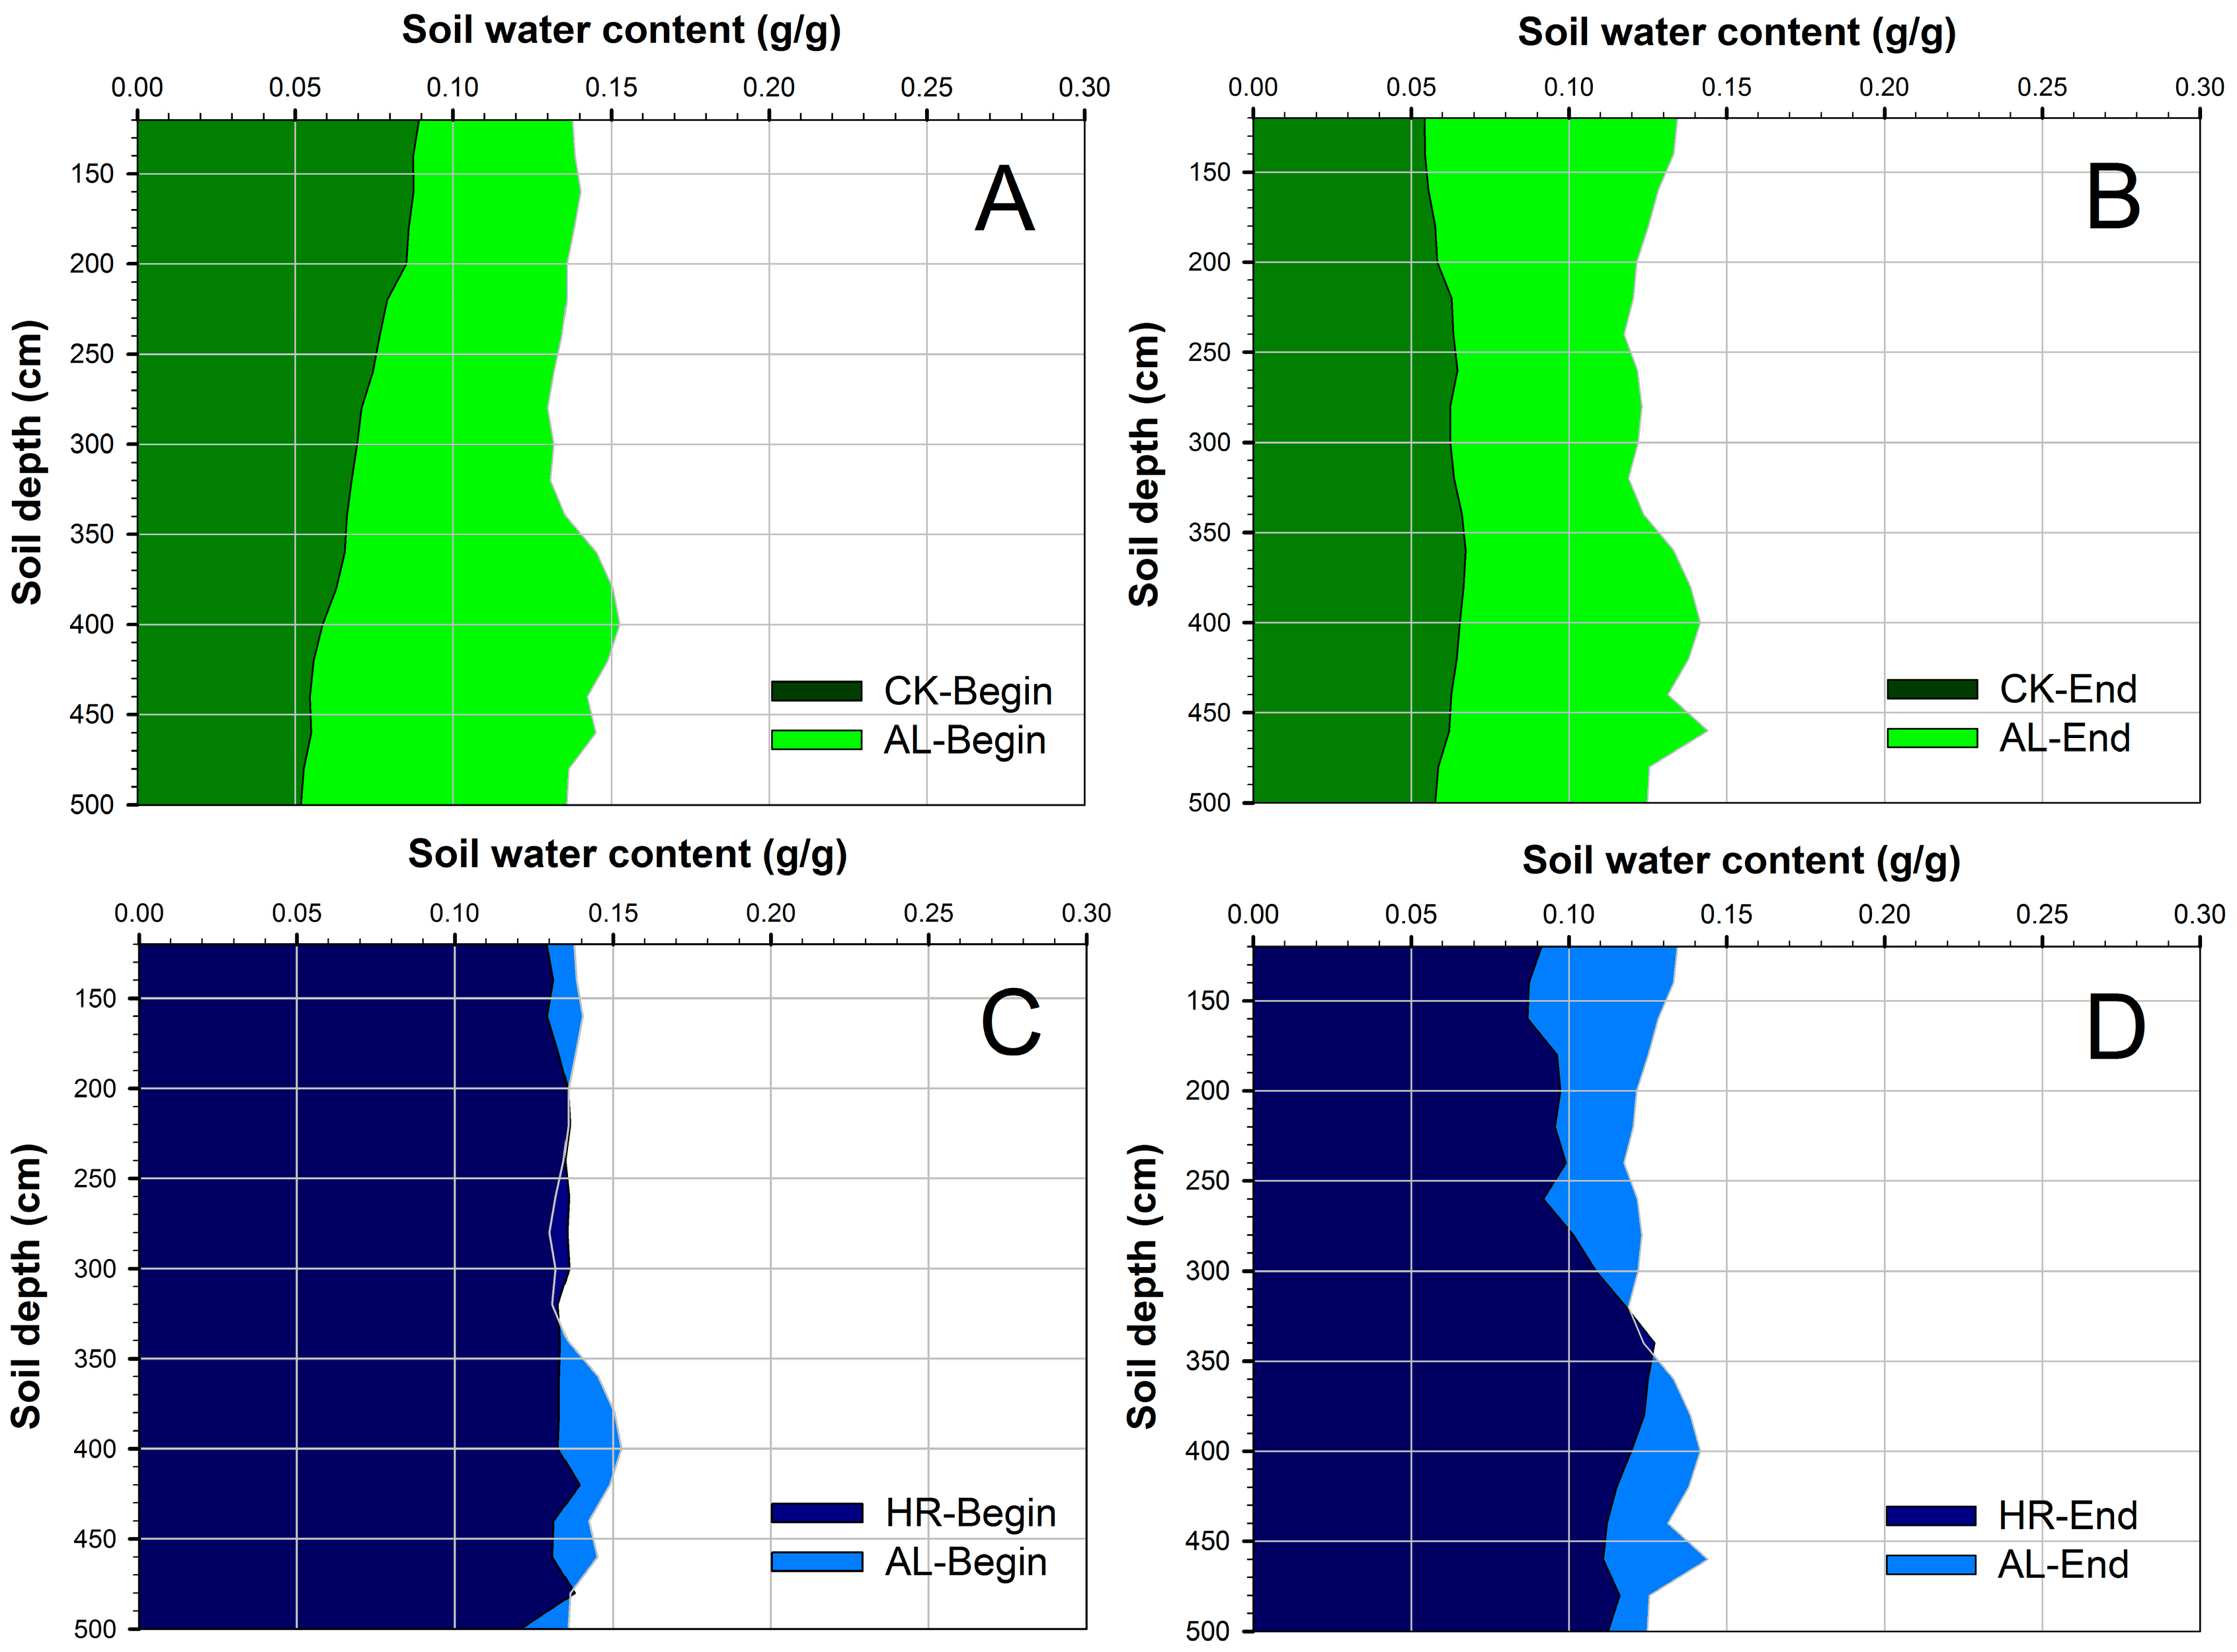
3.1. Soil Water Content of the Deep Profile under Introduced Shrubs and Abandoned Lands

Seasonal changes in the deep SWC under the introduced shrubs (CK and HR) and abandoned lands are presented in Figure 2. At the beginning of the growing seasons, SWC under CK showed a decreasing trend with soil depth while little vertical variability was observed in the SWC under HR. At the end of the growing seasons, the SWC under both CK and HR showed the same pattern, i.e., an initial increase with depth followed by a decrease.
The soil water condition in the deep soil profile (100–500 cm) varied with the different vegetation types. The SWC under CK was lower than 0.09 g/g while the SWC under abandoned lands was higher than 0.11 g/g at both the beginning and end of the growing season (Figure 2A,B). The CK region had relatively lower SWC than the abandoned land. Moreover, the mean difference of SWC between HR and abandoned lands was 0.01 g/g and 0.02 g/g for the beginning and end of the growing season, respectively (Figure 2C,D). For HR, the SWC was close to that under the abandoned land at the beginning of growing season, whereas the soil became drier at the end of the growing season in most of the layers (100–320 cm and 340–500 cm). The SWC under HR ranged from 0.13 g/g to 0.14 g/g and from 0.09 g/g to 0.13 g/g for the beginning and end of the growing season, respectively. The SWC under HR was higher than that under CK throughout the whole growing season. The extent of soil drought followed the sequence: CK > HR > abandoned land. The statistical analysis showed significant differences among the vegetation types in the SWC at both beginning and end of the growing season (p < 0.05).

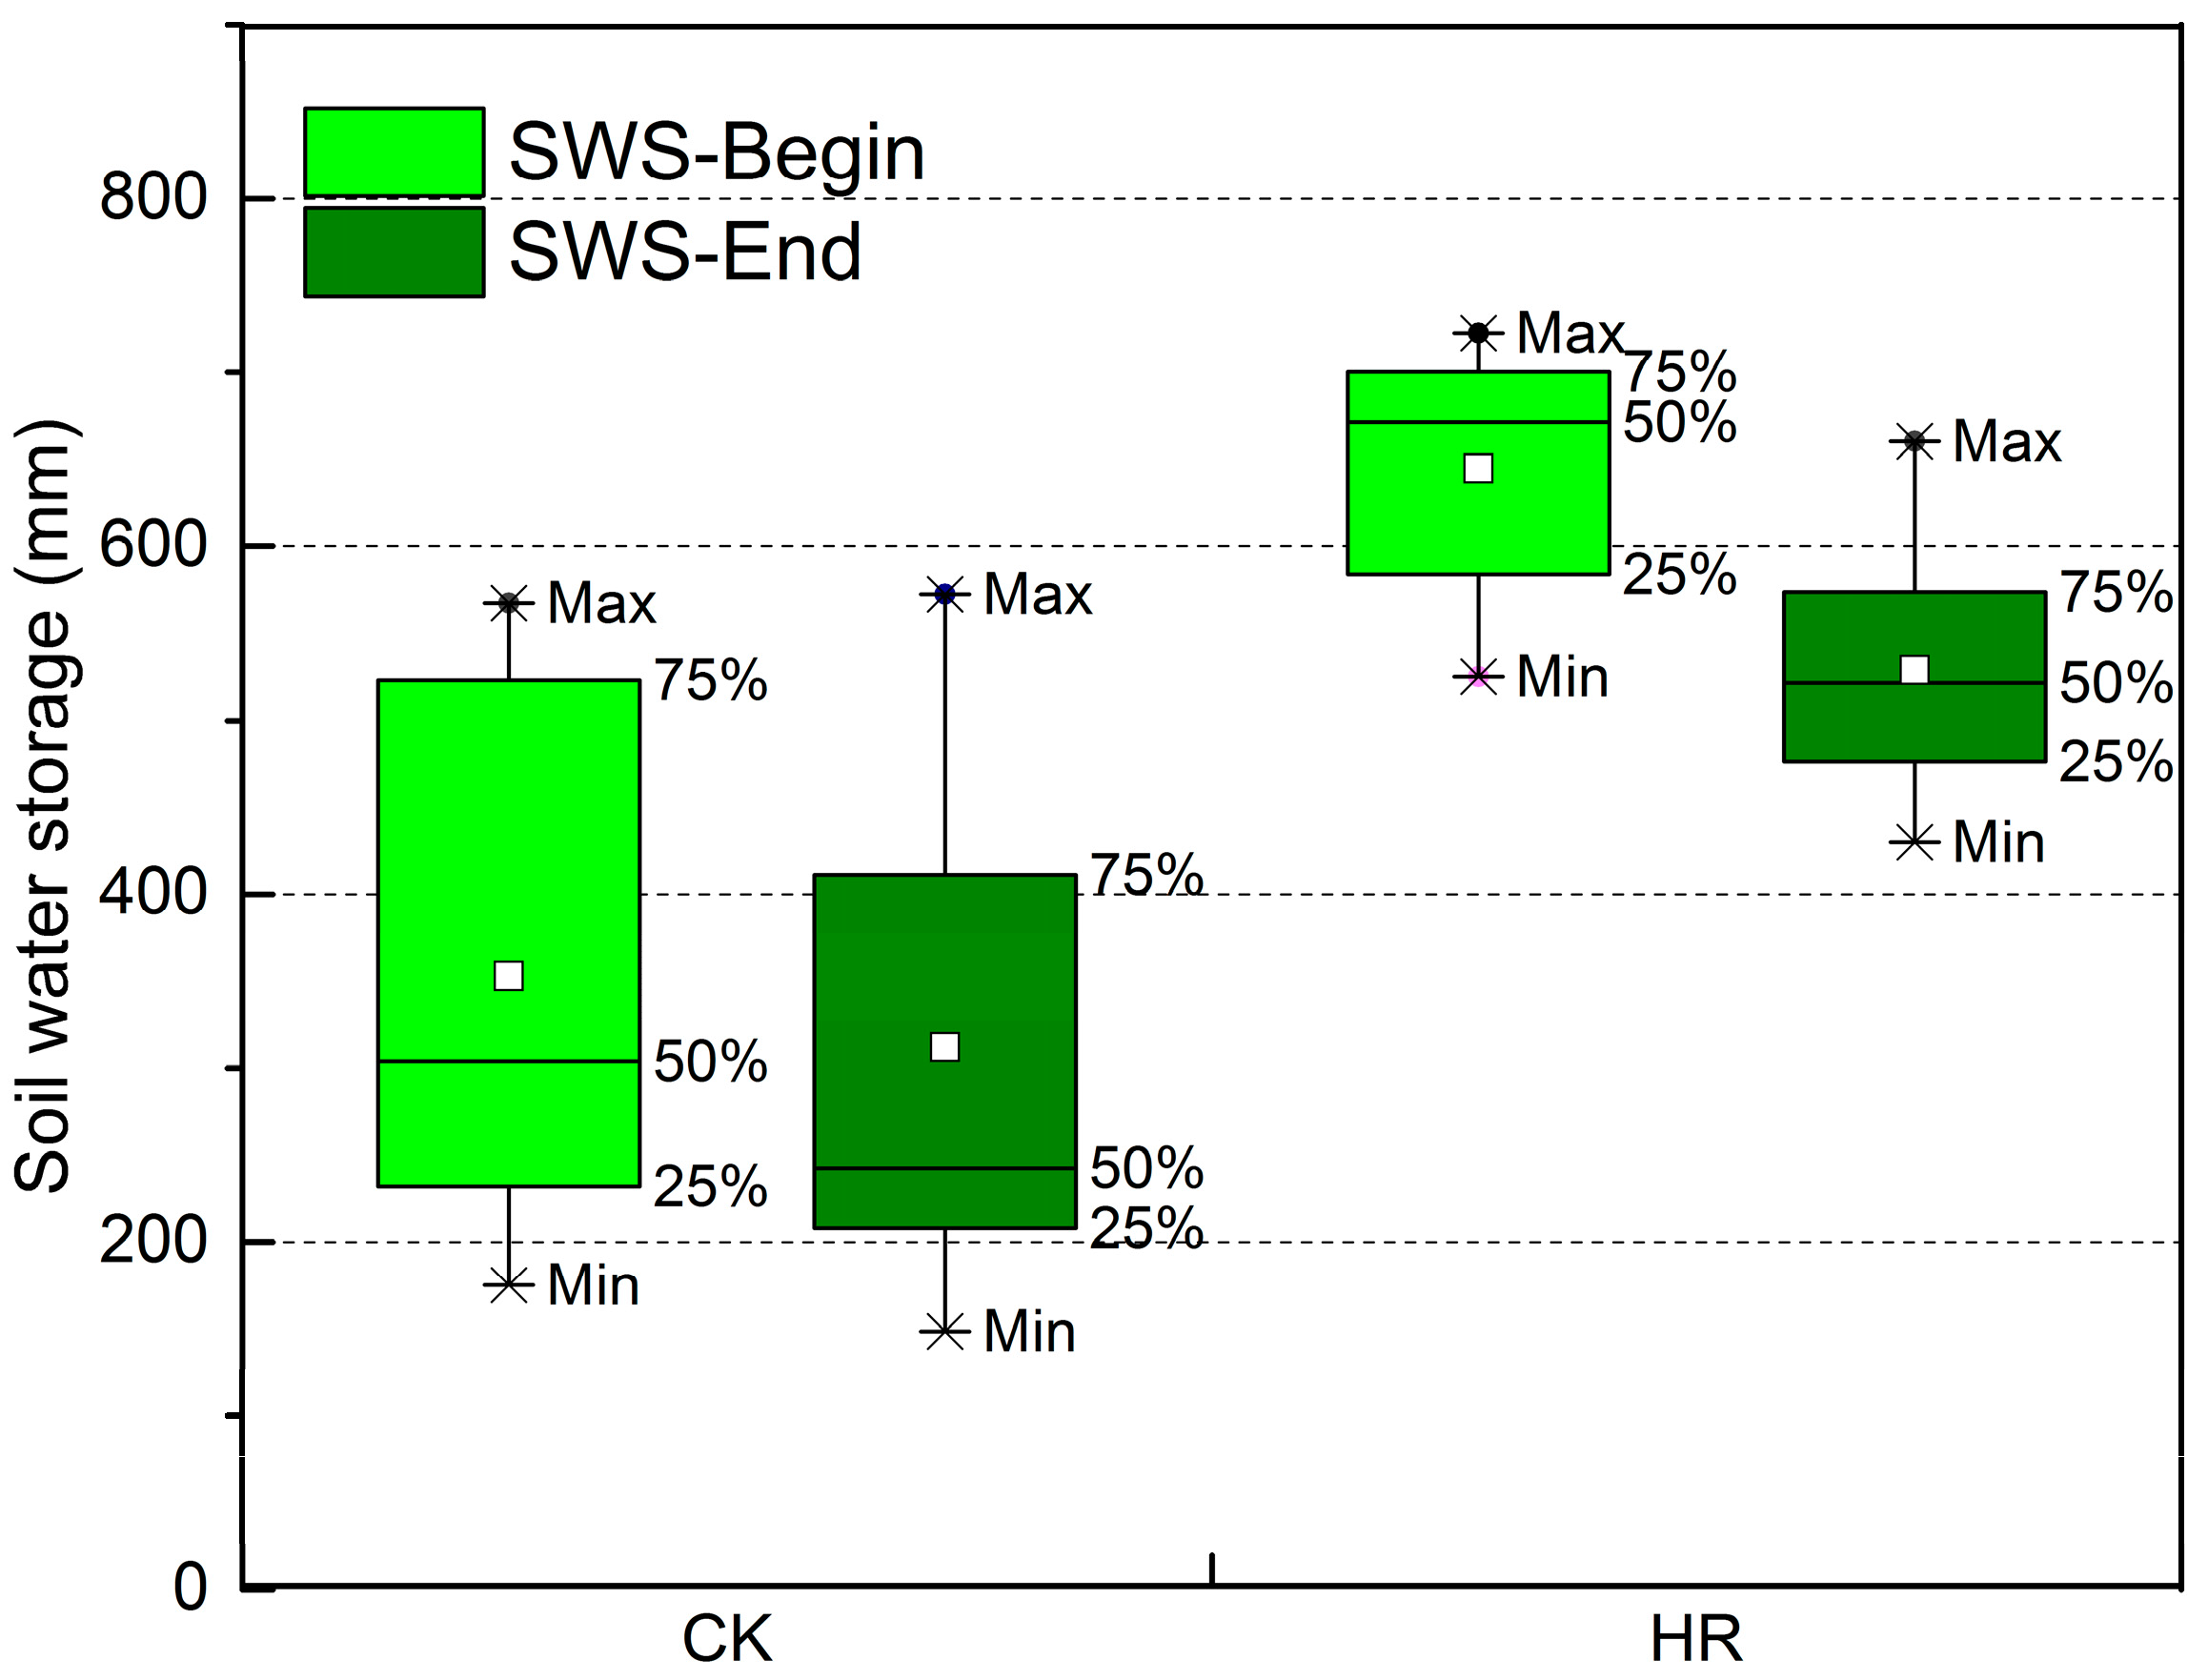
3.2. Summary Statistics of Soil Water Storage Changes during the Growing Season

The SWS statistics pertaining to CK and HR at different times of the growing season are reported in Figure 3. Note that greater variability existed under CK. A higher mean SWS value was observed at the beginning of the growing season under both CK (352.74 mm) and HR (644.79 mm) with a significant level (p < 0.05). The mean SWS under HR was significantly higher than that under CK at both the beginning (352.74 mm for CK and 644.79 mm for HR) and end of the growing season (311.95 mm for CK and 529.05 mm for HR) (p < 0.01). The SWS variability decreased with decreasing SWS values for both of these shrubs.
An obvious difference in SWSR below 100 cm under CK and HR is evident in Figure 4. The SWSR under CK showed an increasing trend with soil depth. The SWSR under HR, however, showed a different vertical pattern where it initially increased with depth but then decreased. At the same depth, the SWSR of CK was higher than that of HR with a significant level (p < 0.01, independent sample t-test). The SWSR values in each layer under HR and the SWSR of CK above 340 cm were negative, which means that soil water consumption exceeded soil water recharge during the growing season. SWS recharge only occurred under CK below a depth of 340 cm. The maximum SWSR under HR was observed in the 340 cm layer. Based on the SWSR changes in the growing season, the deep profile can thus be subdivided into two layers, i.e., the 100–340 cm layer and the 340–500 cm layer. For both shrubs, the SWS below 340 cm had higher stability than the 100–340 cm layer during the growing season. Compared with HR, the maximum SWSR value under CK occurred at a depth of 400–420 cm.

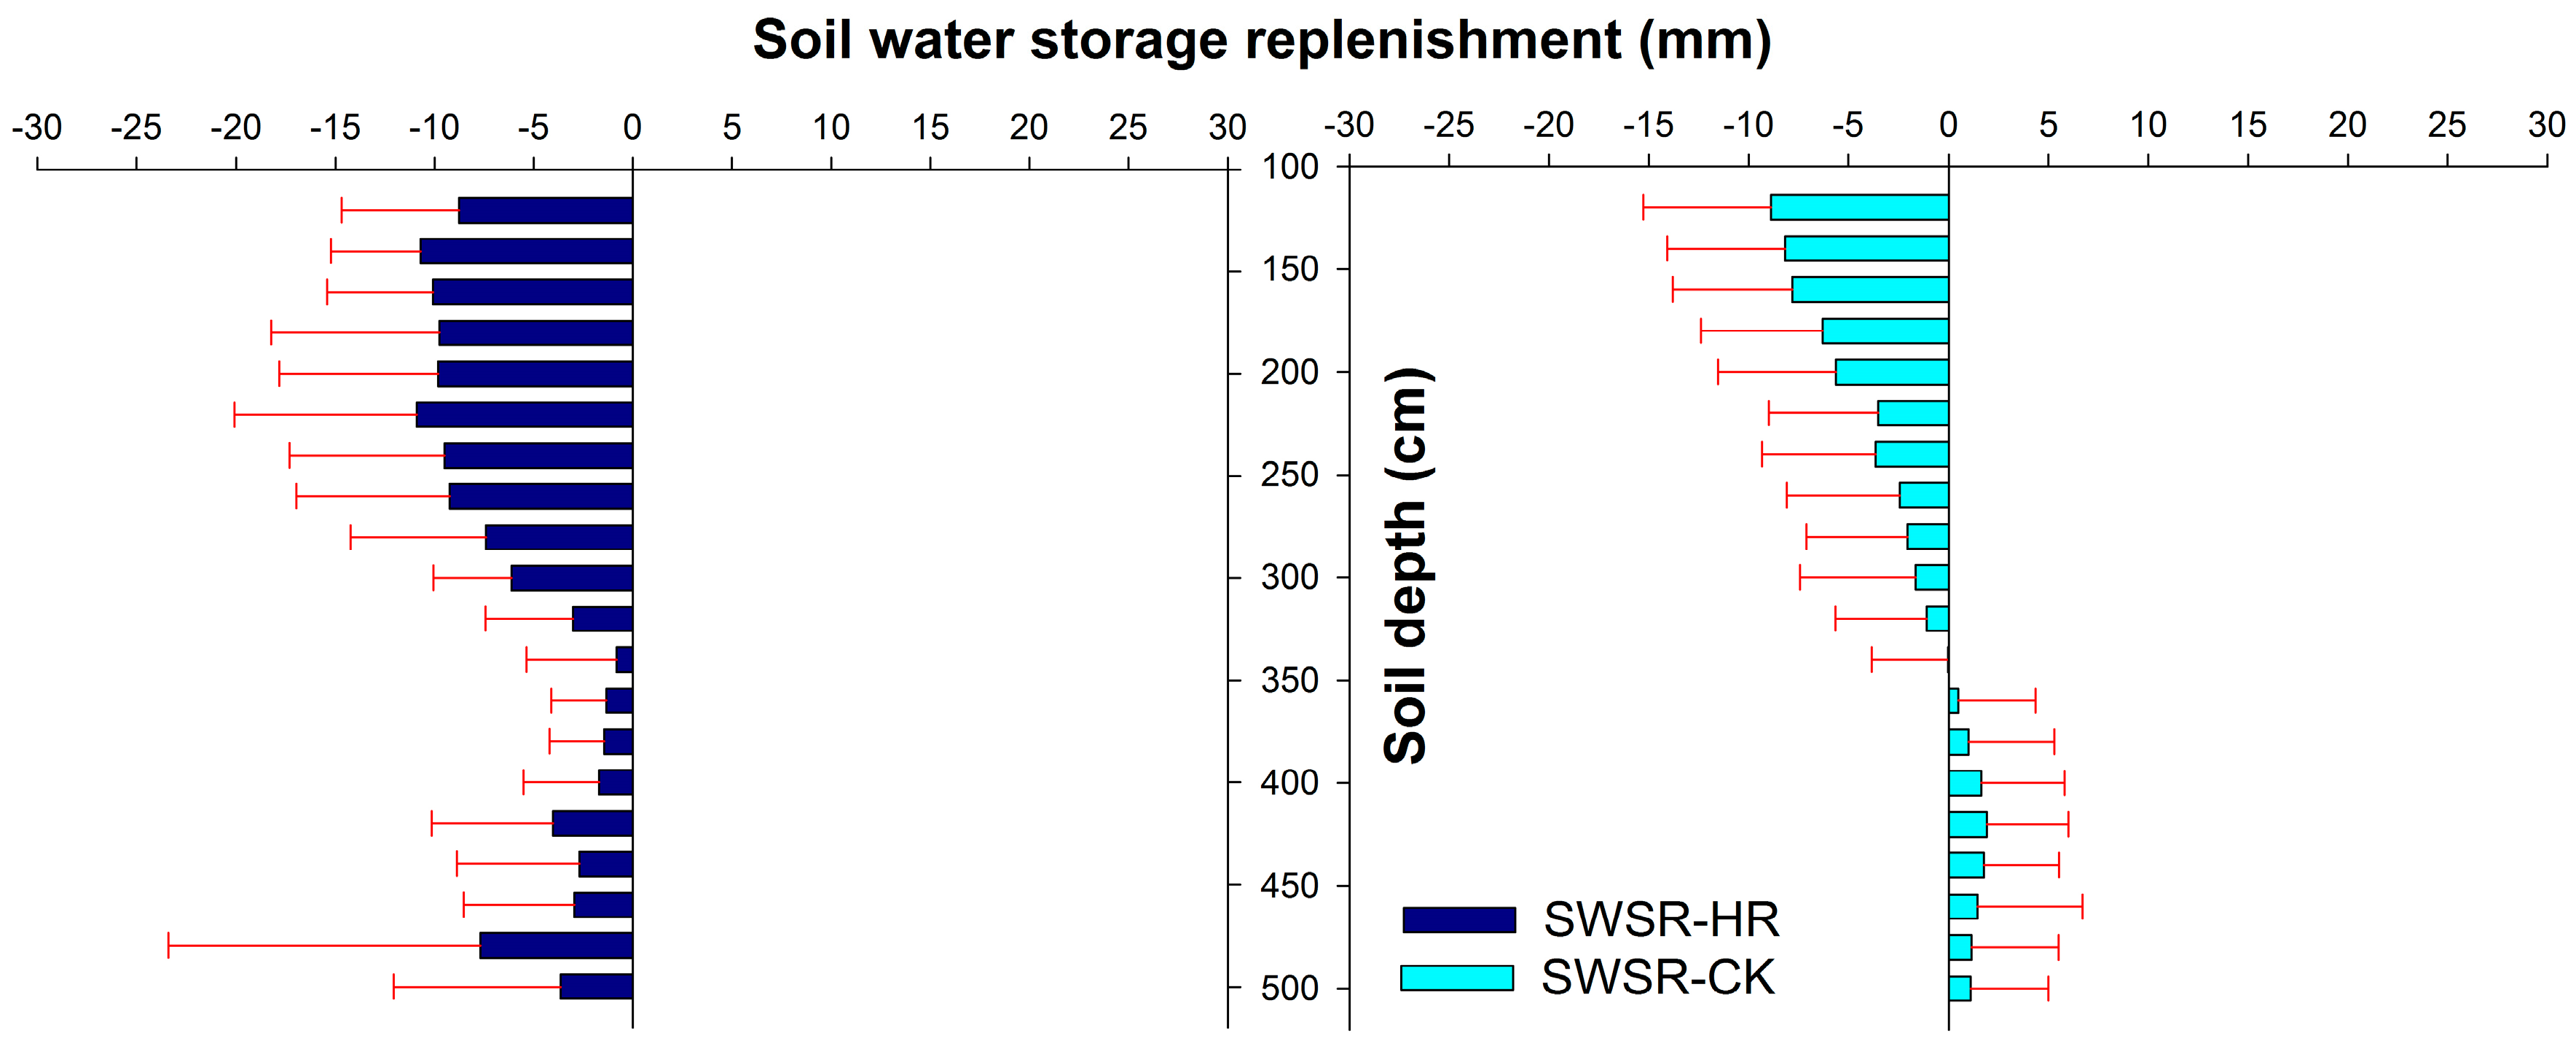
3.3. Factors Influencing Soil Water Storage Replenishment

Pearson correlation analysis was used to evaluate the relationships between SWSR and the soil properties (SP, BD, FC, SOC, clay content, silt content, and sand content), meteorological factors (MAP and MAT), topographic factors (altitude, slope gradient, slope aspect), and vegetation characteristics (vegetation type, VC, and CW) (Table 2). The SWSR at the 100–500 cm depth showed correlations with vegetation type (VT), FC, SOC, silt content, and sand content. The SWSR at the 100–340 cm depth showed very significant correlations (p < 0.01) with FC, silt content, sand content, and the SWSR at the 340–500 cm depth was significantly correlated (p < 0.05) with VT. It is noteworthy that correlations existed among variables, for example, VT and silt content and sand content for the areas under introduced shrubs.
There were a total of 15 variables for the correlation analysis. As some of the variables may be linearly correlated [51], principle component analysis was used here to reduce the dimensionality of the data sets (Table 3). The results showed that five principle components had eigenvalues >1.0. The five principle components accounted for 78.32% of the variance. Moreover, the first component was positively associated with VT, MAP, MAT, Alt, SG, FC, SOC, and silt content and was negatively associated with BD and sand content. The second component was associated with MAP, Alt, SG, SA, and FC. The third component was positively associated with clay content, MAP and to a lesser extent, VT. The fourth component was positively associated with VC, BD, SOC, and SA but negatively associated with CW. The fifth component was mainly associated with SP and SA. In this study, we chose variables that exhibited close relationships with the principle components (correlation coefficients greater than 0.70). In total, 10 out of 15 variables were selected as the minimum data sets.
The SWSR at 340–500 cm depth was mainly affected by VT (Table 2). To determine the main factors affecting SWSR at the 100–500 cm depth and 100–340 cm depth, we conducted stepwise multiple linear regression for further analysis (Table 4). At the 100–500 cm depth, silt content entered both models while crown width only entered the second model. Silt content explained 20% of the SWSR variability, whereas silt content and crown width explained 35% of the SWSR variability. For SWSR at the 100–340 cm layer, sand content explained 28% of the variance.

4. Discussion

4.1. Relationships between Introduced Vegetation and Dried Soil in the Deep Profile

The introduced shrubs (CK and HR) in this study form part of the mature community (Table 1). In the Loess Plateau, most rainfall occurs during the periods from July to September [36]. Introduced shrubs lead to dried soil in the deep profile (100–340 cm depth) during their growing seasons, compared with abandoned lands (Figure 2). Previous studies also reported that introduced shrub, forest, and grass had consistently lower SWCs than farmland and abandoned land [27,36]. This might be due to higher potential evapotranspiration under introduced vegetation [36]. However, the degree of drought varied with the different shrubs. The soil under CK was drier than that under HR (Figure 2). The roots of the introduced vegetation (CK and HR) selected in this study were mainly distributed in the 0–100 cm layer; however, these species have deep root systems below the rainfall infiltration depth and absorbed more deep soil water than the abandoned land [36]. Different plant functional types allocate roots to different soil depths to obtain access to water [52]. We speculated that the root systems of the shrubs played an important role in determining the dried soil. The roots of CK might be more developed than those of HR [53,54], which led to different degrees of soil water consumption. This is consistent with previous studies [36,37]. Previous studies also showed that the root systems in deeper soil layers could be especially important in seasonal drought regions because it can extract water resources from the deeper layers during periods of upper soil water stress and high evaporative demand [42,55].
In the 340–500 cm depth, SWS recharge only occurred under CK (Figure 4). According to the result above, the SWSR at 340–500 cm was mainly associated with vegetation type (Table 4), which might lead to the difference of replenishment between CK and HR. Another explanation might be the extent of hydraulic lift, which was observed in arid and semiarid ecosystems under shrubs [56,57]. Hydraulic lift is the process by which some deep-rooted plants take in water from lower soil layers and exude that water into upper, drier soil layers [58]. However, the evidence in this study was not enough to prove the hydraulic lift, and the threshold value of SWS for the occurrence of SWS replenishment might vary between different vegetation types, which should be explored in future research.

4.2. Factors Related to SWSR

SWSR is influenced by many factors [17]. In this study, VT, FC, SOC, silt content, and sand content significantly influenced the SWSR at 100–500 cm depth (Table 2). Our results, combining principal component analysis and stepwise multiple linear regression, showed that silt content and crown width had most significant effect on SWSR, which indicated that the essential role of vegetation and soil in soil water variations. A study in northeastern Scotland also reported that soil properties exert a strong influence on water storage dynamics and fluxes [17], which is consistent with our results. The SWSR at 100–500 cm depth was negatively associated with silt content because the high silt content often leads to a relatively low saturated hydraulic conductivity for strong heterogeneous soil [59]. Table 4 also indicated crown width was positively associated with SWSR. Previous study showed that crown width was an important index reflecting vegetation growth [60]. Therefore, vegetation characteristics have an important effect in determining SWSR variations in deep profile. Topographic factors, such as slope gradient and slope position were also important factors influencing soil water variability. For example, the study in the western part of the Chinese Loess Plateau indicated that the SWC values in most layers were higher for a gentle slope than those for a steeper slope [27], which also reflects the importance of SG in determining soil water conditions. However, our results indicated that topographic factors had less impact on SWSR than vegetation and soil properties. It might be due to the topographic characteristics of sampling points in this study. The slope gradient and slope aspect among sampling points were less differentiation at some level. Compared with the other main factors, MAP had relatively low explanatory power based on the Pearson correlations (Table 2). This also verified the view that deep soil water can hardly be recharged by precipitation in the semiarid region of the Loess Plateau.
However, the most important factors that influenced SWSR in the two layers—i.e., 100–340 cm and 340–500 cm—were not the same (Table 2 and Table 4), which showed that the interaction between soil water and its influencing factors changed with soil depth. This is a dynamic process that depends on geographical and land use factors [25,27,31]. The variation in SWC and SWSR differed between the different vegetation types, which might be explained by the plant growth and root system characteristics. The SWSR at 100–340 cm depth was mainly associated with sand content, which indicated the importance of soil properties influencing SWSR. Previous study also demonstrated the essential role of soil texture in determining soil water variations [61]. The SWS in the deep profile is essential for introduced plant growth, and in turn, plant growth highly affects the amount and distribution of deep SWS [25]. In this study, SWSR at 340–500 cm was influenced most by VT (Table 4). Previous study showed that the amount of aboveground net primary productivity was sensitive to replenishment by rainfall in dry soils [25]. It is very difficult to discern the complicated environment-SWSR-vegetation relationship because the dynamic processes of SWSR are influenced by many factors that vary spatially and temporally. For instance, changes in precipitation and frequency influence SWSR, which then affects vegetation growth [62,63]. In this study, the vegetation age was obtained by talking with local farmers, which might be not accurate. So we did not consider the vegetation age as a factor influencing SWSR. We would assess the influence of vegetation age on SWSR by evaluating growing rings in future research.

4.3. Management Implications of the “Grain to Green Program”

Soil water is a dominant factor among many interacting forces that regulate vegetation patterns [16]. If the SWS is not recharged, vegetation growth would be restricted, which would lead to unsustainable vegetation restoration. More attention should be paid to the soil water-vegetation interaction in vegetation construction at large scales to cope with the pressure of rapid population growth. The GGP, the largest active re-vegetation program in China, has brought many ecological benefits to the Loess Plateau. For instance, vegetation cover almost doubled between 1999 and 2013, which resulted in enhanced soil conservation and carbon sequestration [9,30]. Soil under introduced vegetation, however, has become drier in semiarid areas (Figure 2 and Figure 3). Continued expansion of vegetation restoration might cause more harm than good to the environment [32]. Water shortage in shallow layers can be recharged by rainfall during the rainy seasons [27]. The SWC in deep layers, however, remained low without supplemental water (Figure 4) and was depleted by introduced vegetation [64].
Based on the above discussion, the SWSR was most significantly influenced by sand content and vegetation type at 100–340 cm depth and 340–500 cm depth, respectively. Management of the GGP should consider both appropriate vegetation selection and soil properties in a particular region. The soil water content under HR was higher than that under CK with a significant level after many years of growth (Figure 2 and Figure 3). However, limited sample points might influence the results in this study. More attention should be paid to the number of sampling points in the further research. In terms of soil water condition, HR is more suitable than CK for vegetation construction in the semiarid Loess Plateau (Figure 2). The formation of dried soil depends on the water-vegetation interaction and water cycles in the ecosystem [65], and other researchers considered that appropriate vegetation selection and planting density could avoid or mitigate dried soil problems [7]. In this study, silt content and sand content were also important factors that influenced the SWSR at 100–500 cm depth and 100–340 cm depth, respectively. According to our results, altering microtopography could be used for vegetation restoration in soil-drought region. Previous study showed that altering microtopography could enhance soil moisture by creating a mosaic of soil patches, altering rainfall redistribution, and changing micro-habitat conditions [66]. Additionally, man-made microtopography reduced runoff and increased rainfall infiltration by adding topographic variation at fine scales [66].
In the further implementation of the GGP, the selection of drought-resistant shrubs (e.g., HR) should be prioritized, and then zonal species can be introduced once the environment has been sufficiently modified by pioneer and early successional species [67]. In the GGP process, suitable engineering measures, such as microtopography, should be taken into consideration. Through such means, dried soil can be avoided and vegetation coverage can be improved to some extent. Comprehensive utilization of management practices and engineering measures would promote the sustainable development of the GGP.

5. Conclusions

This study demonstrated vertical variations of SWC, SWS, and SWSR and the influencing factors of SWSR under typical introduced shrubs in the semiarid Loess Plateau. The results showed that soil under CK was significantly drier than that under HR. SWS below 340 cm had higher stability than that in the 100–340 cm layer in the growing seasons of both shrubs. The SWSR in each soil layer under CK was significantly higher than that under HR. Moreover, the SWSR under CK showed an increased trend with soil depth, which was different from that observed for HR. In these ecosystems, SWS was only replenished below 340 cm under CK, whereas soil water consumption exceeded recharge in the whole profile (100–500 cm) under HR. The mean SWS under CK was lower than that under HR during their respective growing seasons, and greater variability existed in the SWS under CK. The SWSR was influenced by many factors, such as soil properties and vegetation characteristics. Using principle component analysis and stepwise multiple linear regression, we found that the SWSR within the 100–500 cm layer was mainly affected by silt content and crown width. However, the SWSR at the depth of 100–340 cm was mainly affected by sand content. At the 340–500 cm depth, the variability of SWSR was due to vegetation type. Therefore, expansion of the GGP should pay more attention to both soil water condition and influencing factors in combination with management practices and engineering measures. Shrubs with strong drought tolerance and adaptation should be planted first to modify the environment. Then, zonal plant communities can be introduced to avoid soil drought caused by introduced shrubs. During vegetation restoration, microtopography could be used to improve rainfall infiltration and change micro-habitat conditions. By incorporating these measures, dried soil can be lessened, which will promote the sustainable development of the GGP.

Acknowledgments

This study was supported by the National Natural Science Foundation of China (No. 41390462) and the National Key Research and Development Program of China (No. 2016YFC0501604). We thank the two anonymous reviewers for their critical comments and constructive suggestions on the manuscript.

Author Contributions

Yuanxin Liu and Wenwu Zhao conceived and designed the study; Yuanxin Liu, Xiao Zhang, and Xuening Fang performed the study; Yuanxin Liu and Wenwu Zhao wrote the paper.

Conflicts of Interest

The authors declare no conflict of interest.

References

  1. Wang, L.; D’Odorico, P.; Evans, J.P.; Eldridge, D.J.; McCabe, M.F.; Caylor, K.K.; King, E.G. Dryland ecohydrology and climate change: Critical issues and technical advances. Hydrol. Earth Syst. Sci. 2012, 16, 2585–2603. [Google Scholar] [CrossRef] [Green Version]
  2. Ragab, R. Preface: Salinity management in agriculture: The basis and applications. In Manejo da Salinidade na Agricultura: Estudos Basicos e Aplicados; Gheyi, E.H.R., Dias, N.d.S., de Lacerda, C.F., Feitosa, C., Eds.; Institute Nacional De Ciencia E Tecnologia Em Salinidade: Fortaleza, Brazil, 2010. [Google Scholar]
  3. Daly, E.; Porporato, A. A review of soil moisture dynamics: From rainfall infiltration to ecosystem response. Environ. Eng. Sci. 2005, 22, 9–24. [Google Scholar] [CrossRef]
  4. Zhao, W.W.; Fu, B.J.; Chen, L.D. A comparison between soil loss evaluation index and the c-factor of rusle: A case study in the loess plateau of China. Hydrol. Earth Syst. Sci. 2012, 16, 2739–2748. [Google Scholar] [CrossRef] [Green Version]
  5. Zheng, H.; Gao, J.; Teng, Y.; Feng, C.; Tian, M. Temporal variations in soil moisture for three typical vegetation types in inner mongolia, northern China. PLoS ONE 2015, 10, e0118964. [Google Scholar] [CrossRef] [PubMed]
  6. Zavaleta, E.S.; Thomas, B.D.; Chiariello, N.R.; Asner, G.P.; Shaw, M.R.; Field, C.B. Plants reverse warming effect on ecosystem water balance. Proc. Natl. Acad. Sci. USA 2003, 100, 9892–9893. [Google Scholar] [CrossRef] [PubMed]
  7. Liu, Y.X.; Zhao, W.W.; Wang, L.X.; Zhang, X.; Daryanto, S.; Fang, X.N. Spatial variations of soil moisture under caragana korshinskii kom. From different precipitation zones: Field based analysis in the loess plateau, China. Forests 2016, 7, 31. [Google Scholar] [CrossRef] [Green Version]
  8. Lü, Y.H.; Ma, Z.M.; Zhang, L.W.; Fu, B.J.; Gao, G.Y. Redlines for the greening of China. Environ. Sci. Policy 2013, 33, 346–353. [Google Scholar] [CrossRef]
  9. Lü, Y.H.; Zhang, L.W.; Feng, X.M.; Zeng, Y.; Fu, B.J.; Yao, X.L.; Li, J.R.; Wu, B.F. Recent ecological transitions in China: Greening, browning, and influential factors. Sci. Rep. 2015, 5, 8732. [Google Scholar] [CrossRef] [PubMed]
  10. Montenegro, S.; Ragab, R. Impact of possible climate and land use changes in the semi arid regions: A case study from north eastern brazil. J. Hydrol. 2012, 434–435, 55–68. [Google Scholar] [CrossRef]
  11. Famiglietti, J.S.; Wood, E.F. Effects of spatial variability and scale on areally averaged evapotranspiration. Water Resour. Res. 1995, 31, 699–712. [Google Scholar] [CrossRef]
  12. Koster, R.D.; Dirmeyer, P.A.; Guo, Z.C.; Bonan, G.; Chan, E.; Cox, P.; Gordon, C.T.; Kanae, S.; Kowalczyk, E.; Lawrence, D.; et al. Regions of strong coupling between soil moisture and precipitation. Science 2004, 305, 1138–1140. [Google Scholar] [CrossRef] [PubMed]
  13. Quinn, P. Scale appropriate modelling: Representing cause-and-effect relationships in nitrate pollution at the catchment scale for the purpose of catchment scale planning. J. Hydrol. 2004, 291, 197–217. [Google Scholar] [CrossRef]
  14. Zhao, W.W.; Fu, B.J.; Qiu, Y. An upscaling method for cover-management factor and its application in the loess plateau of China. Int. J. Environ. Res. Public Health 2013, 10, 4752–4766. [Google Scholar] [CrossRef] [PubMed]
  15. Biswas, A. Landscape characteristics influence the spatial pattern of soil water storage: Similarity over times and at depths. Catena 2014, 116, 68–77. [Google Scholar] [CrossRef]
  16. Ferreira, J.N.; Bustamante, M.; Garcia-Montiel, D.C.; Caylor, K.K.; Davidson, E.A. Spatial variation in vegetation structure coupled to plant available water determined by two-dimensional soil resistivity profiling in a brazilian savanna. Oecologia 2007, 153, 417–430. [Google Scholar] [CrossRef] [PubMed]
  17. Geris, J.; Tetzlaff, D.; McDonnell, J.; Soulsby, C. The relative role of soil type and tree cover on water storage and transmission in northern headwater catchments. Hydrol. Process. 2015, 29, 1844–1860. [Google Scholar] [CrossRef]
  18. Grayson, R.B.; Western, A.W. Towards areal estimation of soil water content from point measurements: Time and space stability of mean response. J. Hydrol. 1998, 207, 68–82. [Google Scholar] [CrossRef]
  19. Schneider, K.; Huisman, J.A.; Breuer, L.; Zhao, Y.; Frede, H.G. Temporal stability of soil moisture in various semi-arid steppe ecosystems and its application in remote sensing. J. Hydrol. 2008, 359, 16–29. [Google Scholar] [CrossRef]
  20. Entin, J.K.; Alan, R.; Vinnikov, K.Y.; Hollinger, S.E.; Liu, S.; Namkhai, A. Temporal and spatial scales of observed soil moisture variations in the extratropics. J. Geophys. Res. 2000, 105, 11865–11877. [Google Scholar] [CrossRef]
  21. Han, X.; Tsunekawa, A.; Tsubo, M.; Li, S. Effects of land-cover type and topography on soil organic carbon storage on northern Loess Plateau, China. Acta Agric. Scand. 2010, 60, 326–334. [Google Scholar] [CrossRef]
  22. Qiu, Y.; Fu, B.; Wang, J.; Chen, L. Soil moisture variation in relation to topography and land use in a hillslope catchment of the Loess Plateau, China. J. Hydrol. 2001, 240, 243–263. [Google Scholar] [CrossRef]
  23. Liu, G.; Tian, G.; Shu, D.; Lin, S.; Liu, S. Streamflow and soil moisture of agroforestry and grass watesheds in hilly area. Pedosphere 2004, 14, 263–268. [Google Scholar]
  24. Stephen, S.O.B.; Mark, A.A.; Neil, C.T.; Don, A.W.; Chin, K.O. Tree roots: Conduits for deep recharge of soil water. Oecologia 2001, 126, 158–165. [Google Scholar]
  25. Wang, Y.; Shao, M.A.; Zhang, C.; Han, X.; Mao, T.; Jia, X. Choosing an optimal land-use pattern for restoring eco-environments in a semiarid region of the Chinese Loess Plateau. Ecol. Eng. 2015, 74, 213–222. [Google Scholar] [CrossRef]
  26. Geroy, I.J.; Gribb, M.M.; Marshall, H.P.; Chandler, D.G.; Benner, S.G.; McNamara, J.P. Aspect influences on soil water retention and storage. Hydrol. Process. 2011, 25, 3836–3842. [Google Scholar] [CrossRef]
  27. Yang, L.; Wei, W.; Chen, L.D.; Jia, F.; Mo, B. Spatial variations of shallow and deep soil moisture in the semi-arid loess plateau, China. Hydrol. Earth Syst. Sci. 2012, 16, 3199–3217. [Google Scholar] [CrossRef]
  28. Dai, Z. Intensive agropastoralism: Dryland degradation, the Grain-to-Green Program and islands of sustainability in the Mu Us Sandy Land of China. Agric. Ecosyst. Environ. 2010, 138, 249–256. [Google Scholar] [CrossRef]
  29. Feng, X.; Fu, B.; Lu, N.; Zeng, Y.; Wu, B. How ecological restoration alters ecosystem services: An analysis of carbon sequestration in China’s Loess Plateau. Sci. Rep. 2013, 3, 2846. [Google Scholar] [CrossRef] [PubMed]
  30. Lü, Y.H.; Fu, B.J.; Feng, X.M.; Zeng, Y.; Liu, Y.; Chang, R.Y.; Sun, G.; Wu, B.F. A policy-driven large scale ecological restoration: Quantifying ecosystem services changes in the Loess Plateau of China. PLoS ONE 2012, 7, e31782. [Google Scholar] [CrossRef] [PubMed]
  31. Chen, H.; Marter-Kenyon, J.; Lopez-Carr, D.; Liang, X.Y. Land cover and landscape changes in Shaanxi Province during China’s grain for green program (2000–2010). Environ. Monit. Assess. 2015, 187, 644. [Google Scholar] [CrossRef] [PubMed]
  32. Chen, Y.; Wang, K.; Lin, Y.; Shi, W.; Song, Y.; He, X. Balancing green and grain trade. Nat. Geosci. 2015, 8, 739–741. [Google Scholar] [CrossRef]
  33. Wang, Z.Q.; Liu, B.Y.; Liu, G.; Zhang, Y.X. Soil water depletion depth by planted vegetation on the loess plateau. Sci. China Ser. D Earth Sci. 2009, 52, 835–842. [Google Scholar] [CrossRef]
  34. Jin, Z.; Dong, Y.; Wang, Y.; Wei, X.; Wang, Y.; Cui, B.; Zhou, W. Natural vegetation restoration is more beneficial to soil surface organic and inorganic carbon sequestration than tree plantation on the Loess Plateau of China. Scie. Total Environ. 2014, 485–486, 615–623. [Google Scholar] [CrossRef] [PubMed]
  35. Liu, W.; Zhang, X.C.; Dang, T.; Ouyang, Z.; Li, Z.; Wang, J.; Wang, R.; Gao, C. Soil water dynamics and deep soil recharge in a record wet year in the southern Loess Plateau of China. Agric. Water Manag. 2010, 97, 1133–1138. [Google Scholar] [CrossRef]
  36. Yang, L.; Chen, L.; Wei, W.; Yu, Y.; Zhang, H. Comparison of deep soil moisture in two re-vegetation watersheds in semi-arid regions. J. Hydrol. 2014, 513, 314–321. [Google Scholar] [CrossRef]
  37. Chen, H.S.; Shao, M.A.; Li, Y.Y. Soil desiccation in the Loess Plateau of China. Geoderma 2008, 143, 91–100. [Google Scholar] [CrossRef]
  38. Hibbert, A.R. Water yield improvement potential by vagetation management on western rangelands. J. Am. Water Resourc. Assoc. 2007, 19, 375–381. [Google Scholar] [CrossRef]
  39. Wang, Y.Q.; Shao, M.A.; Zhu, Y.J.; Liu, Z.P. Impacts of land use and plant characteristics on dried soil layers in different climatic regions on the Loess Plateau of China. Agric. For. Meteorol. 2011, 151, 437–448. [Google Scholar] [CrossRef]
  40. Fan, J.; Gao, Y.; Wang, Q.; Malhi, S.S.; Li, Y. Mulching effects on water storage in soil and its depletion by alfalfa in the Loess Plateau of northwestern China. Agric. Water Manag. 2014, 138, 10–16. [Google Scholar]
  41. Ward, P.R.; Dunin, F.X.; Micin, S.F. Water use and root growth by annual and perennial pastures and subsequent crops in a phase rotation. Agric. Water Manag. 2002, 53, 83–97. [Google Scholar] [CrossRef]
  42. Cheng, X.; Huang, M.; Shao, M.; Warrington, D.N. A comparison of fine root distribution and water consumption of mature Caragana korshinkii kom grown in two soils in a semiarid region, China. Plant Soil 2008, 315, 149–161. [Google Scholar] [CrossRef]
  43. He, X.L.; Zhao, L.L.; Yang, H.Y. Diversity and spatial distribution of arbuscular mycorrhizal fungi of Caragana korshinskii in the Loess Plateau. Acta Ecol. Sin. 2006, 26, 3835–3840. [Google Scholar]
  44. Chen, H.S.; Shao, M.A.; Li, Y.Y. The characteristics of soil water cycle and water balance on steep grassland under natural and simulated rainfall conditions in the Loess Plateau of China. J. Hydrol. 2008, 360, 242–251. [Google Scholar] [CrossRef]
  45. Kimura, R.; Kamichika, M.; Takayama, N.; Matsuoka, N.; Zhang, X. Heat balance and soil moisture in the Loess Plateau, China. J. Agric. Meteorol. 2004, 60, 103–113. [Google Scholar] [CrossRef]
  46. Zhao, J.; Yan, X.; Guo, J.; Jia, G. Evaluating spatial-temporal dynamics of net primary productivity of different forest types in northeastern China based on improved FORCCHN. PLoS ONE 2012, 7, e48131. [Google Scholar] [CrossRef] [PubMed]
  47. Gao, X.; Wu, P.; Zhao, X.; Wang, J.; Shi, Y.; Zhang, B.; Tian, L.; Li, H. Estimation of spatial soil moisture averages in a large gully of the Loess Plateau of China through statistical and modeling solutions. J. Hydrol. 2013, 486, 466–478. [Google Scholar] [CrossRef]
  48. Fu, W.; Huang, M.; Gallichand, J.; Shao, M. Optimization of plant coverage in relation to water balance in the Loess Plateau of China. Geoderma 2012, 173–174, 134–144. [Google Scholar] [CrossRef]
  49. Sousa, S.; Martins, F.; Alvimferraz, M.; Pereira, M. Multiple linear regression and artificial neural networks based on principal components to predict ozone concentrations. Environ. Model. Softw. 2007, 22, 97–103. [Google Scholar] [CrossRef]
  50. Goncalves, F.L.; Carvalho, L.M.; Conde, F.C.; Latorre, M.R.; Saldiva, P.H.; Braga, A.L. The effects of air pollution and meteorological parameters on respiratory morbidity during the summer in Sao Paulo City. Environ. Int. 2005, 31, 343–349. [Google Scholar] [CrossRef] [PubMed]
  51. Shi, Y.G.; Wu, P.T.; Zhao, X.N.; Li, H.C.; Wang, J.W.; Zhang, B.Q. Statistical analyses and controls of root-zone soil moisture in a large gully of the Loess Plateau. Environ. Earth Sci. 2013, 71, 4801–4809. [Google Scholar] [CrossRef]
  52. Asbjornsen, H.; Goldsmith, G.R.; Alvarado-Barrientos, M.S.; Rebel, K.; Van Osch, F.P.; Rietkerk, M.; Chen, J.; Gotsch, S.; Tobon, C.; Geissert, D.R.; et al. Ecohydrological advances and applications in plant-water relations research: A review. J. Plant Ecol. 2011, 4, 3–22. [Google Scholar] [CrossRef]
  53. Li, Y. Intensification effects on soil anti-scourability by the sea buckthorn root system. J. Soil Water Conserv. 1990, 4, 15–20. [Google Scholar]
  54. Zhu, Y.; Wang, S.; Lin, Y.; Lu, Q. Development of caragana microphylla seedling root system in hilly regions of Loess Plateau. Bull. Soil Water Conserv. 2011, 31, 232–237. [Google Scholar]
  55. Oliveira, R.S.; Bezerra, L.; Davidson, E.A.; Pinto, F.; Klink, C.A.; Nepstad, D.C.; Moreira, A. Deep root function in soil water dynamics in cerrado savannas of central Brazil. Funct. Ecol. 2005, 19, 574–581. [Google Scholar] [CrossRef]
  56. Prieto, I.; Martinez-Tilleria, K.; Martinez-Manchego, L.; Montecinos, S.; Pugnaire, F.I.; Squeo, F.A. Hydraulic lift through transpiration suppression in shrubs from two arid ecosystems: Patterns and control mechanisms. Oecologia 2010, 163, 855–865. [Google Scholar] [CrossRef] [PubMed]
  57. Caldwell, M.M.; Dawson, T.E.; Richards, J.H. Hydraulic lift: Consequences of water efflux from the roots of plants. Oecologia 1998, 113, 151–161. [Google Scholar] [CrossRef]
  58. Horton, J.L.; Hart, S.C. Hydraulic lift: A potentially important ecosystem process. Trends Ecol. Evol. 1998, 13, 232–235. [Google Scholar] [CrossRef]
  59. Guan, X.; Yang, P.; Lü, Y. Relationships between soil particle size distribution and soil physical properties based on multifractal. Trans. Chin. Soc. Agric. Mach. 2011, 42, 44–50. [Google Scholar]
  60. Fu, L.; Sun, H.; Zhang, H.; Lei, X.; Lei, Y.; Tang, S. Effects of diameter at breast height on crown characteristics of Chinese fir under different canopy density conditions. Acta Ecol. Sin. 2013, 33, 2434–2443. [Google Scholar]
  61. Bormann, H. Assessing the soil texture-specific sensitivity of simulated soil moisture to projected climate change by SVAT modelling. Geoderma 2012, 185–186, 73–83. [Google Scholar] [CrossRef]
  62. Thomey, M.L.; Collins, S.L.; Vargas, R.; Johnson, J.E.; Brown, R.F.; Natvig, D.O.; Friggens, M.T. Effect of precipitation variability on net primary production and soil respiration in a chihuahuan desert grassland. Glob. Chang. Biol. 2011, 17, 1505–1515. [Google Scholar] [CrossRef]
  63. Sanchez-Mejia, Z.M.; Papuga, S.A.; Swetish, J.B.; van Leeuwen, W.J.D.; Szutu, D.; Hartfield, K. Quantifying the influence of deep soil moisture on ecosystem albedo: The role of vegetation. Water Resour. Res. 2014, 50, 4038–4053. [Google Scholar] [CrossRef]
  64. Shangguan, Z.P. Soil desiccation occurrence and its impact on forest vegetation in the Loess Plateau of China. Int. J. Sustain. Dev. World Ecol. 2007, 14, 299–306. [Google Scholar] [CrossRef]
  65. Wang, Y.Q.; Shao, M.A.; Liu, Z.P. Large-scale spatial variability of dried soil layers and related factors across the entire Loess Plateau of China. Geoderma 2010, 159, 99–108. [Google Scholar] [CrossRef]
  66. Wei, W.; Chen, L.; Yang, L.; Samadani, F.F.; Sun, G. Microtopography recreation benefits ecosystem restoration. Environ. Sci. Technol. 2012, 46, 10875–10876. [Google Scholar] [CrossRef] [PubMed]
  67. Xu, X.L.; Ma, K.M.; Fu, B.J.; Song, C.J.; Liu, W. Relationships between vegetation and soil and topography in a dry warm river valley, SW China. Catena 2008, 75, 138–145. [Google Scholar] [CrossRef]
Figure 1. Location of the Loess Plateau and the sample points of the study area.
Water 08 00475 g001
Figure 2. SWS changes within deep profiles during the growing season. (A) The SWC under CK (CK-Begin) and abandoned land (AL-Begin) at the beginning of the growing season; (B) The SWC under CK (CK-End) and abandoned land (AL-End) at the end of the growing season; (C) The SWC under HR (HR-Begin) and abandoned land (AL-Begin) at the beginning of the growing season; (D) The SWC under HR (HR-End) and abandoned land (AL-End) at the end of the growing season.
Water 08 00475 g002
Figure 3. SWS statistics during the growing season. SWS-Begin represents SWS at the beginning of the growing season; SWS-End represents SWS at the end of the growing season.
Water 08 00475 g003
Figure 4. SWSR within deep profile during the growing season.
Water 08 00475 g004
Table 1. General information of sample points.
Sample PointsAge
(Year)
Altitude
(m)
Coverage
(%)
Sand
(%)
Silt
(%)
Clay
(%)
CK13692690463915
CK23796980335611
CK3349287053389
CK4329265364315
CK5401075383556 8
CK630125868 59 28 13
CK730124543 23 65 12
CK836121573 21 69 10
CK935104980 35 53 12
CK1040119868 50 45 5
CK1135123270 30 56 13
CK1235134045 ---
CK1340129079 64 30 6
CK1440138358 51 44 5
CK1540124350 61 29 10
CK1637126450 45 35 20
CK1736124565 70 20 9
HR1894670 65 23 12
HR25134052 46 41 12
HR35128950 63 27 10
HR45101185 66 22 12
HR59119170 59 28 13
HR610133670 66 48 13
HR77140975 64 19 16
HR86113185 66 11 24
AL1>3087425 ---
AL2>3097940 ---
AL3>30125860 ---
AL4>30121685 ---
AL5>30124285 ---
AL6>30123050 ---
AL7>30108175 ---
AL8>30137932 ---
AL9>30130015 ---
AL10>30125460 ---
AL11>30119365 ---
AL12>30128280 ---
AL13>30141585 ---
AL14>30127288 ---
Table 2. Pearson correlation coefficients between the SWSR and influencing factors.
VTMAPMATAltSGSAVCCWSPBDFCSOCClaySiltSand
SWSR−0.45 *−0.18 −0.21 0.09 −0.18 0.15 −0.14 0.29 0.04 0.10 −0.53 **−0.41 *0.02 −0.48 *0.48 *
SWSR1−0.34 −0.18 −0.32 0.03 −0.19 0.15 −0.12 0.23 0.08 0.04 −0.58 **−0.50 *0.09 −0.55 **0.56 **
SWSR2−0.47 *−0.16 0.05 −0.01 0.07 −0.18 −0.08 0.21 0.08 0.06 −0.15 −0.14 −0.16 −0.17 0.17
VT1.00
MAP0.58 **1.00
MAT0.53 **0.64 **1.00
Alt0.13 0.51 **0.02 1.00
SG−0.04 −0.05 0.36 −0.30 1.00
SA−0.16 −0.33 −0.07 −0.37 0.25 1.00
VC0.21 0.12 0.27 −0.35 0.09 0.13 1.00
CW−0.12 0.15 0.01 0.30 0.16 −0.24 −0.43 *1.00
SP−0.02 −0.14 −0.07 −0.12 −0.08 −0.20 0.09 −0.31 1.00
BD−0.32 −0.61 **−0.72 **−0.17 −0.40 0.21 −0.11 −0.19 0.30 1.00
FC0.25 0.38 0.32 0.49 *0.11 −0.39 −0.15 0.18 −0.11 −0.22 1.00
SOC0.54 **0.74 **0.58 **0.21 0.16 −0.18 0.42 *−0.10 −0.21 −0.42 *0.34 1.00
Clay0.41 *0.51 *0.29 0.04 −0.17 0.03 0.30 −0.04 0.35 −0.08 −0.17 0.23 1.00
Silt0.51 *0.56 **0.71 **0.08 0.31 −0.17 0.17 −0.07 −0.02 −0.60 **0.44 *0.66 **0.03 1.00
Sand−0.50 *−0.58 **−0.67 **−0.01 −0.24 0.15 −0.23 0.13 −0.15 0.45 *−0.34 −0.61 **−0.30 −0.90 **1.00
Notes: * p < 0.05, ** p < 0.01. Abbreviations: SWSR, SWSR at 100–500 cm depth; SWSR1, SWSR at 100–340 cm depth; SWSR2, SWSR at 340–500 cm depth; VT, vegetation type; MAP, mean annual precipitation; MAT, mean annual temperature; Alt, altitude; SG, slope gradient; SA, slope aspect; VC, vegetation coverage; CW, crown width; SP, soil penetration; BD, bulk density; FC, field capacity; SOC, soil organic carbon; Clay, clay content; Silt, silt content; Sand, sand content.
Table 3. Principal component analysis of the influencing factors after varimax rotation of the axes.
VariablesComponent
12345
VT0.600.260.350.150.05
MAP0.720.450.42−0.110.17
MAT0.88−0.110.160.000.04
Alt0.090.820.05−0.210.15
SG0.45−0.69−0.29−0.040.05
SA−0.23−0.580.110.320.38
VC0.28−0.280.320.580.11
CW0.000.090.08−0.860.20
SP−0.08−0.030.190.16−0.92
BD−0.770.09−0.010.35−0.23
FC0.460.61−0.410.15−0.01
SOC0.740.240.160.330.28
Clay0.190.030.910.07−0.21
Silt0.910.05−0.160.09−0.09
Sand−0.84−0.02−0.07−0.150.26
Notes: The bold values in the table (above 0.70) indicate close relationships between the variables and the principal components.
Table 4. Stepwise multiple linear regression for SWSR.
Depth (cm)ModelVariablesCoefficientsStandard Errort-ValueSignificance LevelAdjusted R2
100–5001Constant68.7353.181.290.21
Silt−2.551.00−2.560.020.20
2Constant−54.8368.13−0.810.43
Silt−2.390.89−2.680.01
CW0.750.302.540.020.35
100–3401Constant−148.8929.26−5.09<0.01
Sand2.250.713.15<0.010.28
Notes: Abbreviations: Silt, silt content; CW, crown width; Sand, sand content.

