1. Introduction
Two decades after Rakocy [
1] first coined the term aquaponics, Love et al. [
2] conducted an international survey of aquaponic practitioners. However, 90% of the respondents in that study were from the US, Canada, and Australia, providing little information about activities in Europe or other continents. The reasons for the lack of respondents in the previous study are unclear. In one of the few studies on aquaponic production in Europe, Goddek et al. [
3] mention that some efforts have been made to set up systems, but that commercial up-scaling remains a challenge. Hence, quantitative information about the state-of-the-art of implementation of aquaponics in Europe is of interest at this stage of the development of the technology.
The field of aquaponics is growing internationally, with more and more scientific papers on different aspects, such as the effects of pH on bacterial nitrification [
4] or the possible profit margins of commercial practice [
5]. In terms of large-scale production, there are several hundred large systems (>100 m
2) around the world, and a recent report lists 10 such systems either working or under construction in Europe [
6].
The first reference to research in Europe was by Graber and Junge [
7], but little is known about the types of facilities being used, production figures, the fish and crops being grown, the sources of funding, and the main priorities of practitioners and commercial facilities on the continent. With the current study, our aim was to address these questions and provide a more general idea about the state of the art of aquaponic research and production actors and facilities in Europe.
3. Results
3.1. Demographics
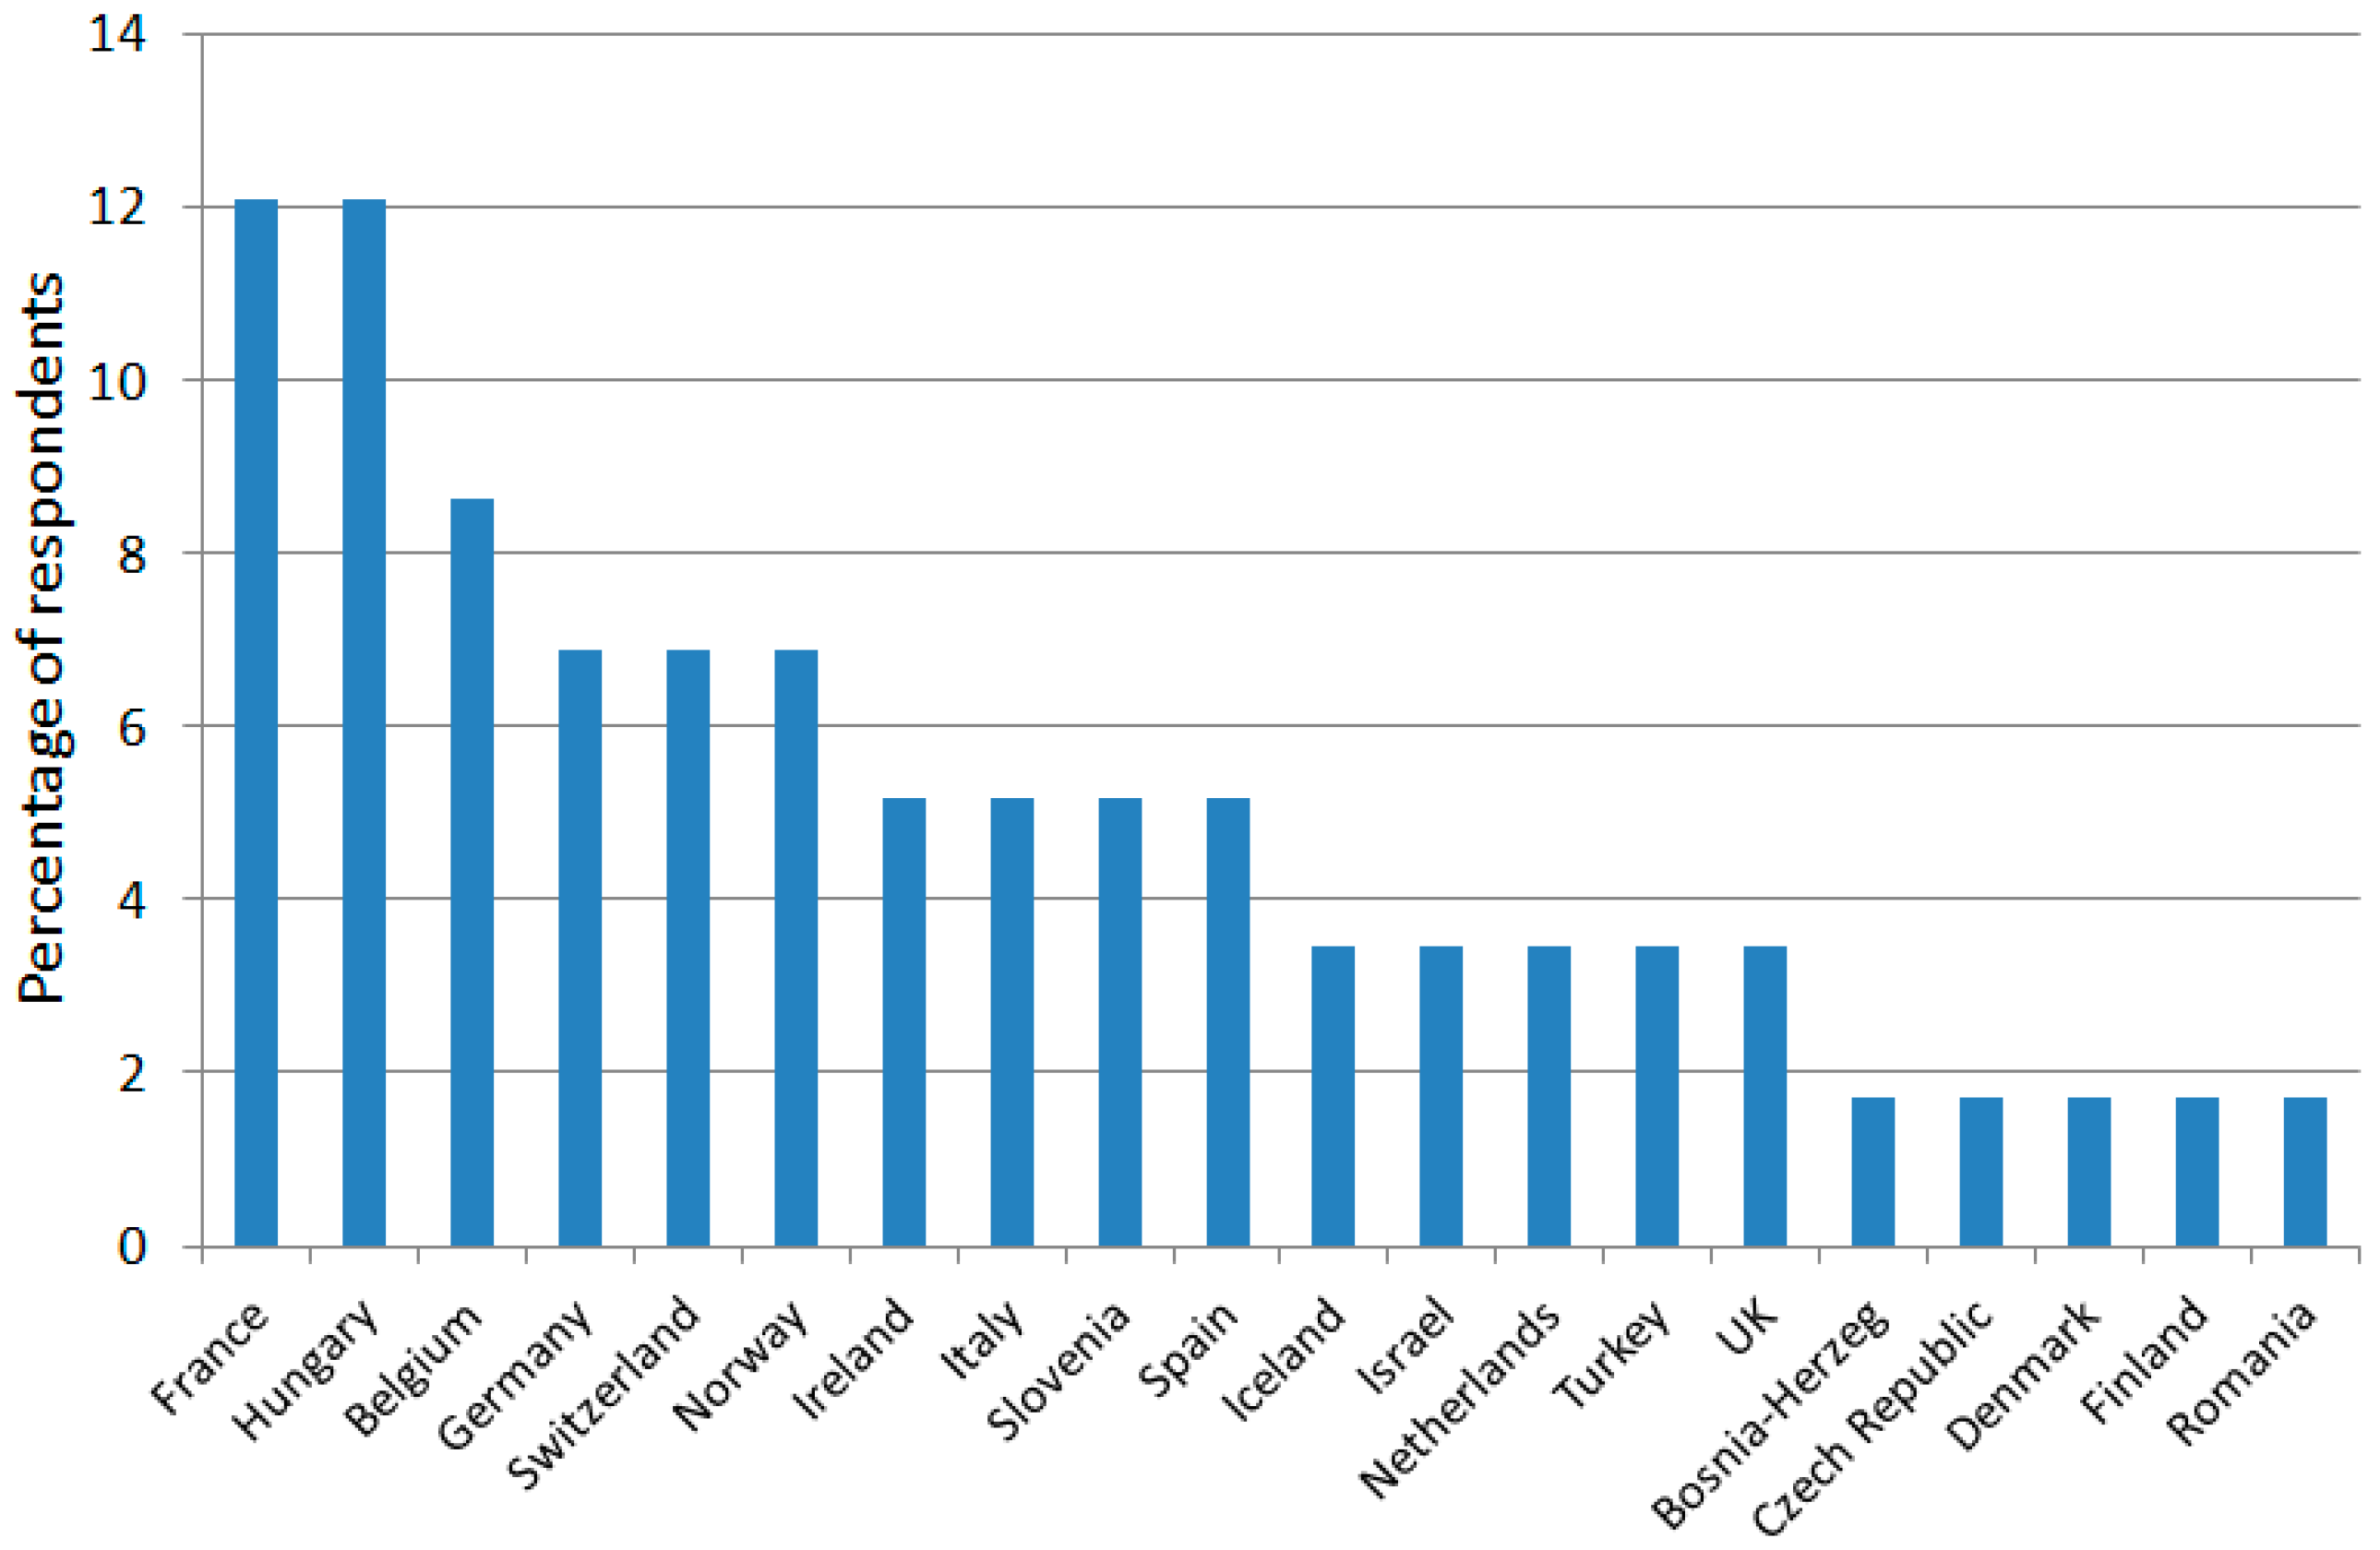
We obtained replies from aquaponics practitioners in 21 countries in Europe (see
Figure 1,
n = 58 respondents stated their country of residence, out of 68 participants). Regarding their primary interest, most respondents cited research in aquaponics (75%), followed by education (41.1%), production (30.8%), and urban farming (5.8%). None of the respondents reported “growing your own food” as a primary interest.
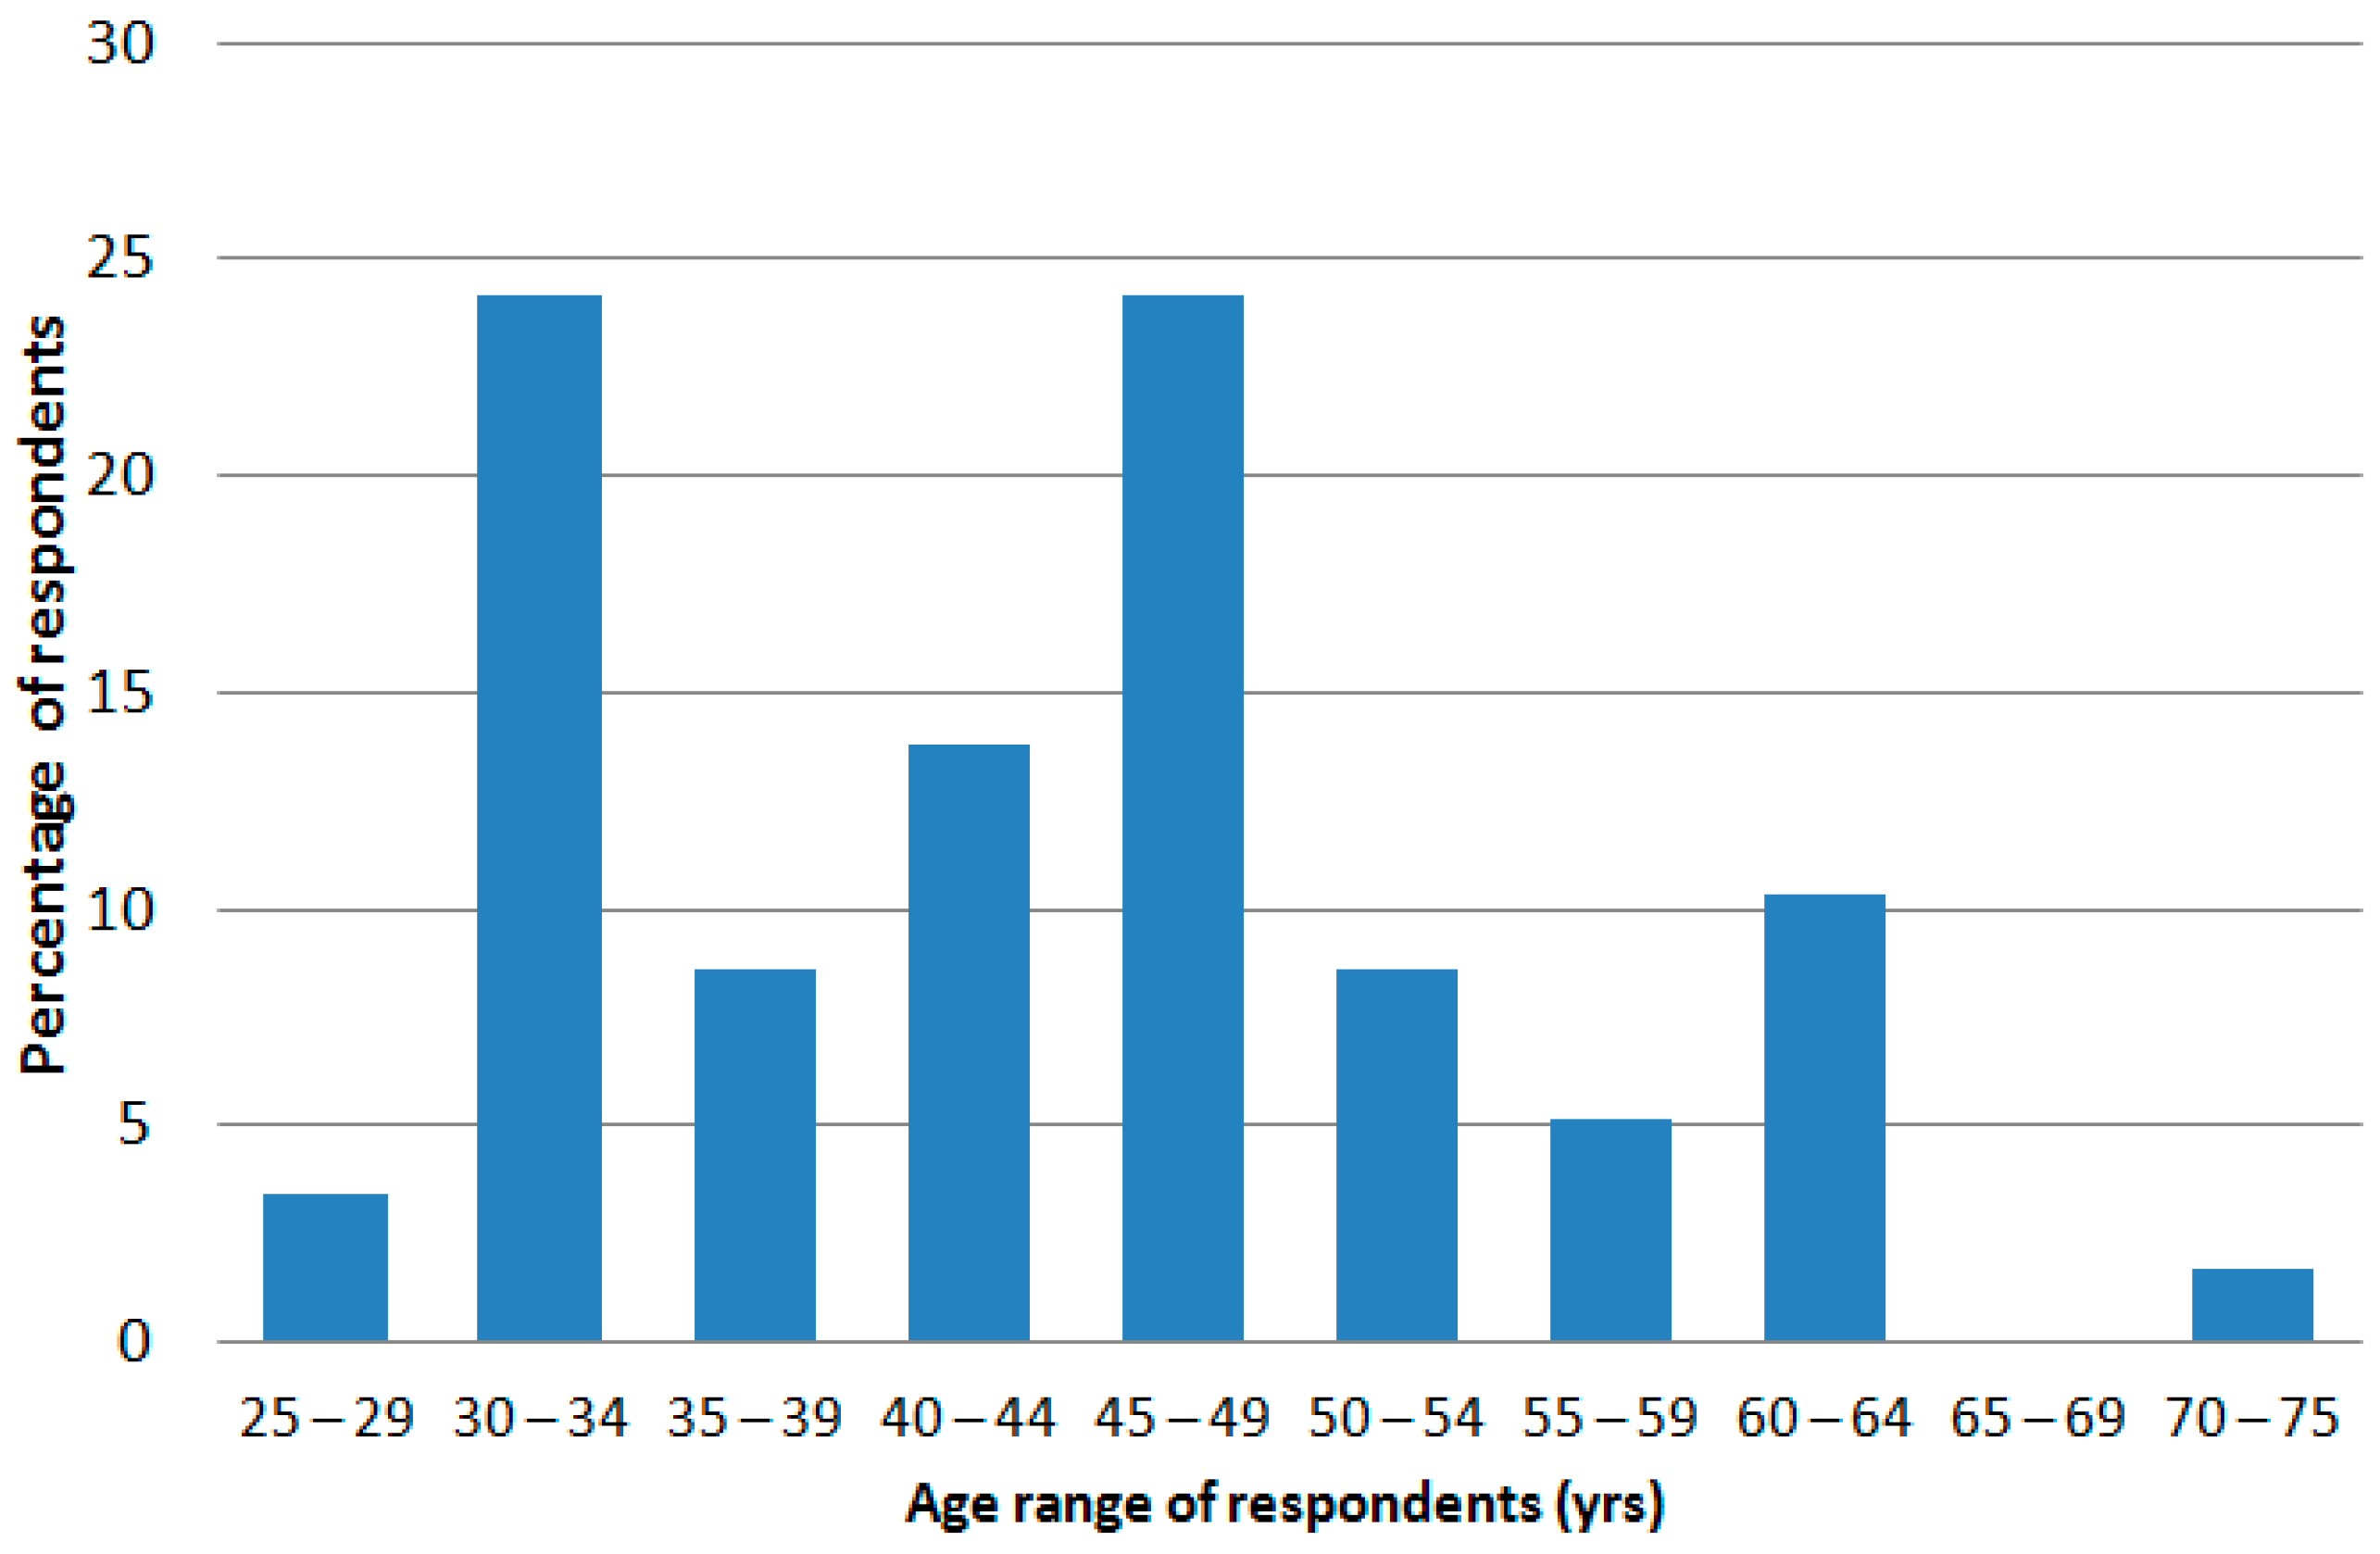
Regarding participating organizations, 42.6% were universities, 19.1% were commercial, 14.7% were non-profit organizations, and 8.8% were vocational schools (14.7% not specified). Regarding activities in aquaponics during the past 12 months, 11.8% of the respondents had sold plant or fish crops, 23.5% had sold materials, 64.7% had trained people, and 29.4% had started an aquaponics system. Most of the respondents were male (66.2%) and had a post-graduate degree (91.7%). Very few respondents were under 30 years old (
n = 3 or 5.1%, see
Figure 2 for age distribution).
3.2. Facilities
The majority of respondents (74.5%) set up their aquaponics systems after the year 2010. One installation was bought as a kit, while 73.6% were self-designed, and the remaining 24.5% were designed with a consultant. The data on total water volume of the whole aquaponic system was quite varied, ranging from 10 to 250,000 L, as well as the footprint (range 1–1600 m2). On average, the surface area allotted to plants was 3.5 times more than the surface area taken up by the fish.
Most systems had biological filters (71.8%), with (30.2%) or without (20.8%) a solids filter, and sometimes UV was used as well (20.8%). Only 9.4% used media-filled boxes as the filter. Most units were housed in a greenhouse (45.3%), followed by inside a building (28.3%) or outdoors (13.2%). Four units were on rooftops (7.5%), and three were inside a home (5.7%).
3.3. Fish and Crops
Only 42 respondents answered the question about the range of fish production, and of those, 18 had an annual production of 1–50 kg. Overall, 67.5% of the respondents produced less than 100 kg per annum, and 12 producers (30.3%) produced more than 1000 kg. Plant harvest was also moderate, with 55.8% of the respondents producing less than 100 kg, and only 1 respondent (2.3%) producing more than 10,000 kg.
Most respondents (90%) reported feeding fish with feed pellets (n = 46), while three fed with aquatic plants, and one with live feed and food scraps. Regarding crop production methods, most people used floating rafts (30%), media beds (25%), nutrient film technique (15%), and vertical towers (4%). No one reported using wicking baskets or Dutch buckets.
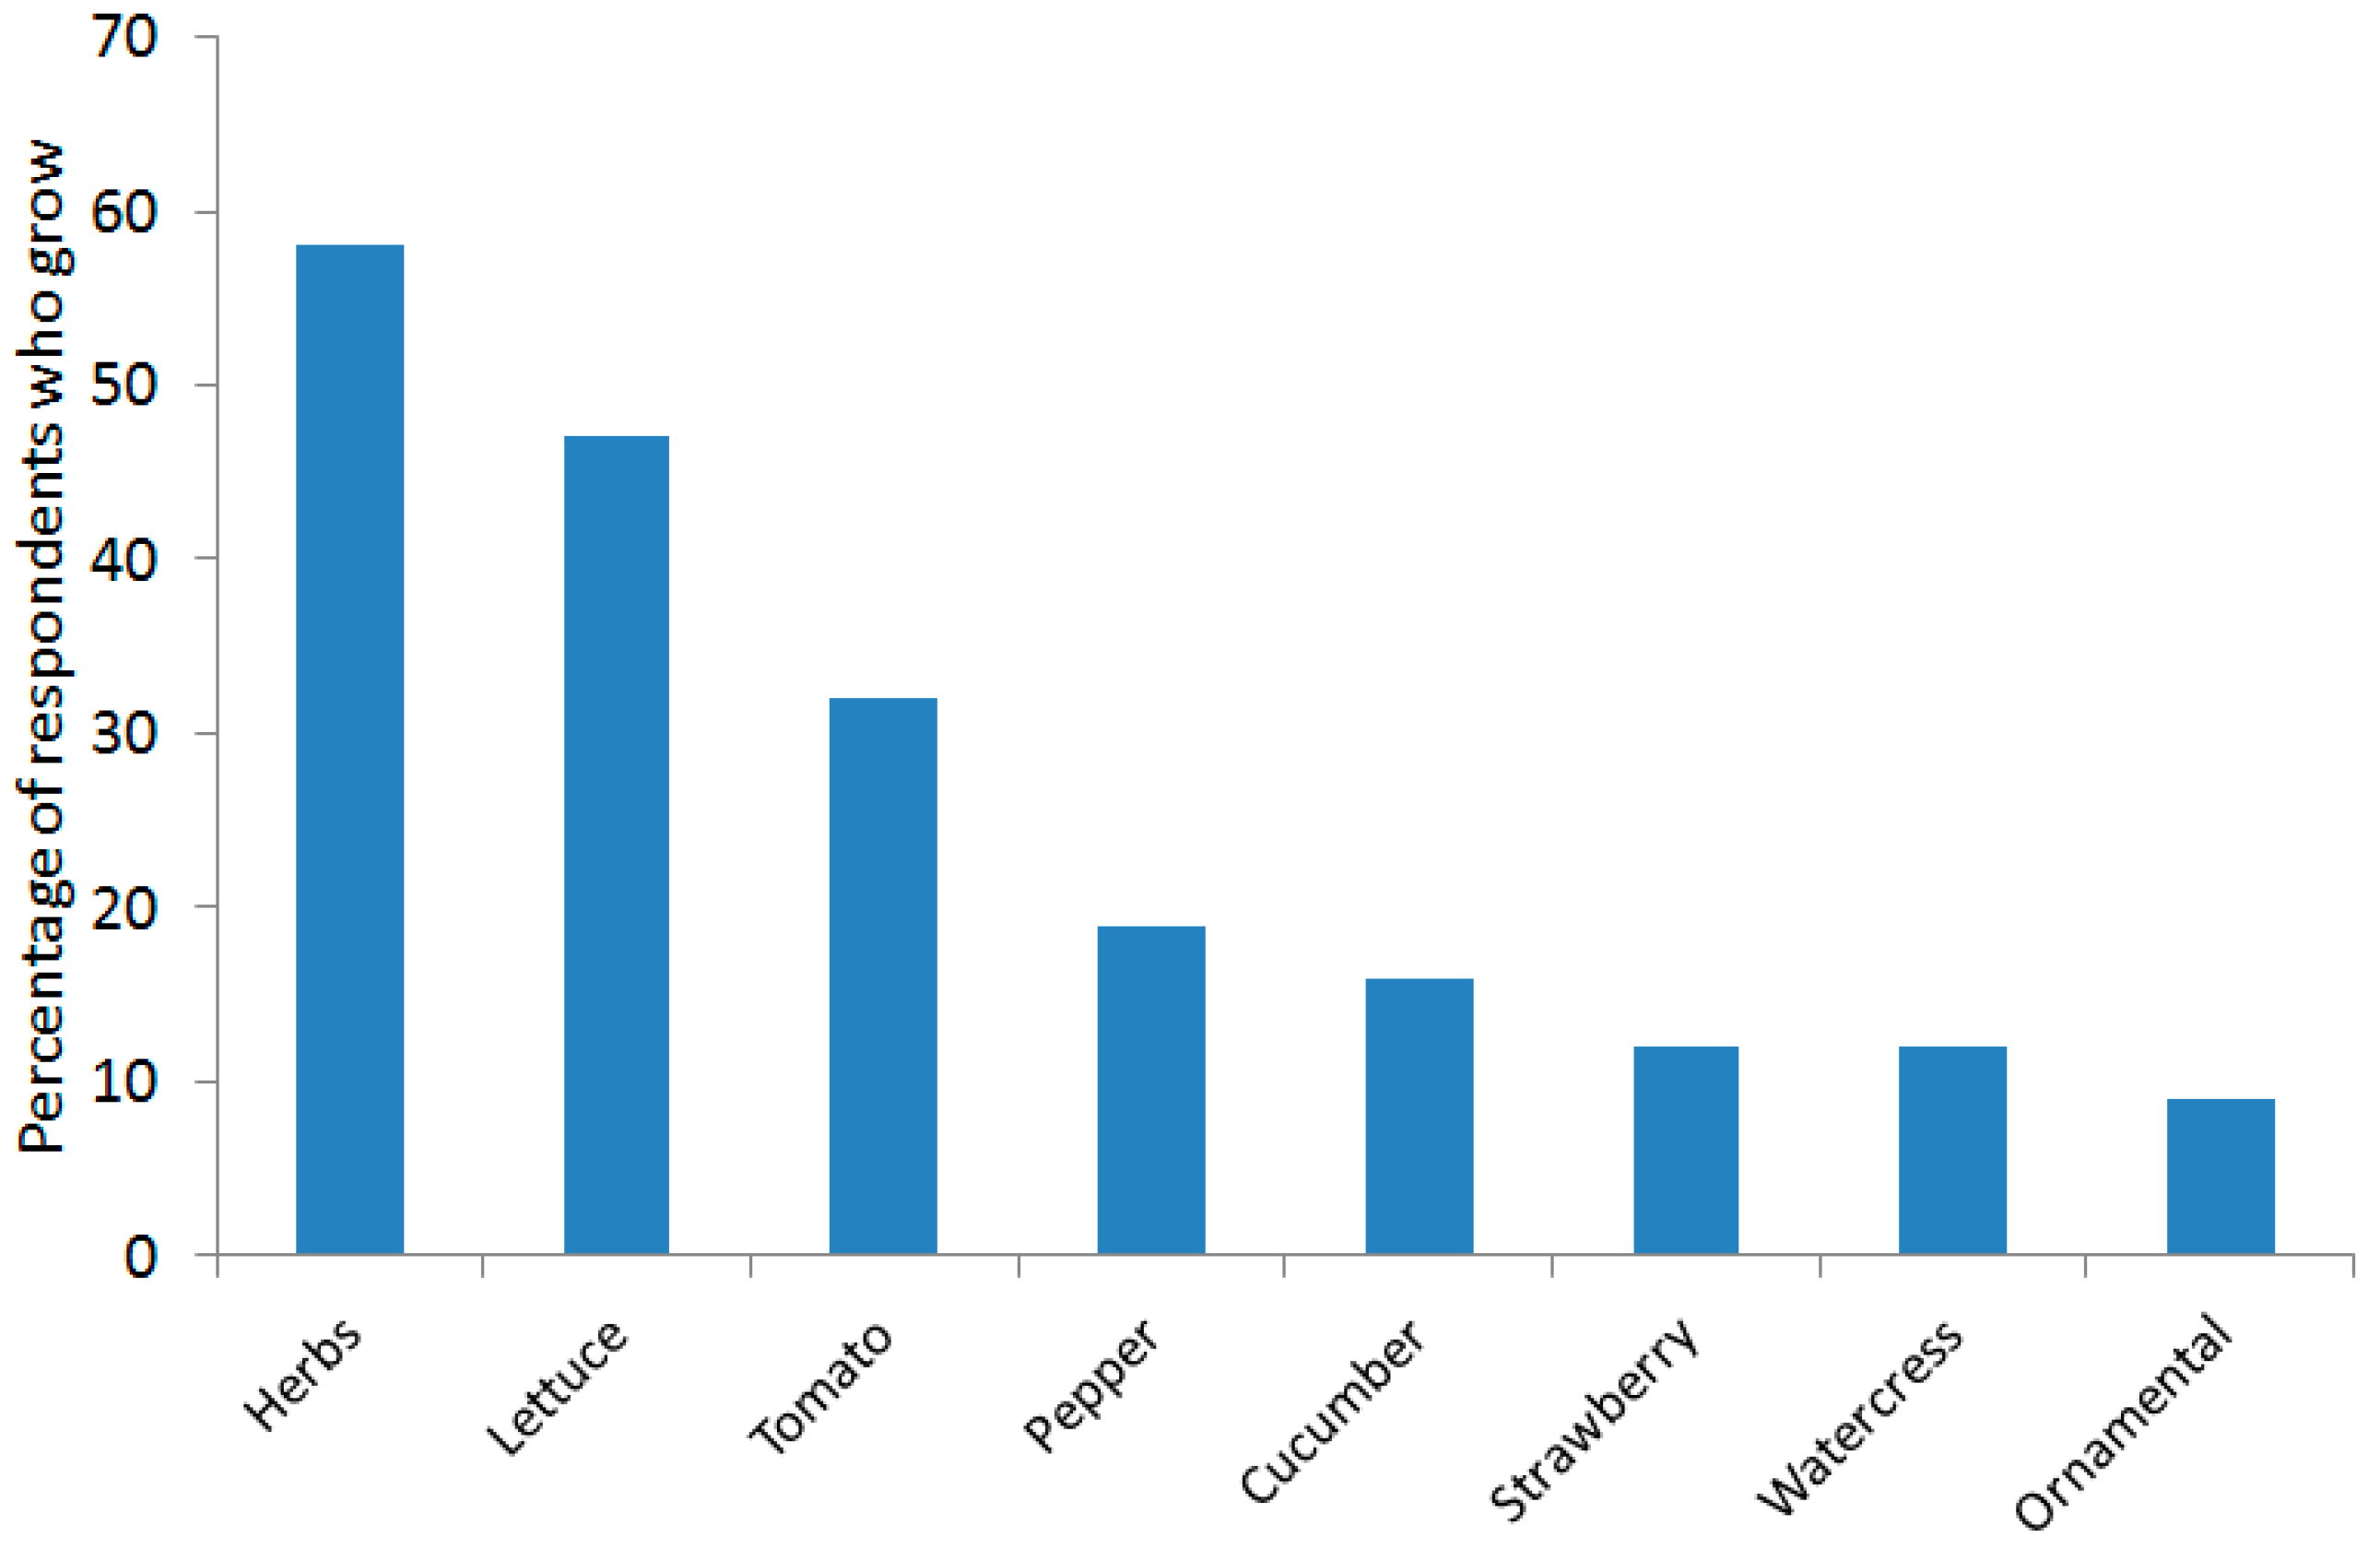
Regarding fish species, the most commonly grown were tilapia (27%), catfish (10%), ornamental fish (8%), and trout (7%). Bass (4%) and perch (2%) were also grown, and no one reported using blue gill. Seventeen people reported using other species of fish. Regarding plant species (
Figure 3), the range was quite large (all species mentioned in the survey were grown by at least one respondent, except for carrots); however, the three most frequently grown were herbs (58%, including basil), lettuce (47%, including salad greens), and tomatoes (32%).
3.4. Funding
Most respondents said that their funding sources in the past 36 months were from government grants (n = 29, 35.3%), followed by private (n = 10, 12.2%) and personal investment (n = 10, 12.2%). No respondent replied that they had received a bank loan, and 19 respondents stated they received income from either selling fish or plants, supplies, giving workshops and courses, or charging consulting fees.
Most respondents (80.4%) answered that aquaponics was not their primary production, with only seven respondents reporting it was (15.2%). Investment in the past 36 months was less than 5000 euros for 53.2% of respondents. Most respondents (n = 30, 71.4%) did not generate income from gross sales (selling fish or plants).
3.5. Priorities
Some final questions were related to personal priorities in working with aquaponics. Approximately 25% of respondents agreed that they thought aquaponics could help to grow their own food, improve personal health, or improve the health of members of the community. Most respondents agreed or strongly agreed to using aquaponics in education (98%), to improve sustainability of food production (96%), to aid in development (68.6%), and to decrease the effects of climate change (68% agreed or strongly agreed).
Regarding where practitioners looked for information, most said they asked other growers (
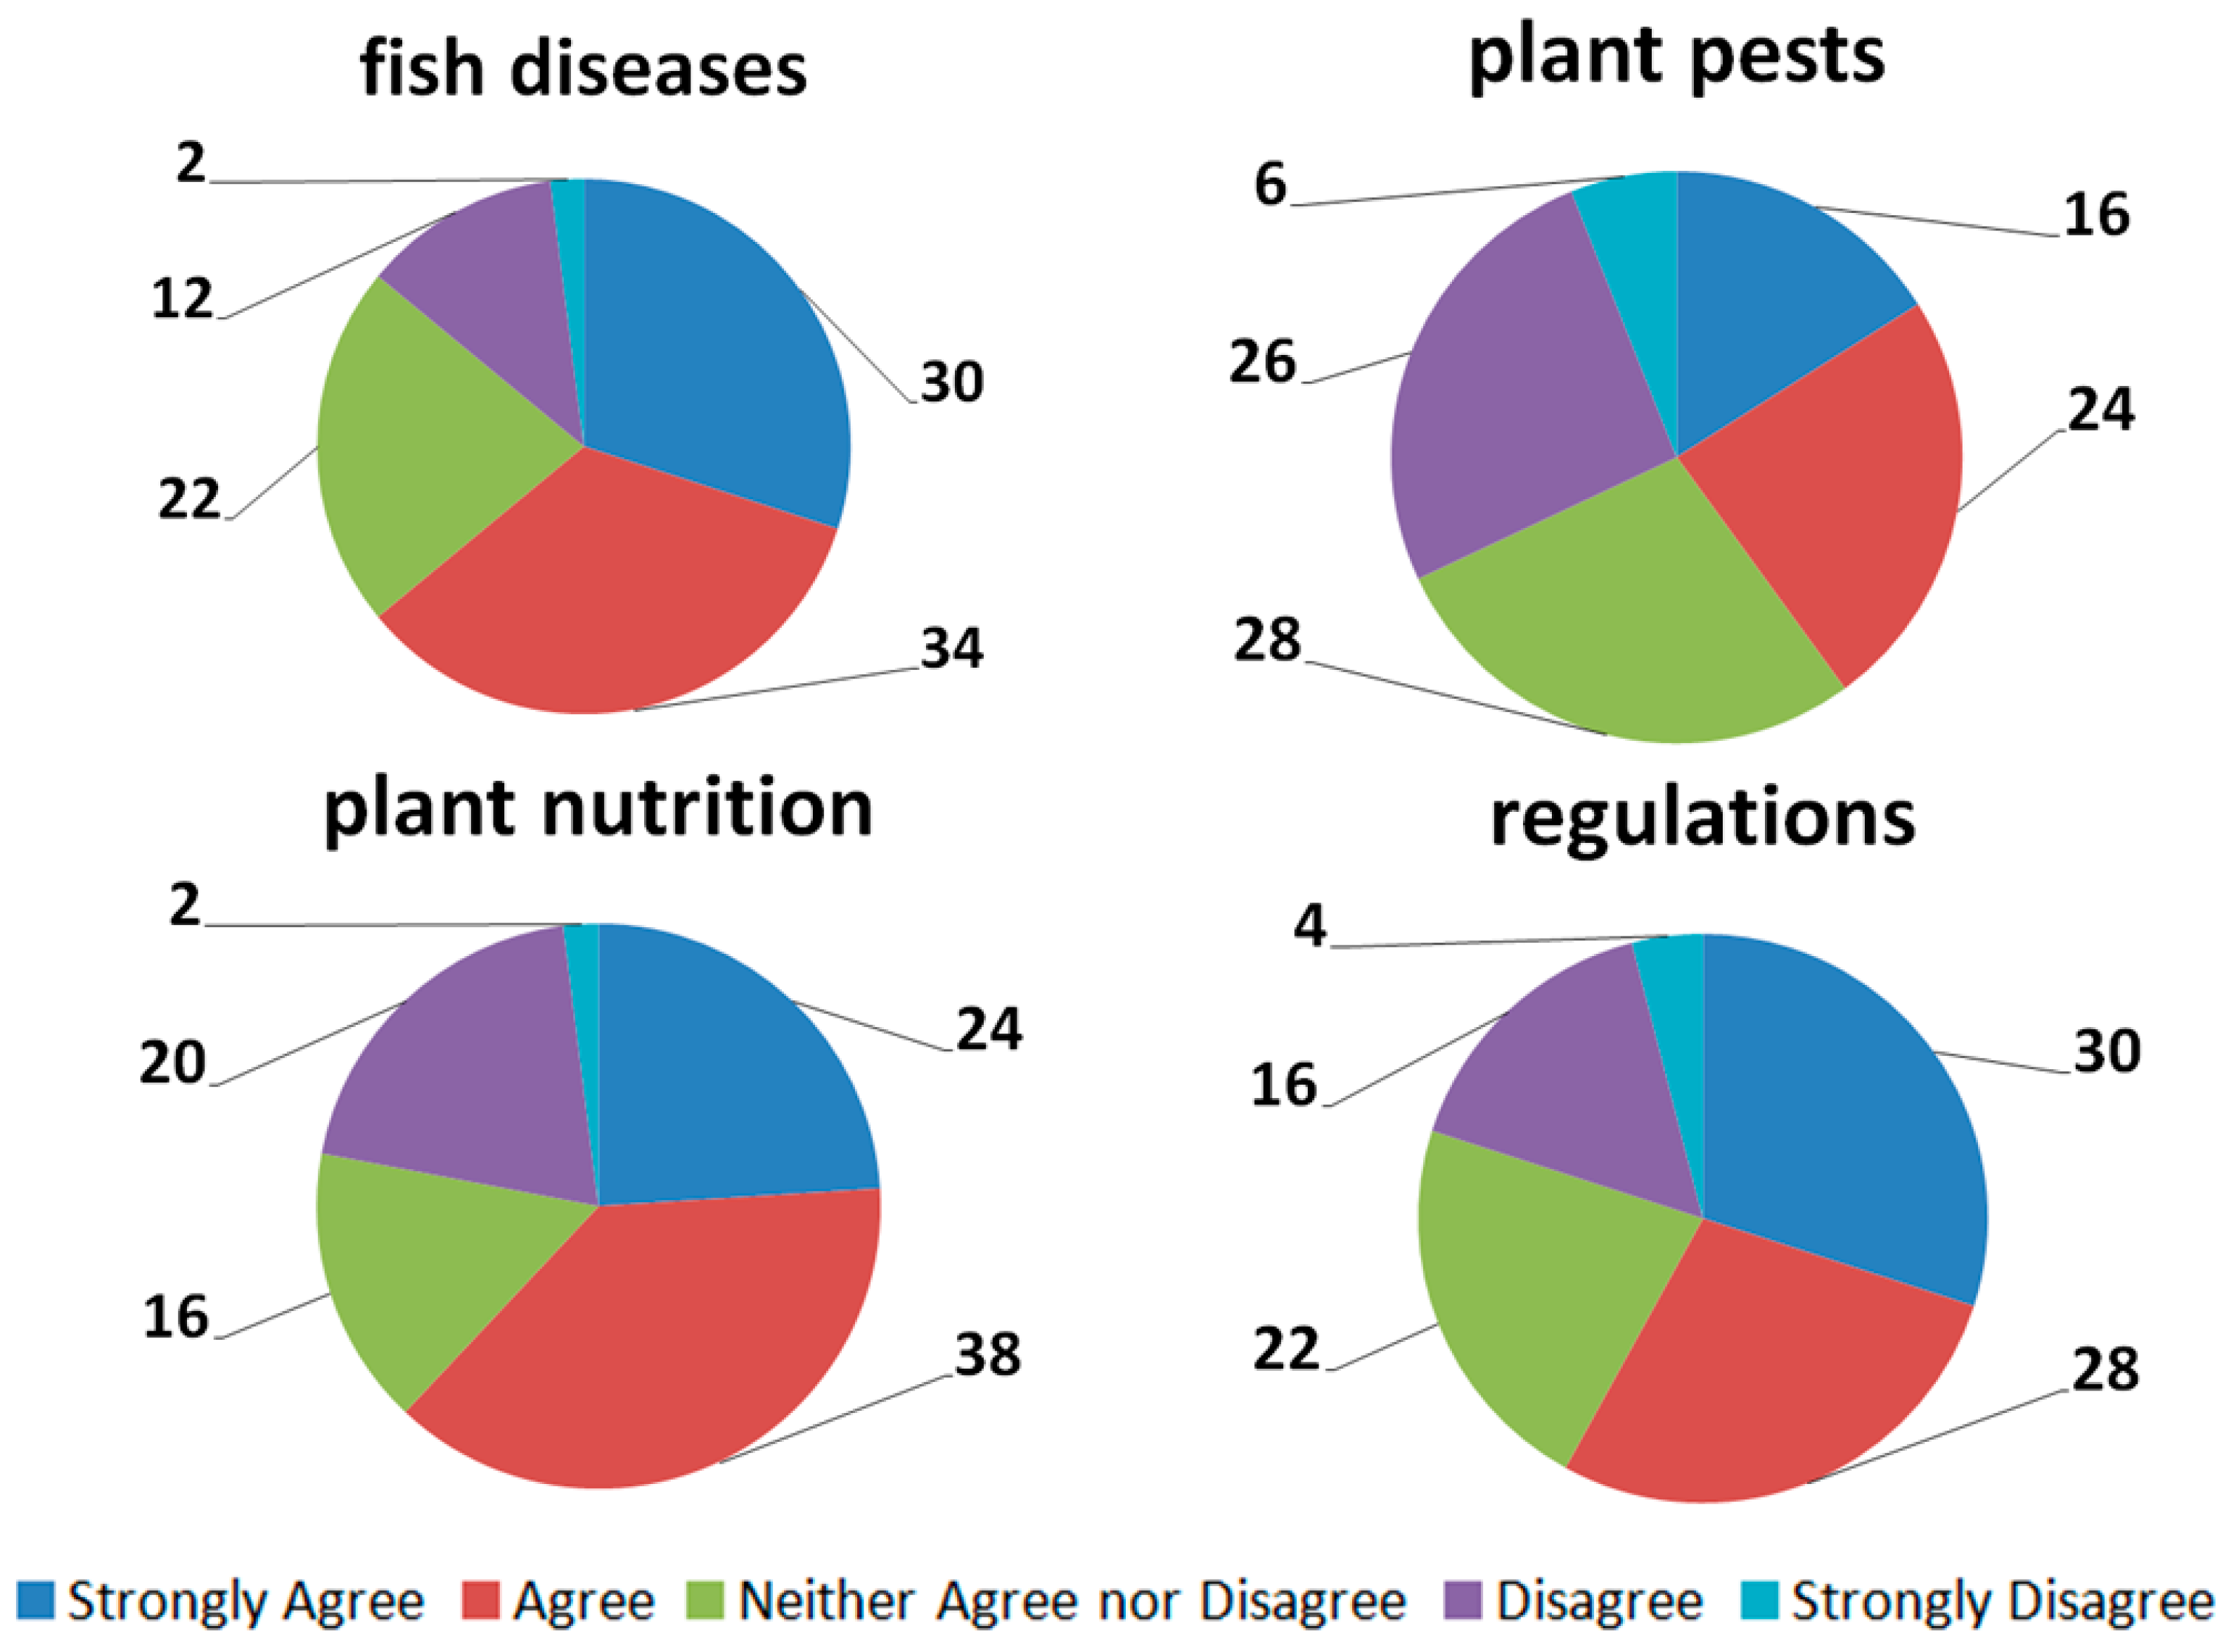
n = 31 respondents), looked for information online (32), in print (30), at workshops (26), and via universities (33), but very few depended on government or federal agencies (4). Regarding personal knowledge of aquaponic facilities (
Figure 4), most respondents said they agreed or strongly agreed that they knew how to modify the system pH (94%), deal with fish diseases (64%), control plant nutrition (62%), fix plumbing issues (80%), measure fish growth (86%), eliminate plant pests (40%), and understood regulations for processing and selling fish (58%).
4. Discussion
Since 2004, more than 70 scientific papers have been published on aquaponics (data from Web of Science), but little is known about aquaponic practitioners in Europe. The results of the current study suggest that most of the aquaponic facilities being used are small (surface area < 100 m
2), which coincides with [
6]. The size range of individual aquaponic systems was very wide, and coincides with studies carried out by Love et al. [
2], who found that volumes among respondents varied over five orders of magnitude.
Respondents were from all over Europe, which—despite still being a rather modest sample (
n = 68 respondents)—gives a better idea of aquaponic practitioners in Europe than an earlier study [
2], where most respondents were from USA/Australia, three from the UK, and one respondent each from Italy, Malta, Hungary, and Portugal. The latter study also included many respondents who were enthusiasts, while the current study included mostly scientists and commercial producers. This difference is most probably due to the strong involvement of the COST FA1305 participants to disseminate the survey (snowball strategy for data generation). Additionally, we may not have used the right channels (e.g., more advertising about the survey on social networks or a prize reward for participating) to attract more enthusiasts, or they may not have been comfortable enough using English. In any case, within the context of a highly-regulated food production system, it will probably be up to commercial producers, scientists, and administration to work together to improve production and policies that promote the growth of aquaponics in Europe.
Although the potential fish-plant combinations are quite high, the main fish and plant crops being used were tilapia and herbs. Growers producing more than 1000 kg of fish grew tilapia in addition to other species, and always used pelleted feed. This coincides with the idea of fish production in greenhouses, and hence with warmer water. Love et al. [
2] also reported more tilapia production, followed by ornamental fish (catfish was second in the current study, and ornamental fish was third). In another study, Love et al. [
8] found that fish production was less profitable than plant production in the aquaponic units analyzed, based on the same survey questions in [
2]. That may help to explain why we found more plant production than fish production in the current study. Plant growing cycles are also shorter, and the area used for their production (mostly horizontal), tends to be larger than for fish, both of which suggest more profits from plant versus fish production in those systems.
The few facilities with high fish production seemed to be tending towards decoupled systems where waste-water can be alternatively given to plants or passed through a biofilter [
9]. Most of the current aquaponic units were new and funded by government subsidies. Only 11 invested their own money, and only four declared making an income from their production, which is coherent with the fact that our data set describes mostly research facilities. In contrast, the study by Love et al. [
5] mostly reached units in North America that are privately funded and represent the primary source of income for growers. Widespread research in Europe could encourage the development of aquaponics, but more private investment will be needed to ensure technology transfer to companies and the development of a profitable industry. Regarding the priorities of the actors involved, most of the respondents focused on sustainability; however, most did not consider aquaponics a suitable technology to “grow my own food”, which suggests that aquaponics in Europe is viewed more as part of industrial food production than as local food provision. Again, that is in contrast to North America, where there are reports of aquaponics already being used as a community-based food source [
10].
The USA and Australia benefitted from early research in aquaponics (1980s) and strong entrepreneurial leadership, so many medium-sized aquaponic facilities (500 m
2) began commercial production before their European counterparts. The results of our survey suggest that the research base in aquaponics in Europe is still stronger than profit-based activity. This is probably also due to the existing regulatory voids regarding the commercialization of aquaponic products (e.g., [
11]) and long administrative authorization processes. Overall, we estimate that there are approximately 20 large commercial aquaponic operations (>1500 m
2) that have recently opened or are under construction in Europe, most of them in an urban environment. It remains to be seen whether these efforts confirm a shift towards a sustainable development of a profitable European aquaponics industry.


 ,
, 


