Article

Implications of Texture and Erodibility for Sediment Retention in Receiving Basins of Coastal Louisiana Diversions

1
Department of Oceanography and Coastal Sciences, Louisiana State University, Baton Rouge, LA 70803, USA
2
Coastal Studies Institute, Louisiana State University, Baton Rouge, LA 70803, USA
3
Department of Geology and Geophysics, Louisiana State University, Baton Rouge, LA 70803, USA
4
State Key Laboratory of Estuarine and Coastal Research, East China Normal University, Shanghai 200062, China
*
Author to whom correspondence should be addressed.
Water 2016, 8(1), 26; https://doi.org/10.3390/w8010026
Submission received: 15 November 2015 / Revised: 8 January 2016 / Accepted: 12 January 2016 / Published: 20 January 2016

Abstract

:
Although the Mississippi River deltaic plain has been the subject of abundant research over recent decades, there is a paucity of data concerning field measurement of sediment erodibility in Louisiana estuaries. Two contrasting receiving basins for active diversions were studied: West Bay on the western part of Mississippi River Delta and Big Mar, which is the receiving basin for the Caernarvon freshwater diversion. Push cores and water samples were collected at six stations in West Bay and six stations in Big Mar. The average erodibility of Big Mar sediment was similar to that of Louisiana shelf sediment, but was higher than that of West Bay. Critical shear stress to suspend sediment in both West Bay and Big Mar receiving basins was around 0.2 Pa. A synthesis of 1191 laser grain size data from surficial and down-core sediment reveals that silt (4–63 μm) is the largest fraction of retained sediment in receiving basins, larger than the total of sand (>63 μm) and clay (<4 μm). It is suggested that preferential delivery of fine grained sediment to more landward and protected receiving basins would enhance mud retention. In addition, small fetch sizes and fragmentation of large receiving basins are favorable for sediment retention.

1. Introduction

Deltas occupy only 5% of the Earth’s surface, but nourish over a half billion people around the world. This leads to an average population density of about 500/km2 along deltaic coasts, more than 10 times of the world average [1]. Many river deltas worldwide are disappearing, leading to significant threats to our natural, economic and social systems [2]. This is mainly due to the combined effects of anthropogenic changes to sediment supply and river flow, subsidence, and global sea level rise. Sinking deltaic coasts pose an immediate threat to millions of residents who live in coastal megacities [3], and scientists have been trying to find strategies dealing with the challenge of “building land with rising sea” [4,5].
Being home of over two million people, Louisiana′s deltaic coast supports the largest commercial fishery for the lower 48 U.S. states, supplies 90% of the nation′s outer continental shelf oil and gas, and facilitates about 20% of the nation′s annual waterborne commerce. Louisiana wetlands play a number of important roles in the environment, primarily life habitat, flood control and sediment retention; the wetlands also buffer the storm surge and protect the coast from severe damage during hurricanes. These wetlands, however, are in peril as Louisiana is currently responsible for about 90% of the nation′s coastal wetland loss [6]. Since the 1930s, coastal Louisiana has lost over 4660 km2 of land, diminishing wetland habitats, increasing flood risk, and endangering coastal environment.
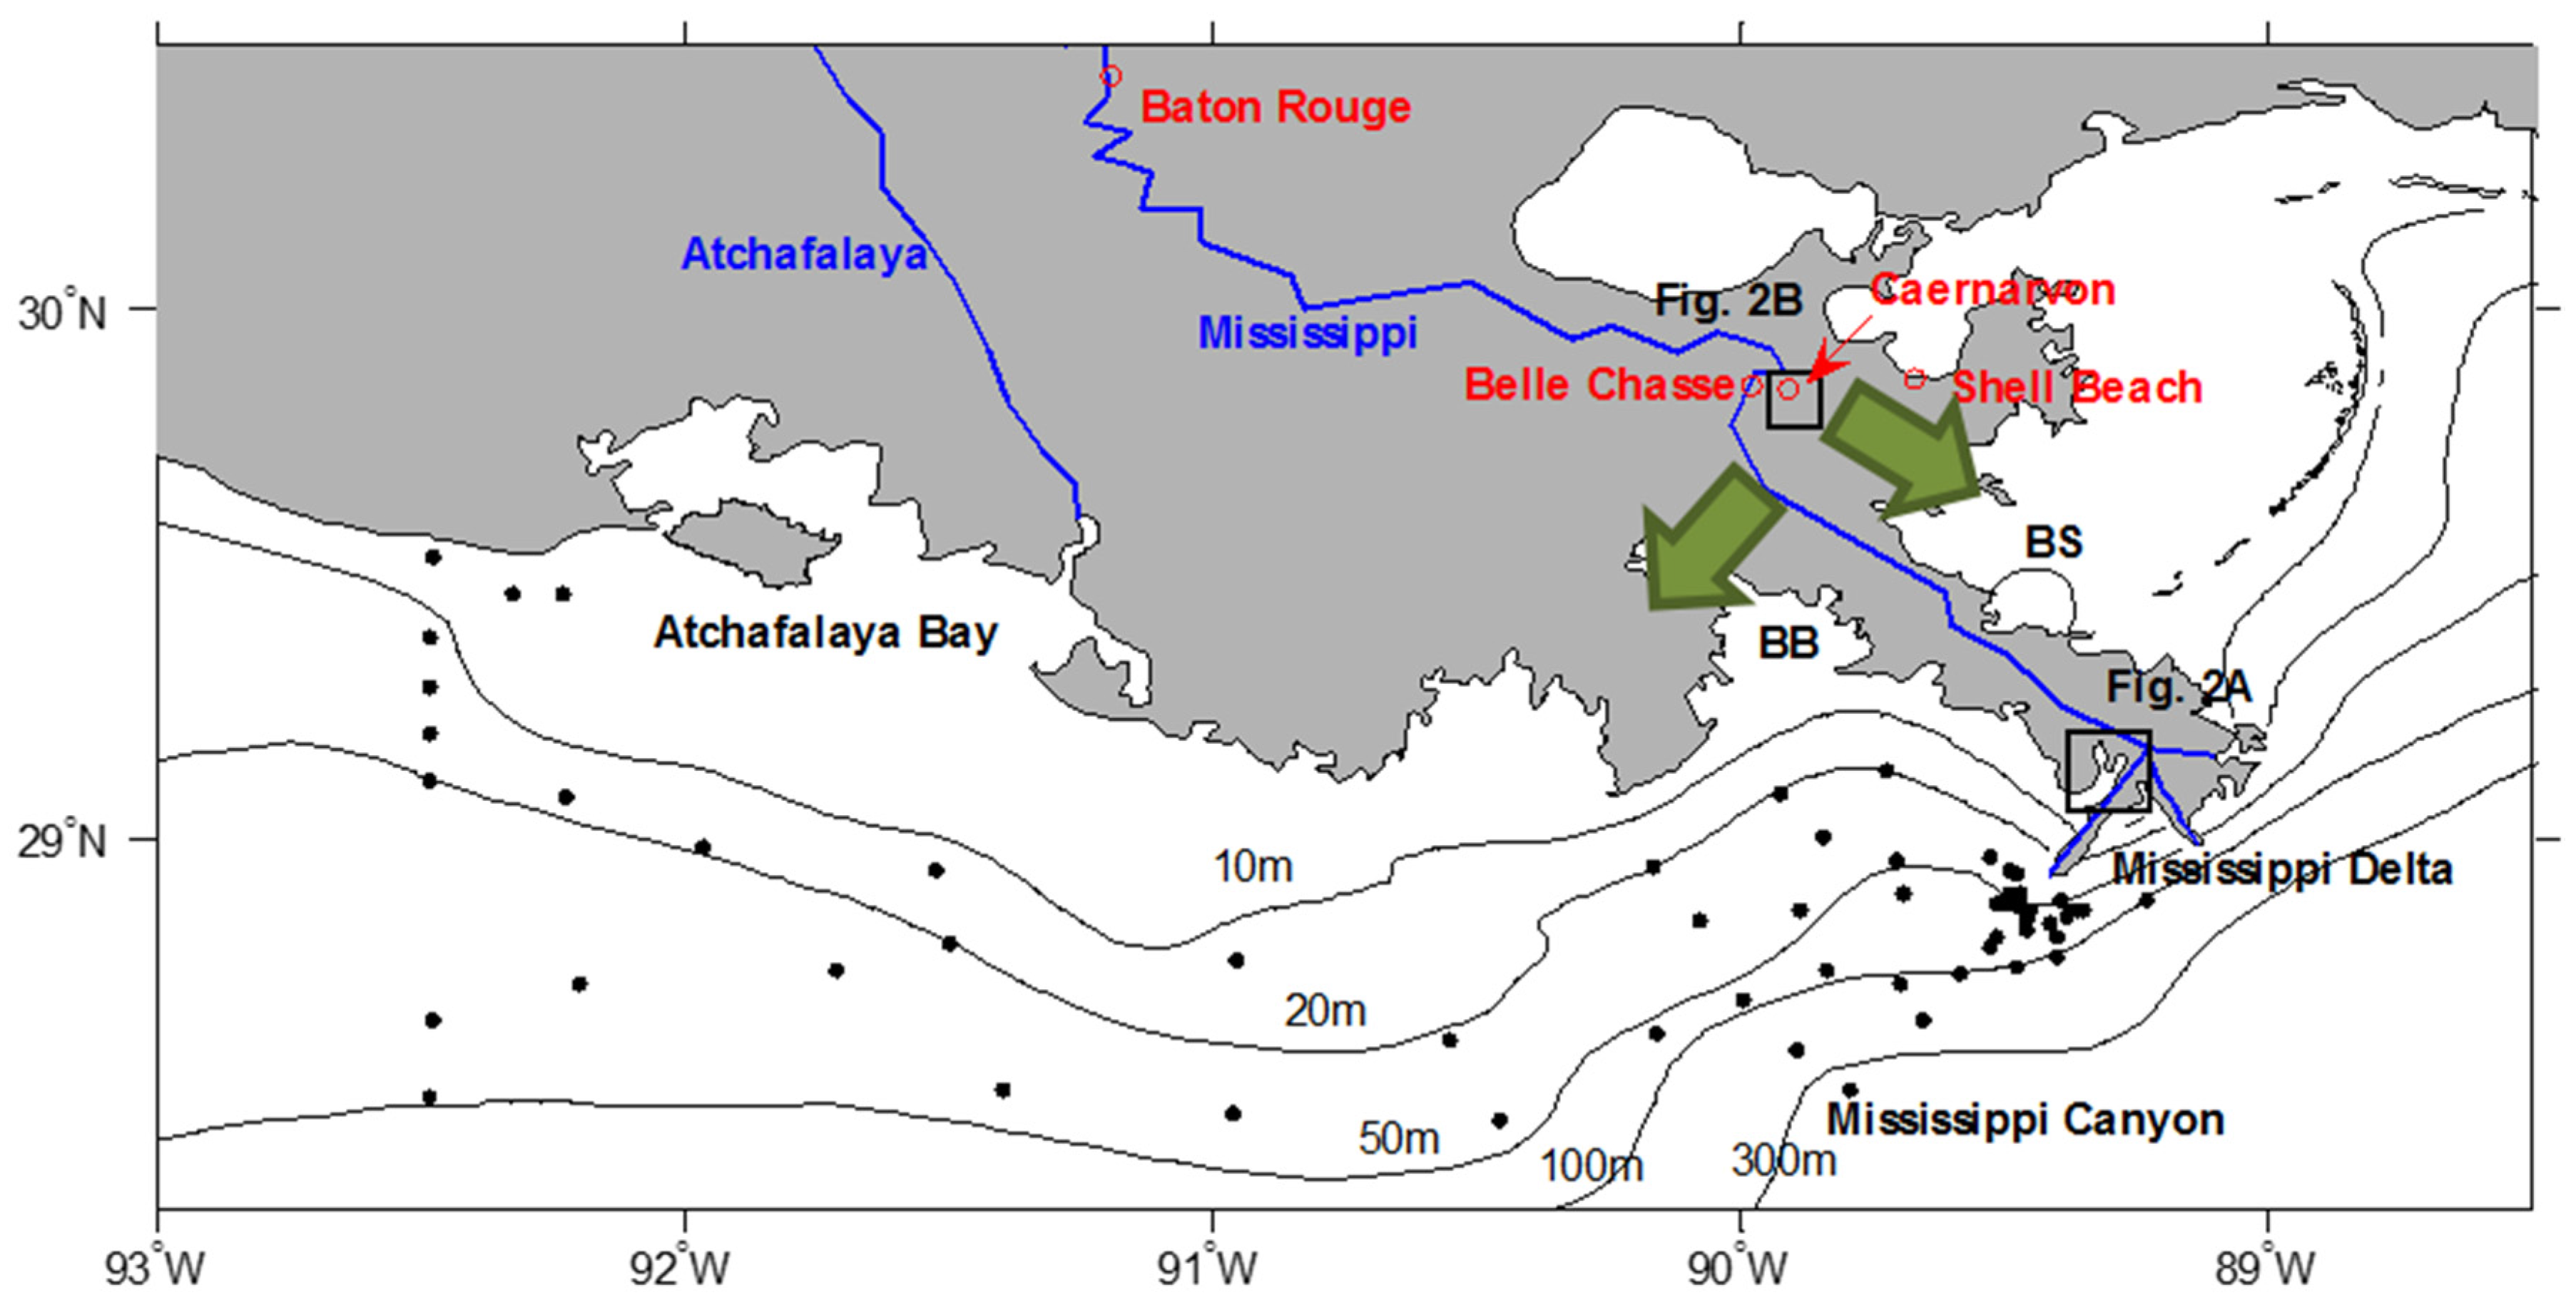
This land loss is primarily associated with decreased sediment discharge from the Mississippi and Atchafalaya Rivers, relative sea level rise, levee construction, sediment compaction, withdrawals of water, oil and gas, as well as other natural and human activities [7,8,9,10,11,12]. Thus, stabilizing disappearing wetlands and maintaining them as one of the most productive natural areas in the world are critical to the nation′s economy. In 2012, Louisiana Coastal Protection & Restoration Authority (CPRA) issued Louisiana′s Comprehensive Master Plan for a Sustainable Coast [13]. One of the recommended restoration tools is the diversion of sediment-laden water from the Mississippi and Atchafalaya Rivers into adjacent receiving basins to build new land. Diversions reconnect the river to the deltaic plain via river reintroductions, the reopening of old distributaries, and crevasse-splay development [7]. In the next 50 years, about $50 billion is planned to be spent on marsh creation, sediment diversion and other types of projects along the Louisiana coast. For instance, between 2012 and 2031, the estimated total cost of sediment diversions at Atchafalaya River, middle Barataria Bay and middle Breton Sound (Figure 1) will exceed $2.5 billion.
Sediment diversions are impacted by biological, chemical, geological and physical processes which interact with human activities. There is, however, a considerable argument on whether sediment diversions can create significant land. Some research groups believe that these diversions are a key tool to restore the shrinking land and protect the coast when they are designed effectively and used properly [7,10,14,15]. Turner et al. [16] argued that the major source of mineral sediment to coastal marshes is from hurricanes, not river floods; a more recent detailed study finds that fluvial sediment supply is more important than hurricanes over decadal timescales and longer [17]. Blum and Roberts [9] even suggested that the significant drowning of the Louisiana coast is inevitable because of insufficient sediment supply, rapid compaction of young sediment and faster global sea level rise in the coming century.
Figure 1. The study area in the Louisiana coast as well as the Mississippi and Atchafalaya Rivers. Green arrows are future large diversions proposed in Louisiana′s Master Plan (CPRA, 2012). Baton Rouge, Belle Chasse and Caernarvon are three stations in which water discharge was measured. Shell Beach is the National Oceanic and Atmospheric Administration’s National Data Buoy Center (NDBC) station for wind speed measurement. Black dots on Louisiana shelf are the stations for an erodibility study by Xu et al. [18]. Bathymetric contours are in 10, 20, 50, 100 and 300 m. BS = Breton Sound; BB = Barataria Bay. See Figure 2A,B for details of two study areas.
Water 08 00026 g001
Based on comprehensive synthesis, Paola et al. [19] proposed that the area of a delta plain Aw in a receiving basin for sediment diversion is primarily controlled by an Equation:
A w = f r Q s ( 1 + r 0 ) C 0 ( σ + H )
where Qs is the sediment supply via diversion; fr is the sediment retention rate; ro is the volume ratio of organic matter to mineral sediment; C0 is the overall solids fraction in the sediment column (1-porosity); σ is subsidence rate; and H is the rate of global sea-level rise.
A critical, but elusive, parameter is sediment retention rate fr, i.e., the fraction of sediment retained in the subaerial and subaqueous parts of delta to help build and sustain land. This will, at least partially, determine whether many Louisiana sediment diversion projects will be successful in the next century. The retention rate is controlled by many factors, including texture, sediment concentration, waves, tides, sediment erodibility, sediment consolidation, bioturbation, plant-sediment interaction, river discharge, relative sea level change, storm activities, and many others. For instance, comparing with unconsolidated mud, sand is harder to resuspend and tends to settle quickly to facilitate land building. Waves can easily resuspend muddy sediment for transport by tidal currents, which move sediment in and out of coastal bays and estuaries. Erodibility is defined as the measured propensity for sediment to be resuspended from the sediment surface [20]; normally a higher erodibility leads to a lower sediment retention rate.
Shallow-water deltas on the Louisiana coast, such as the relatively high-energy distributary channels of Wax Lake Delta [21] inside of Atchafalaya Bay (Figure 1), tend to be sand-dominated, because muddy sediment is prone to resuspension (or non-deposition) and export away from the receiving basins before sufficient consolidation can occur to impede erosion. However, mud and sand represent, respectively, >80% and <20% of sediment load in the Mississippi and Atchafalaya Rivers [14], so the loss of mud represents a substantial issue in the land-building process. The mechanism of sand transport in aquatic systems is widely understood [22]. Muddy sediment dynamics, however, are much more complicated and are widely recognized as nonlinear processes operating at rates highly dependent on local conditions [23], which must be evaluated on an individual basis.
Studies of mud erodibility on the Mississippi Delta have commenced only recently, and have addressed some of the wide variability of delta sediments. Xu et al. [18] and Mickey et al. [24] collected a total of 106 sediment cores on Louisiana shelf and quantified critical shear stress and eroded mass based on field experiments in early spring and late summer seasons. Lo et al. [25] collected sediment from Lake Lery which is downstream of Big Mar that receives discharge from Caernarvon freshwater diversion (Figure 1), and did ex-situ sediment erodibility experiments in a lab to quantify the erodibility changes one, two and four weeks after initial settling. However, there is currently a paucity of data of field measurement of sediment erodibility in Louisiana estuaries and bays. The lack of field erodibility data poses a challenge to the ongoing modeling work of Louisiana CPRA to predict land growth and sediment retention in receiving basins for future large diversions. Although the Mississippi River deltaic plain has been the subject of abundant research over recent decades [12], few studies have quantified erodibility and high-resolution grain size distribution, both of which control the sediment retention rate in receiving basins.
In this study, we focus on the fundamental sedimentary processes in seaward parts of receiving basins for diversions. We do not discuss the land growth or crevasse-splay development in the “proximal” parts of deltas. Rather, our work is focused on the relatively “distal” parts of subaqueous deltas in which diverted river flow is weak, wave resuspension is frequent, and volumetrically-dominant mud can escape out of the receiving basins. Specific objectives of this research are: (1) to quantify the high-resolution grain sizes of both surficial and down-core sediment in two existing diversion receiving basins: West Bay and Big Mar, and to compare with other grain size datasets from Louisiana coast; (2) to measure the erodibility of bed sediment in the field at West Bay and Big Mar; (3) to calculate wave-induced shear stresses in Louisiana bays and discuss the implication of texture and erodibility for sediment retention of Louisiana coastal diversions; and (4) to provide suggestions for the designing and implementation of receiving basins for future Louisiana sediment diversions.

2. Study Areas

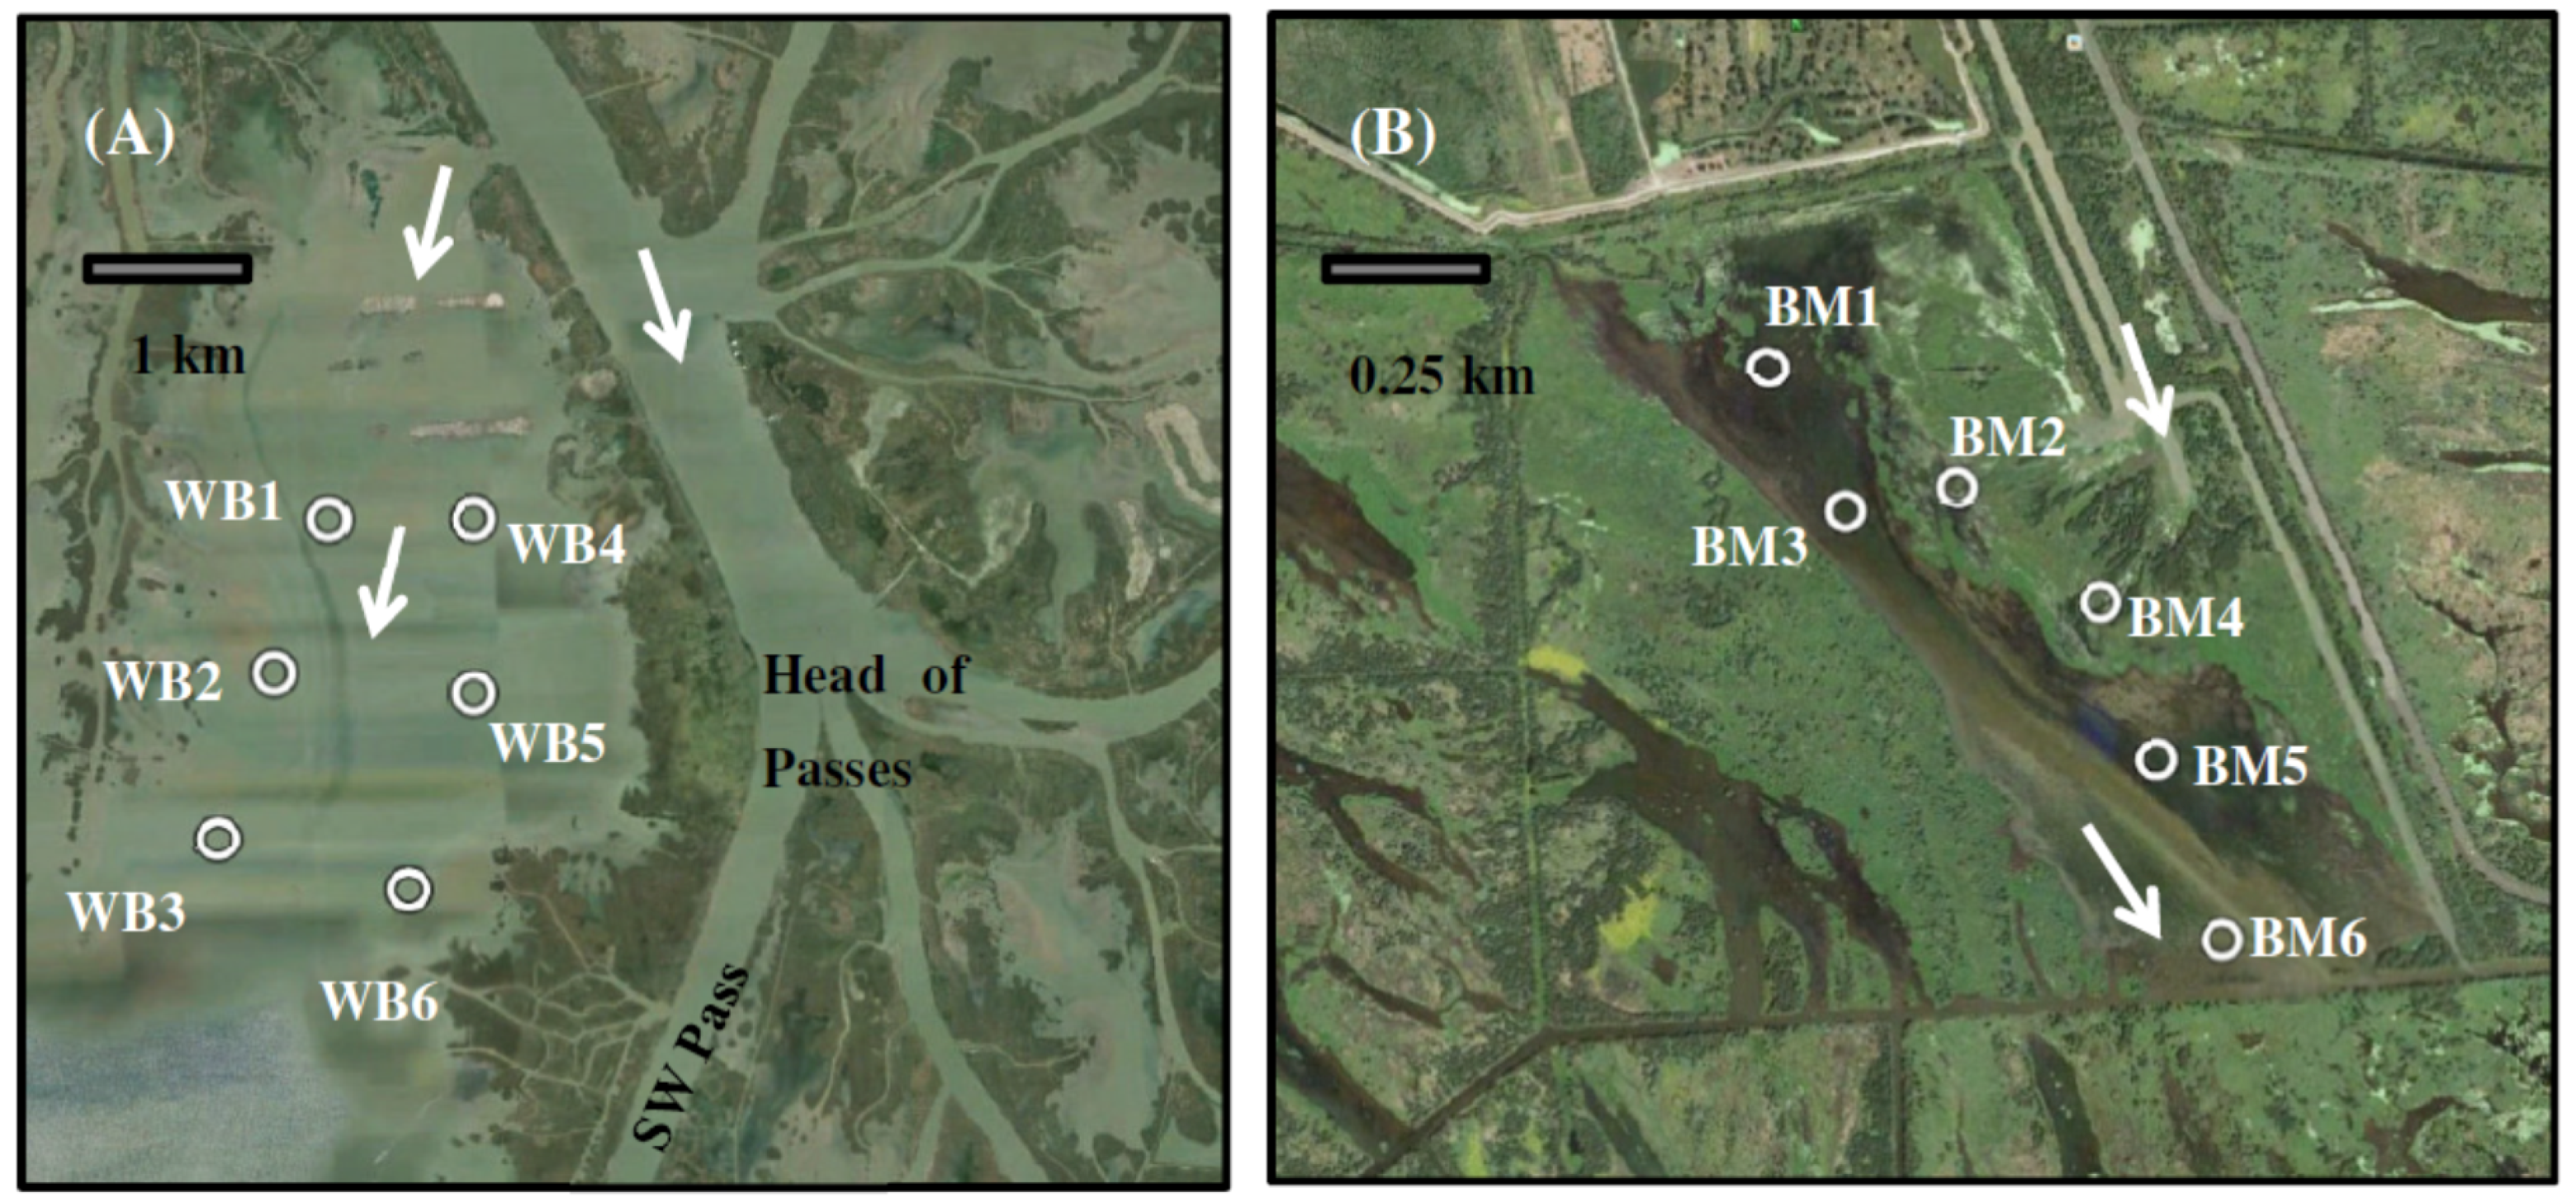
There are two contrasting areas in our study: West Bay and Big Mar (Figure 2A,B). West Bay represents a semi-enclosed bay which is under strong oceanographic influence and is located on top of the Mississippi River Delta (MRD) with a rapid subsidence rate of 15 mm/year. Big Mar is a more landward water body, surrounded by fresh to brackish wetlands, with a much slower subsidence rate of 2 mm/year and much less influence from the open ocean (Table 1).
Figure 2. (A) Six stations (WB1–WB6) in West Bay study area. Sediment samples were collected and measured on 19–20 December 2014 and the satellite image was taken on 27 January 2015. (B) Six stations (BM1–BM6) in Big Mar. Sediment samples were collected and measured on 6–7 March 2015 and the satellite image was taken on 31 October 2014. White arrows indicate overall flow directions. See Figure 1 for the locations of two study areas. Background images are from Google Earth.
Water 08 00026 g002
Table 1. Comparison of two diversion receiving basins in West Bay and Big Mar.
Study AreaArea before Diversion (km2)Tidal Range (m)Subsidence Rate (mm/year)Connectivity to Open OceanPurpose of DiversionWater Discharge (km3/year)Sediment Discharge (Mt/year)
West Bay40 a0.3 m a15 bsemi-enclosedsediment diversion and nourishing marsh33 c3.2 c
Big Mar4negligible3 benclosedwater diversion for salinity control now. planned for sediment diversion in the future2 c0.2 c
Notes: a from Andrus [26]; b from CPRA [13]; c from Allison et al. [14].
West Bay was selected as one of our study areas because it is the only operational artificial diversion to date designed specifically for land building in coastal Louisiana [10]. The discharge of West Bay is also similar to that of future diversions at Breton Sound and Barataria Bay (Figure 1). Physical settings of all three above bays are semi-enclosed, connecting to both open water and vegetated land, although seaward ends of the Barataria and Breton receiving basins are more sheltered than that of West Bay. Thus, West Bay is a good existing analog for the most energetic marine conditions likely for future major diversions. West Bay is one of the six subdelta complexes comprising the modern Mississippi bird-foot delta. Its subdelta started to develop around 1839 due to a flood break in the river levee and led to rapid development of land until 1932. After 1932, subsidence, sea-level rise, storms and reduced sediment deposition all contributed to land deterioration and formed the current open water body [12,15,27]. In order to restore vegetated wetlands and create land, since 2003 water and sediment have been diverted from a non-gated crevasse at a 120° angle along the west bank of the Mississippi River 7.6 km upstream of the Head of Passes of MRD (Figure 2A). This project was designed to divert sediment and water to create and nourish about 9831 acres of fresh to intermediate marsh. Earthen dike structures, called Sediment Retention Enhancement Devices (SREDs), were placed southwest of the crevasse to maximize the wetland creation.
Andrus [26] compared multiple-year bathymetric data and found that the deepening of West Bay since 2003 was probably caused by sediment erosion due to the large waves and surges generated by Hurricane Katrina. Allison et al. [14] reported that annual total sediment load into West Bay was about 3.2 million tons (Mt) but only 0.3 Mt of sand actually entered the bay (Table 1). Kolker et al. [15] found that the maximum deposition in West Bay occurred at the seaward end of the diversion project boundary, contradictory to simple sedimentary models which predict that depositional center should be close to the river bank. Because of rapid relative sea level rising due to compaction of >100 m thick of Holocene sediment and less hydraulic head available to move coarse sediment, there was little growth of a delta in West Bay before the 2011 flood. Following the Mississippi River flood in 2011, however, a significant portion of West Bay shows growth of a subaqueous delta (Figure 2A). As a result, the Louisiana Coastal Wetlands Planning, Protection and Restoration Act Task Force decided to rescind its previous decision to close the West Bay sediment diversion, and to allow it to remain open for at least another ten years.
Comparing with West Bay, Big Mar is shallower in depth (0.23 m in Big Mar vs. 1.26 m in West Bay), smaller in size (4 km2 in Big Mar vs. 40 m2 in West Bay) and is a more enclosed system (Table 1 and Table 2; Figure 2A,B). Big Mar is an artificial pond caused by an agricultural impoundment [28]. It is located south of the small gated Caernarvon freshwater diversion on the lower Mississippi River to limit salt water intrusion with minimal sediment capture [10]. Allison et al. [14] reported that annual water and sediment discharge passing through Caernarvon diversion are 2 km3/year and 0.2 Mt/year, respectively. Water passing through the Caernarvon diversion structure immediately enters Big Mar and Lake Lery, and then through the complex Breton Sound estuary system [29,30]. Often the Caernarvon diversion is not operated when sediment spikes are present and therefore does not maximize potential sediment retention. Despite this intermittent operation and the nature of freshwater diversion, there has been incidental sediment accumulation in Big Mar pond to permanently support emergent wetland plant on a new subdelta [31] (Figure 2B). Although smaller in size, the morphology of this new emerging subdelta is not unlike typical river-dominated bay-head deltas in West Bay and Wax Lake Delta. Since 2004, land gain and wetland growth in Big Mar has been significant. Lopez et al. [31] reported approximately 4 km2 of new emerging land and about 201,800 m3 of sediment retention in Big Mar pond.

3. Methods

3.1. Coring

A shallow-draft Carolina Skiff was used for the fieldtrip in West Bay on 19–20 November 2014. Due to the shallow water depths, an airboat was used in Big Mar on 6–7 March 2015. In each of these two study areas, there were 6 stations: WB1–WB6 in West Bay and BM1–BM6 in Big Mar (Figure 2A,B; Table 2). West Bay samples were taken along two N-S parallel transects on the eastern and western sides of the bay. Samples at Big Mar were taken along a roughly single transect and were evenly spaced in the narrow water body of Big Mar pond (Figure 2A,B). At each station, two cores (up to 0.5 m long) were collected using a 10-cm internal diameter push corer designed for shallow water mud coring and undisturbed preservation of water-sediment interface and one core was collected using a 7.5-cm push corer sampling to ~1 m sediment depth. Thus, a total of 18 cores were collected at West Bay and 18 from Big Mar. All cores were inspected carefully to make sure that no significant sample disturbance occurred during core penetrations and retrievals, and that both overlying water and sediment were well preserved. Two 10-cm internal diameter cores from each station were kept vertical and transferred to a nearby marina and erodibility was measured immediately using the method described in Section 3.3. The 7.5-cm internal diameter core from each station was transferred back to Louisiana State University (Baton Rouge, LA, USA) for further analyses of grain size and organic matter. Water depths were measured using a meter rod on the boat and reported in Table 2, but tidal corrections were not done on these depths.
Table 2. Depths, locations, total suspended solids (TSS) of water bottle samples, and organic matter percent of surficial sediments in West Bay and Big Mar receiving basins. N.D. = no data.
Study AreaStationFieldtrip DateWater Depth (m)LongitudeLatitudeTSS (mg/L)Organic Matter Percent of Surficial Sediment (%)
West BayWB119 November 20140.9189°18.962′ W29°10.187′ N12.952.16
WB219 November 20141.3489°19.455′ W29°9.128′ N26.653.50
WB320 November 20141.5289°19.962′ W29°7.985′ N11.254.28
WB419 November 20141.2289°17.821′ W29°10.148′ N17.105.77
WB519 November 20141.2289°17.871′ W29°8.933′ NN.D.5.38
WB620 November 20141.3789°18.458′ W29°7.582′ N10.754.88
Average-1.26--15.744.33
Big MarBM17 March 20150.2389°54.982′ W29°50.577′ N120.3512.94
BM26 March 20150.1089°54.601′ W29°50.338′ N69.915.81
BM37 March 20150.3489°54.826′ W29°50.301′ N48.1912.80
BM46 March 20150.2089°54.292′ W29°50.113′ N108.207.09
BM57 March 20150.1789°54.190′ W29°49.818′ N75.496.09
BM67 March 20150.3589°54.067′ W29°49.483′ N57.5713.63
Average-0.23--79.959.73

3.2. Total Suspended Solid

At each station a water sample was collected at the water surface using a 2-L bottle. Upon return to LSU, samples were filtered using 0.7 μm pore-size glass fiber pre-weighted filters. Total suspended solids (TSS) were then calculated (Table 2). Because no combustion was performed to remove organic matter, TSS reported in this study included both organic and inorganic (mineral) materials in two receiving basins.

3.3. Field Measurement of Erodibility

Erodibility was measured in the field using a dual-core Gust Erosion Microcosm System (GEMS) which was originally designed by Gust and Muller [32]. The GEMS system was composed of a laptop, a power control box, two turbidimeters, a pump controller, two rotating motors, two erosional heads, two sediment chambers, source water, collection bottles, and a suction filtration system. An illustration and a picture of the GEMS system can be found in Lo et al. [25] and Xu et al. [18], respectively. Sediment was eroded from the core top by applying a shear stress via a magnetically-coupled rotational head. The shear stress was increased over the course of the experiment from 0.01 to 0.6 Pa. As the shear stress increased, the surface of the core was eroded, and the eroded material was suspended and passed through a turbidimeter and collected in bottles. The water in the bottles was then filtered, after which the filters were dried and weighed to quantify the eroded mass. Seven steps of shear stresses (0.01, 0.05, 0.1, 0.2, 0.3, 0.45 and 0.6 Pa) were applied with a step duration of 20 min for all cores. Erodibility data were analyzed following the methods of Sanford and Maa [33], Dickhudt et al. [34,35], and Xu et al. [18]. The formulation developed by Sanford and Maa [33] and Sanford [36] was used as:
E(m,t) = M(m) [τb(t)τc(m)]
where E is the erosional rate parameter; M the depth varying erosion rate constant; τb the shear stress applied to the bed; and τc the depth-varying critical shear stress for erosion.

3.4. Grain Size Analysis

Grain size analysis was conducted using a Beckmann–Coulter laser diffraction particle size analyzer (Model LS 13 320) for both surficial (0–2 cm on sediment surface) and down-core samples. This analyzer can measure particle sizes ranging from 0.02 to 2000 μm, and the method of Xu et al. [37] was used. Cores WB5 and BM5 were used in the down-core analysis. The two cores were split in a lab at LSU and 2-cm thick slices were prepared. About 1 g subsample from each slice was placed in a centrifuge tube, and 10–20 milliliters of 30% hydrogen peroxide was added. The samples were left on a hot plate set to 70 °C for up to 12 h to oxidize any organic matter. The samples were then rinsed with deionized water to remove any leftover particles, centrifuged to separate sediment from water, and disaggregated using a Vortex mixer. After that, the samples were placed into the laser analyzer. The sizes were then converted from grain size in mm to the logarithmic unit φ, using the equation from Folk [38]:
ϕ = log 2   d
Then the fractions of sand (>63 μm; φ < 4), silt (4–63 μm; φ is 4–8) and clay (<4 μm; φ > 8) were determined. Mud discussed in this study is the summation of silt and clay.

3.5. Organic Matter Analysis

Organic content was measured by the loss-on-ignition method [39]. Each sample was left in a drying oven for 48 h, after which the samples were ground to a fine powder using a mortar and a pestle. The ground samples were transferred to crucibles and then combusted in a muffle furnace at 550 °C for 3–4 h.

3.6. Wave and Shear Stress Calculation

For comparison with GEMS results, Lo et al. [25] calculated wave-induced shear stress in a variety of wind speed, fetch and depth conditions for coastal bays. Here fetch is defined as the distance over water that the winds blow in the same direction. In this study we used a similar approach to calculate fetch- and depth-limited wave height H, length L and period T using the methods from the US-ACE [40]. Then wave-induced bed shear stresses were calculated with a range of water depth h using the equations based on the linear wave theory from Wright [41]. Maximum wave orbital velocity near the bed ubmax, wave orbital excursion amplitude aw, wave friction factor fw, and wave-induced shear stress τw were calculated using the following four equations:
ubmax = π H/[T sinh (2πh/L)]
aw = H/[2sinh (2πh/L)]
fw = exp[5.213(kb/aw)0.194 − 5.977]
τw = 2ρ fw ubmax2/(3π)
where kb is effective roughness and ρ is water density.
A water depth range of 0.1 to 5 m, a wind speed range from 0 to 16 m/s at 10 m above surface, and a fetch distance (i.e., the width of bay) from 0 to 40 km were used in our calculations because these ranges represent typical conditions in coastal Louisiana.

4. Results

4.1. Wind and Discharge

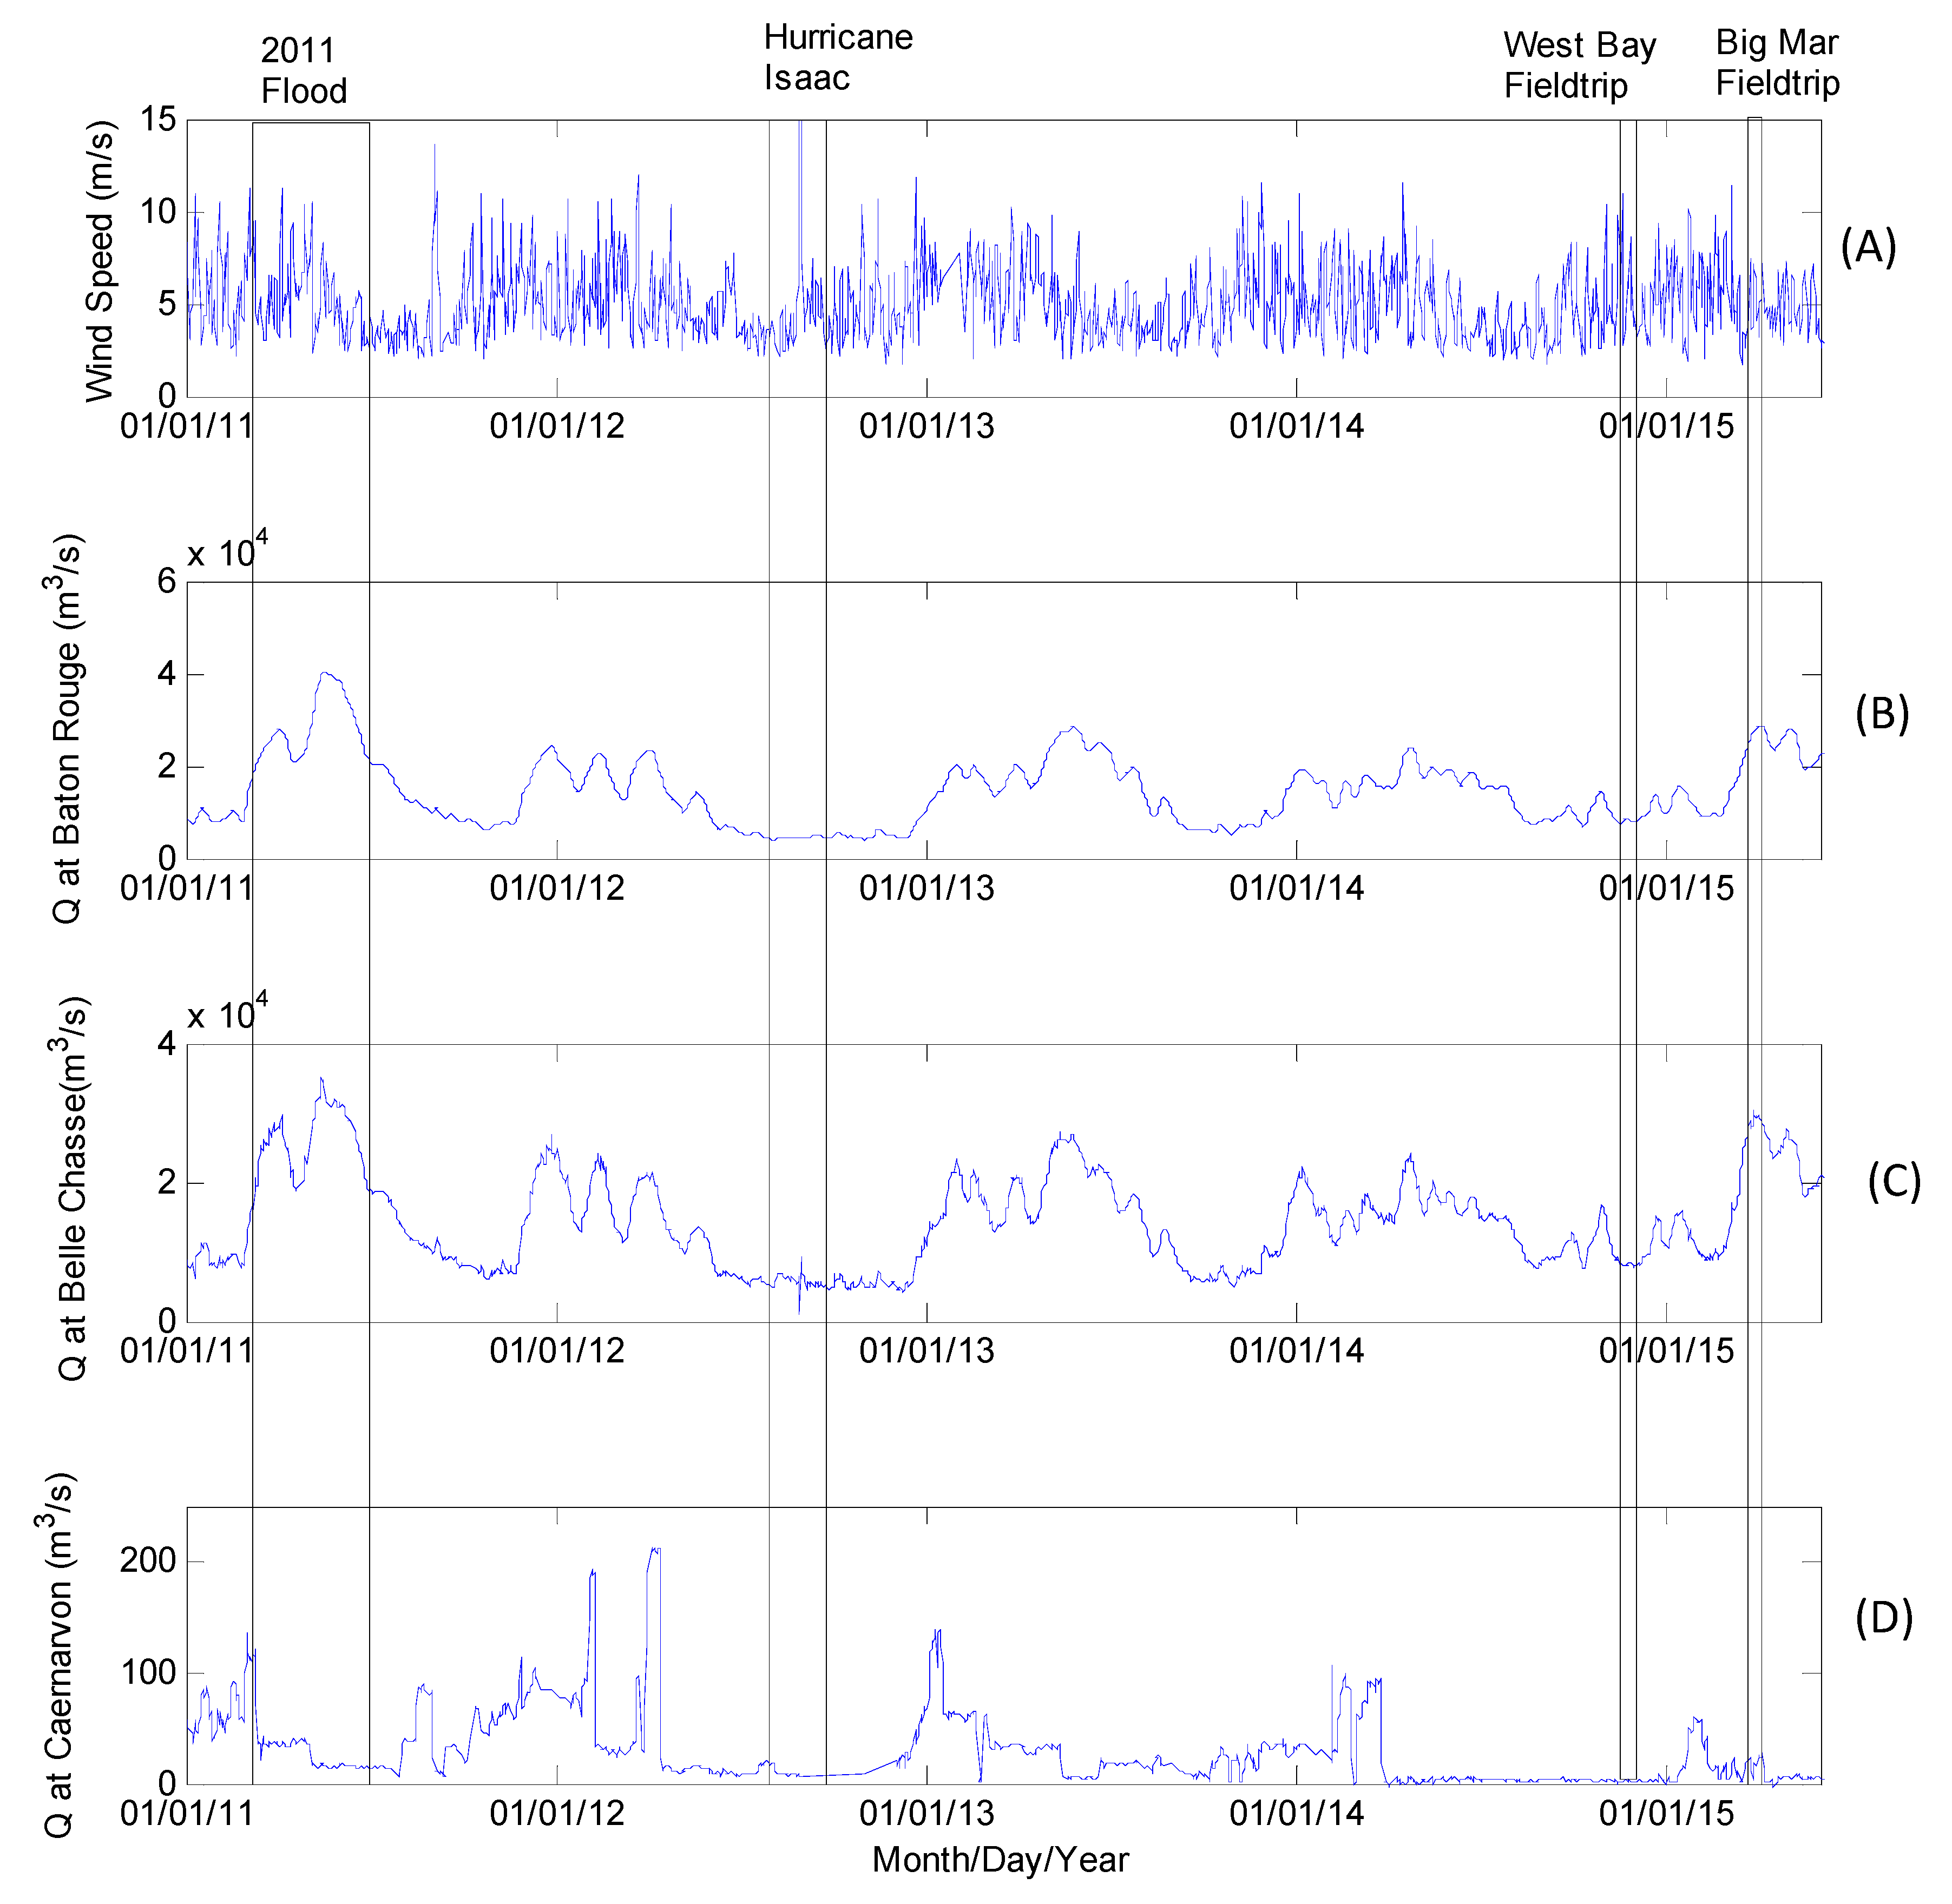
Our two study areas are under the influence of both local winds and the Mississippi River discharge. Wind speeds at Shell Beach station (Figure 1) varied between 3 and 14 m/s from 2011 to 2015, being high in winter and low in summer (Figure 3A). The water discharge of the Mississippi River also displayed its seasonality, with peak discharge from March to June. The discharge going through Caernarvon diversion in 2011–2015 was low and intermittent, as shown in Figure 3D. In particular, the discharge passing Caernarvon diversion in January–February 2015 was much lower than that of spring months of 2011–2014. From 2011 to 2015 there were two major events during which sediment transport in West Bay and Big Mar may be impacted. One was the Mississippi River flood in 2011 and the other was Hurricane Isaac in 2012. During Hurricane Isaac, there was a short period of discharge disturbance from sea at Belle Chasse station but this was not seen at the Baton Rouge station (Figure 3).
Figure 3. (A) Wind speed (in m/s) from Shell Beach station. (BD) Water discharge (in m3/s) from Baton Rouge, Belle Chasse and Caernarvon stations, respectively. There was a river flood in the year 2011 and Hurricane Isaac in 2012. Fieldtrips to West Bay and Big Mar were on 19–20 December 2014 and 6–7 March 2015, respectively. See Figure 1 for the locations of gauging stations.
Water 08 00026 g003

4.2. Grain Size

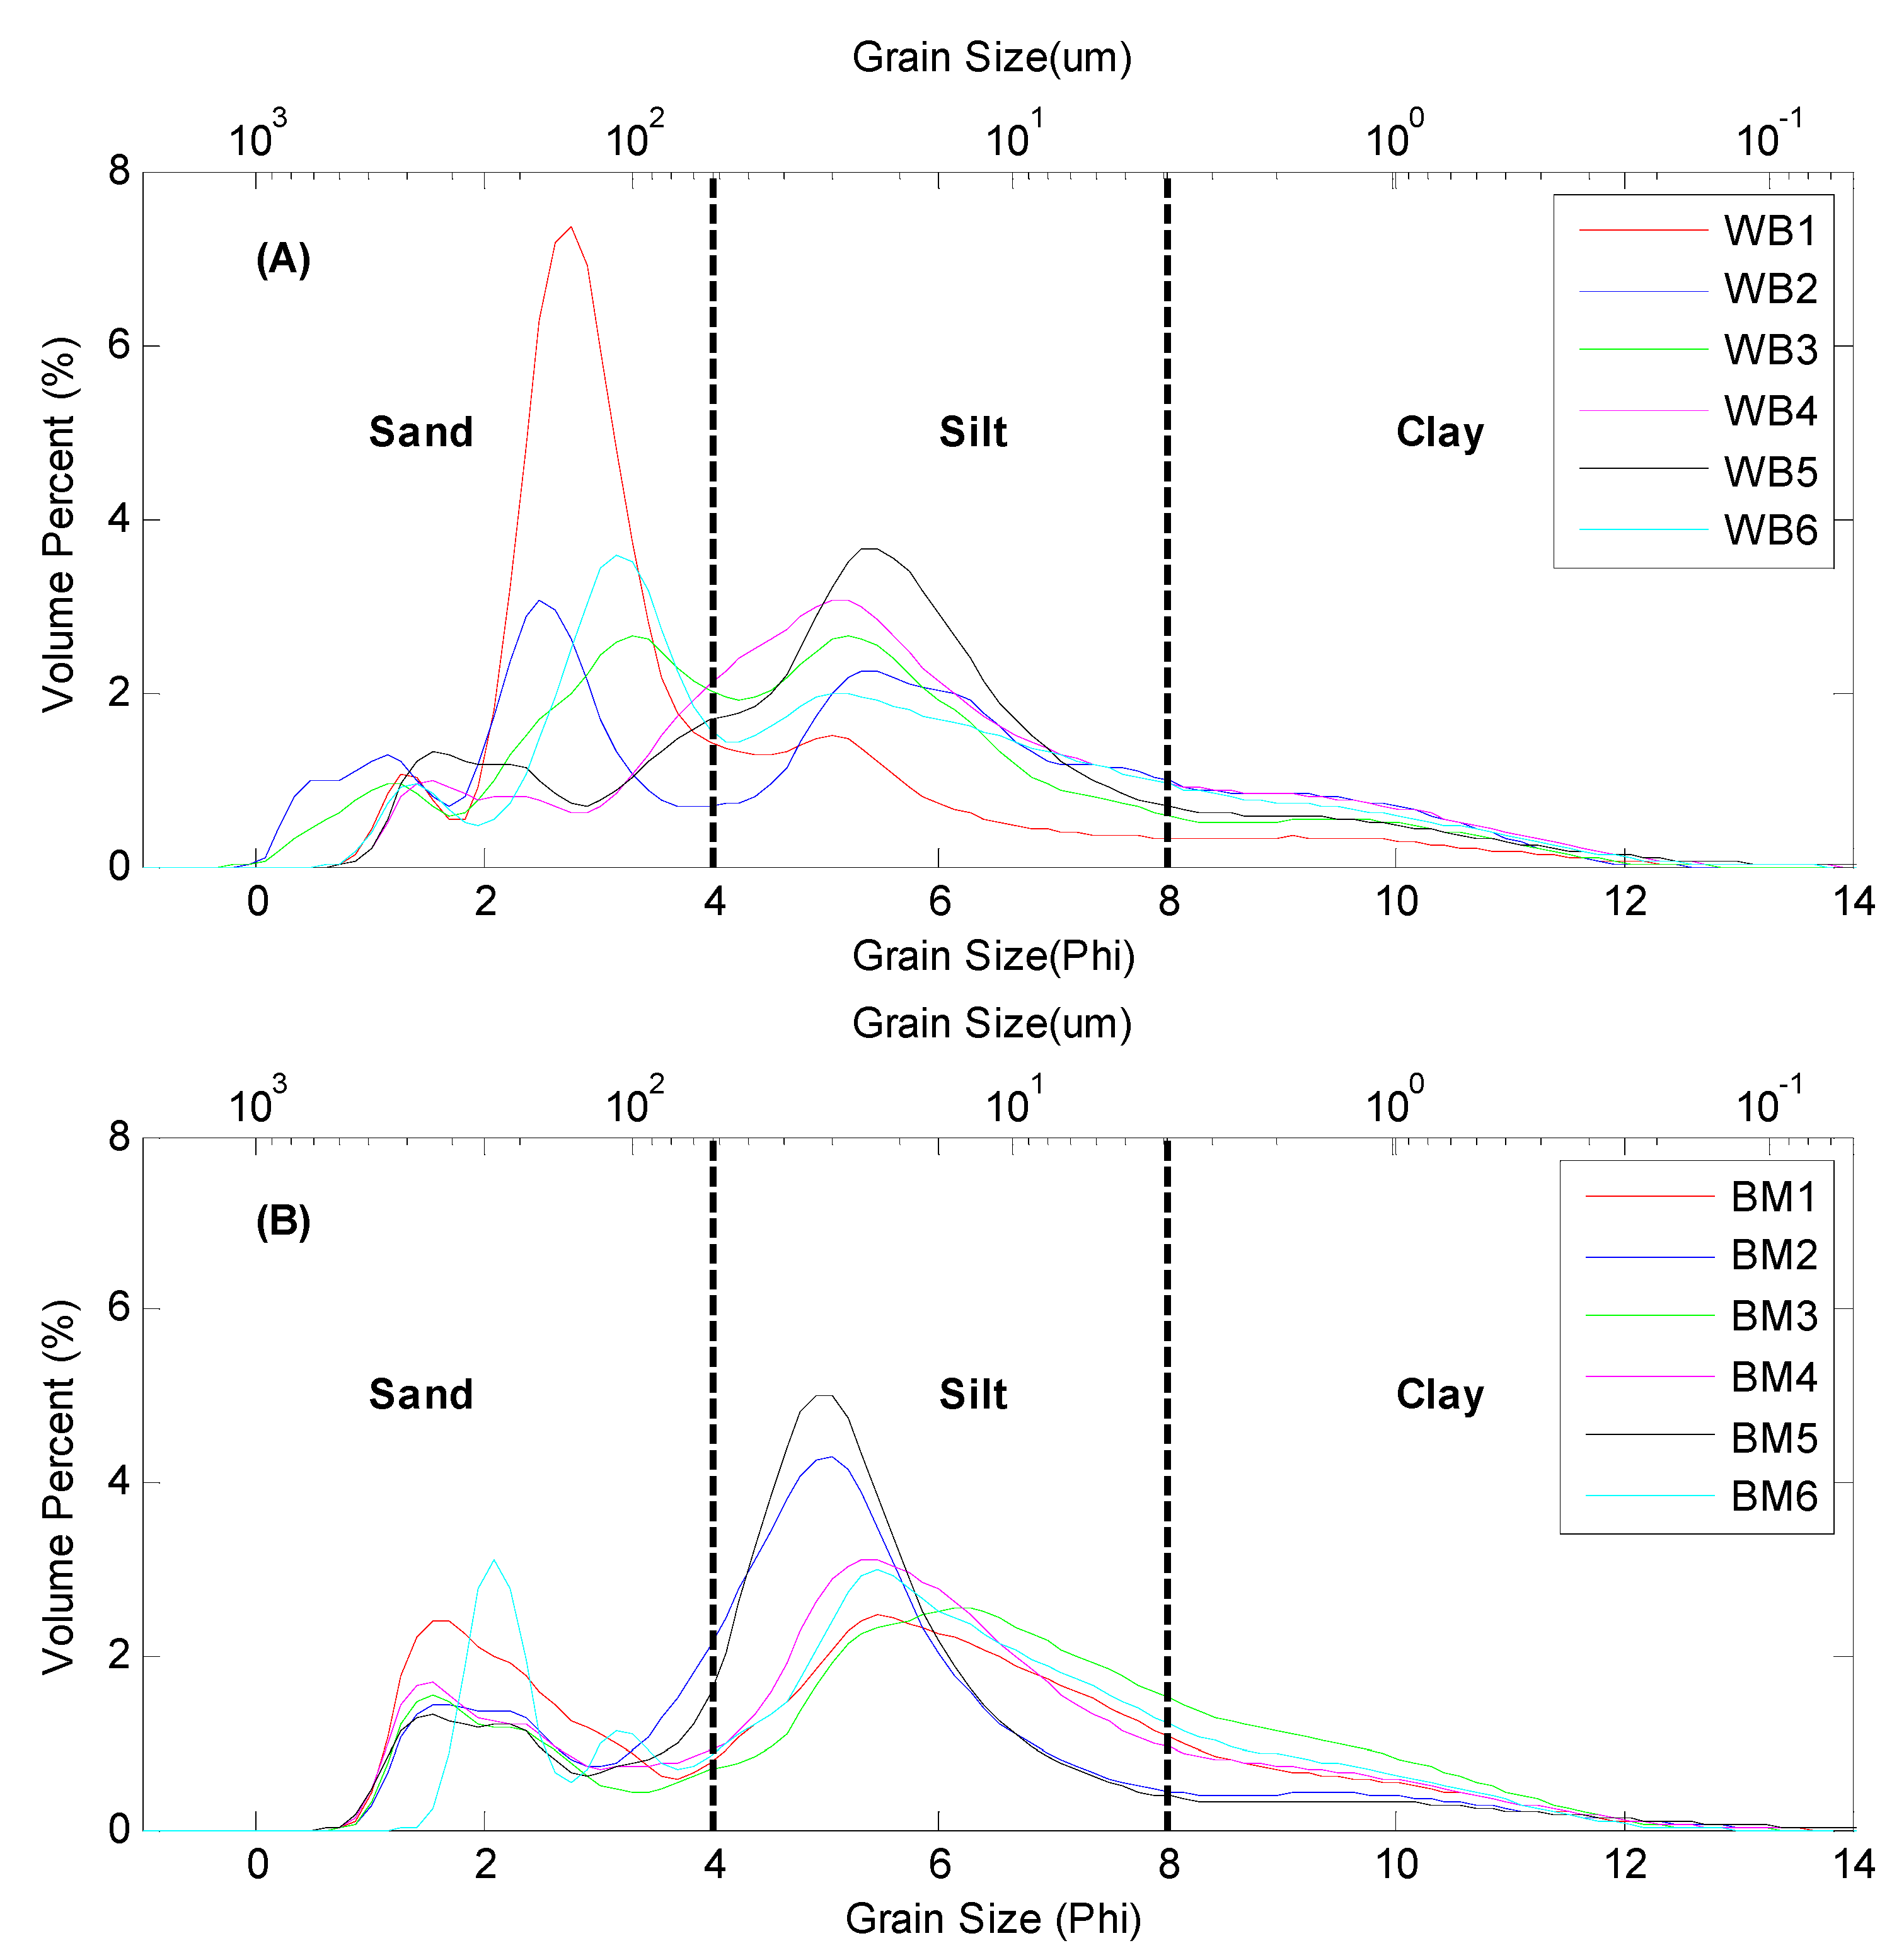
Surficial sediment from both West Bay and Big Mar showed a typical bimodal pattern on grain size distribution curves (Figure 4). A tall sand peak at about 150 μm was found at WB1 station of West Bay, which is downstream of SREDs (Figure 2A) and close to the emerging subaqueous delta developed after the 2011 flood. On average, sand, silt and clay represent, respectively, 38.7%, 47.7% and 13.6% at West Bay and 24.9%, 60.1% and 14.9% at Big Mar, with silt being the largest fraction (Table 3).
Figure 4. Grain size distributions of surficial sediments of West Bay (A) and Big Mar (B).
Water 08 00026 g004
Table 3. Sand, silt and clay percentages of samples collected from West Bay and Big Mar receiving basins as well as from other study sites in Breton Sound, Barataria Bay and Wax Lake Delta. The numbers of samples in cores are for the subsampled slices.
StudyAreaNumber of SamplesTypeSand (%)Silt (%)Clay (%)
This StudyWest Bay6Surficial38.747.713.6
This StudyBig Mar6Surficial24.960.114.9
This StudyWest Bay Core WB542Down-core25.458.216.4
This StudyBig Mar Core BM535Down-core24.656.019.4
Bentley et al. [42]Lower Breton Sound296Down-core23.250.726.1
Bentley et al. [43]Middle Breton Sound258Down-core24.852.023.2
Bentley et al. [42]Lower Barataria Bay243Down-core24.952.922.2
Bentley et al. [43]Middle Barataria Bay271Down-core16.054.529.5
Elliton et al. [44]Mike Island, Wax Lake Delta29Surficial19.962.118.0
All1191-24.754.920.4
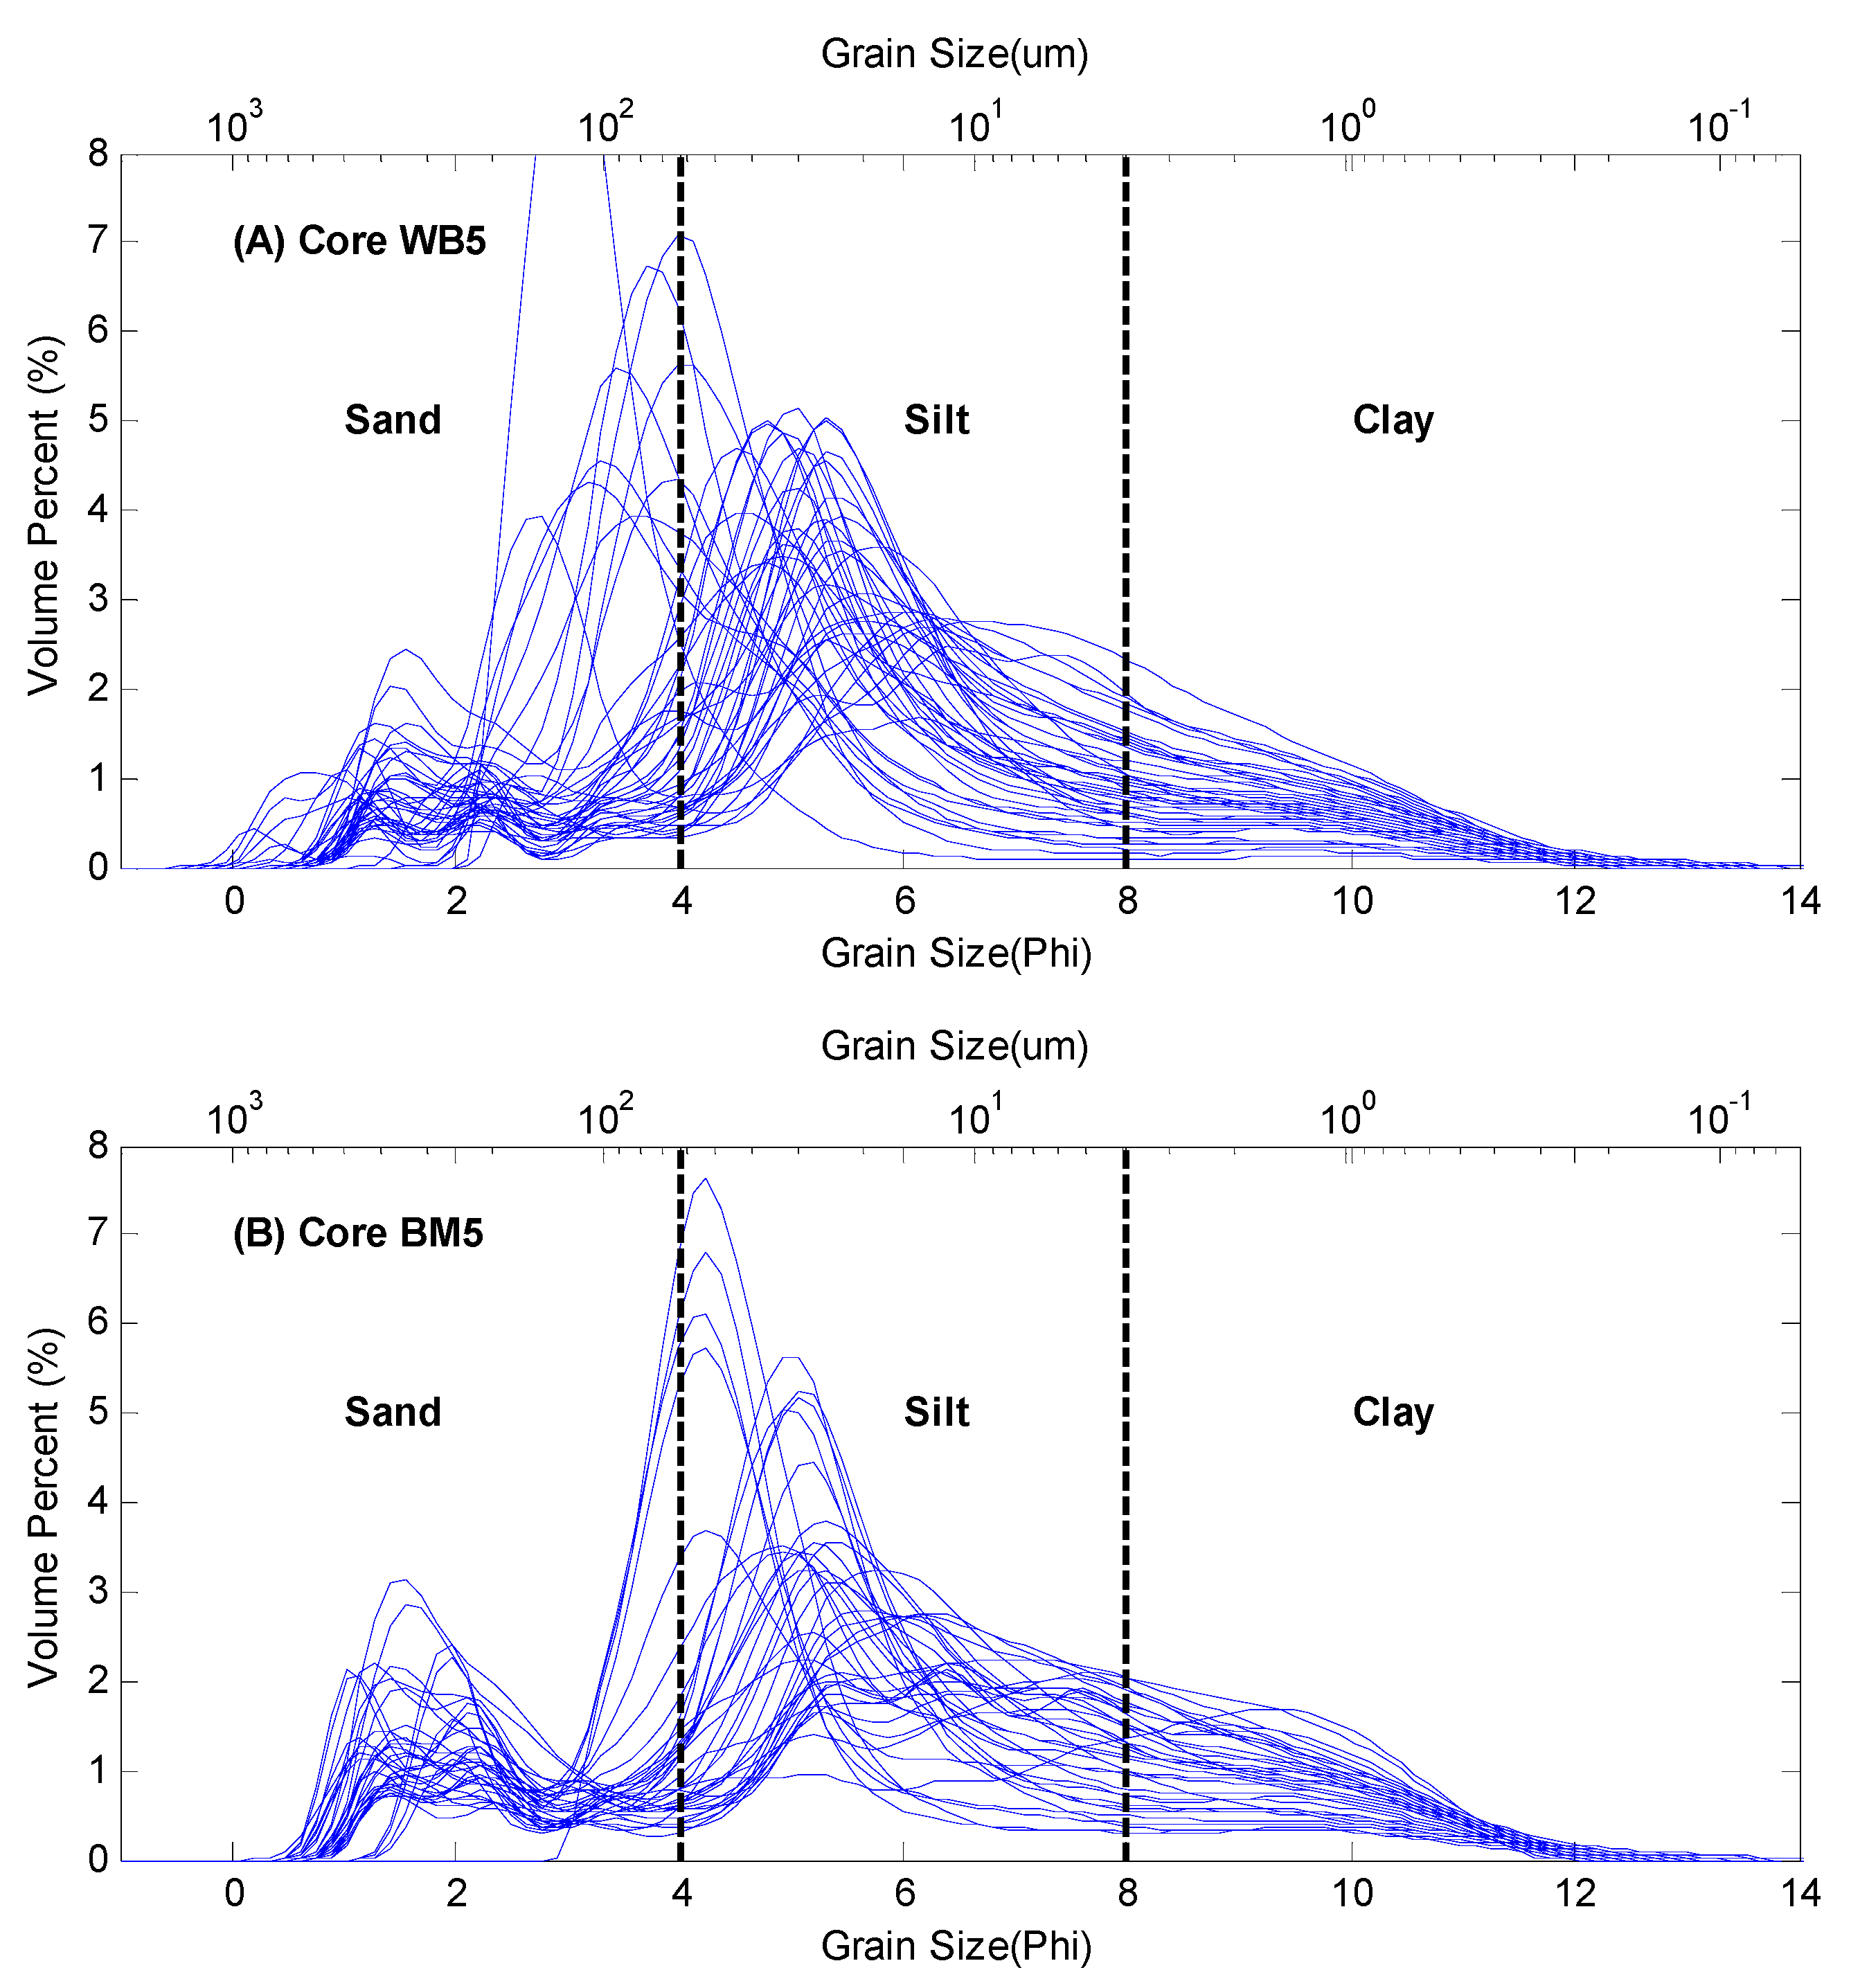
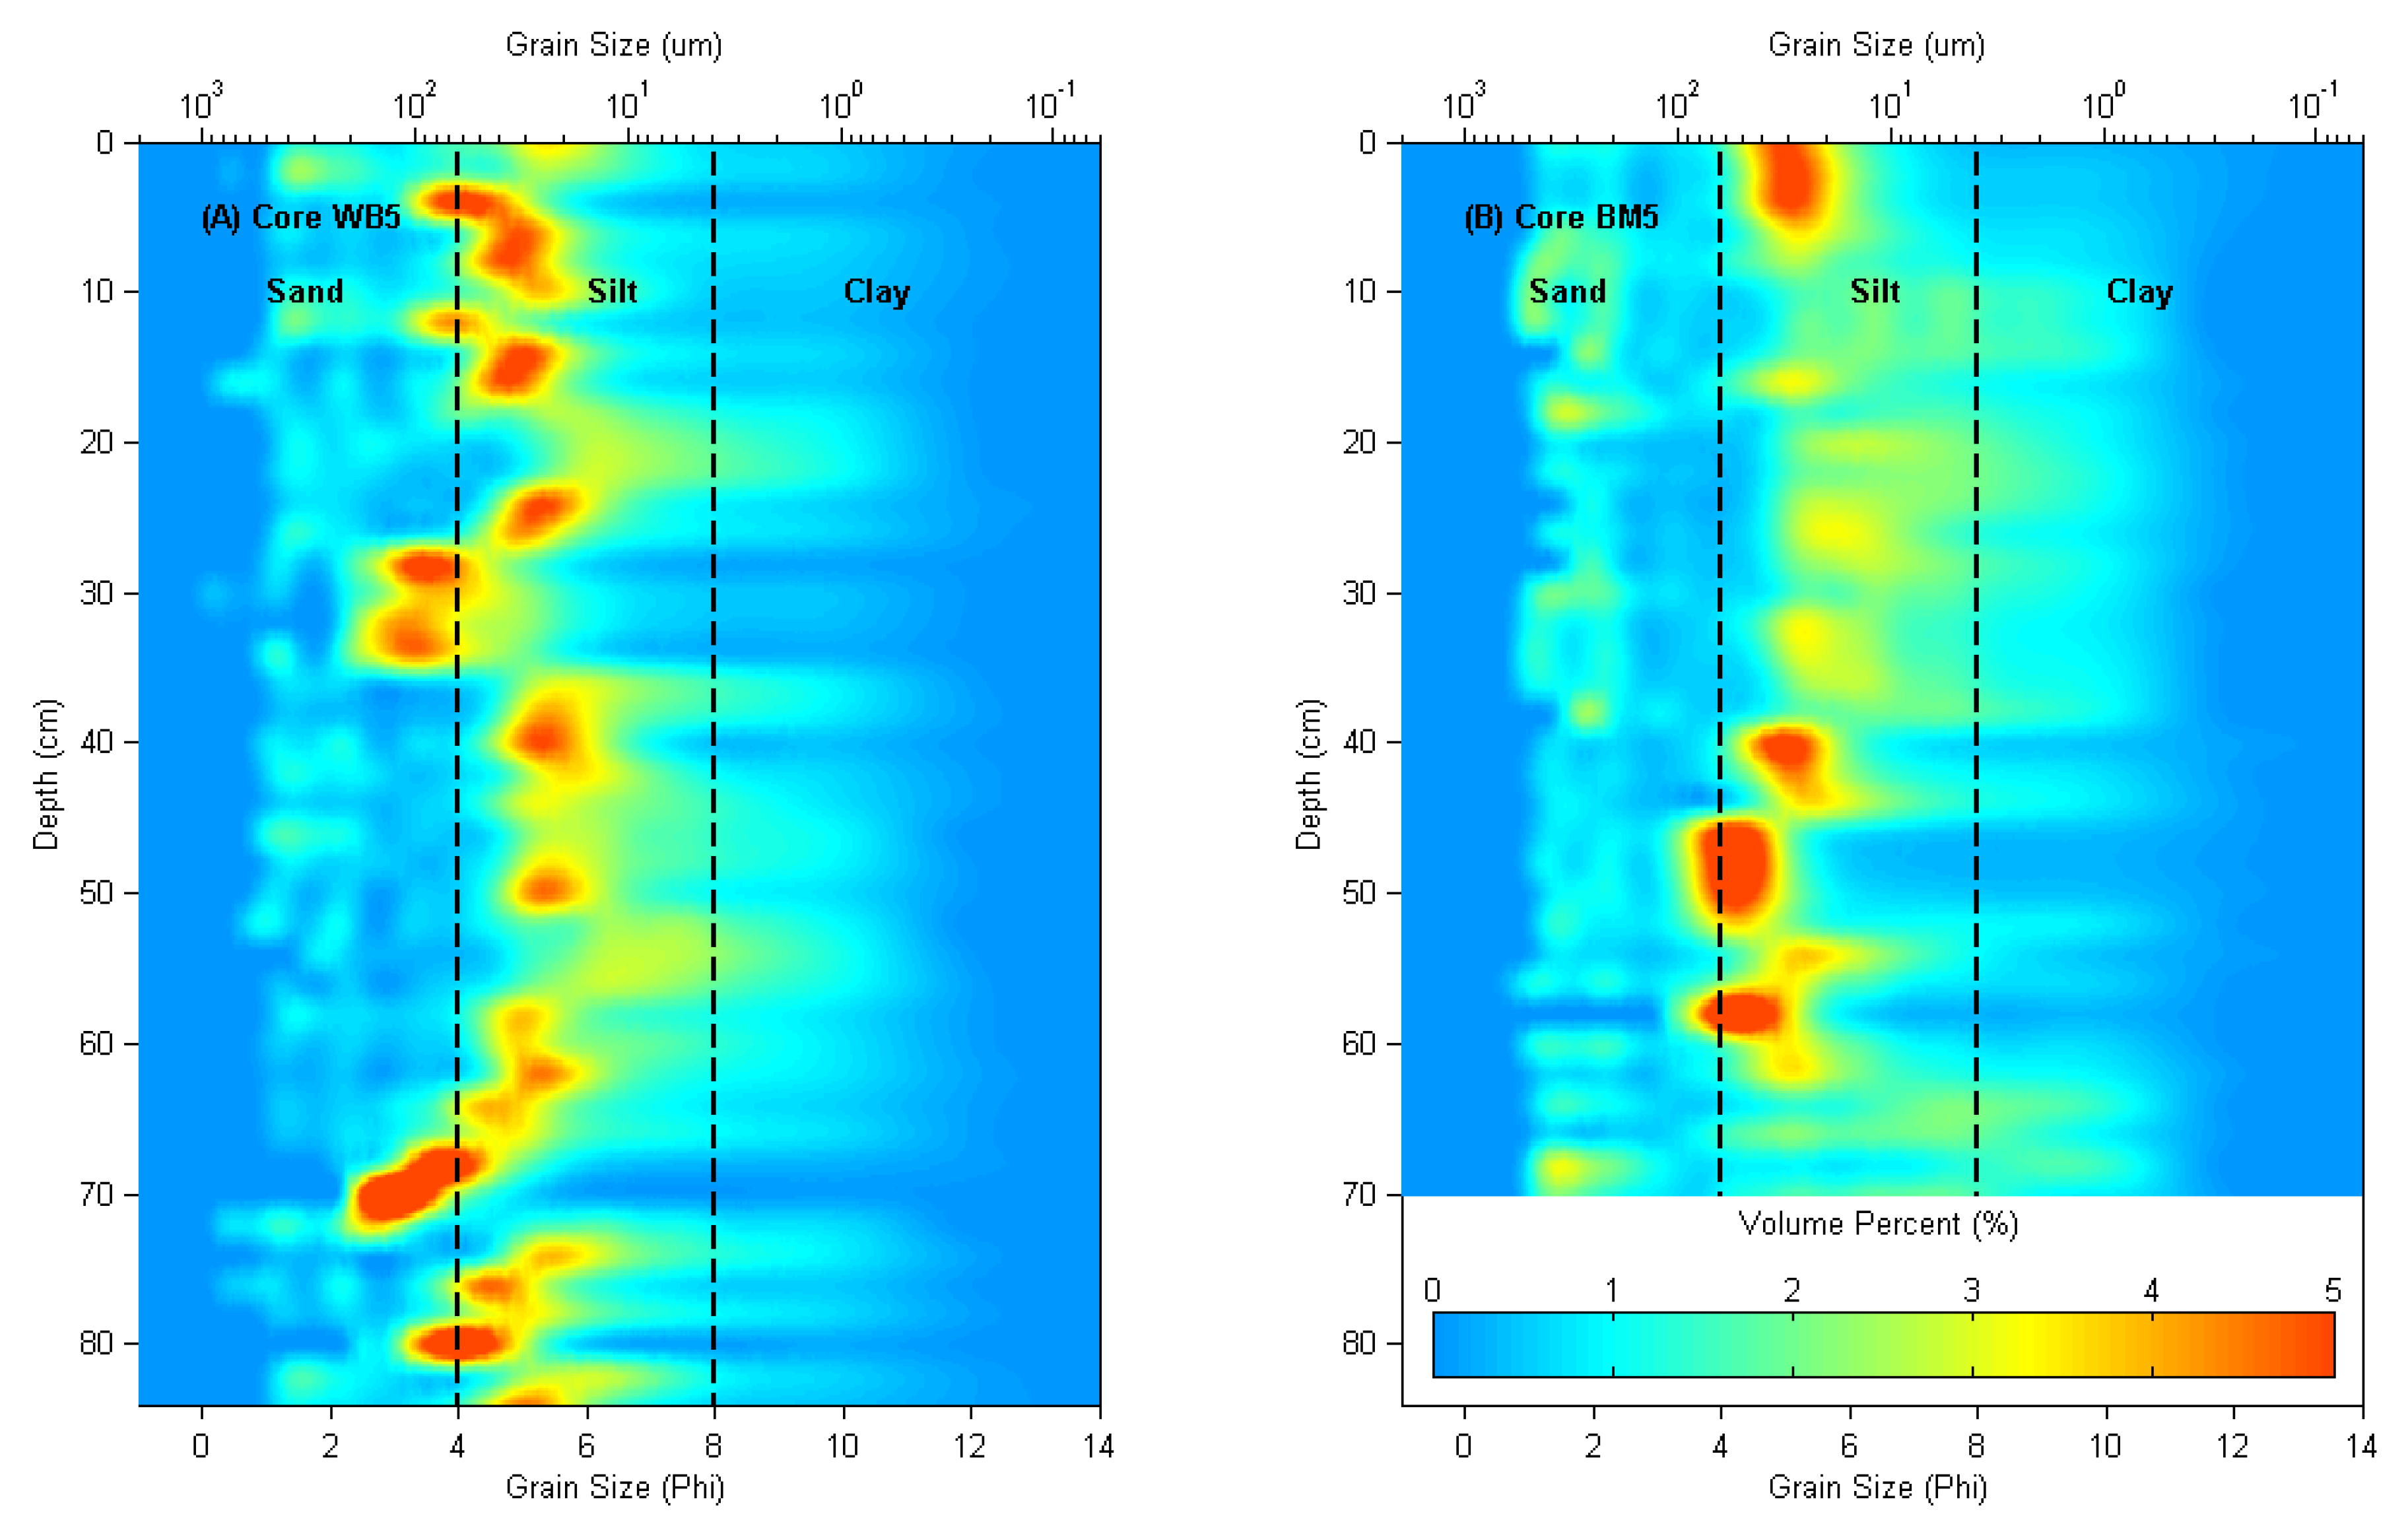
Down-core sediment data also had a bimodal pattern for all sediment subsamples in Core BM5 and the majority of Core WB5 (Figure 5). The average grain size percentages of both cores indicated the dominance of silt in both study areas; silt fraction was even larger than the sum of sand and clay in both core WB5 and BM5 (Table 3). Color plots of down-core grain size frequency revealed sediment variations with depths (Figure 6). In particular, the modes of grain sizes shifted between coarse silt and fine sand multiple times in Core WB5, reflecting a laminated nature in this core.
Figure 5. Grain size distributions of down-core sediments of Core WB5 in West Bay (A) and Core BM5 in Big Mar (B).
Water 08 00026 g005
Figure 6. Color volume-frequency plots of grain size distributions of down-core sediments of Core WB5 in West Bay (A) and Core BM5 in Big Mar (B).
Water 08 00026 g006

4.3. Erodibility

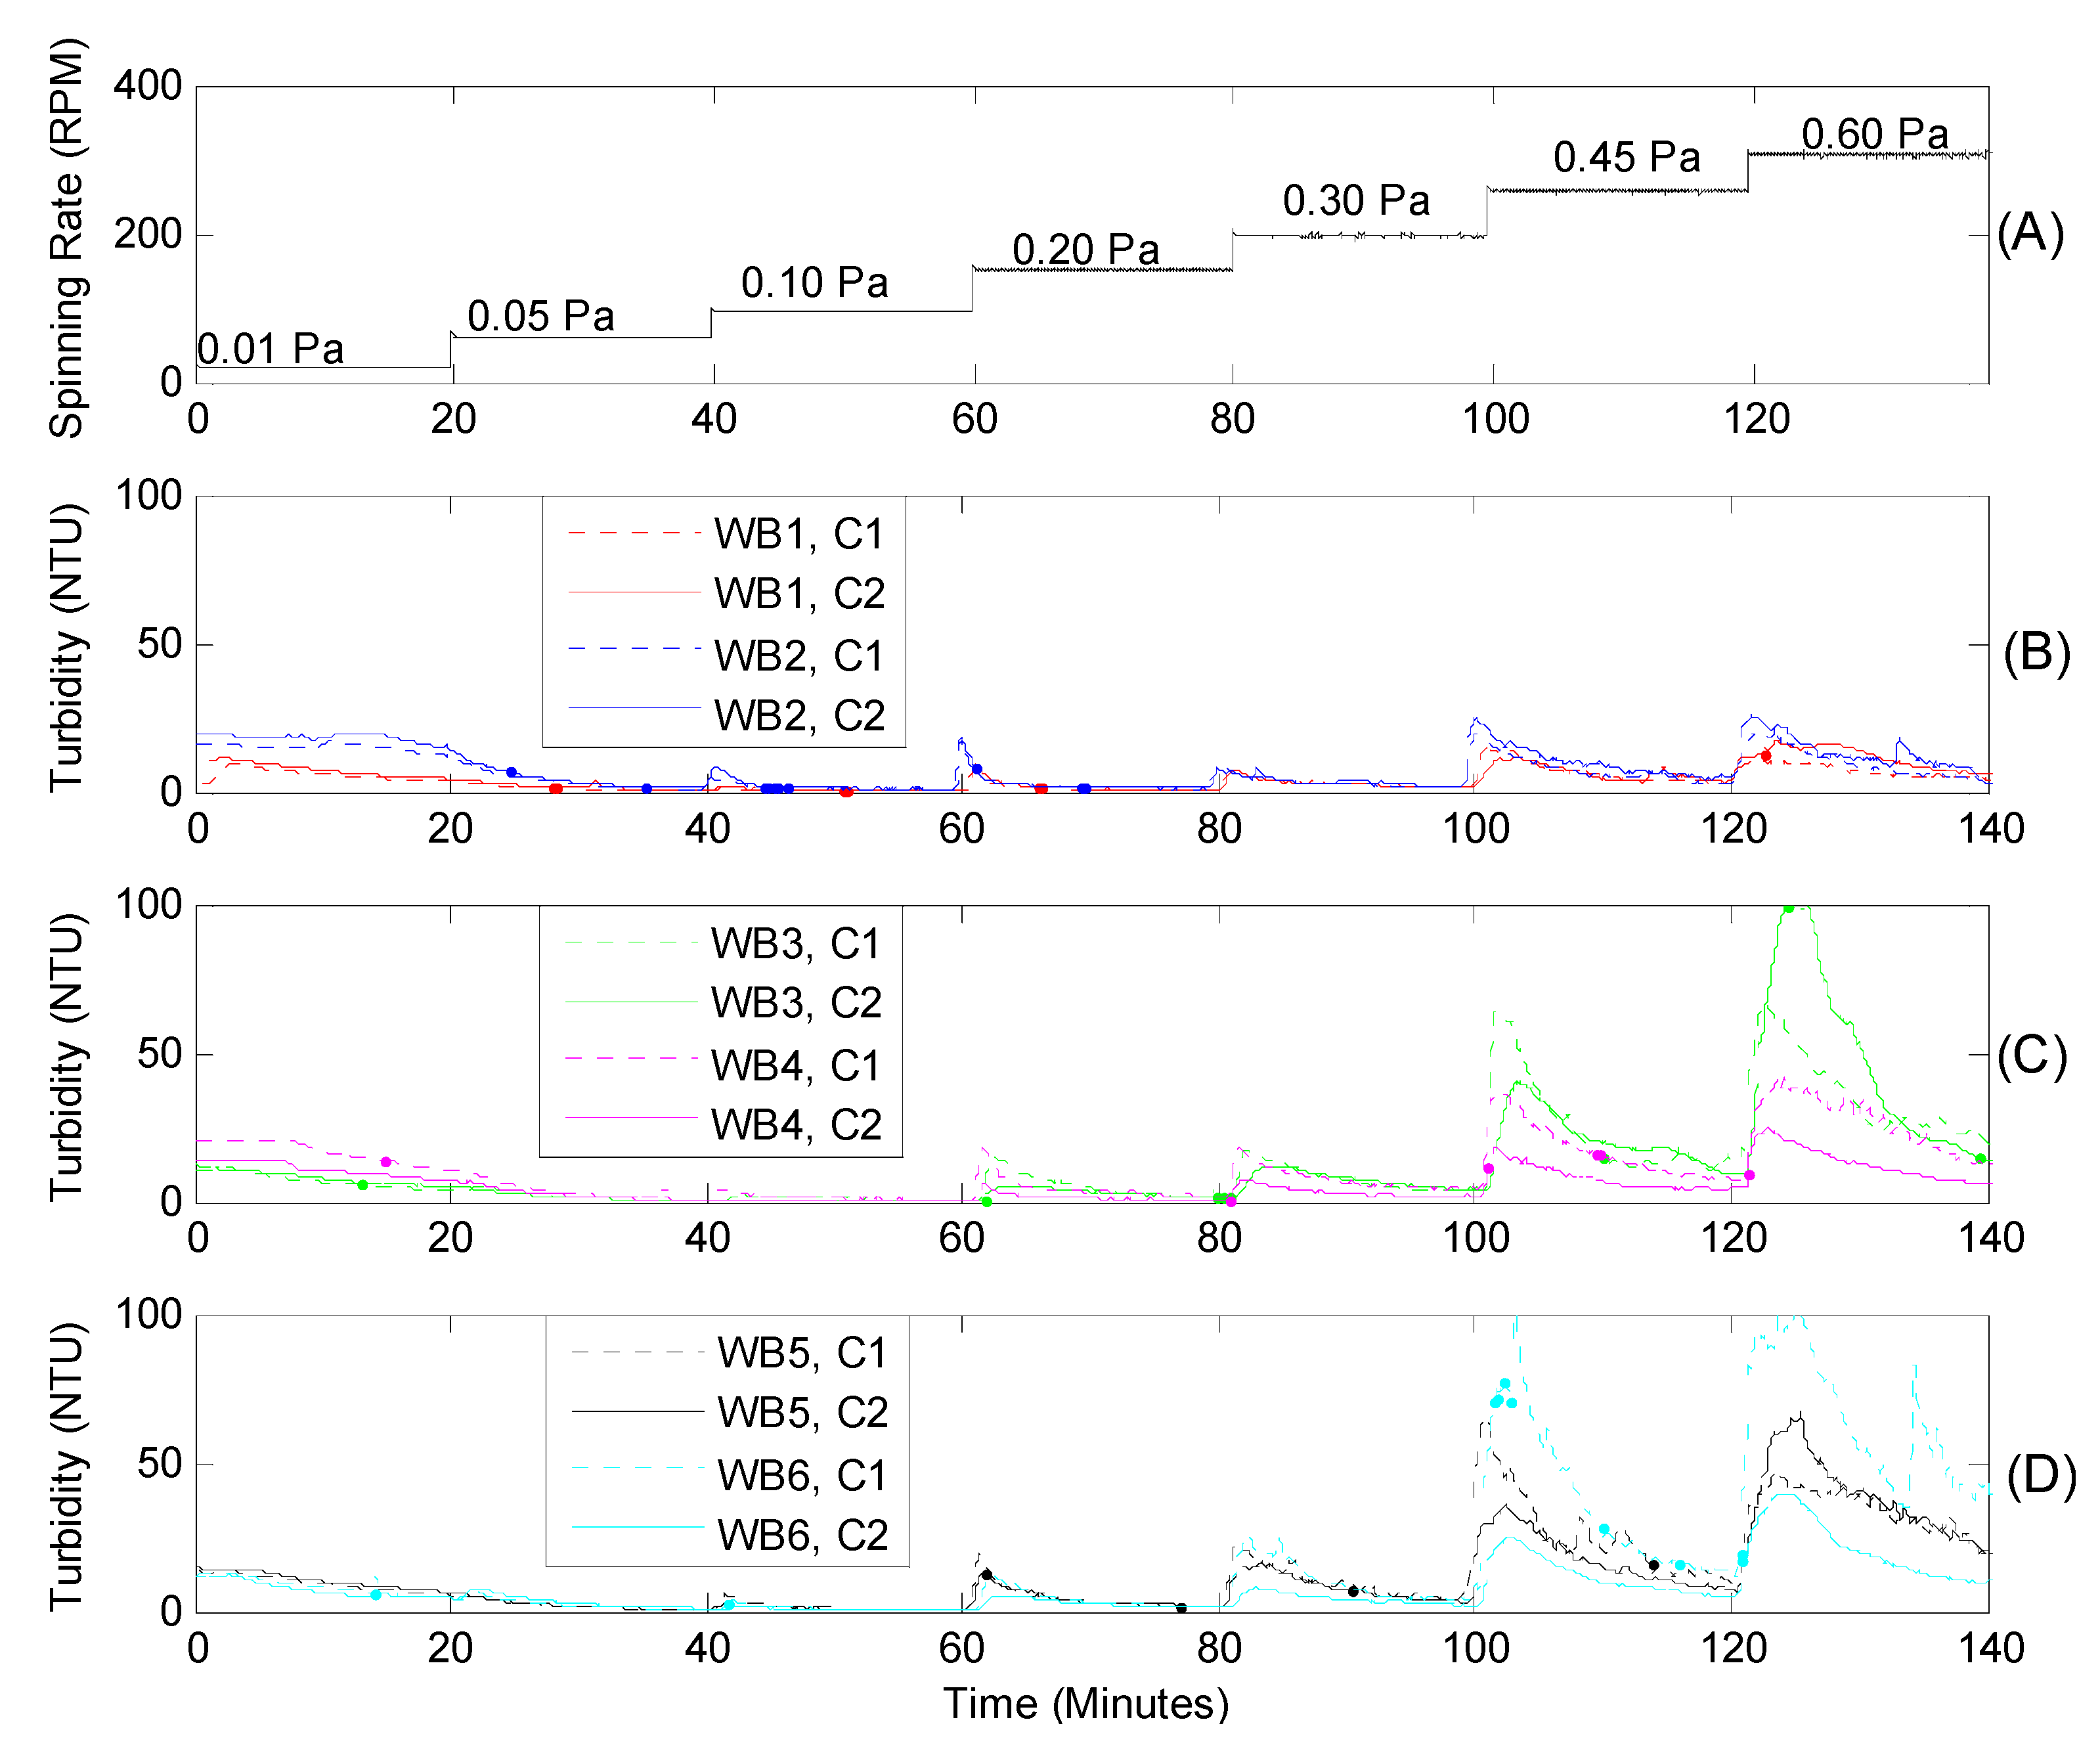
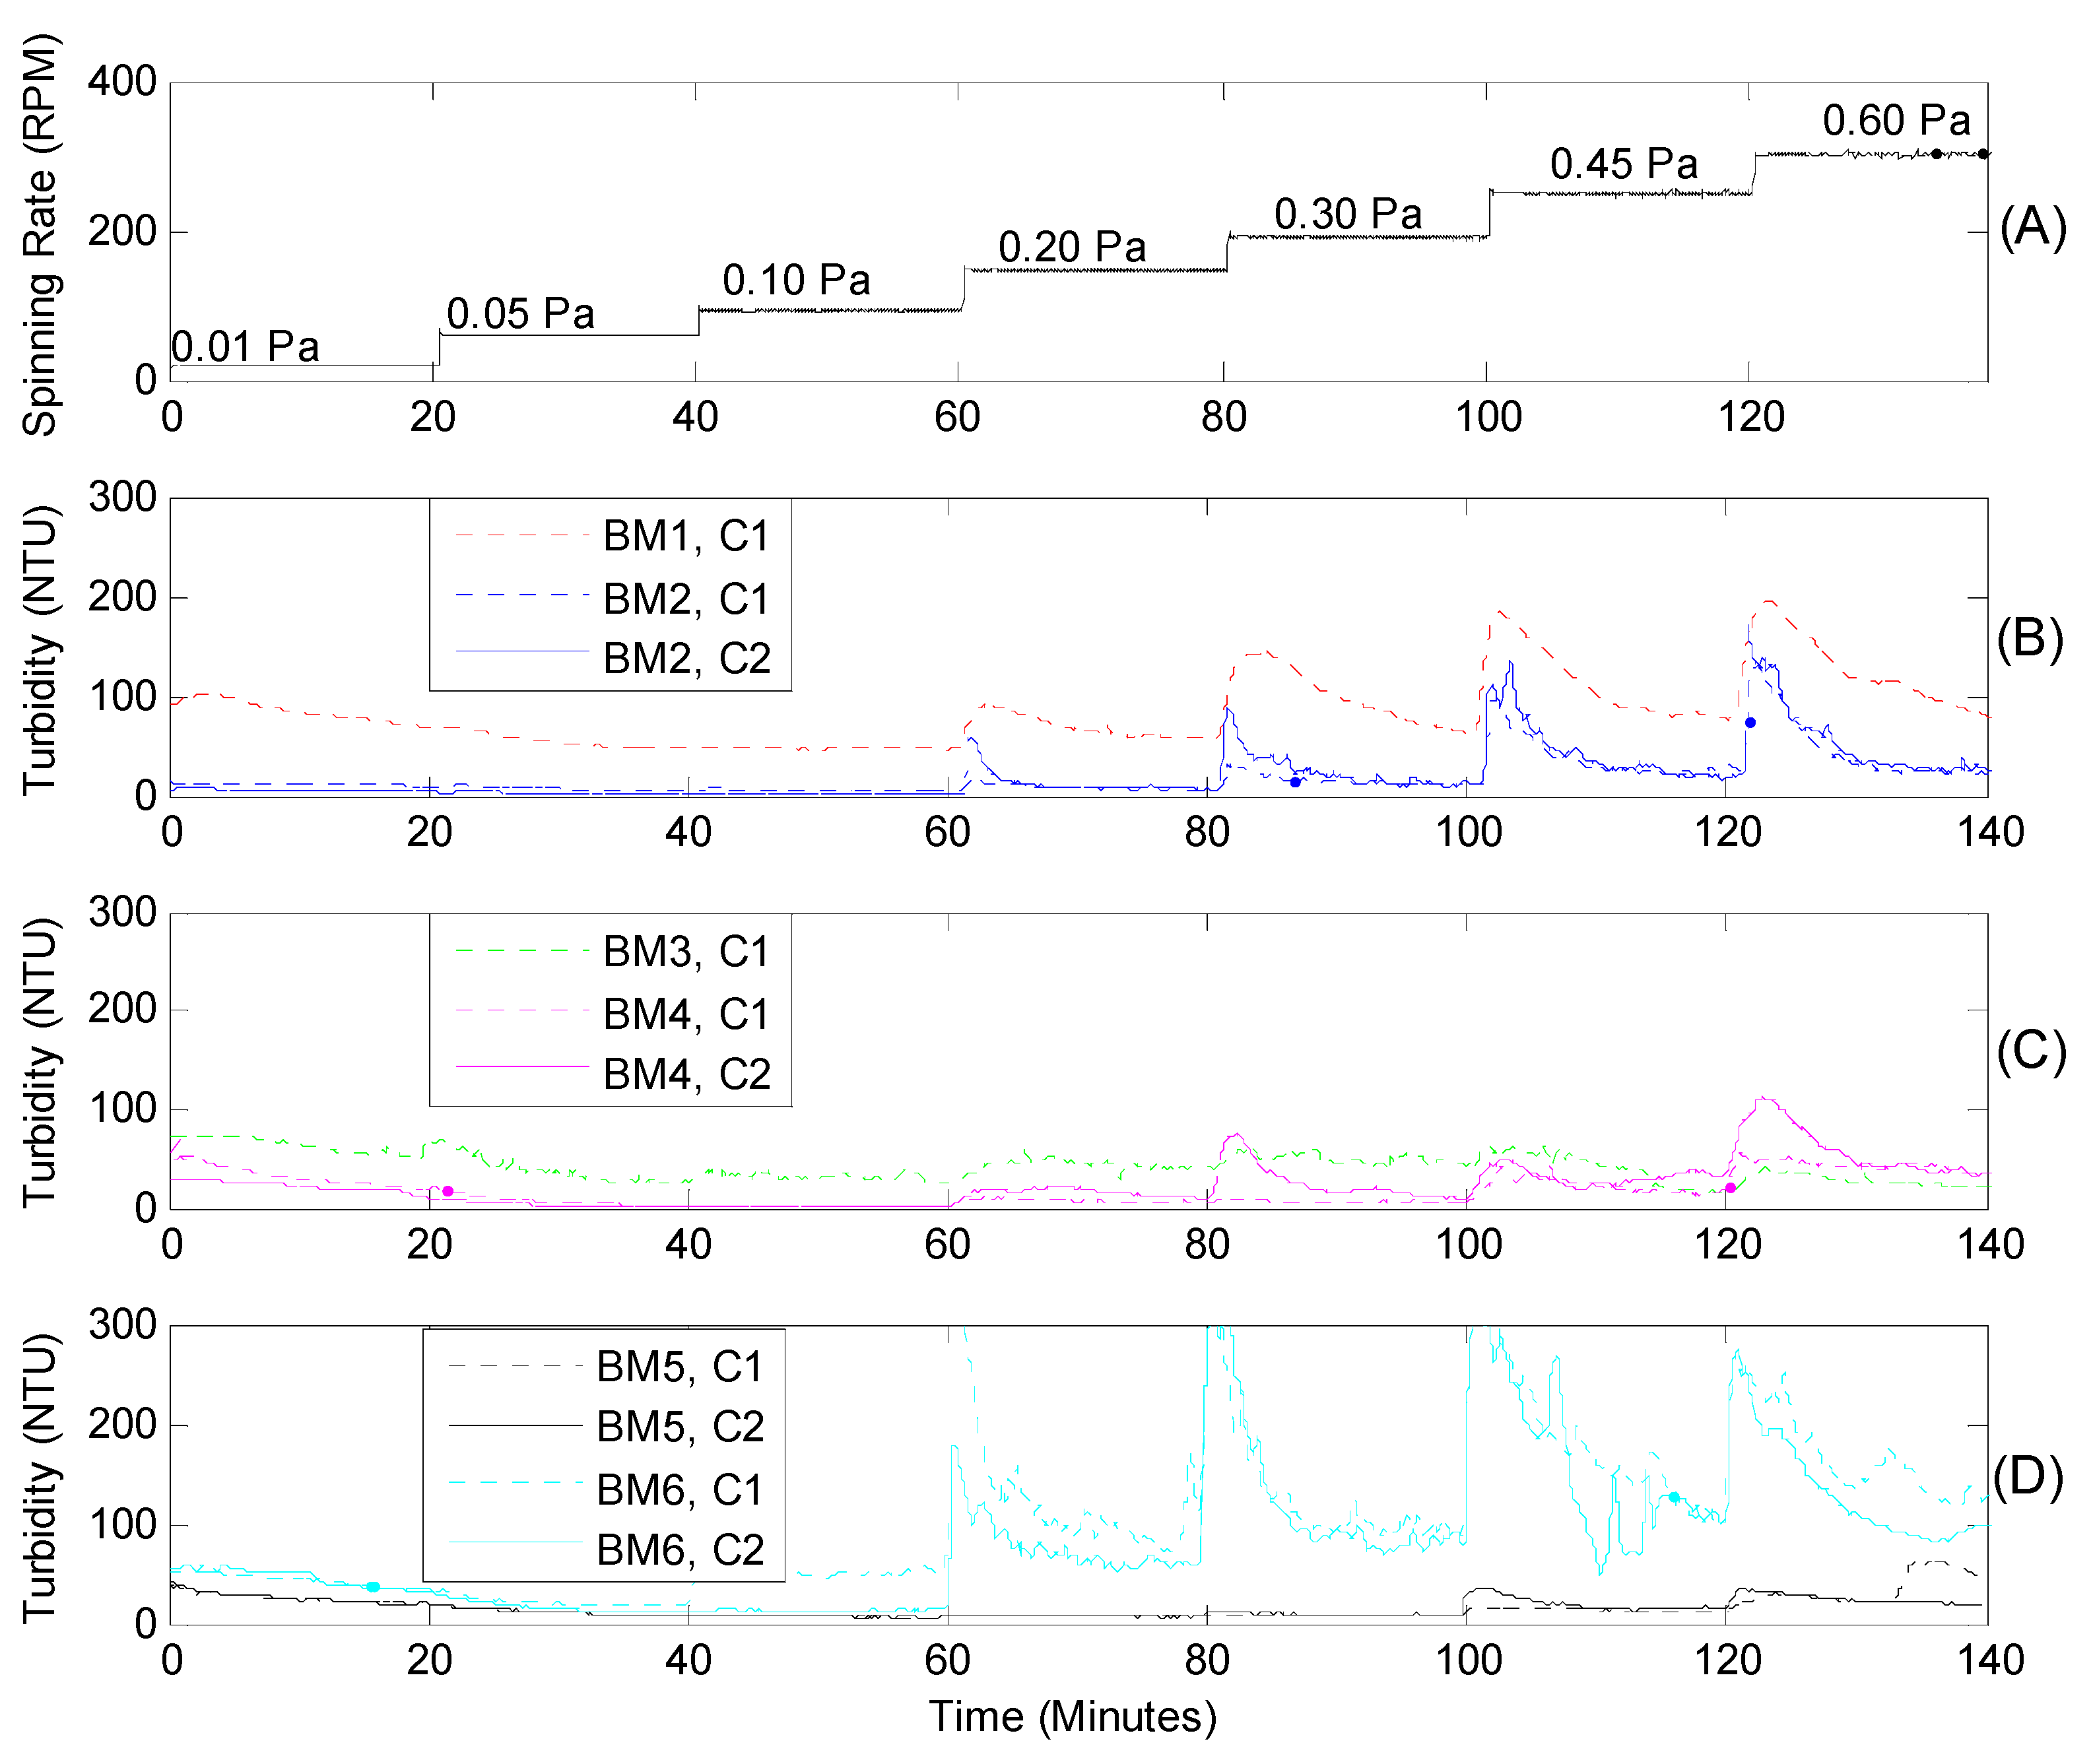
Although differing in magnitude, time-series turbidity derived from the resuspension of West Bay and Big Mar core tops generally displayed similar changes in response to seven levels of applied shear stresses from 0.01 to 0.6 Pa (Figure 7 and Figure 8). In most experiments the turbidity decreased with time during the first three time steps. When 0.20 Pa of shear stress was applied, turbidity spikes were found in most core tops. The highest turbidity generated among all the cores collected from West Bay was about 120 nephelometric turbidity units (NTU) in West Bay, but it was almost 300 NTU in Big Mar, indicating more mobile and erodible sediment at Big Mar. The response of Core BM3 was a bit abnormal (Figure 8). When core BM3 was taken in the field, a school of small shrimp was captured inside the core tube. During the erodibility experiment, shrimp were digging holes and disturbing sediment surface. As a result, turbidity spikes and exponential decays were not so obvious on the turbidity curve of BM3 (Figure 8C).
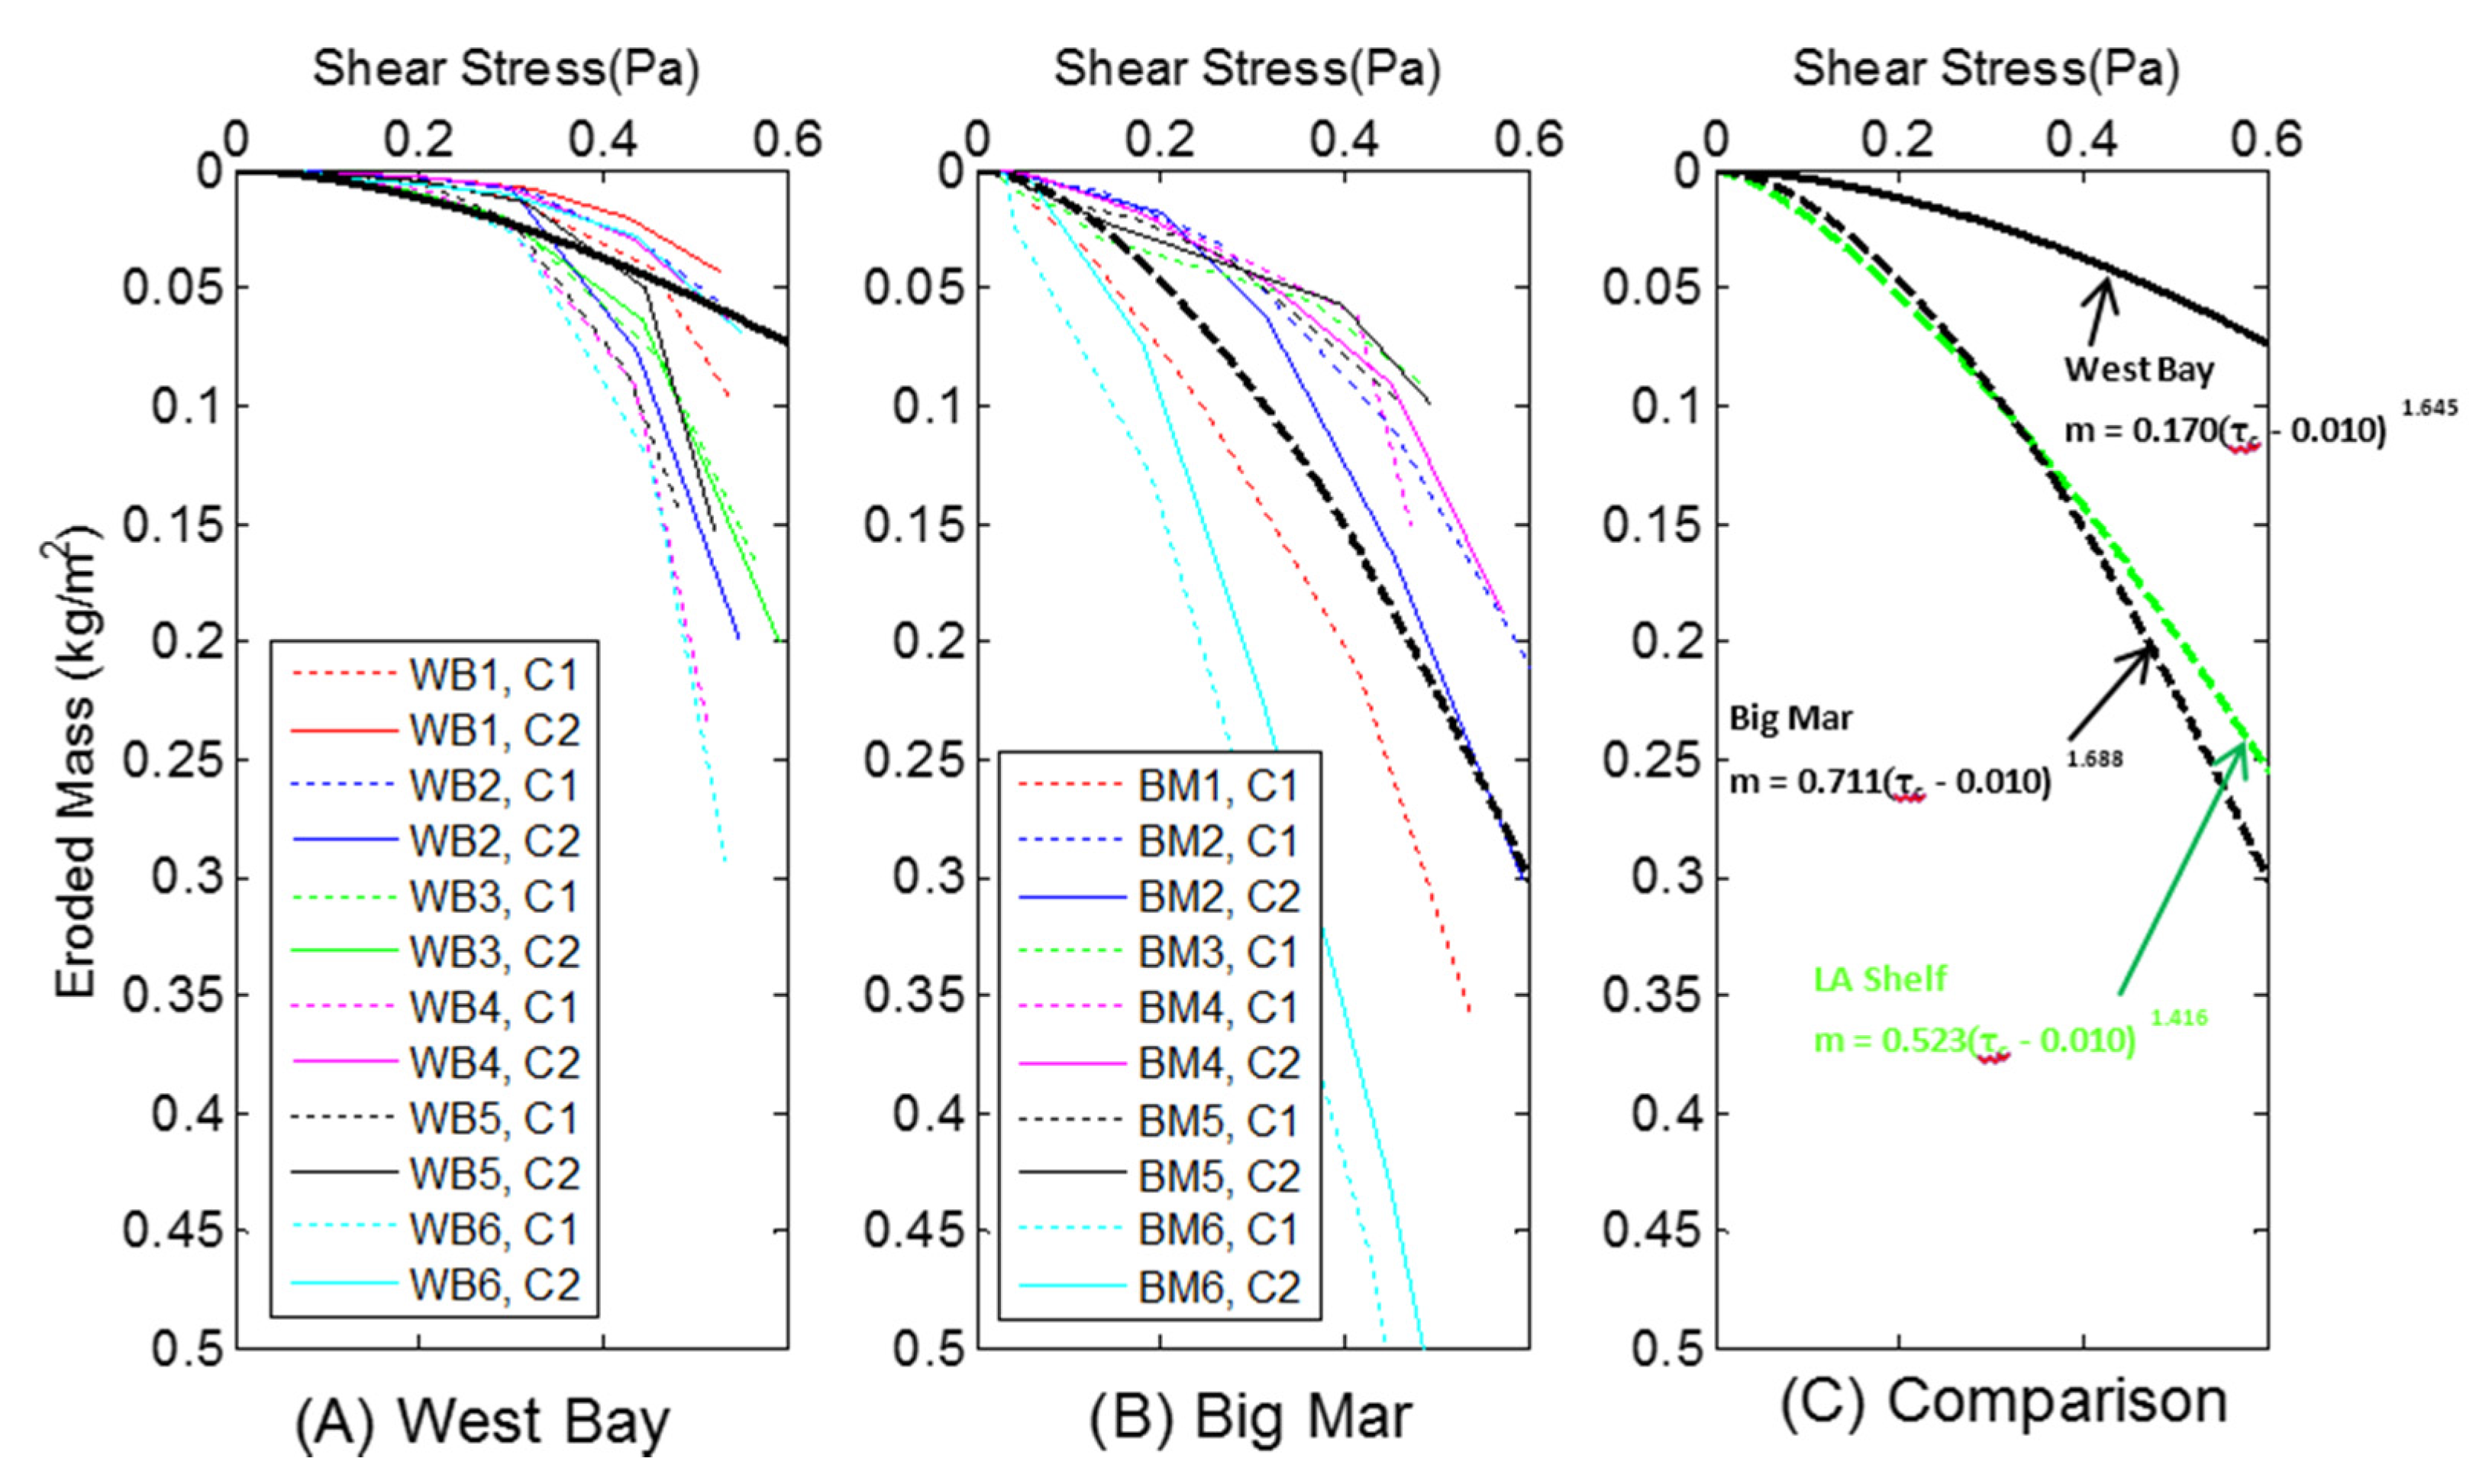
The relationship of eroded mass m and applied shear stress τc was established for all the cores collected at West Bay and Big Mar (Figure 9). Based on the best fit curves, 0.2 Pa also seemed to be the critical shear stress because the curves were relatively flat when shear stress was less than 0.2 Pa, to the right of which the curves are steeper. Based on the comparison of two average thick curves of West Bay and Big Mar, sediment from Big Mar was more erodible than that of West Bay (Figure 9).
Figure 7. (A) Spinning rate of erosional head (RPM, revolution per minute) and (BD) turbidity (NTU, nephelometric turbidity unit) of sediment suspended from core tops in six stations of West Bay. C1 and C2 were cores 1 and 2 collected at the same station and were measured at the same time using the dual-core Gust Erosion Microcosm System.
Water 08 00026 g007
Figure 8. (A) Spinning rate of erosional head (RPM, revolution per minute) and (BD) turbidity (NTU, nephelometric turbidity unit) of sediment suspended from core tops in six stations of Big Mar. C1 and C2 were cores 1 and 2 collected at the same station. Note that only one core was measured at BM1 and one at BM3.
Water 08 00026 g008
Figure 9. The curves of applied shear stress (Pa) vs. eroded mass (kg/m2) of stations in West Bay (A) and Big Mar (B); C1 and C2 were cores 1 and 2 collected at the same station. Thick black line in panel (A) and thick dashed line in panel (B) are the best fitting curves of all six stations for West Bay and Big Mar, respectively. (C) These two lines are compared with the curve derived from 106 sediment cores collected on Louisiana shelf by Xu et al. [18]. See black dots in Figure 1 for the locations of these 106 cores.
Water 08 00026 g009

5. Discussion

5.1. Critical Shear Stress and Erodibility Comparison

In this study the shear stress at which the first rapid increase of turbidity is generated is defined as the critical shear stress. Wright et al. [45] used a critical shear stress of 0.11 Pa for a sediment transport study in the inner Louisiana shelf. In a numerical modeling study by Xu et al. [46], 0.03 and 0.08 Pa was used as critical shear stress of fluvial sediment from the Mississippi and Atchafalaya rivers and these values were comparable to the values used in other studies of muddy river systems. In addition, Xu et al. [47] used 0.11 and 0.13 Pa for seabed sediment shear stress in a study of shelf sediment transport during Hurricanes Katrina and Rita. Based on our results in Figure 7, Figure 8 and Figure 9, 0.2 Pa seems to be the critical shear stress for the sediment resuspension on top of most cores. This 0.2 Pa initial shear stress indicates somewhat consolidated sediment in both West Bay and Big Mar. As shown in Figure 3, sediment cores were collected in November 2014 (a dry season) at West Bay and in March 2015 (after a long period of little to no discharge) at Big Mar. If we were able to collect sediment during the peak of flood season, freshly deposited sediment might be more erodible. After the flood season, finer and mobile sediment is winnowed out of the receiving basins firstly, and coarser sediment left in the receiving basins consolidates over time, leading to a higher critical shear stress in the dry season. Thus, 0.2 Pa is a good representation of critical shear stress of Louisiana bay sediment during winter-early spring season.
Xu et al. [18] collected a total of 106 sediment cores on Louisiana shelf in April and August of multiple years, and reported an averaged curve of eroded mass vs. shear stress (Figure 9C). Interestingly the curve provided by Xu et al. [18] is very similar to that of Big Mar (Figure 9C). Despite the differences in contrasting shelf and estuarine settings, the erodibility of Louisiana shelf sediment is similar to that of Big Mar. Comparing with West Bay, surficial sediment in Big Mar is finer and contains more organic matter (9.7% in Big Mar vs. 4.3% in West Bay; Table 2). The shallow average water depths of 0.23 m may also lead to frequent wave mobilization in Big Mar. When 0.45 Pa of shear stress is applied, the eroded mass is 0.044, 0.178 and 0.164 kg/m2 in West Bay, Big Mar, and Louisiana continental shelf, respectively.

5.2. Shear Stress in Louisiana Bays

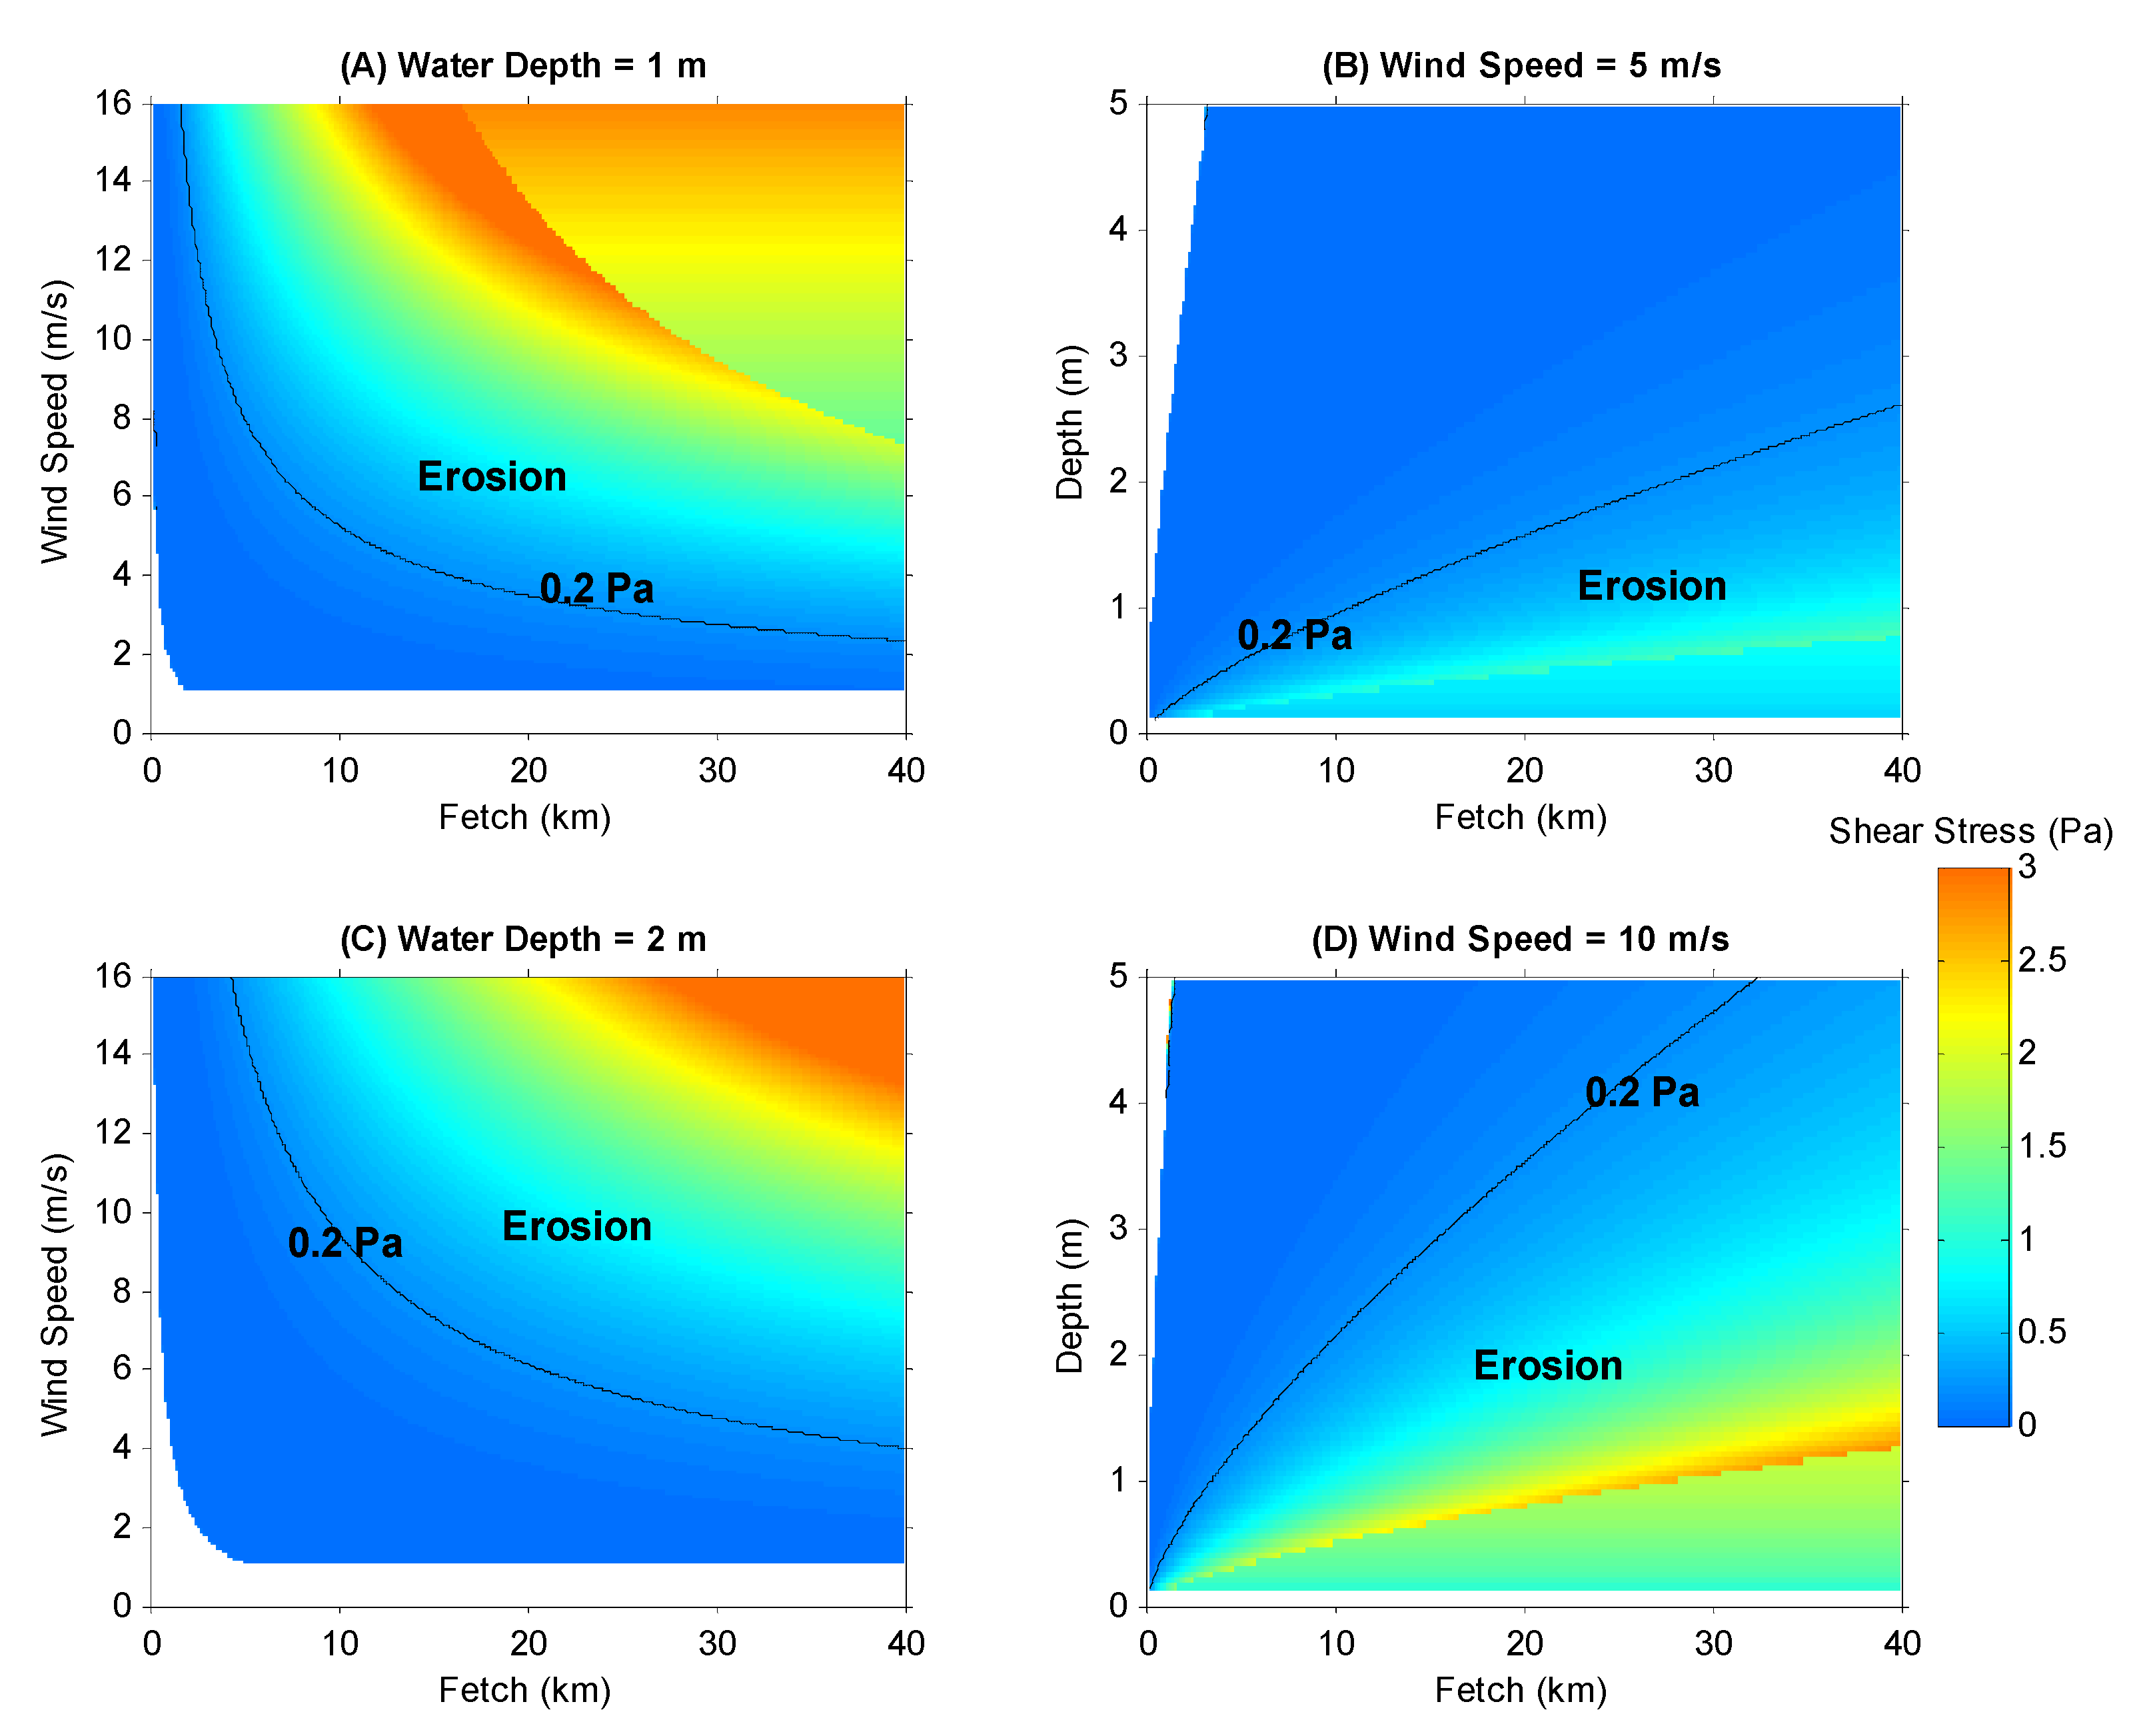
There are numerous bays and estuaries along the Louisiana coast, and their widths vary from <1 to 40 km and their depths are from nearly zero up to 5 m. For example, Lake Pontchartrain is about 40 km wide and its center is about 4.5 m deep; Big Mar is only about 2 km wide and 0.23 m deep. Based on Figure 3A, wind speed at 10 m above surface in Shell Beach varies between 3 and 14 m/s. Based on our calculation, for a shallow bay water depth of 1 m, increasing either fetch or wind speed generally yields higher shear stress (Figure 10A). Only about 2.2 m/s wind blowing over a bay 40 km wide and 1 m deep can generate shear stress of 0.2 Pa, sufficient to erode sediment (Figure 10A). Such conditions would be unfavorable for mud retention in coastal Louisiana bays. Mariotti and Fagherazzi [48] reported that when fluvial sediment supply to a bay is reduced, the land:water area ratio decreases, which in turn exposes more marsh edge to wave erosion. As more marsh edge erodes, the land:water area ratio decreases more, and the average wind fetch increases, generating larger waves and more erosion. Thus, there might be a tipping point at which wave-induced marsh edge erosion is accelerated [49]. Based on our analysis, smaller and deeper bays should experience lower bed shear stresses (Figure 10B,D) and have high muddy sediment retention. When water depths are between 0 and 1 m, however, the depth-limited waves can cause shoaling, which produces initial increase of shear stress, then decrease due to depth-limitation of wave height and period, as shown in the bottom right side of Figure 10B,D. Moreover, if wind speed is held constant at 10 m/s, >0.2 Pa of shear stress can be generated in almost any bays deeper than 0.5 m and wider than 2 km (Figure 10D). Since 10 m/s wind is common in Louisiana during frequent winter cold fronts (Figure 3A), sediment suspension is thus very common in winter in bays wider than 2 km in Louisiana coast.
Figure 10. Wave-induced shear stresses under the influence of fetch (in km) of the bay, wind speed at 10 m above sea surface (m/s), and water depth of the bay (m). Four scenarios are used: (A) water depth = 1 m; (B) wind speed = 5 m/s; (C) water depth = 2 m; and (D) wind speed = 10 m/s. Note that ~0.2 Pa is the critical shear stress to suspend sediment in West Bay and Big Mar.
Water 08 00026 g010

5.3. Sediment Texture

As mentioned above, mud and sand represent >80% and <20% of sediment load in the Mississippi/Atchafalaya water respectively [14]. Meselhe et al. [50] collected river sediment samples from the Myrtle Grove area under a range of discharge levels and reported that sand, silt and clay contents are 27%, 66% and 7%, respectively. In our study, a total of 12 surficial and 77 down-core samples were used for our grain size analysis. Bentley et al. [42,43] reported extensive down-core grain size data of sediment samples from nearly one hundred 3-m to 5-m long vibracores collected from lower and middle Breton Sound as well as lower and middle Barataria Bay (Figure 1). In addition, Elliton et al. [44] reported surficial sediment grain size on Mike Island, Wax Lake Delta, which is downstream of the Atchafalaya River system. Despite the diversity of datasets we have compiled, a surprising similarity can be found among the 1191 samples. On average, sand, silt and clay contents are 24.7%, 54.9% and 20.4%, respectively, in sediment samples from Louisiana bays and estuaries (Table 3). Thus, it is clear that silt is the largest fraction of not only river sediment but also the preserved sediment in bays and estuaries. However, the above percentages cannot be applied to very sandy environments like distributary channels and proximal parts of deltas along the Louisiana coast.

5.4. Sediment Retention Rate

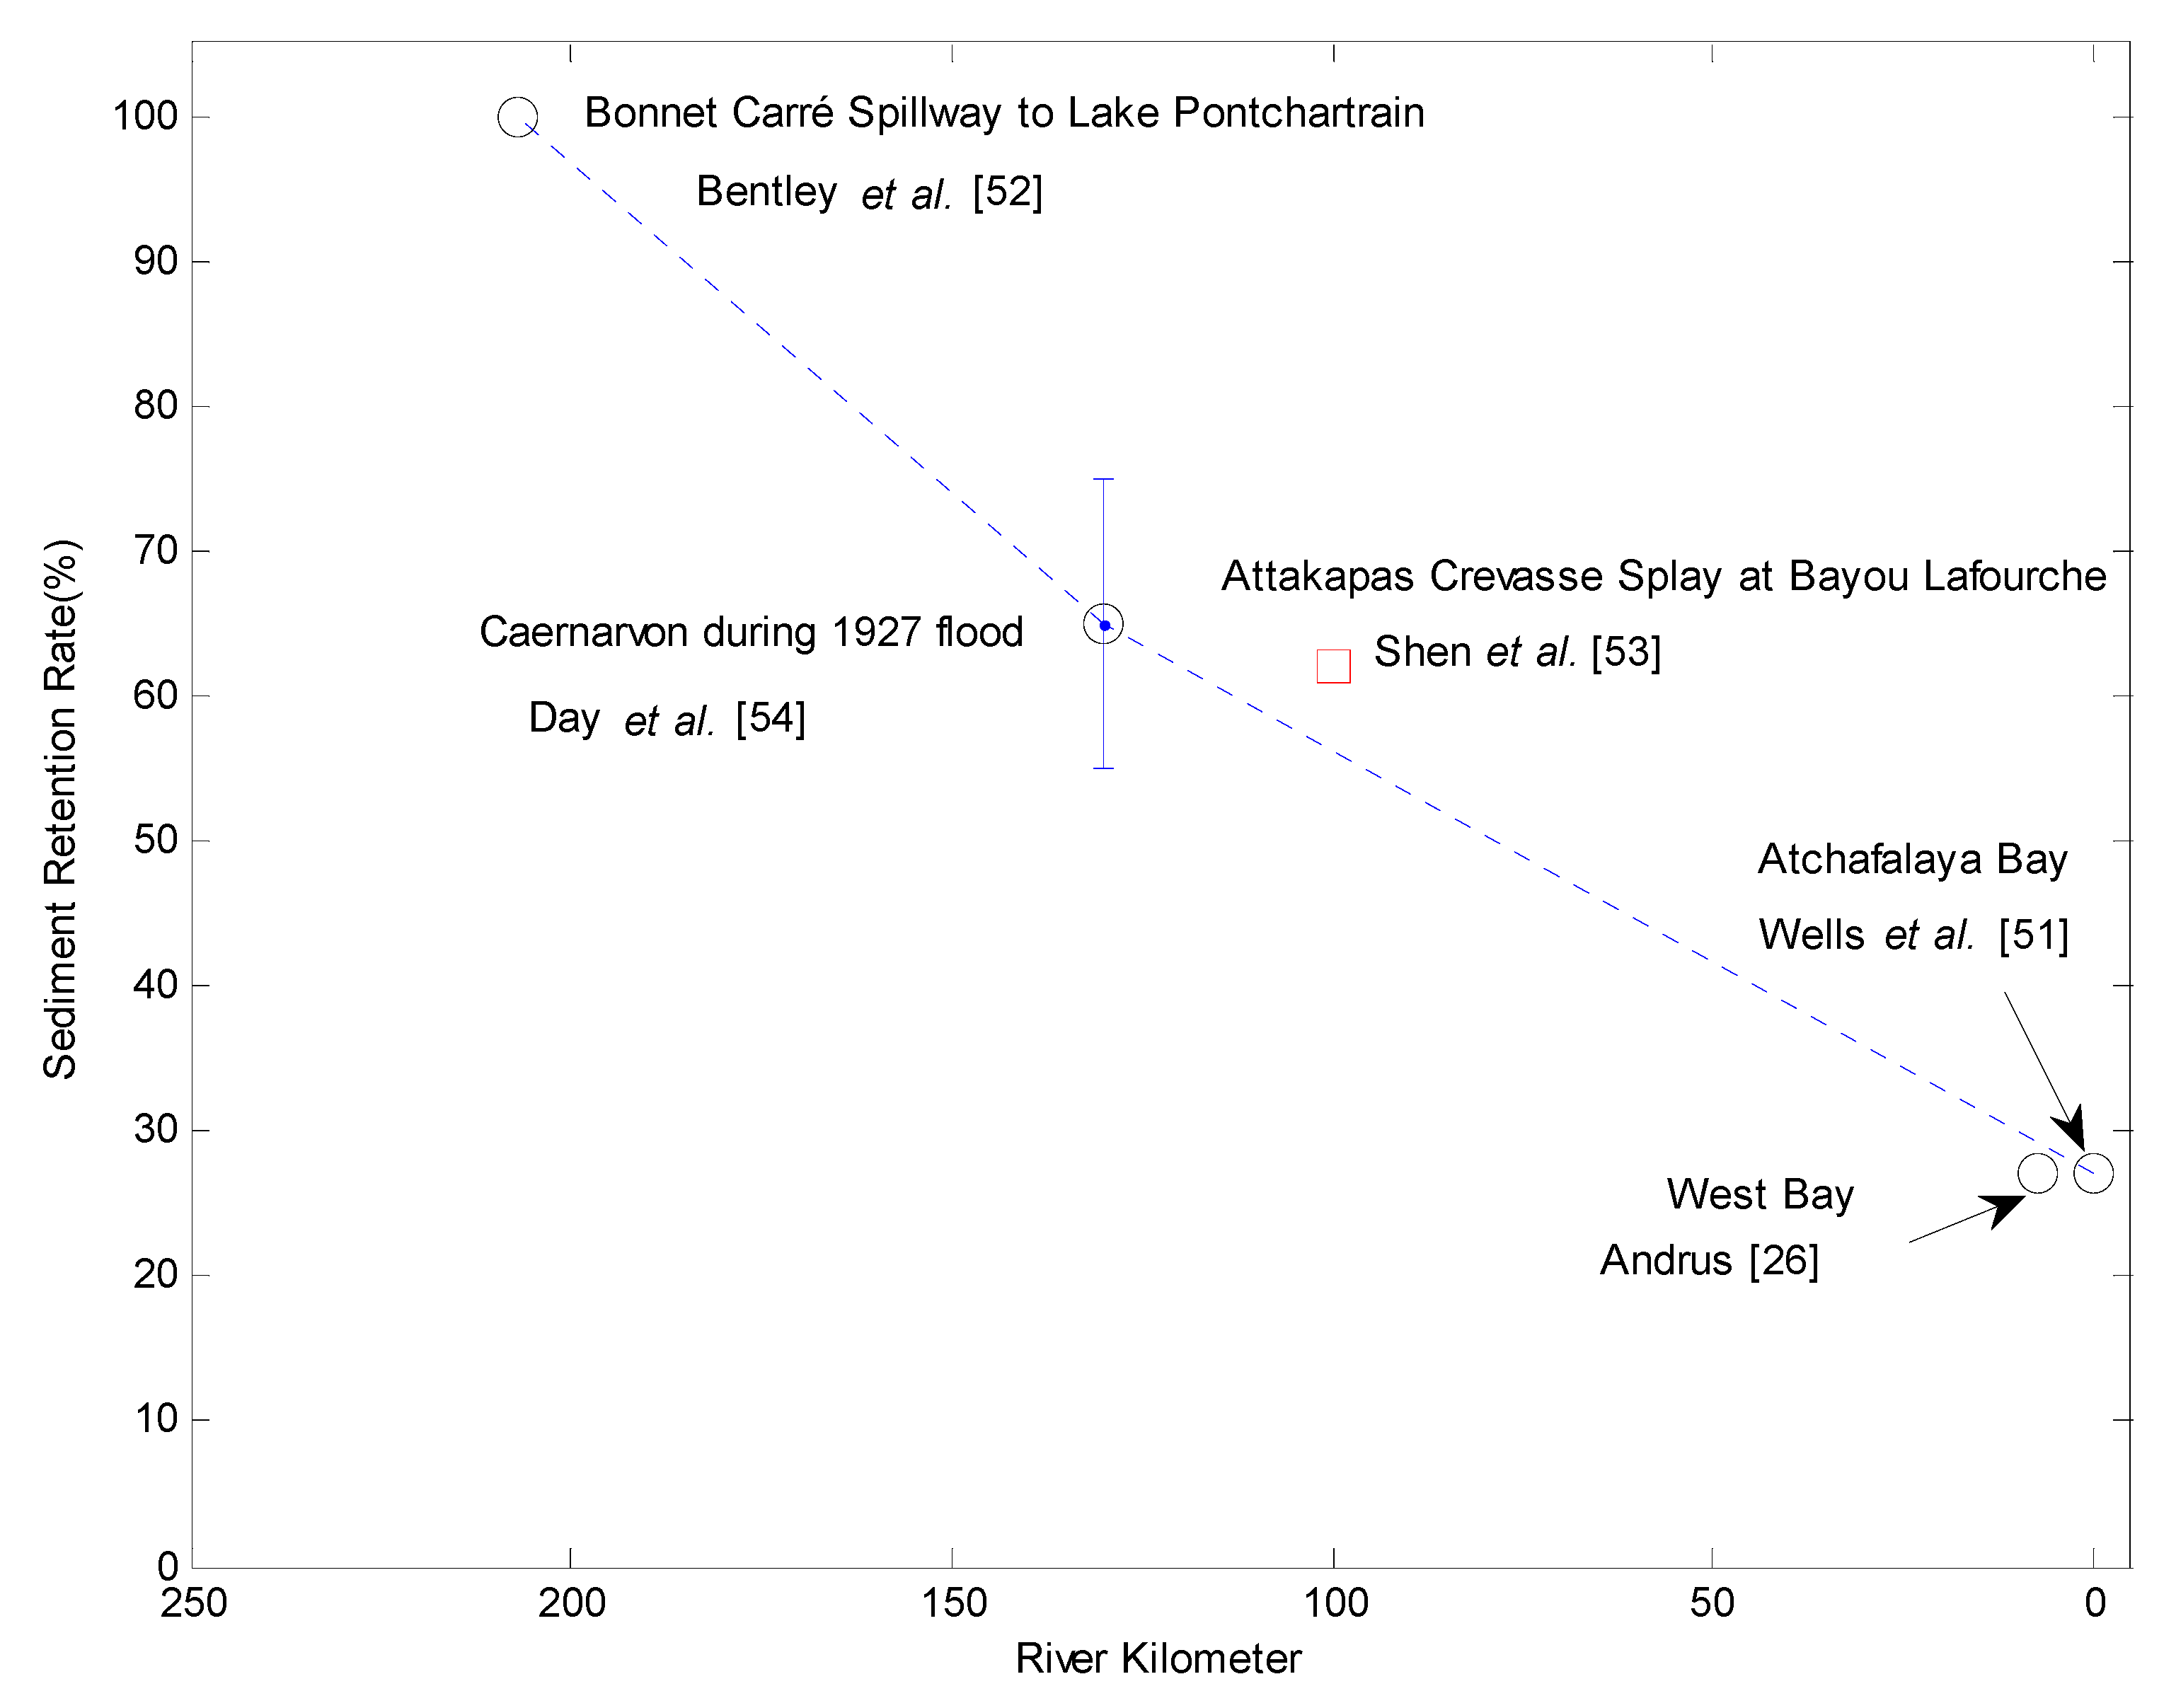
Although sediment budgets are poorly constrained for many rivers, Blum and Roberts [9] reported that about 30%–70% of the total sediment load can be trapped on the alluvial deltaic plain, with remaining amount transferred to the delta front and alongshore. However, before the retention rate can be calculated, the boundary of the receiving basin or calculated retention area must be defined. Our scientific community has not yet reached an agreement on this boundary. For consistency, our study defines the seaward boundary as the mouths of bays and the barrier islands in our discussion of sediment retention in Louisiana coast. Multiple studies on sediment retention have been performed in Louisiana. For example, Wells et al. [51] reported that the retention rate of Atchafalaya River sediment in Atchafalaya Bay is about 27%. Bentley et al. [52] found that the retention rate of Mississippi sediment in Lake Pontchartrain during the opening of Bonnet Carré Spillway in response to the 2011 great flood is nearly 100%. Shen [53] believed that the sediment retention in a crevasse splay of Bayou Lafourche (a paleo river course of the Mississippi system) is 62% or higher. Day et al. [54] reported that sediment retention in upper Breton Sound in response to a levee breach at Caernarvon during 1927 Mississippi River flood was from 55% to 75%. Moreover, Meselhe et al. developed a numerical model of Wax Lake Delta and reported that sand retention rate is close to 80%–100%, whereas mud retention is lower than ~30% (personal communication with E. Meselhe); their work reveals the preferential retention of coarser sediment in the receiving basin, which is typical in many sedimentary environments.
In this study, river kilometer (RK) is defined as the distance upstream from the “Head of Passes” (for either the Atchafalaya or Mississippi Rivers), and is roughly a proxy of the basin′s connectivity to the open ocean. Compiling the above information together, there seems to be a relationship between the river kilometer and retention rate in Louisiana estuaries and bays (Figure 11). In general, a more landward receiving basin correlates to a higher sediment retention rate (Figure 11).
Figure 11. The semi-quantitative relationship between river kilometer and sediment retention rate. Circles are for modern Mississippi and Atchafalaya systems, whereas the red square is for an ancient Bay Lafourche system [26,51,52,53,54]. The estimated rate by Day et al. [54] is between 55% and 75%.
Water 08 00026 g011

5.5. Implication for Sediment Diversion

In terms of the sediment budget in coastal Louisiana, silt is the largest fraction of both river-supplied sediment and retained sediment in receiving basins. Thus, sand, silt and clay all should be considered in the design of future sediment diversion projects. High-discharge diverted water carries more sediment into a receiving basin. However, the energetic flow of the diverted water flushes a large portion of fresh and unconsolidated mud out of the receiving basin, causing mud loss. Operation strategies should be considered that allow sediment consolidation and reduce sediment loss/bypass. This can also be used in intermittent diversion or the rotations on multiple receiving basins to maximize the benefit of total land gaining in Louisiana. However, such operation must be used with caution because it may cause large fluctuation in salinity in the receiving basins, which is a critical parameter to ecosystem and fish. Since the retention rates in more landward (large RK) receiving basins are generally higher than these of more seaward (small RK) basins, river mud can be diverted preferentially into a more protected/landward environment in which retention rates are high; similarly river sand can be transferred to a more seaward environment. Our calculation of wave-induced shear stress indicates that a smaller and deeper basin would yield a lower shear stress, which is more favorable for sediment retention. Thus, the fragmentation of large receiving basins can help decrease the fetch size which in turn facilitates retention. SREDs have been used in West Bay diversion for multiple years and seem to be an effective device to trap sediment and decrease wave fetch. Thus, SREDs might be considered for future diversions as well, especially when they are used in combination with marsh creation and dredging activities.

6. Conclusions

(1) Based on our synthesis of grain size data of 1191 sediment samples, sand, silt and clay contents are, respectively, 24.7%, 54.9% and 20.4% in surficial and down-core samples in Louisiana bays and estuaries. Silt is the largest fraction of not only river sediment but also retained sediment in receiving basins.
(2) The average erodibility of Big Mar sediment is similar to that of the Louisiana shelf, but is higher than that of West Bay. When 0.45 Pa shear stress is applied, the average eroded mass is 0.044, 0.178 and 0.164 kg/m2 in West Bay, Big Mar, and Louisiana continental shelf, respectively.
(3) There seems to be an inverse relationship between river kilometer and the retention rate based on the synthesis of multiple studies. Since the retention rate is high in more landward receiving basins, preferential delivery of fine grained materials to more landward and protected receiving basins would likely enhance mud retention.
(4) The critical shear stress for sediment resuspension in Louisiana bays is around 0.2 Pa. Under the influence of a variety of fetches, depths and wind speeds, >0.2 Pa can be generated in many bays and estuaries. The fragmentation of large receiving basins can help decrease the fetch sizes and minimize wave-induced sediment resuspension.

Acknowledgments

We are grateful to three anonymous reviewers and multiple editors for their critical reviews and helpful suggestions. Crawford White, Jiaze Wang, Jeff Bomer, Ethan Hughes, and Courtney Elliton contributed to laser grain size analysis of Breton Sound, Barataria Bay and Wax Lake Delta. Charlie Sibley and Bill Gibson of Field Support Group of LSU Coastal Studies Institute and Howard Callahan helped core collections in the field. John Lopez of Lake Pontchartrain Basin Foundation gave suggestions of the fieldwork in Big Mar. Patrick Dickhudt from US Army Corps of Engineers provided code for erodibility data processing. This project was funded by the Louisiana Coastal Protection and Restoration Authority through The Water Institute of the Gulf under project award numbers CPRA-2013-T11-SB02-DR, CPRA-2013-TO15-SB02-MA and CPRA-2013-TO16-SB02-MA. The views expressed in this publication are those of the authors and do not necessarily represent the views of the Coastal Protection and Restoration Authority or The Water Institute of the Gulf. This study was also funded by U.S. National Science Foundation′s Coastal SEES Program (Award # 1427389).

Author Contributions

Kehui Xu and Samuel Bentley developed the study concept and established the methods and procedures. Kehui Xu, Patrick Robichaux, Xiaoyu Sha and Haifei Yang carried out both field and lab work. The first manuscript draft was written by Kehui Xu and revised by Samuel Bentley. All authors read and approved the final manuscript.

Conflicts of Interest

The authors declare no conflict of interest.

References

  1. Syvitski, J.P.M.; Saito, Y. Morphodynamics of deltas under the influence of humans. Glob. Planet. Chang. 2007, 57, 261–282. [Google Scholar] [CrossRef]
  2. Syvitski, J.P.M.; Kettner, A.J.; Overeem, I.; Hutton, E.W.H.; Hannon, M.T.; Brakenridge, G.R.; Day, J.; Vorosmarty, C.; Saito, Y.; Giosan, L.; et al. Sinking deltas due to human activities. Nat. Geosci. 2009, 2, 681–686. [Google Scholar] [CrossRef]
  3. Vörösmarty, C.J.; Syvitski, J.; Day, J.; Sherbinin, A.D.; Giosan, L.; Paola, C. Battling to save the world's river deltas. Bull. At. Sci. 2009, 65, 31–43. [Google Scholar] [CrossRef]
  4. Tessler, Z.D.; Vörösmarty, C.J.; Grossberg, M.; Gladkova, I.; Aizenman, H.; Syvitski, J.P.M.; Foufoula-Georgiou, E. Profiling risk and sustainability in coastal deltas of the world. Science 2015, 349, 638–643. [Google Scholar] [CrossRef] [PubMed]
  5. Temmerman, S.; Kirwan, M.L. Building land with a rising sea. Science 2015, 349, 588–589. [Google Scholar] [CrossRef] [PubMed]
  6. Couvillion, B.R.; Barras, J.A.; Steyer, G.D.; Sleavin, W.; Fischer, M.; Beck, H.; Trahan, N.; Griffin, B.; Heckman, D. Land Area Change in Coastal Louisiana from 1932 to 2010: U.S. Geological Survey Scientific Investigations Map 3164, scale 1:265,000. 2011. Available online: http://pubs.usgs.gov/sim/3164/ (accessed on 18 January 2016). [Google Scholar]
  7. Day, J.W.; Boesch, D.F.; Clairain, E.J.; Kemp, G.P.; Laska, S.B.; Mitsch, W.J.; Orth, K.; Mashriqui, H.; Reed, D.J.; Shabman, L.; et al. Restoration of the mississippi delta: Lessons from Hurricanes Katrina and Rita. Science 2007, 315, 1679–1684. [Google Scholar] [CrossRef] [PubMed]
  8. Tornqvist, T.E.; Wallace, D.J.; Storms, J.E.A.; Wallinga, J.; van Dam, R.L.; Blaauw, M.; Derksen, M.S.; Klerks, C.J.W.; Meijneken, C.; Snijders, E.M.A. Mississippi delta subsidence primarily caused by compaction of holocene strata. Nat. Geosci. 2008, 1, 173–176. [Google Scholar] [CrossRef]
  9. Blum, M.D.; Roberts, H.H. Drowning of the mississippi delta due to insufficient sediment supply and global sea-level rise. Nat. Geosci. 2009, 2, 488–491. [Google Scholar] [CrossRef]
  10. Allison, M.A.; Meselhe, E.A. The use of large water and sediment diversions in the lower mississippi river (louisiana) for coastal restoration. J. Hydrol. 2010, 387, 346–360. [Google Scholar] [CrossRef]
  11. Meade, R.H.; Moody, J.A. Causes for the decline of suspended-sediment discharge in the mississippi river system, 1940–2007. Hydrol. Process. 2010, 24, 35–49. [Google Scholar] [CrossRef]
  12. Bentley, S.J.; Blum, M.D.; Maloney, J.; Pond, L.; Paulsell, R. The mississippi river source-to-sink system: Perspectives on Tectonic, Climatic, and Anthropogenic Influences, Miocene to Anthropocene. Earth Sci. Rev. 2015. [Google Scholar] [CrossRef]
  13. Coastal Protection and Restoration Authority (CPRA). Louisiana′s Comprehensive Master Plan for a Sustainable Coast; Coastal Protection and Restoration Authority of Louisiana: Baton Rouge, LA, USA, 2012.
  14. Allison, M.A.; Demas, C.R.; Ebersole, B.A.; Kleiss, B.A.; Little, C.D.; Meselhe, E.A.; Powell, N.J.; Pratt, T.C.; Vosburg, B.M. A water and sediment budget for the lower mississippi–atchafalaya river in flood years 2008–2010: Implications for Sediment Discharge to the Oceans and Coastal Restoration in Louisiana. J. Hydrol. 2012, 432–433, 84–97. [Google Scholar] [CrossRef]
  15. Kolker, A.S.; Miner, M.D.; Weathers, H.D. Depositional dynamics in a river diversion receiving basin: The Case of the West Bay Mississippi River Diversion. Estuar. Coast. Shelf Sci. 2012, 106, 1–12. [Google Scholar] [CrossRef]
  16. Turner, R.E.; Baustian, J.J.; Swenson, E.M.; Spicer, J.S. Wetland sedimentation from hurricanes katrina and rita. Science 2006, 314, 449–452. [Google Scholar] [CrossRef] [PubMed]
  17. Smith, J.; Bentley, S.; Snedden, G.; White, C. What role to hurricanes play in sediment delivery to subsiding river deltas? Sci. Rep. 2015, 5. [Google Scholar] [CrossRef] [PubMed]
  18. Xu, K.; Corbett, D.R.; Walsh, J.P.; Young, D.; Briggs, K.B.; Cartwright, G.M.; Friedrichs, C.T.; Harris, C.K.; Mickey, R.C.; Mitra, S. Seabed erodibility variations on the louisiana continental shelf before and after the 2011 mississippi river flood. Estuar. Coast. Shelf Sci. 2014, 149, 283–293. [Google Scholar] [CrossRef]
  19. Paola, C.; Twilley, R.R.; Edmonds, D.A.; Kim, W.; Mohrig, D.; Parker, G.; Viparelli, E.; Voller, V.R. Natural processes in delta restoration: Application to the Mississippi Delta. Annu. Rev. Mar. Sci. 2011, 3, 67–91. [Google Scholar] [CrossRef] [PubMed]
  20. Grabowski, R.C.; Droppo, I.G.; Wharton, G. Erodibility of cohesive sediment: The Importance of Sediment Properties. Earth Sci. Rev. 2011, 105, 101–120. [Google Scholar] [CrossRef]
  21. Roberts, H.H. Delta switching: Early Responses to the Atchafalaya River Diversion. J. Coast. Res. 1998, 14, 882–899. [Google Scholar]
  22. Soulsby, R. Dynamics of marine sands: A Manual for Practical Applications; Thomas Telford: London, UK, 1997. [Google Scholar]
  23. Whitehouse, R.J.S.; Soulsby, R.L.; Roberts, W.; Mitchener, H.J. Dynamics of Estuarine Muds, a Manual for Practical Applications; Thomas Telford: London, UK, 2000. [Google Scholar]
  24. Mickey, R.; Xu, K.; Libes, S.; Hill, J. Sediment texture, erodibility, and composition in the northern gulf of mexico and their potential impacts on hypoxia formation. Ocean Dyn. 2015, 65, 269–285. [Google Scholar] [CrossRef]
  25. Lo, E.; Bentley, S.J.; Xu, K. Experimental study of cohesive sediment consolidation and resuspension identifies approaches for coastal restoration: Lake Lery, Louisiana. Geo Mar. Lett. 2014, 34, 499–509. [Google Scholar] [CrossRef]
  26. Andrus, T.M. Sediment Flux and Fate in the Mississippi River Diversion at West Bay: Observation Study; Louisiana State University: Baton Rouge, LA, USA, 2007. [Google Scholar]
  27. Coleman, J.M.; Gagliano, S.M. Cyclic sedimentation in the mississippi river deltaic plain. Gulf Coast Assoc. Geol. Soc. Trans. 1964, 14, 67–80. [Google Scholar]
  28. Lane, R.; Day, J.; Day, J. Wetland surface elevation, vertical accretion, and subsidence at three louisiana estuaries receiving diverted mississippi river water. Wetlands 2006, 26, 1130–1142. [Google Scholar] [CrossRef]
  29. Lane, R.; Day, J.; Thibodeaux, B. Water quality analysis of a freshwater diversion at Caernarvon, Louisiana. Estuaries 1999, 22, 327–336. [Google Scholar] [CrossRef]
  30. Huang, H.; Justic, D.; Lane, R.R.; Day, J.W.; Cable, J.E. Hydrodynamic response of the breton sound estuary to pulsed mississippi river inputs. Estuar. Coast. Shelf Sci. 2011, 95, 216–231. [Google Scholar] [CrossRef]
  31. Lopez, J.A.; Henkel, T.K.; Moshogianis, A.M.; Baker, A.D.; Boyd, E.C.; Hillmann, E.R.; Connor, P.F.; Baker, D.B. Examination of deltaic processes of mississippi river outlets-caernarvon delta and bohemia spillway in southeastern louisiana. Gulf Coast Assoc. Geol. Sci. Trans. 2014, 3, 79–93. [Google Scholar]
  32. Gust, G.; Muller, V. Interfacial hydrodynamics and entrainment functions of currently used erosion devices. In Cohesive Sediments; Burt, N., Parker, R., Watts, J., Eds.; Wiley: Wallingford, UK, 1997; pp. 149–174. [Google Scholar]
  33. Sanford, L.P.; Maa, J.P.Y. A unified erosion formulation for fine sediments. Mar. Geol. 2001, 179, 9–23. [Google Scholar] [CrossRef]
  34. Dickhudt, P.J.; Friedrichs, C.T.; Schaffner, L.C.; Sanford, L.P. Spatial and temporal variation in cohesive sediment erodibility in the york river estuary, eastern USA: A Biologically Influenced Equilibrium Modified by Seasonal Deposition. Mar. Geol. 2009, 267, 128–140. [Google Scholar] [CrossRef]
  35. Dickhudt, P.J.; Friedrichs, C.T.; Sanford, L.P. Mud matrix solids fraction and bed erodibility in the york river estuary, USA, and other muddy environments. Cont. Shelf Res. 2011, 31. [Google Scholar] [CrossRef]
  36. Sanford, L.P. Uncertainties in sediment erodibility estimates due to a lack of standards for experimental protocols and data interpretation. Integr. Environ. Assess. Manag. 2006, 2, 29–34. [Google Scholar] [CrossRef] [PubMed]
  37. Xu, K.; Sanger, D.; Riekerk, G.; Crowe, S.; van Dolah, R.F.; Wren, P.A.; Ma, Y. Seabed texture and composition changes offshore of port royal sound, south carolina before and after the dredging for beach nourishment. Estuar. Coast. Shelf Sci. 2014, 149, 57–67. [Google Scholar] [CrossRef]
  38. Folk, R.L. A review of grain-szie parameters. Sedimentology 1966, 6, 73–93. [Google Scholar] [CrossRef]
  39. Heiri, O.; Lotter, A.; Lemcke, G. Loss on ignition as a method for estimating organic and carbonate content in sediments: Reproducibility and Comparability of Results. J. Paleolimnol. 2001, 25, 101–110. [Google Scholar] [CrossRef]
  40. US Army Corps of Engineers (US-ACE). Coastal Engineering Manual 1110-2-1100; US Army Corps of Engineers: Washington, DC, USA, 2002. [Google Scholar]
  41. LD, W. Morphodynamics of Inner Continental Shelves; CRC Press: Boca Raton, FL, USA, 1995. [Google Scholar]
  42. Bentley, S.J.; Xu, K.; Chen, Q. Data Report: Geological and Geotechnical Characterization for Lower Barataria Bay and Lower Breton Sound Diversion Receiving Basins; Coastal Studies Technical Report for the Water Institute of the Gulf; The Water Institute of the Gulf: Baton Rouge, LA, USA, February 2015. [Google Scholar]
  43. Bentley, S.J.; Xu, K.; Chen, Q. Data Report: Geological and Geotechnical Characterization for Middle Barataria Bay and Middle Breton Sound Diversion Receiving Basins; Coastal Studies Technical Report for the Water Institute of the Gulf; The Water Institute of the Gulf: Baton Rouge, LA, USA, October 2015. [Google Scholar]
  44. Elliton, C.; Xu, K.; Rivera-Monroy, V.H.; Twilley, R.R.; Castañeda-Moya, E. Riverine sediment pulsing and plant-sediment interactions drive changes in sediment dynamics in naturally created deltas. In Proceedings of the Ocean Sciences Meeting, New Orleans, LA, USA, 21–26 Feburary 2016.
  45. Wright, L.D.; Sherwood, C.R.; Sternberg, R.W. Field measurements of fairweather bottom boundary layer processes and sediment suspension on the louisiana inner continental shelf. Mar. Geol. 1997, 140, 329–345. [Google Scholar] [CrossRef]
  46. Xu, K.; Harris, C.K.; Hetland, R.D.; Kaihatu, J.M. Dispersal of mississippi and atchafalaya sediment on the texas–louisiana shelf: Model Estimates for the Year 1993. Cont. Shelf Res. 2011, 31, 1558–1575. [Google Scholar] [CrossRef]
  47. Xu, K.; Mickey, R.C.; Chen, Q.; Harris, C.K.; Hetland, R.D.; Hu, K.; Wang, J. Shelf sediment transport during hurricanes katrina and rita. Comput. Geosci. 2015. [Google Scholar] [CrossRef]
  48. Mariotti, G.; Fagherazzi, S. Critical width of tidal flats triggers marsh collapse in the absence of sea-level rise. Proc. Natl. Acad. Sci. USA 2013, 110, 5353–5356. [Google Scholar] [CrossRef] [PubMed]
  49. Twilley, R.R.; Sr, S.J.B.; Chen, Q.J.; Edmonds, D.A.; Hagen, S.C.; Lam, N.; Willson, C.S.; Xu, K.; Braud, D.; Peele, H. Co-evolution of wetland landscapes, flooding and human settlement in the mississippi river deltaic plain. Sustain. Sci. 2016, in press. [Google Scholar]
  50. Meselhe, E.A.; Georgiou, I.; Allison, M.A.; McCorquodale, J.A. Numerical modeling of hydrodynamics and sediment transport in lower mississippi at a proposed delta building diversion. J. Hydrol. 2012, 472–473, 340–354. [Google Scholar] [CrossRef]
  51. Wells, J.T.; Chinburg, S.J.; Coleman, J.M. The Atchafalaya River Delta, Report 4: Generic Analysis of Delta Development; Technical Report HL82-15; US Army Corps of Engineers: Vicksburg, MS, USA, 1984. [Google Scholar]
  52. Bentley, S.J.; Fabre, J.; Li, C.; Smith, E.; Walker, N.; White, J.R.; Rouse, L.; Bargu, S. Fluvial Sediment Flux during High Discharge Events: Harnessing Mississippi River Sediment to Build New Land on an Endangered Coast. In Proceedings of the Ocean Sciences Meeting, Salt Lake City, UT, USA, 20–24 Feburary 2012.
  53. Shen, Z. Using the late holocene stratigraphic record to guide mississippi delta restoration. In Proceedings of the State of the Coast Conference, New Orleans, LA, USA, 18–20 March 2014.
  54. Day, J.W.; Cable, J.E.; Lane, R.R.; Kemp, G.P. Sediment deposition at the Caernarvon Crevasse during the great Mississippi Flood of 1927: Implications for Coastal Restoration. Water 2016, in press. [Google Scholar]