
Evaluating Groundwater Management Sustainability under Limited Data Availability in Semiarid Zones

 ,
, 
 ,
,
Abstract
:1. Introduction
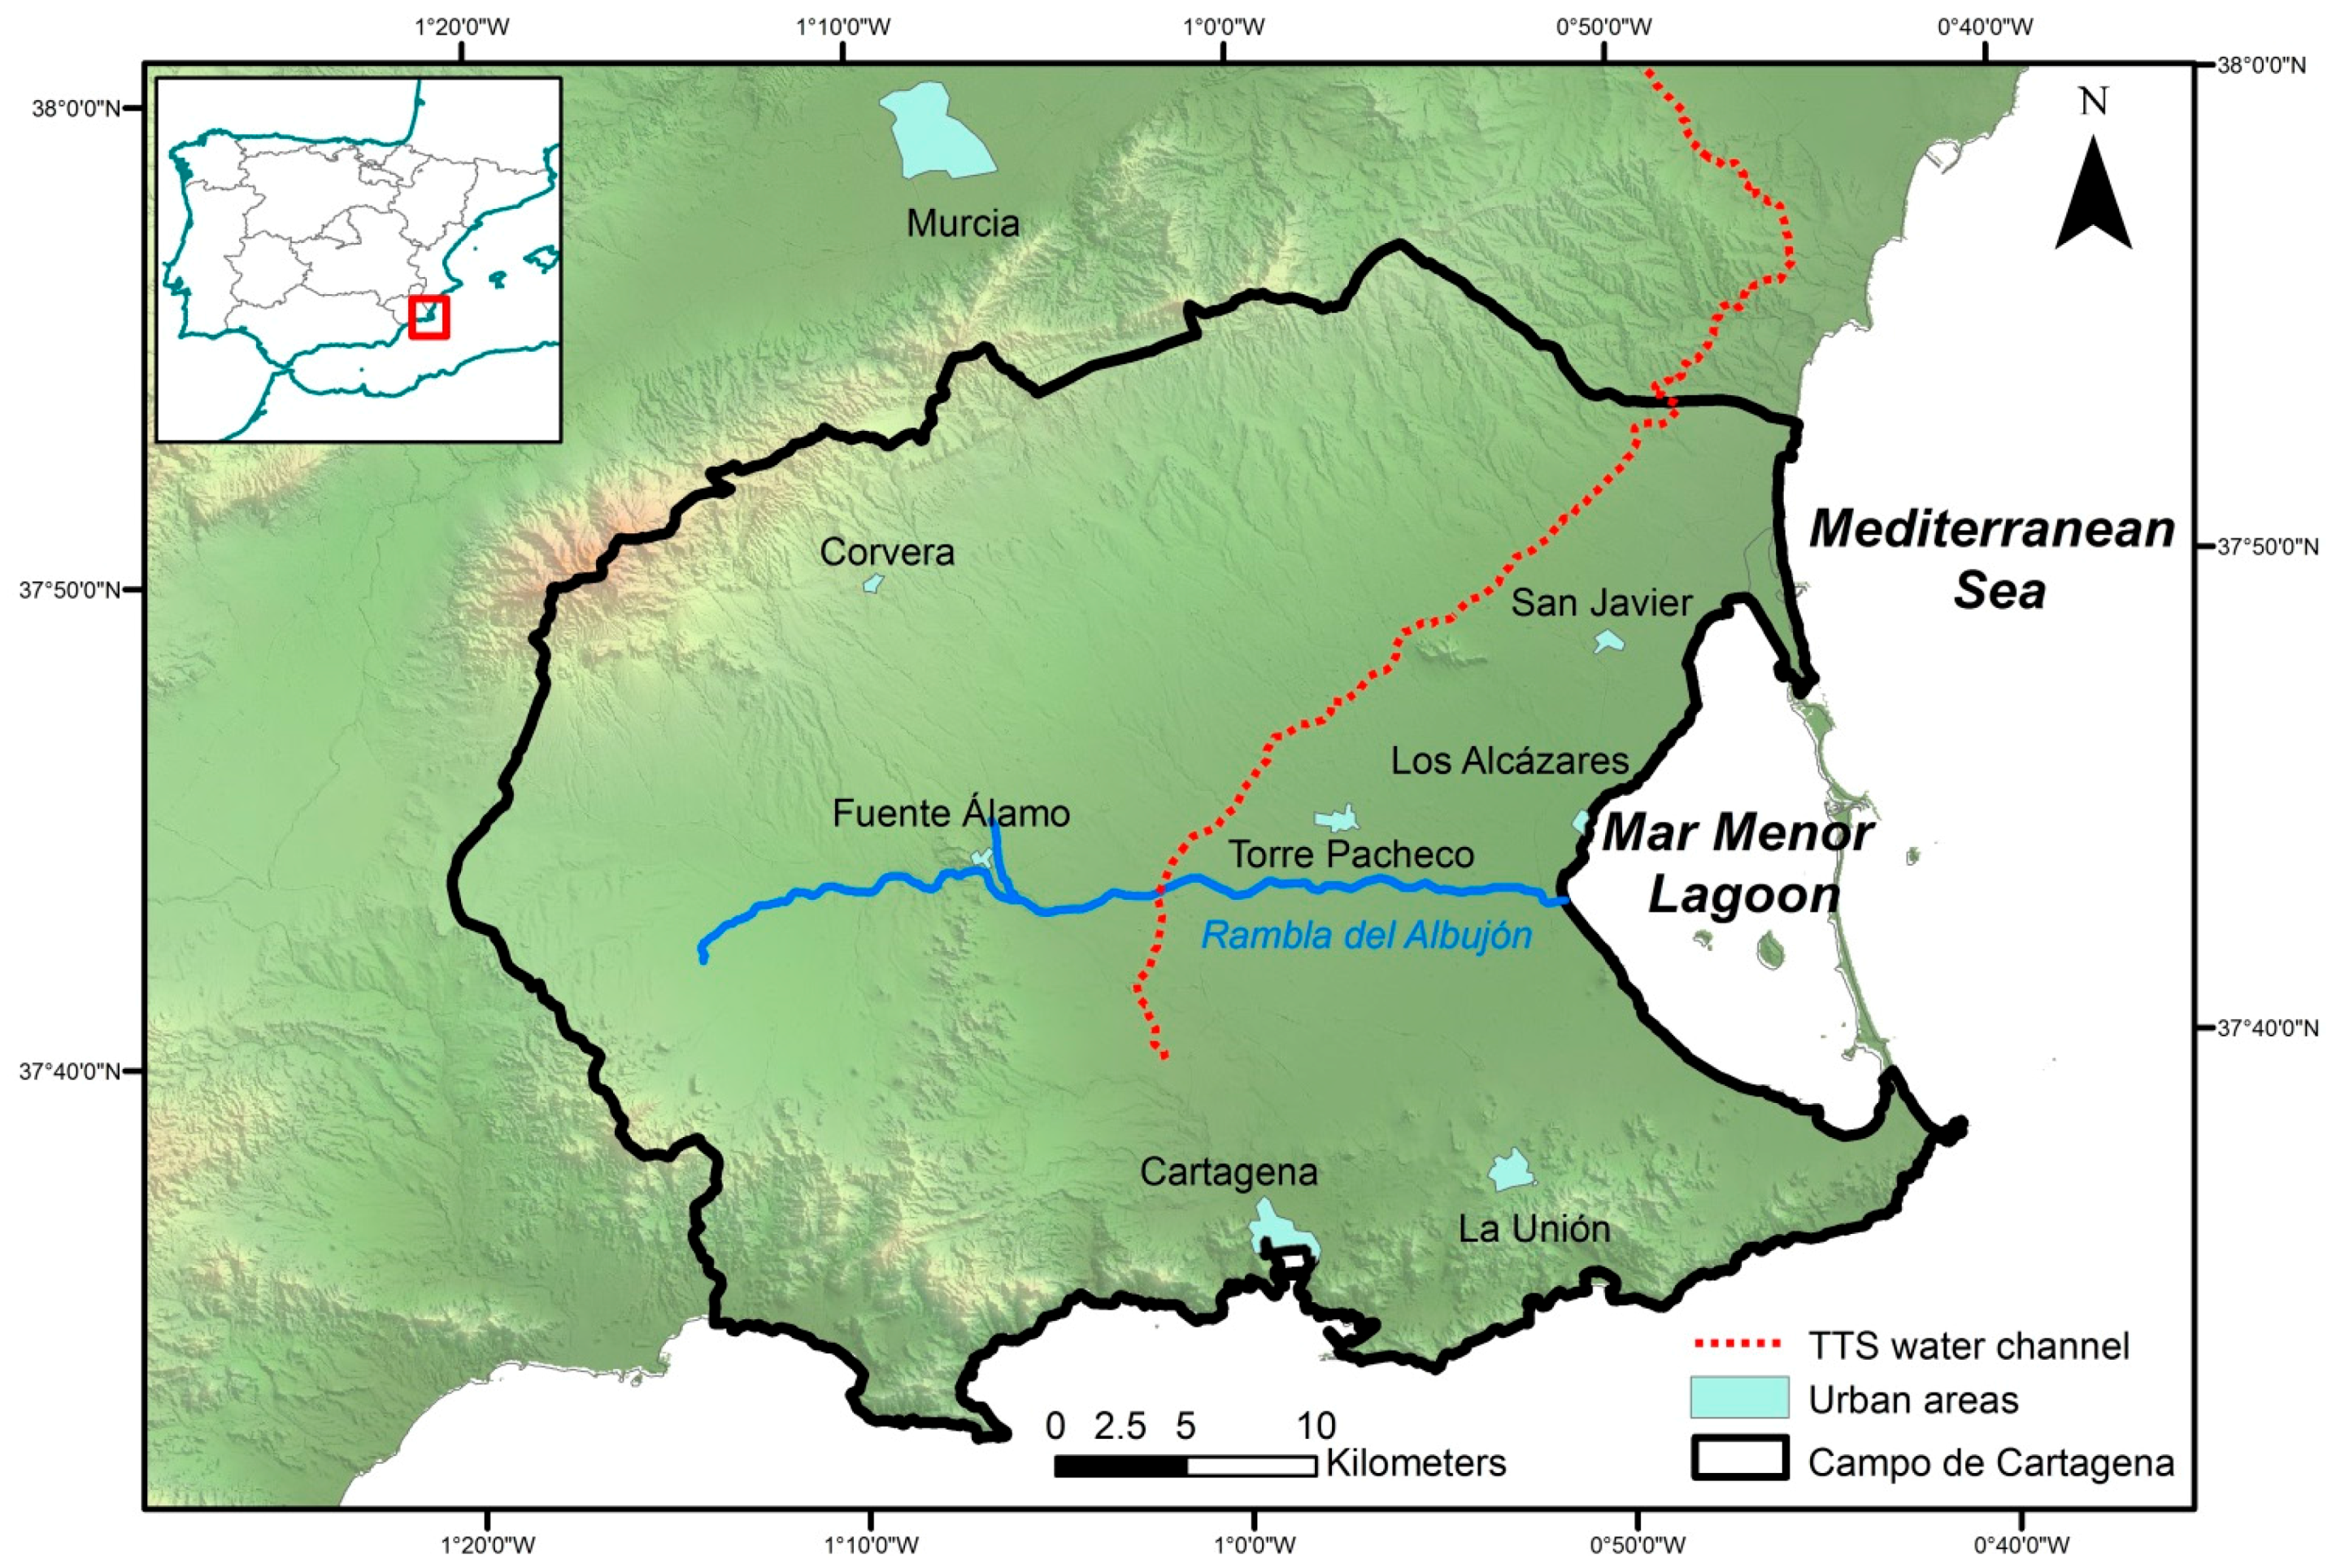
2. Case Study Area
3. Materials and Methods

| Indicators | Parameters | ||
|---|---|---|---|
| Pressure | State | Response | |
| (H) Hydrogeology | Variation in the groundwater depletion in the period studied, relative to the long-term average | Groundwater as a percentage of total use of irrigation water | Evolution in non-conventional water resources supply |
| Variation in the Nitrate concentration in the period analysed | Sampling points that meet quality standards in the period analysed | Improvement in nitrate contamination in the period analysed | |
| (E) Environment | Averaged variation of basin agricultural area and urban population in the period analysed | % of basin area with natural vegetation | Evolution in basin conservation in the period analysed |
| (L) Life | Variation in the basin per capita income in the period analysed | Basin HDI (weighed by county population) | Evolution in the basin HDI in the period analysed |
| (P) Policy | Variation in the basin HDI-Education in the period analysed | Basin institutional capacity in IWRM | Evolution in the basin’s IWRM expenditures in the period analysed |
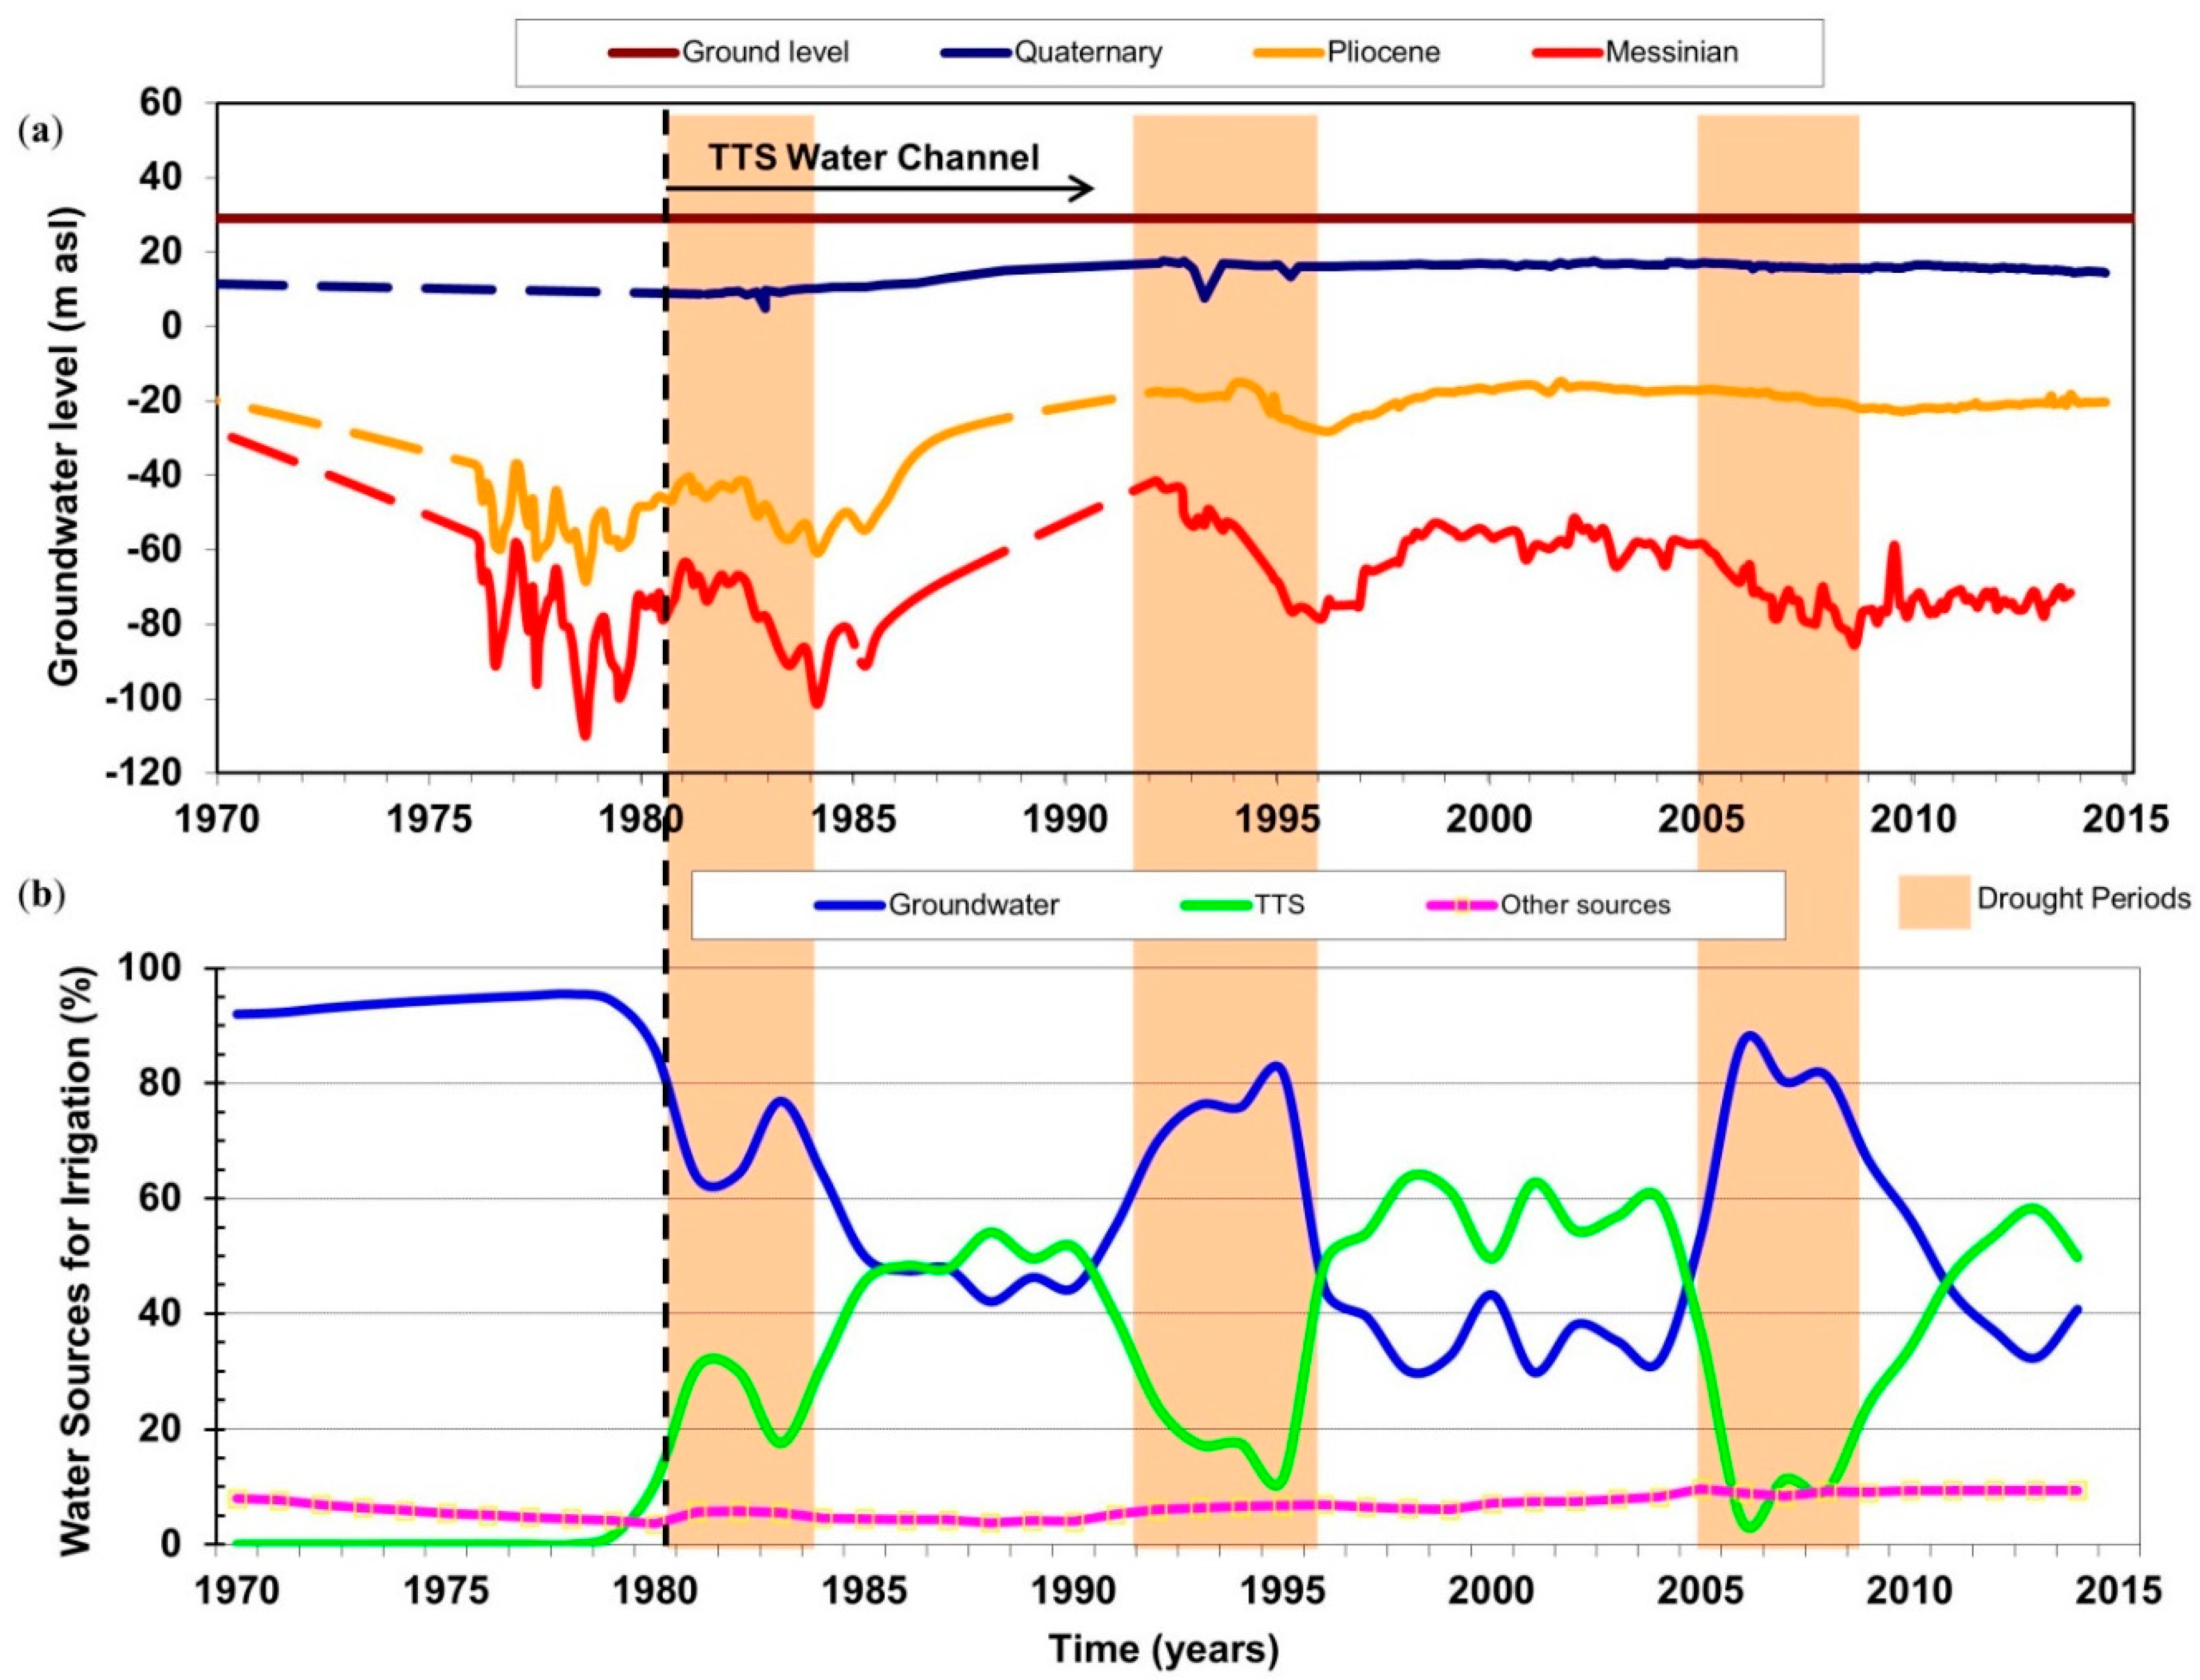
3.1. Hydrogeology
3.1.1. Quantity

| Stages | Parameters | Level | Score |
|---|---|---|---|
| Pressure | Δ1, Δ2 Variation in the groundwater depletion in the period studied, relative to the long-term average | Δ1 ≤ 40% | 0.00 |
| 40% < Δ1 < 80% | 0.25 | ||
| Δ1 ≥ 80% | 0.50 | ||
| Δ2 ≤ 20% | |||
| 20% < Δ2 < 60% | 0.75 | ||
| Δ2 ≥ 60% | 1.00 | ||
| Variation in the nitrate concentration in the period studied, relative to the long-term average | Δ ≥ 20% | 0.00 | |
| 10% ≤ Δ < 20% | 0.25 | ||
| −10% ≤ Δ < 10% | 0.50 | ||
| −20% ≤ Δ < −10% | 0.75 | ||
| Δ < −20% | 1.00 | ||
| State | Groundwater as a percentage of total use of irrigation water | Δ ≥ 80% | 0.00 |
| 70% ≤ Δ < 80% | 0.25 | ||
| 60% ≤ Δ < 70% | 0.50 | ||
| 50% ≤ Δ < 60% | 0.75 | ||
| Δ < 50% | 1.00 | ||
| Percentage of sampling points that meet quality standards in the period studied (nitrate concentration ≤50 mg/L) | Δ ≤ 20% | 0.00 | |
| 20% < Δ ≤ 40% | 0.25 | ||
| 40% < Δ ≤ 60% | 0.50 | ||
| 60% < Δ ≤ 80% | 0.75 | ||
| Δ > 80% | 1.00 | ||
| Response | Non-conventional water resources supply in the study area, relative to the conventional water resources in the period studied | Δ = 0% | 0.00 |
| 0% < Δ ≤ 5% | 0.25 | ||
| 5% < Δ ≤ 10% | 0.50 | ||
| 10% < Δ ≤ 20% | 0.75 | ||
| Δ > 20% | 1.00 | ||
| Improvement in nitrate concentration in the aquifer, in the period studied | Very poor | 0.00 | |
| Poor | 0.25 | ||
| Medium | 0.50 | ||
| Good | 0.75 | ||
| Excellent | 1.00 |
3.1.2. Quality
3.2. Environment
| Stages | Parameters | Level | Score |
|---|---|---|---|
| Pressure | Averaged variation of basin agricultural area and urban population in the period analysed | Δ ≥ 20% | 0.00 |
| 10% ≤ Δ < 20% | 0.25 | ||
| 5% ≤ Δ < 10% | 0.50 | ||
| 0% ≤ Δ < 5% | 0.75 | ||
| Δ < 0% | 1.00 | ||
| State | Percent of basin area under natural vegetation (Av) | Av ≤ 5% | 0.00 |
| 5% <Av ≤ 10% | 0.25 | ||
| 10% <Av ≤ 25% | 0.50 | ||
| 25% <Av ≤ 40% | 0.75 | ||
| Av > 40% | 1.00 | ||
| Response | Evolution in protected natural areas (PNA) in the basin, in the period studied | Δ ≤ −10% | 0.00 |
| −10% < Δ ≤ 0% | 0.25 | ||
| 0% < Δ ≤ 10% | 0.50 | ||
| 10% < Δ ≤ 20% | 0.75 | ||
| Δ > 20% | 1.00 |
3.3. Life
| Stages | Parameters | Level | Score |
|---|---|---|---|
| Pressure | Variation in the aquifer per capita HDI-Income in the period studied, relative to the previous period | Δ ≤ −20% | 0.00 |
| −20% < Δ ≤ −10% | 0.25 | ||
| −10% < Δ ≤ 0% | 0.50 | ||
| 0% < Δ ≤ 10% | 0.75 | ||
| Δ > 10% | 1.00 | ||
| State | Aquifer HDI (weighed by county population) | HDI ≤ 0.5 | 0.00 |
| 0.5 < HDI ≤ 0.6 | 0.25 | ||
| 0.6 < HDI ≤ 0.75 | 0.50 | ||
| 0.75 < HDI ≤ 0.9 | 0.75 | ||
| HDI > 0.9 | 1.00 | ||
| Response | Evolution in the aquifer HDI, in the period studied | Δ ≤ −10% | 0.00 |
| −10% < Δ ≤ 0% | 0.25 | ||
| 0% < Δ ≤ 10% | 0.50 | ||
| 10% < Δ ≤ 20% | 0.75 | ||
| Δ > 20% | 1.00 |
3.4. Policy
| Stages | Parameters | Level | Score |
|---|---|---|---|
| Pressure | Variation in the aquifer HDI-Education in the period studied, relative to the previous period | Δ ≤ −20% | 0.00 |
| −20% < Δ ≤ −10% | 0.25 | ||
| −10% < Δ ≤ 0% | 0.50 | ||
| 0% < Δ ≤ 10% | 0.75 | ||
| Δ > 10% | 1.00 | ||
| State | Aquifer institutional capacity in IWRM (legal and organizational) | Very poor | 0.00 |
| Poor | 0.25 | ||
| Medium | 0.50 | ||
| Good | 0.75 | ||
| Excellent | 1.00 | ||
| Response | Evolution in the aquifer’s WRM expenditures in the aquifer, in the period studied | Δ ≤ −10% | 0.00 |
| −10% < Δ ≤ 0% | 0.25 | ||
| 0% < Δ ≤ 10% | 0.50 | ||
| 10% < Δ ≤ 20% | 0.75 | ||
| Δ > 20% | 1.00 |
4. Results and Discussion
4.1. Hydrogeology Indicator
4.1.1. Quantity
| Layer | (m asl) | (m asl) | (m asl) | (m asl) | Pressure Score | ||
|---|---|---|---|---|---|---|---|
| Quaternary | 15.93 | 15.11 | 4.79 | 17.64 | 32.41 | 0.75 | |
| Pliocene | −20.58 | −24.91 | −60.88 | −14.73 | 42.53 | 0.75 | |
| Messinian | −74.88 | −67.92 | −101.56 | −41.46 | 79.31 | 0.25 | |
| CC Aquifer | 0.58 |
| Parameters | Response Score |
|---|---|
| Averaged Population (inhabitants) | 361,745 |
| Averaged Non-Conventional Water Resources (hm3/yr) | 158.74 |
| Non-Conventional Water Resources Availability per capita (m3/inhab/yr) | 439 |
| Conventional Water Resources Availability per capita (m3/inhab/yr) | 1134 |
| Non-Conventional Water Resources/Conventional Water Resources Availability (%) | 38.69 |
| Response Score | 1 |
4.1.2. Quality
| Parameters | Value | ∆ (%) | Pressure Score | State Score |
|---|---|---|---|---|
| Average nitrate concentration (mg/L) (1980–2010) | 63.4 | 137.9 | 0.00 | |
| Average nitrate concentration (mg/L) (2006–2010) | 150.8 | |||
| Number of sampling points below 50 mg/L | 5 | 22.7 | 0.25 | |
| Total sampling points | 22 |
4.2. Environment Indicator
| Parameters | Value | ∆ (%) | EPI | Pressure Score | State Score | Response Score | |
|---|---|---|---|---|---|---|---|
| Total Area (km2) | 1602 | ||||||
| Agricultural Area (km2) | 2006 | 1101 | 5.90 | 6.62 | 0.50 | ||
| 2010 | 1166 | ||||||
| Population | 2006 | 348893 | 7.33 | ||||
| 2010 | 374466 | ||||||
| Av (%) | 2006 | 18.13 | 17.08 | 0.50 | |||
| 2010 | 16.03 | ||||||
| PNA (km2) | 2006 | 105.99 | 0 | 0.25 | |||
| 2010 | 105.99 | ||||||
4.3. Life Indicator
| Province | Population | HDI-Income | Weighted HDI-Income | Pressure Score | ||||
|---|---|---|---|---|---|---|---|---|
| 2006 | 2010 | 2006 | 2010 | 2006 | 2010 | ∆ (%) | ||
| Murcia | 329,315 | 351,911 | 0.789 | 0.779 | 0.789 | 0.779 | −1.27 | 0.50 |
| Alicante | 19,578 | 22,555 | 0.794 | 0.782 | ||||
| Province | HDI | Weighted HDI | State Score | Response Score | |||
|---|---|---|---|---|---|---|---|
| 2006 | 2010 | 2006 | 2010 | ∆ (%) | |||
| Murcia | 0.838 | 0.845 | 0.838 | 0.845 | 0.88 | 0.75 | 0.50 |
| Alicante | 0.839 | 0.853 | |||||
4.4. Policy Indicator
| Province | HDI-Education | Weighted HDI-Education | Pressure Score | |||
|---|---|---|---|---|---|---|
| 2006 | 2010 | 2006 | 2010 | ∆ (%) | ||
| Murcia | 0.782 | 0.797 | 0.781 | 0.798 | 2.06 | 0.75 |
| Alicante | 0.772 | 0.806 | ||||
| Population | WRM Expenditures (miles €) | Response Score | |||
|---|---|---|---|---|---|
| 2006 | 2010 | 2006 | 2010 | ∆ (%) | |
| 348893 | 374466 | 8366 | 9586 | 14.58 | 0.75 |
4.5. Overall Aquifer Sustainability
| Indicators | Pressure | State | Response | Result | |
|---|---|---|---|---|---|
| Hydrogeology | Quantity | 0.58 | 0.25 | 1 | 0.43 |
| Quality | 0.00 | 0.25 | 0.50 | ||
| Overall | 0.29 | 0.25 | 0.75 | ||
| Environment | 0.50 | 0.50 | 0.25 | 0.42 | |
| Life | 0.50 | 0.75 | 0.50 | 0.58 | |
| Policy | 0.75 | 0.75 | 0.75 | 0.75 | |
| Result | 0.51 | 0.56 | 0.56 | 0.55 | |
4.6. Uncertainty Analysis
| Statistics | Hydrogeology (H) | Environment (E) | Life (L) | Policy (P) | ASI |
|---|---|---|---|---|---|
| Average | 0.5276 | 0.4156 | 0.5832 | 0.7512 | 0.5694 |
| Standard Deviation | 0.0197 | 0.1217 | 0.1161 | 0.0948 | 0.0488 |
| Minimum | 0.5000 | 0.1667 | 0.3334 | 0.5834 | 0.4167 |
| Maximum | 0.5416 | 0.6667 | 0.8334 | 0.9167 | 0.7083 |
| Significance Level | 0.05 | 0.05 | 0.05 | 0.05 | 0.05 |
| Width Confidence Intervals | 0.0011 | 0.0065 | 0.0062 | 0.0051 | 0.0026 |
5. Conclusions
Acknowledgments
Author Contributions
Conflicts of Interest
References
- United Nations World Commission on Environment and Development. Our Common Future: World Commission on Environment and Development; Oxford University Press: Oxford, UK, 1987. [Google Scholar]
- Mays, L.W. Groundwater Resources Sustainability: Past, Present, and Future. Water Resour. Manag. 2013, 27, 4409–4424. [Google Scholar] [CrossRef]
- Juwana, I.; Muttil, N.; Perera, B. Indicator-based water sustainability evaluation—A review. Sci. Total Environ. 2012, 438, 242–256. [Google Scholar] [CrossRef] [PubMed]
- Alley, M.; Leake, S.A. The journey from safe yield to sustainability. Ground Water 2004, 42, 12–16. [Google Scholar] [CrossRef] [PubMed]
- Canadian Water Sustainability Index. Project Report 2007. Available online: http://publications.gc.ca/Collection/PH4-38-2007E.pdf (accessed on 12 February 2015).
- Chaves, H.M.L.; Alipaz, S. An integrated indicator based on basin hydrology, environment, life and policy: The watershed sustainability index. Water Resour. Manag. 2007, 21, 883–895. [Google Scholar] [CrossRef]
- Juwana, I.; Perera, B.; Muttil, N. A water sustainability index for West Java. Part 1: Developing the conceptual framework. Water Sci. Technol. 2010, 62, 1629–1640. [Google Scholar] [CrossRef] [PubMed]
- De Carvalho, S.C.P.; Carden, K.J.; Armitage, N.P. Application of a sustainability index for integrated urban water management in Southern African cities: Case study comparison—Maputo and Hermanus. Water SA 2009, 35, 44–151. [Google Scholar]
- Pandey, V.P.; Shrestha, S.; Chapagain, S.K.; Kazama, F. A framework for measuring groundwater sustainability. Environ. Sci. Policy 2011, 14, 396–407. [Google Scholar] [CrossRef]
- Russo, T.; Alfredo, K.; Fisher, J. Sustainable Water Management in Urban, Agricultural and Natural Systems. Water 2014, 6, 3934–3956. [Google Scholar] [CrossRef]
- Correia, F.N. Water Resources in the Mediterranean Region. Water Int. 1999, 24, 22–30. [Google Scholar] [CrossRef]
- Rapport, D.J.; Friend, A.M. Towards a Comprehensive Framework for Environmental Statistics: A Stress-Response Approach; Minister of Supply and Services: Ottawa, ON, Canada, 1979; pp. 11–510.
- Wang, T.; Xu, S. Dynamic successive assessment method of water environment carrying capacity and its application. Ecol. Indic. 2015, 52, 134–146. [Google Scholar] [CrossRef]
- Cen, X.; Wu, C.; Xing, X.; Fang, M.; Garang, Z.; Wu, Y. Coupling Intensive Land Use and Landscape Ecological Security for Urban Sustainability: An Integrated Socioeconomic Data and Spatial Metrics Analysis in Hangzhou City. Sustainability 2015, 7, 1459–1482. [Google Scholar] [CrossRef]
- Grecchi, R.C.; Gwyn, Q.H.J.; Bénié, G.B.; Formaggio, A.R.; Fahl, F.C. Land use and land cover changes in the Brazilian Cerrado: A multidisciplinary approach to assess the impacts of agricultural expansion. Appl. Geogr. 2014, 55, 300–312. [Google Scholar] [CrossRef]
- Girman, J.; van der Gun, J.; Haie, N.; Hirata, J.; Lipponen, A.; Lopez-Gunn, E.; Neupane, B.; Shah, T.; Vrba, J.; Wallin, B. Groundwater Resources Sustainability Indicators; Vrba, J., Lipponen, A., Eds.; United Nations Educational, Scientific and Cultural Organization: Paris, France, 2007. [Google Scholar]
- Baudron, P.; Alonso-Sarriá, F.; García-Aróstegui, J.L.; Cánovas-García, F.; Martínez-Vicente, D.; Moreno-Brotóns, J. Identifying the origin of groundwater samples in a multi-layer aquifer system with Random Forest classification. J. Hydrol. 2013, 499, 303–315. [Google Scholar] [CrossRef]
- Soto-García, M.; Martínez-Álvarez, V.; García-Bastida, P.; Alcón, F.; Martín-Górriz, B. Effect of water scarcity and modernisation on the performance of irrigation districts in south-eastern Spain. Agric. Water Manag. 2013, 124, 11–19. [Google Scholar] [CrossRef]
- Jiménez-Martínez, J.; Candela, L.; Molinero, J.; Tamoh, K. Groundwater recharge in irrigated semi-arid areas: Quantitative hydrological modelling and sensitivity analysis. Hydrogeol. J. 2010, 18, 1811–1824. [Google Scholar] [CrossRef]
- Rey, J.; Martínez, J.; Barberá, J.J.; García-Aróstegui, J.L.; García-Pintado, J.; Martínez-Vicente, D. Geophysical characterization of the complex dynamics of groundwater and seawater Exchange in a highly stressed aquifer system linked to a coastal lagoon (SE Spain). Environ. Earth Sci. 2013, 70, 2271–2282. [Google Scholar] [CrossRef]
- Senent-Aparicio, J.; Martínez-Vicente, D.; García-Aróstegui, J.L. Sustainable Groundwater Management. In Aquifer Overexplotaition in the Segura Basin, 1st ed.; Fundación Instituto Euromediterráneo del Agua: Murcia, Spain, 2014. [Google Scholar]
- Baudron, P.; Barbecot, F.; García-Aróstegui, J.L.; Leduc, C.; Travi, I.; Martínez-Vicente, D. Impacts of human activities on recharge in a multilayered semiarid aquifer (Campo de Cartagena, SE Spain). Hydrol. Process. 2014, 28, 2223–2236. [Google Scholar] [CrossRef]
- OECD: OECD Environmental Indicators. Development, Measurement and Use. 2003. Available online: http://www.oecd.org/environment/indicators-modelling-outlooks/24993546.pdf (accessed on 27 February 2015).
- Heathcote, I.W. Integrated Watershed Management: Principles and Practice; Wiley: New York, NY, USA, 1998. [Google Scholar]
- United Nations Development Programme (UNDP). Human Development Report 1990; Oxford University Press: New York, NY, USA, 1990. [Google Scholar]
- Lambán, L.J.; Martos, S.; Rodríguez-Rodríguez, M.; Rubio, J.C. Application of groundwater sustainability indicators to the carbonate aquifer of the Sierra de Becerrero (Southern Spain). Environ. Earth Sci. 2011, 64, 1835–1848. [Google Scholar] [CrossRef]
- García-Aróstegui, J.L.; Senent-Alonso, M.; Martínez-Vicente, D.; Aragón-Rueda, R.; Rodríguez-Estrella, T.; Solís García-Barbón, L.; Baudron, P.; Hornero-Díaz, J. Aquiferoverexplotaition. In Aquiferoverexplotaition in the Segura Basin, 1st ed.; Fundación Instituto Euromediterráneo del Agua: Murcia, Spain, 2014. [Google Scholar]
- Mayzelle, M.M.; Viers, J.H.; Medellín-Azuara, J.; Harter, T. Economic Feasibility of Irrigated Land Use Buffers to Reduce Groundwater Nitrate in Rural Drinking Water Sources. Water 2015, 7, 12–37. [Google Scholar] [CrossRef]
- European Commission. Directive 2006/118/EC of the European Parliament and of the Council. In On the Protection of Groundwater against Pollution and Deterioration; European Commission: Kirchberg, Luxembourg, 2006. [Google Scholar]
- Hunsaker, C.T.; Levine, D.A. Hierarchical approaches to the study of water quality in rivers. Bioscience 1995, 45, 193–203. [Google Scholar] [CrossRef]
- Instituto Nacional de Estadística (INE). Available online: http://www.ine.es/ (accessed on 5 March 2015).
- Alonso, F.; Gomariz, F.; Cánovas, F. Análisis temporal de los cambios de usos del suelo en la cuenca del Segura mediante teledetección. Implicacionessobre la degradación. Cuatern. Geomorfol. 2010, 24, 73–88. [Google Scholar]
- Fundación Europarc-España (EUROPARC). Available online: http://redeuroparc.org (accessed on 6 March 2015).
- Herrero, C.; Soler, A.; Villar, A. Desarrollo Humano en España: 1980–2011; IVIE: Valencia, Spain, 2012. [Google Scholar]
- European Commission. Directive 2000/60/EC of the European Parliament and of the Council. In Establishing a Framework for Community Action in the Field of Water Policy; European Commission: Kirchberg, Luxembourg, 2000. [Google Scholar]
- Falkenmark, M.; Lundquist, J.; Widstrand, C. Macro-scale water scarcity requires micro-scale approaches: Aspects of vulnerability in semi-arid development. Nat. Resour. Forum 1989, 13, 258–267. [Google Scholar] [CrossRef] [PubMed]
- Segura River Basin Authority. Groundwater Quality. Available online: https://www.chsegura.es/chs/cuenca/redesdecontrol/calidadenaguassubterraneas/ (accessed on 24 February 2015).
- Organisation for Economic Co-operation and Development (OECD). Handbook on Constructing Composite Indicators; OECD Publications: Paris, France, 2008. [Google Scholar]
© 2015 by the authors; licensee MDPI, Basel, Switzerland. This article is an open access article distributed under the terms and conditions of the Creative Commons Attribution license (http://creativecommons.org/licenses/by/4.0/).
Share and Cite
Senent-Aparicio, J.; Pérez-Sánchez, J.; García-Aróstegui, J.L.; Bielsa-Artero, A.; Domingo-Pinillos, J.C. Evaluating Groundwater Management Sustainability under Limited Data Availability in Semiarid Zones. Water 2015, 7, 4305-4322. https://doi.org/10.3390/w7084305
Senent-Aparicio J, Pérez-Sánchez J, García-Aróstegui JL, Bielsa-Artero A, Domingo-Pinillos JC. Evaluating Groundwater Management Sustainability under Limited Data Availability in Semiarid Zones. Water. 2015; 7(8):4305-4322. https://doi.org/10.3390/w7084305
Chicago/Turabian StyleSenent-Aparicio, Javier, Julio Pérez-Sánchez, José Luis García-Aróstegui, Alicia Bielsa-Artero, and Juan Carlos Domingo-Pinillos. 2015. "Evaluating Groundwater Management Sustainability under Limited Data Availability in Semiarid Zones" Water 7, no. 8: 4305-4322. https://doi.org/10.3390/w7084305
APA StyleSenent-Aparicio, J., Pérez-Sánchez, J., García-Aróstegui, J. L., Bielsa-Artero, A., & Domingo-Pinillos, J. C. (2015). Evaluating Groundwater Management Sustainability under Limited Data Availability in Semiarid Zones. Water, 7(8), 4305-4322. https://doi.org/10.3390/w7084305