
Tracing the Sources and Processes of Groundwater in an Alpine Glacierized Region in Southwest China: Evidence from Environmental Isotopes

Abstract
:1. Introduction
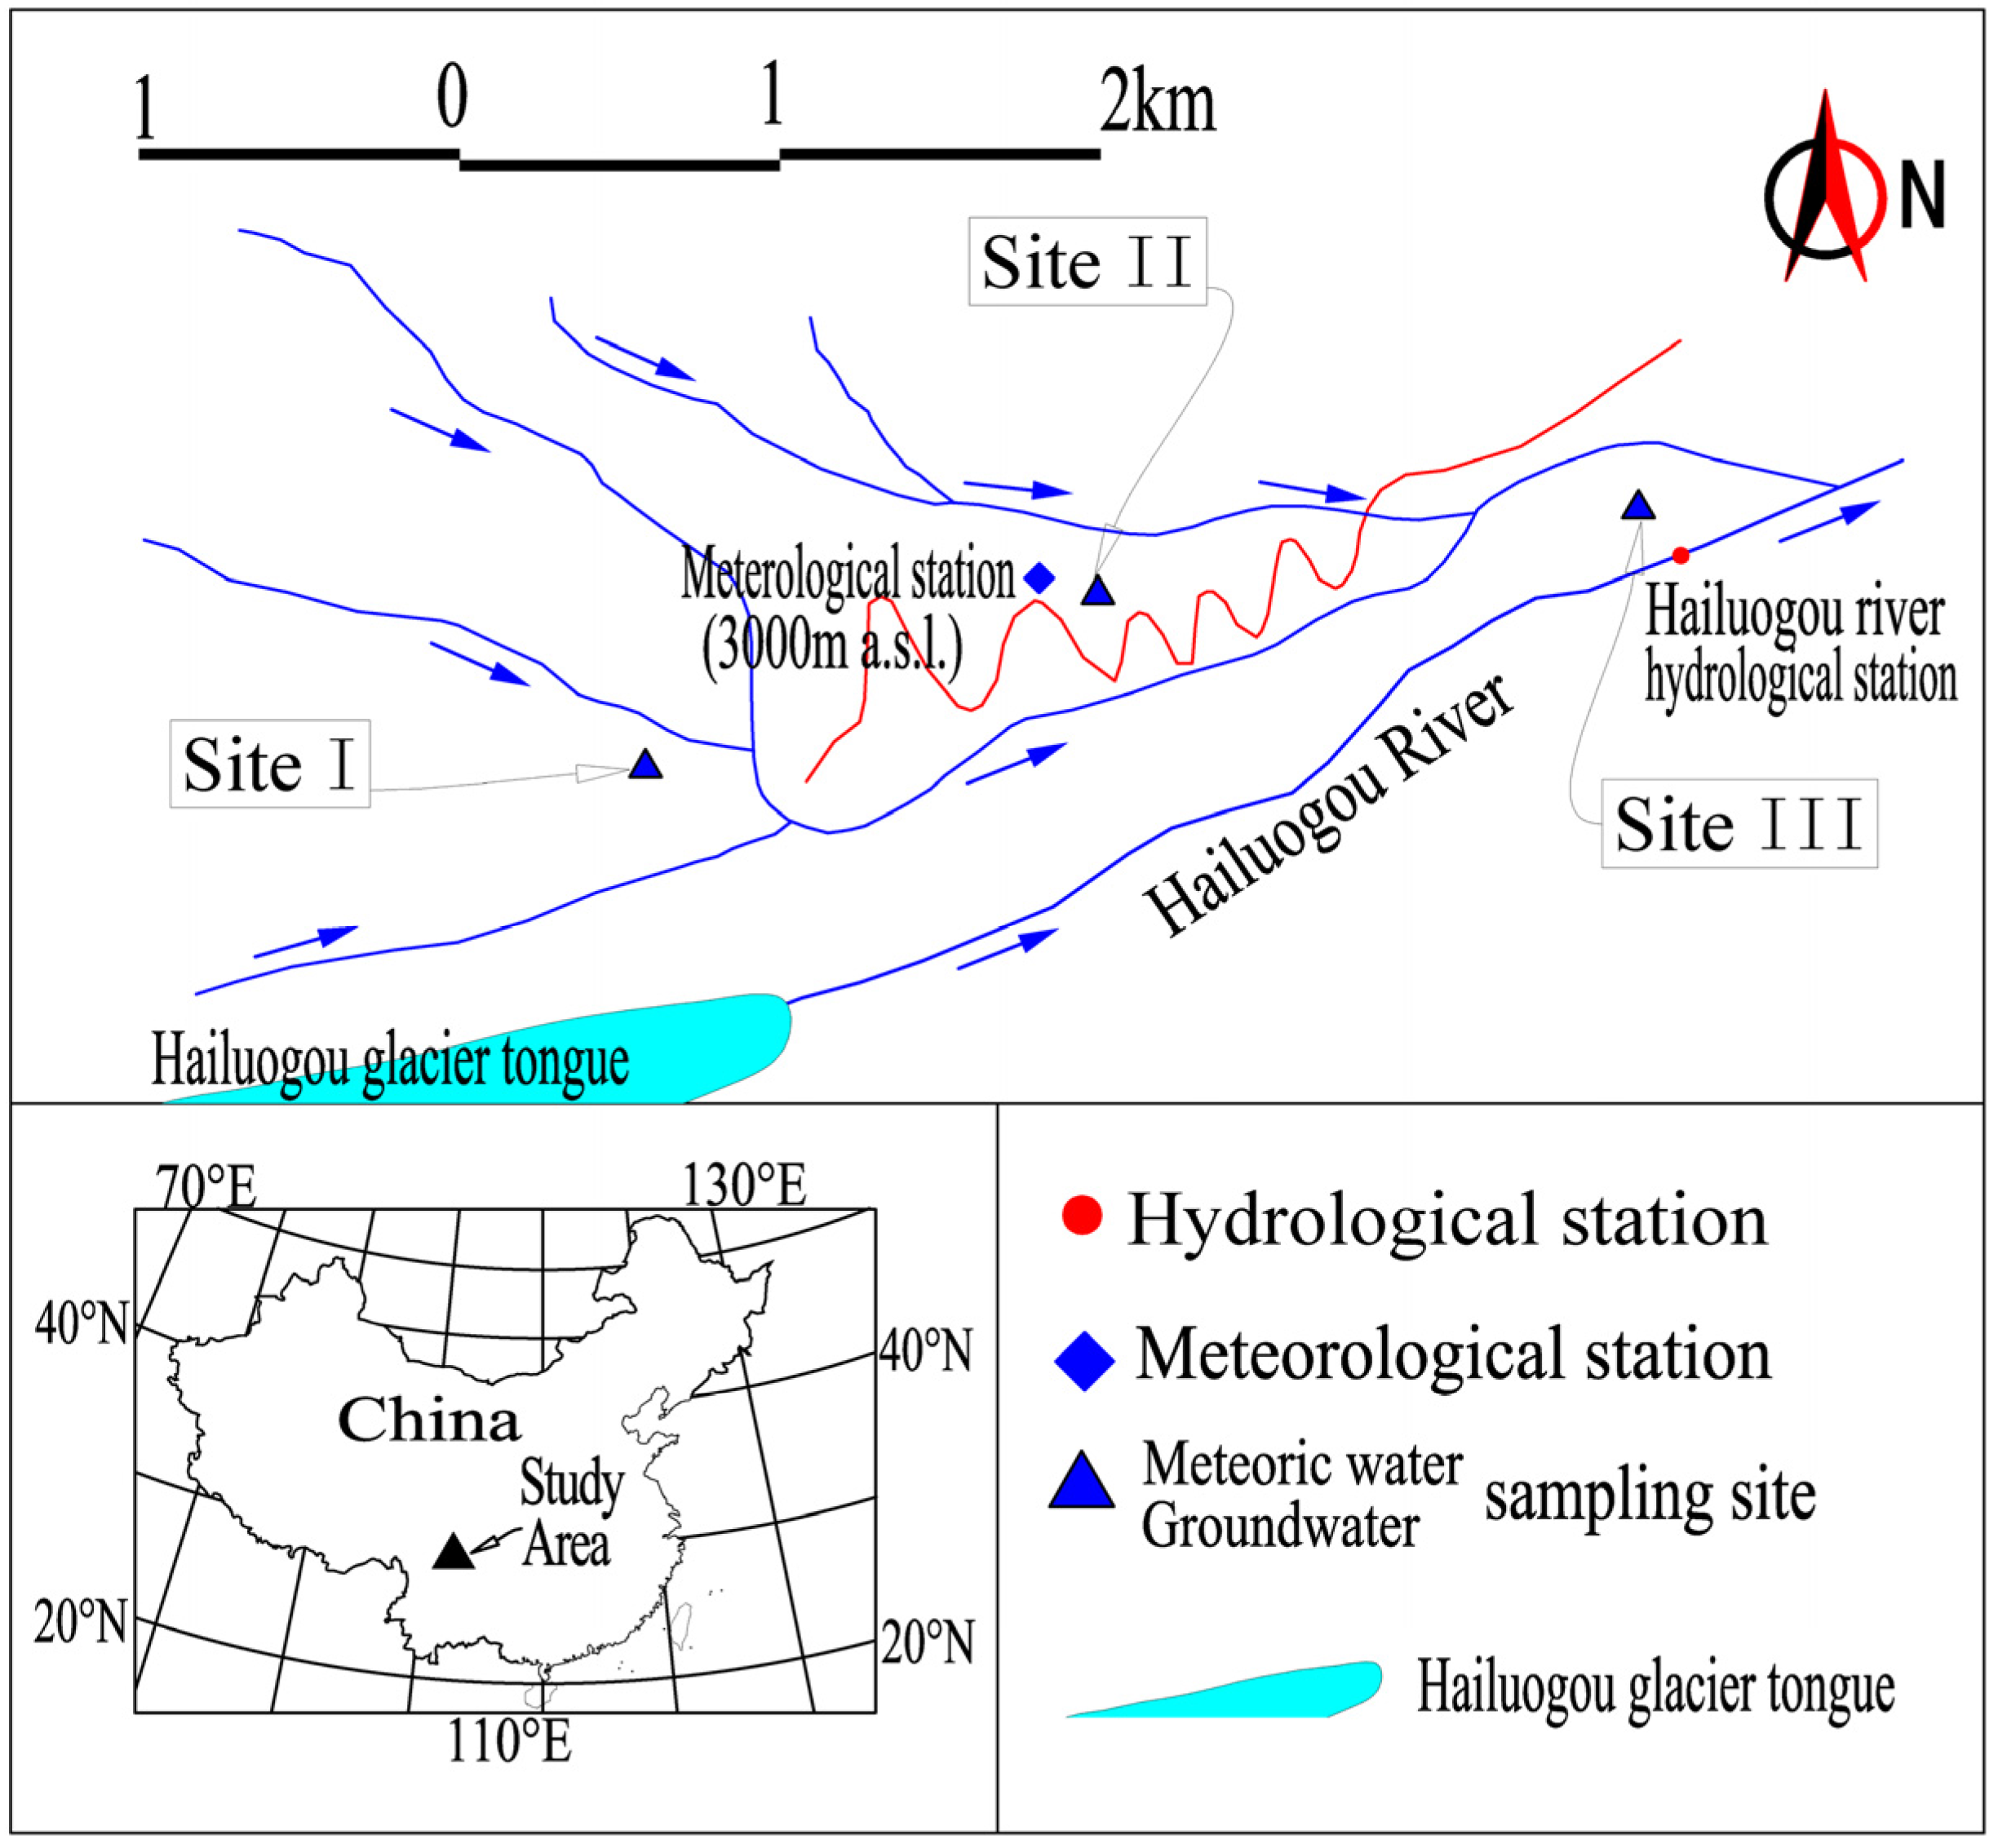
2. Study Area
3. Data and Methods
3.1. Field Measurements and Sampling
3.2. Laboratory Analysis
3.3. Data Analysis
4. Results
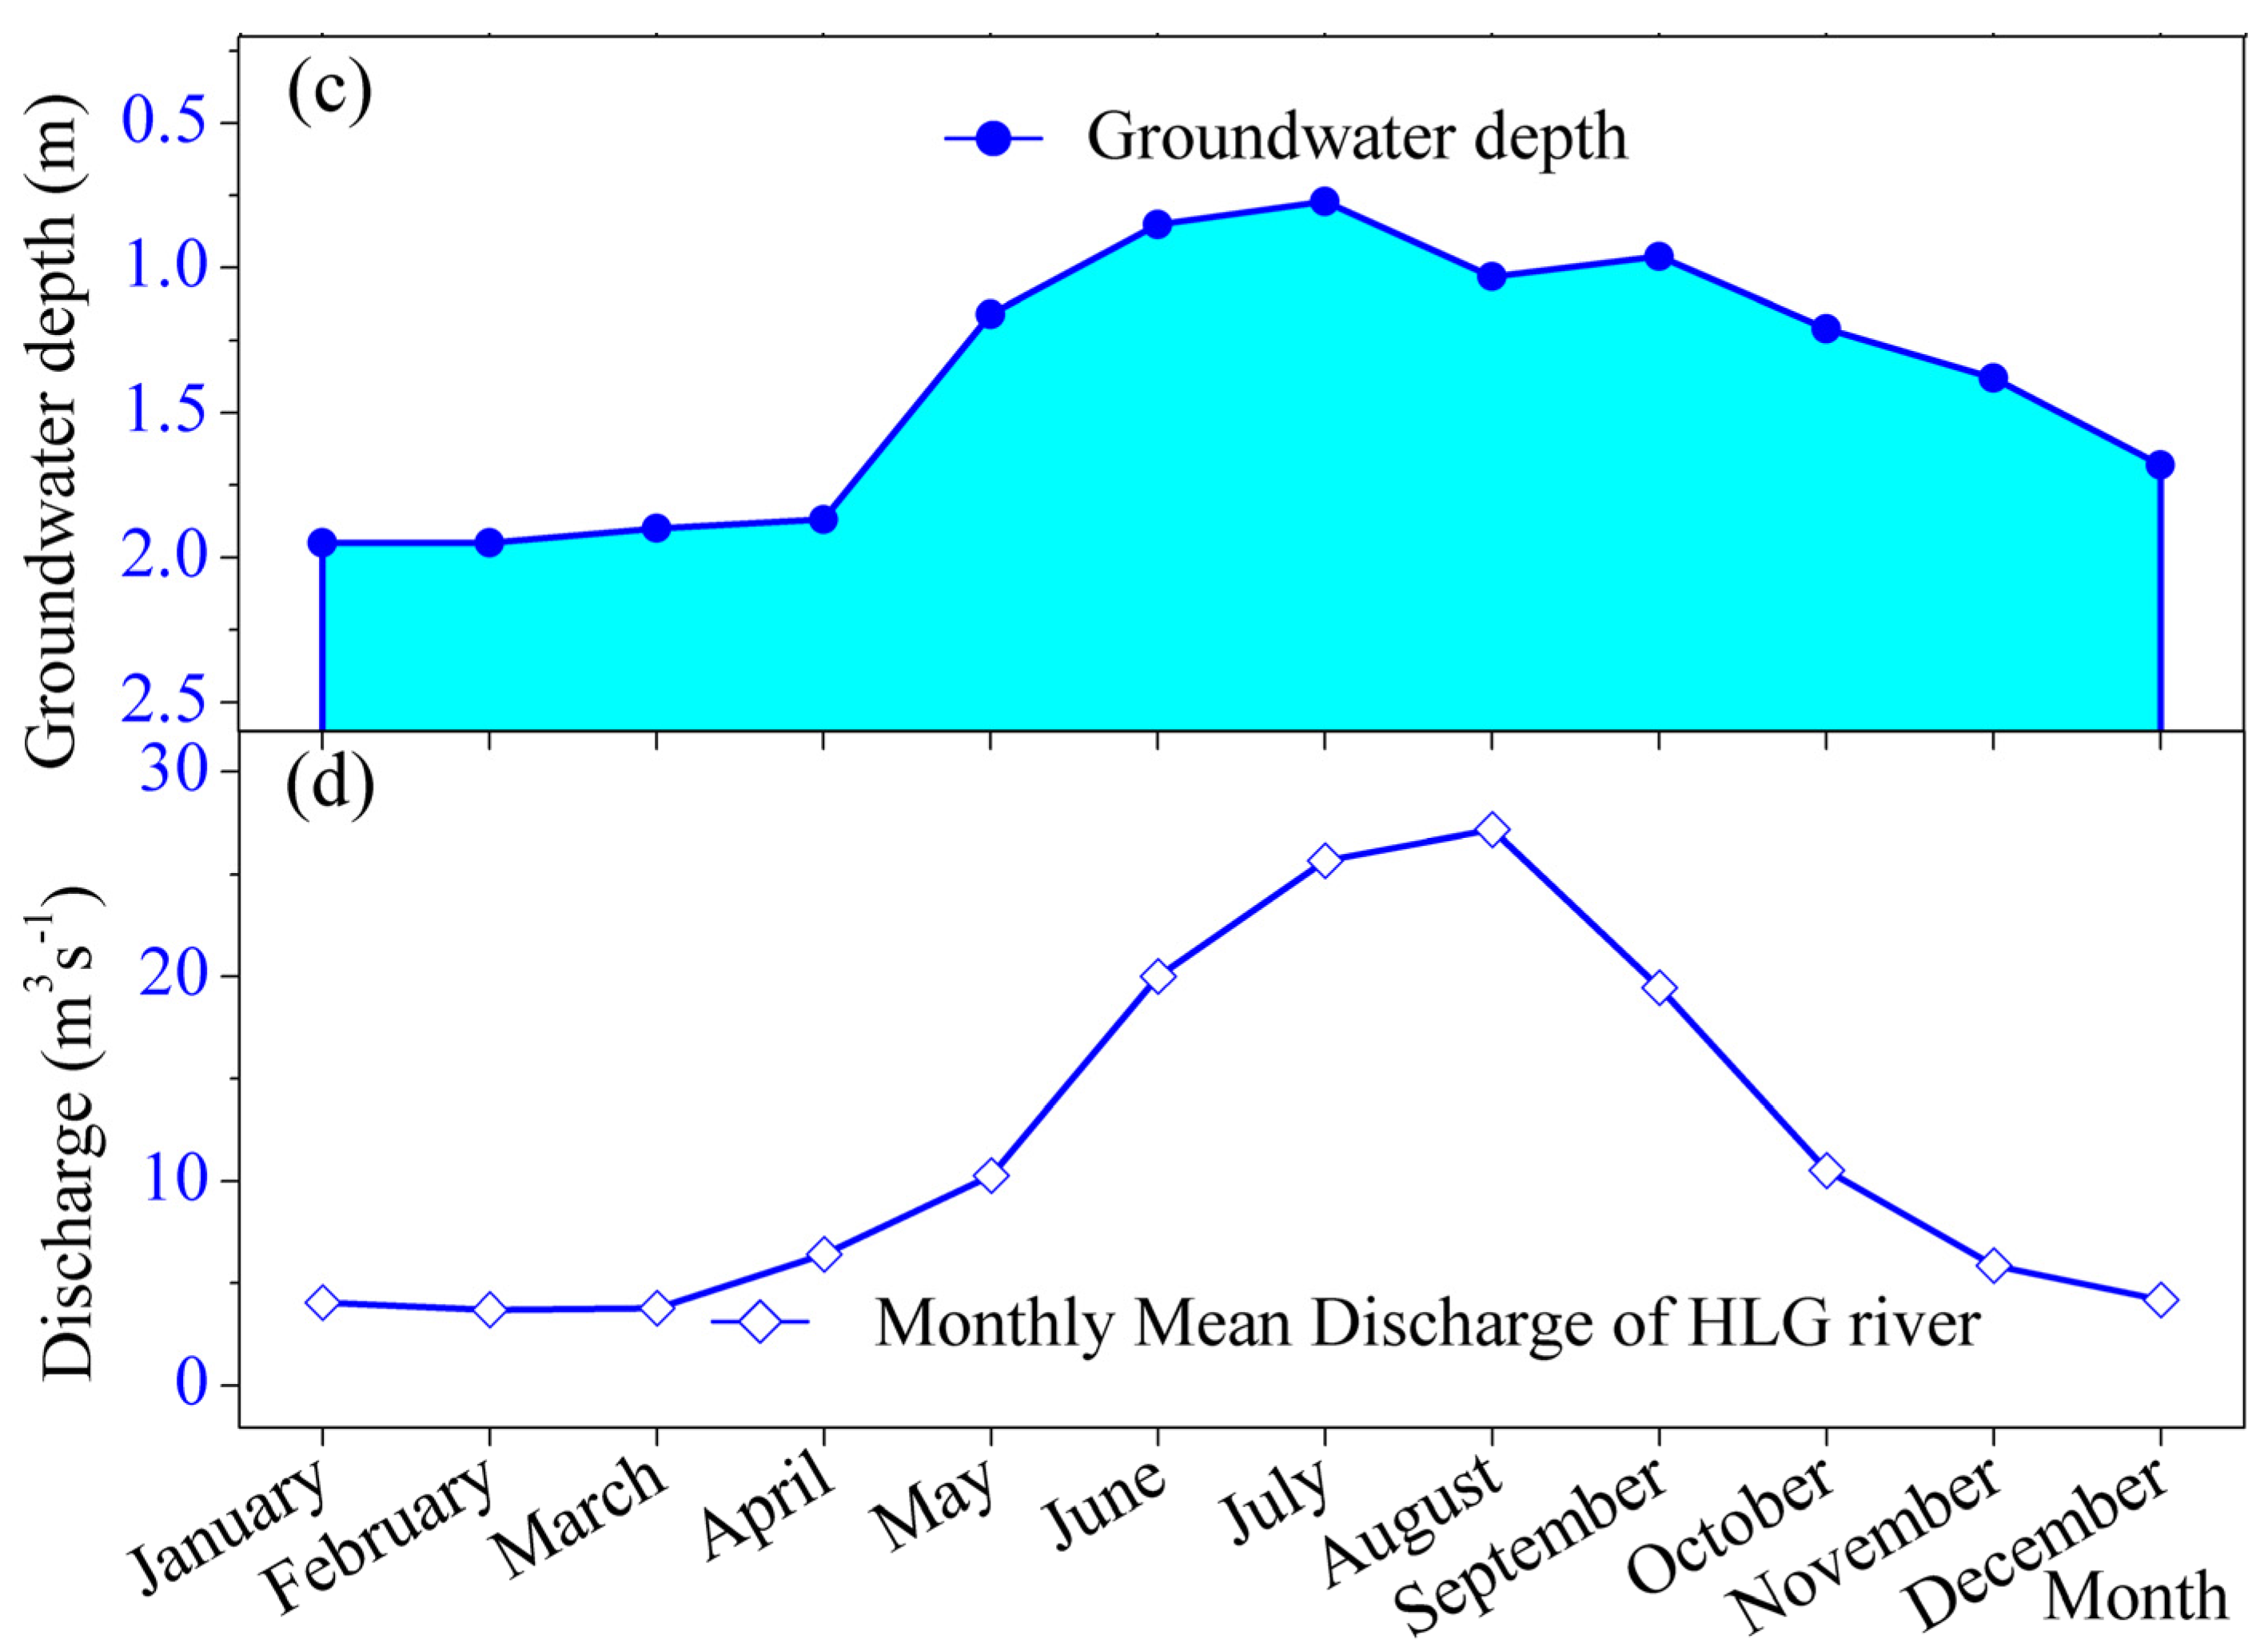
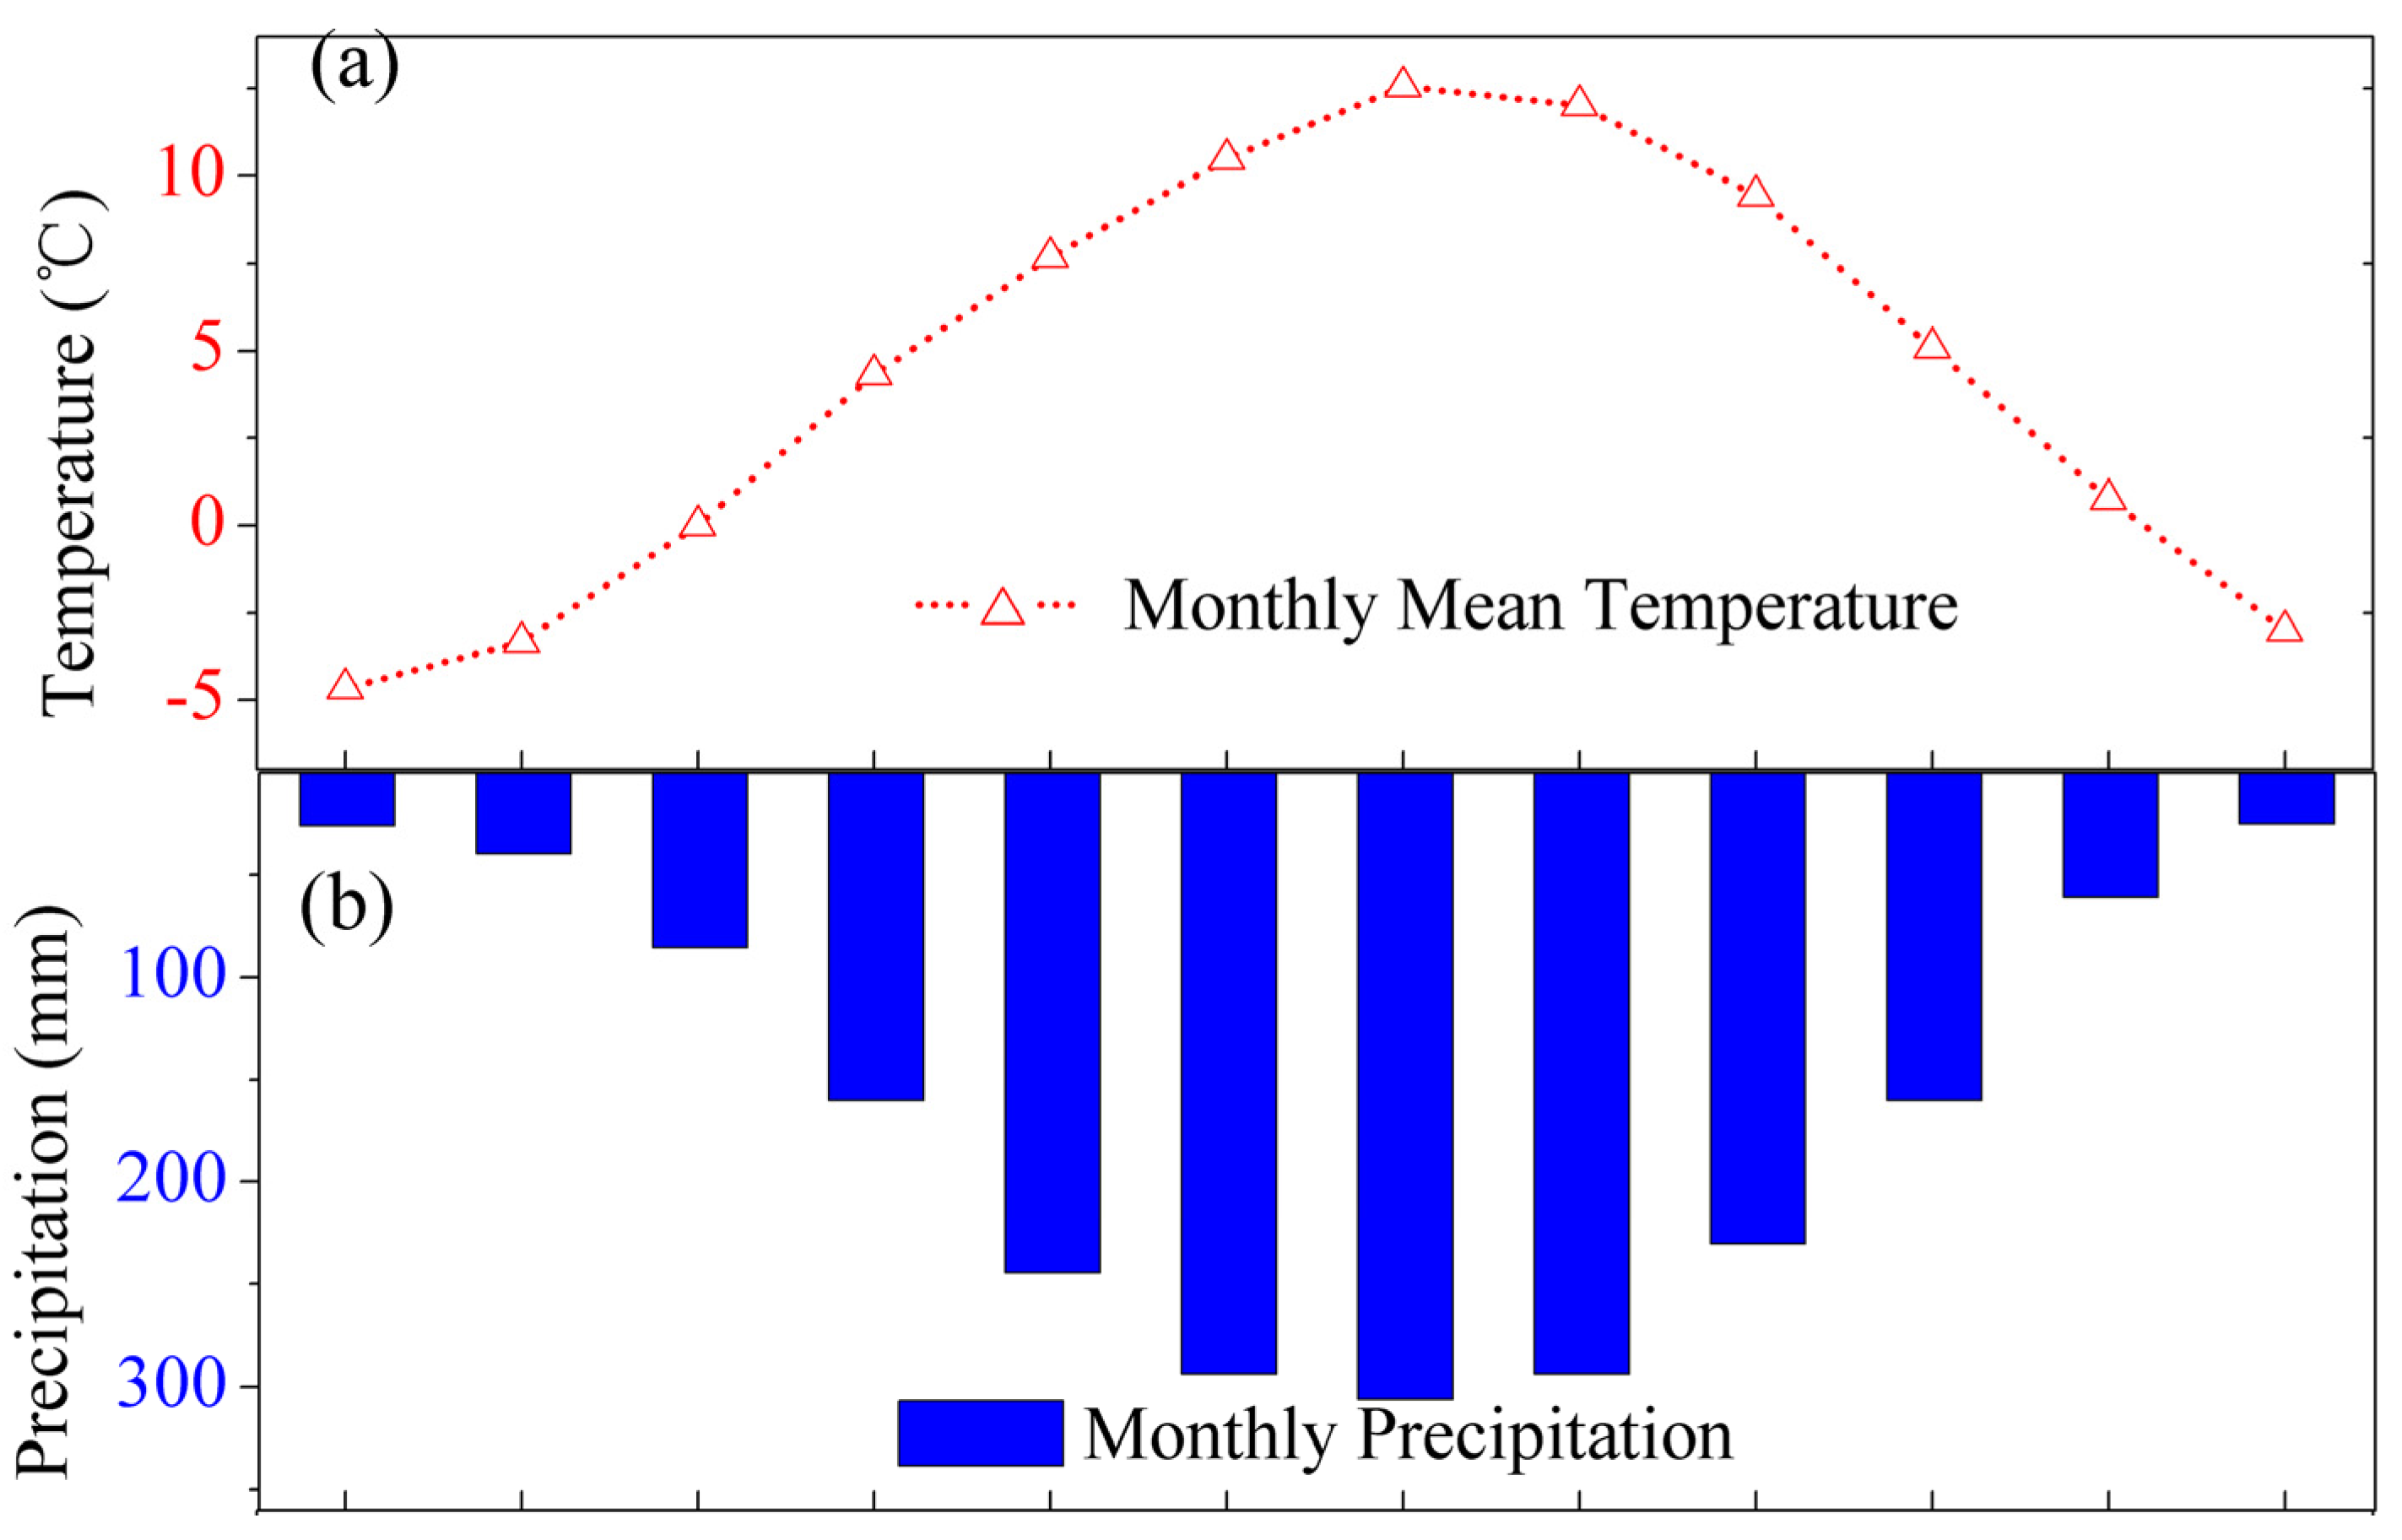
4.1. Meteorological and Hydrological Characteristics

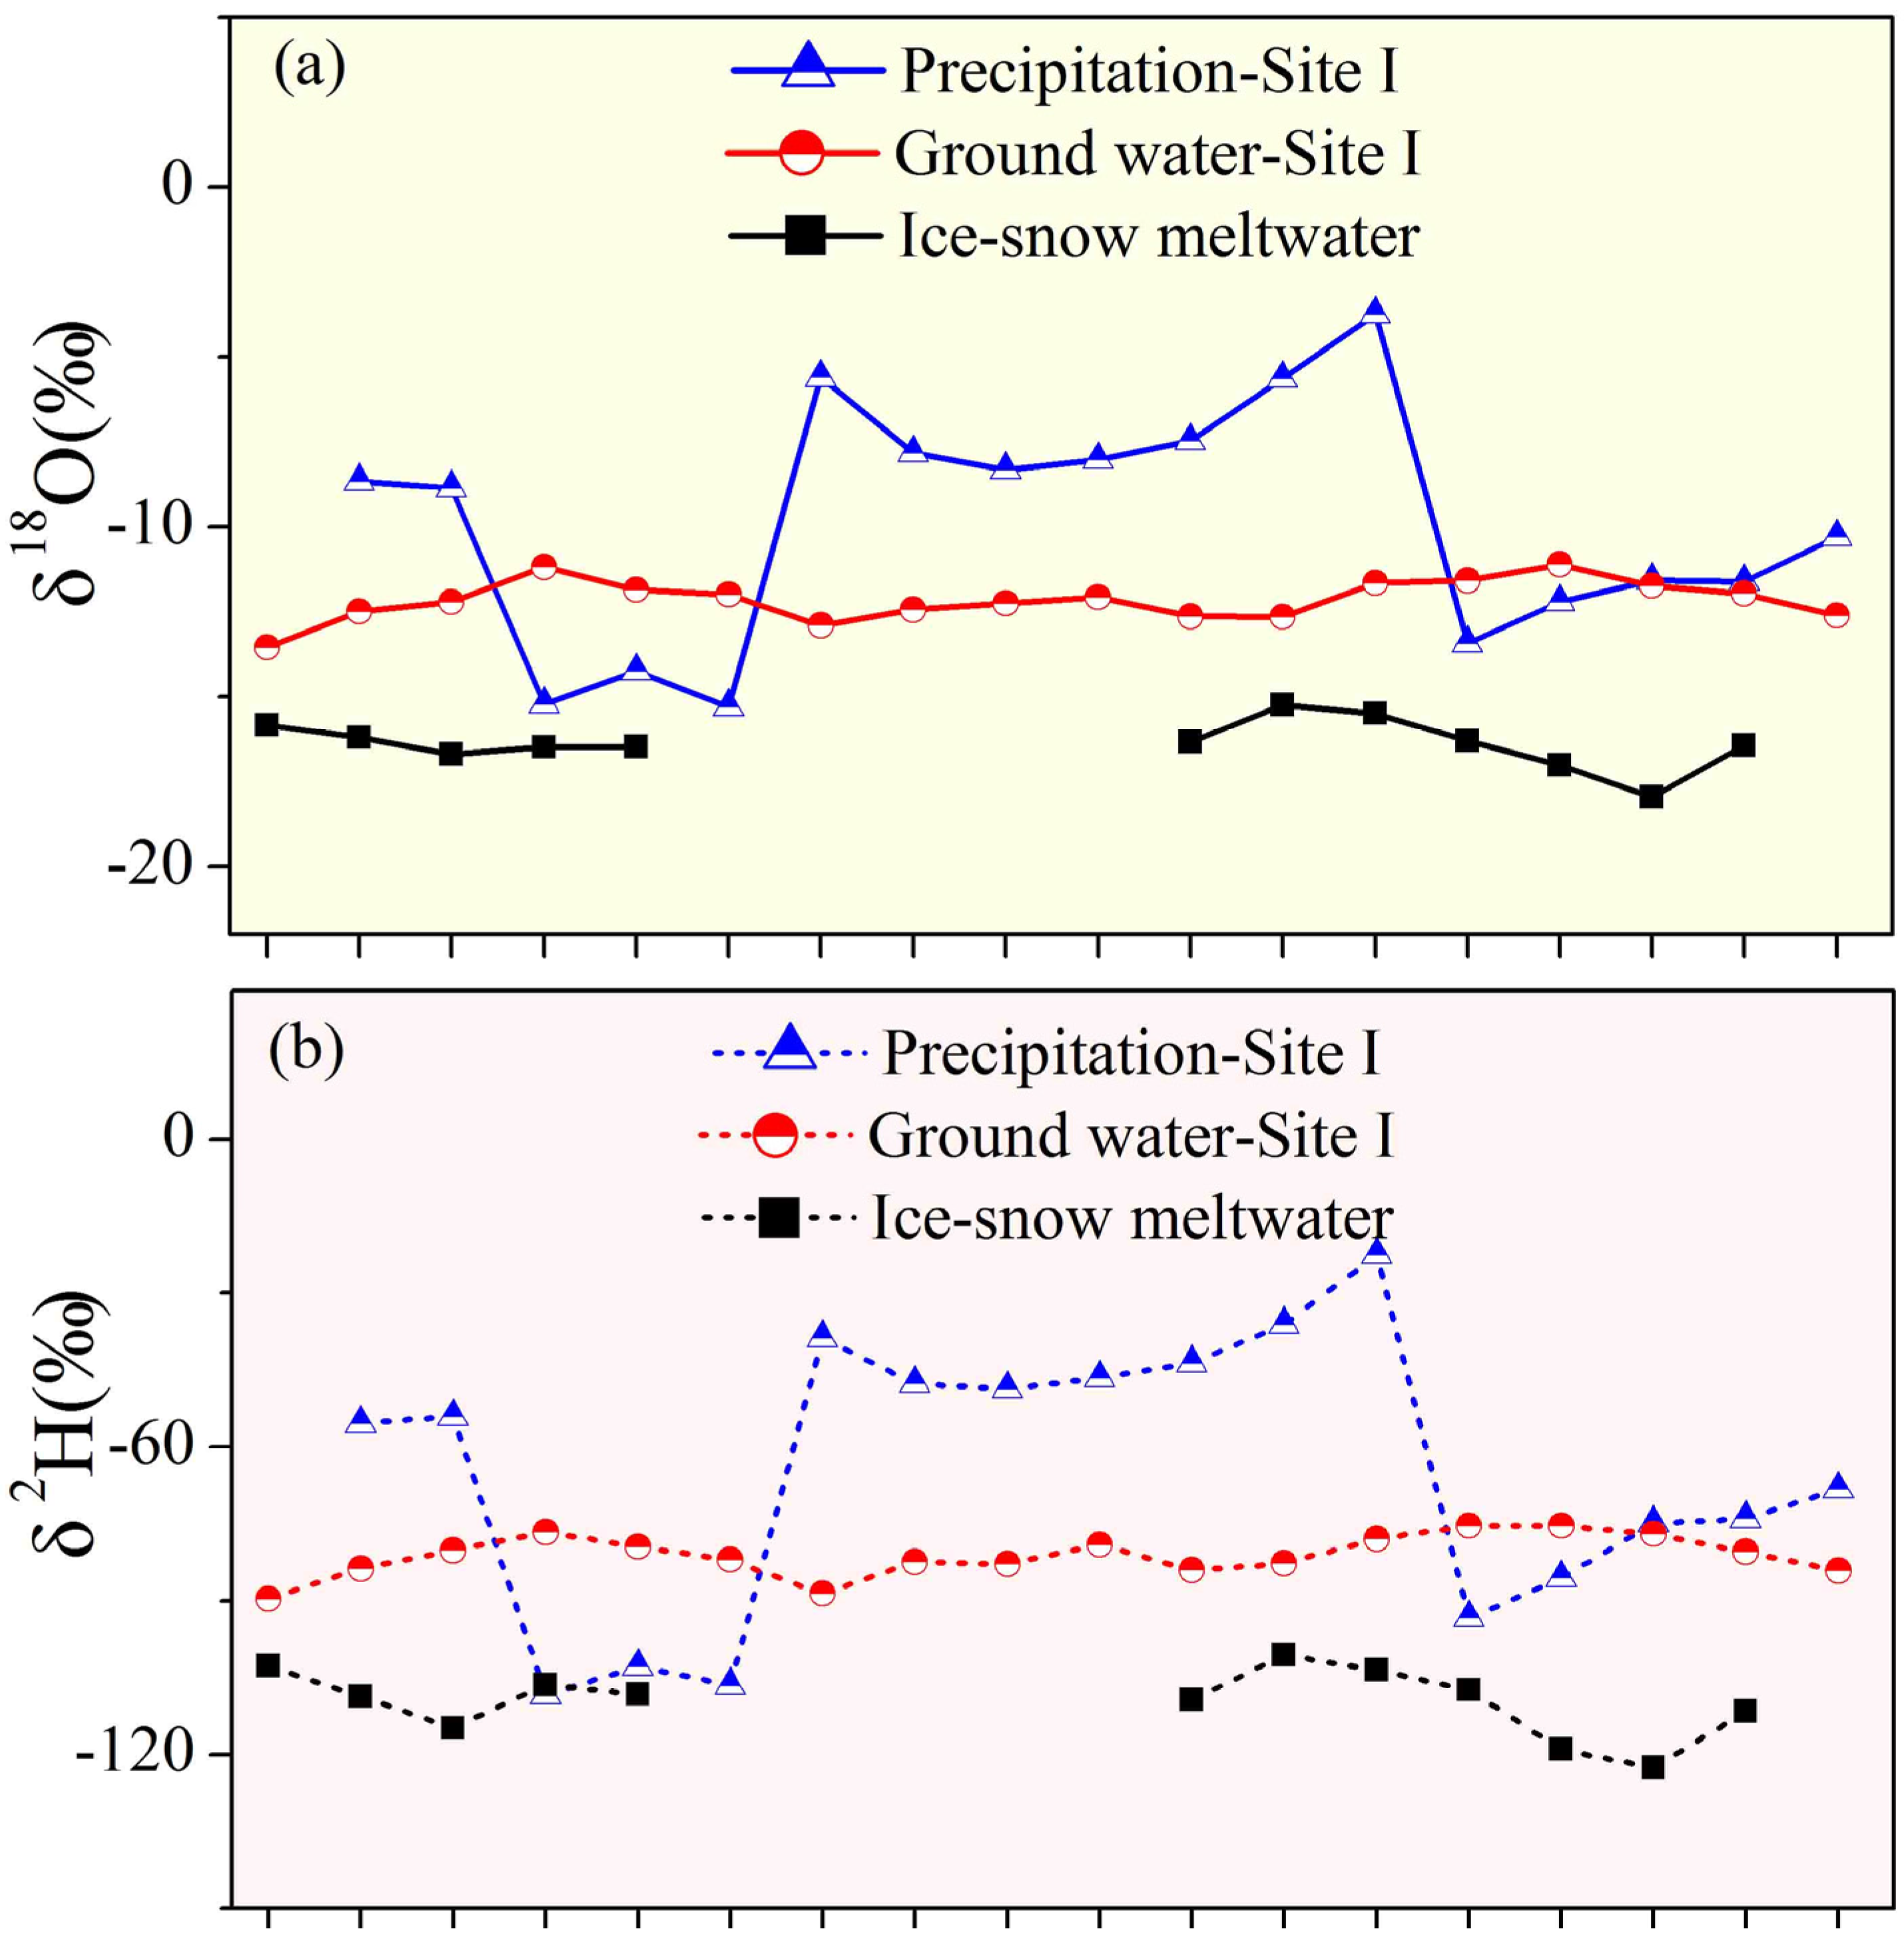
4.2. Stable Isotopic Signatures of Water Samples
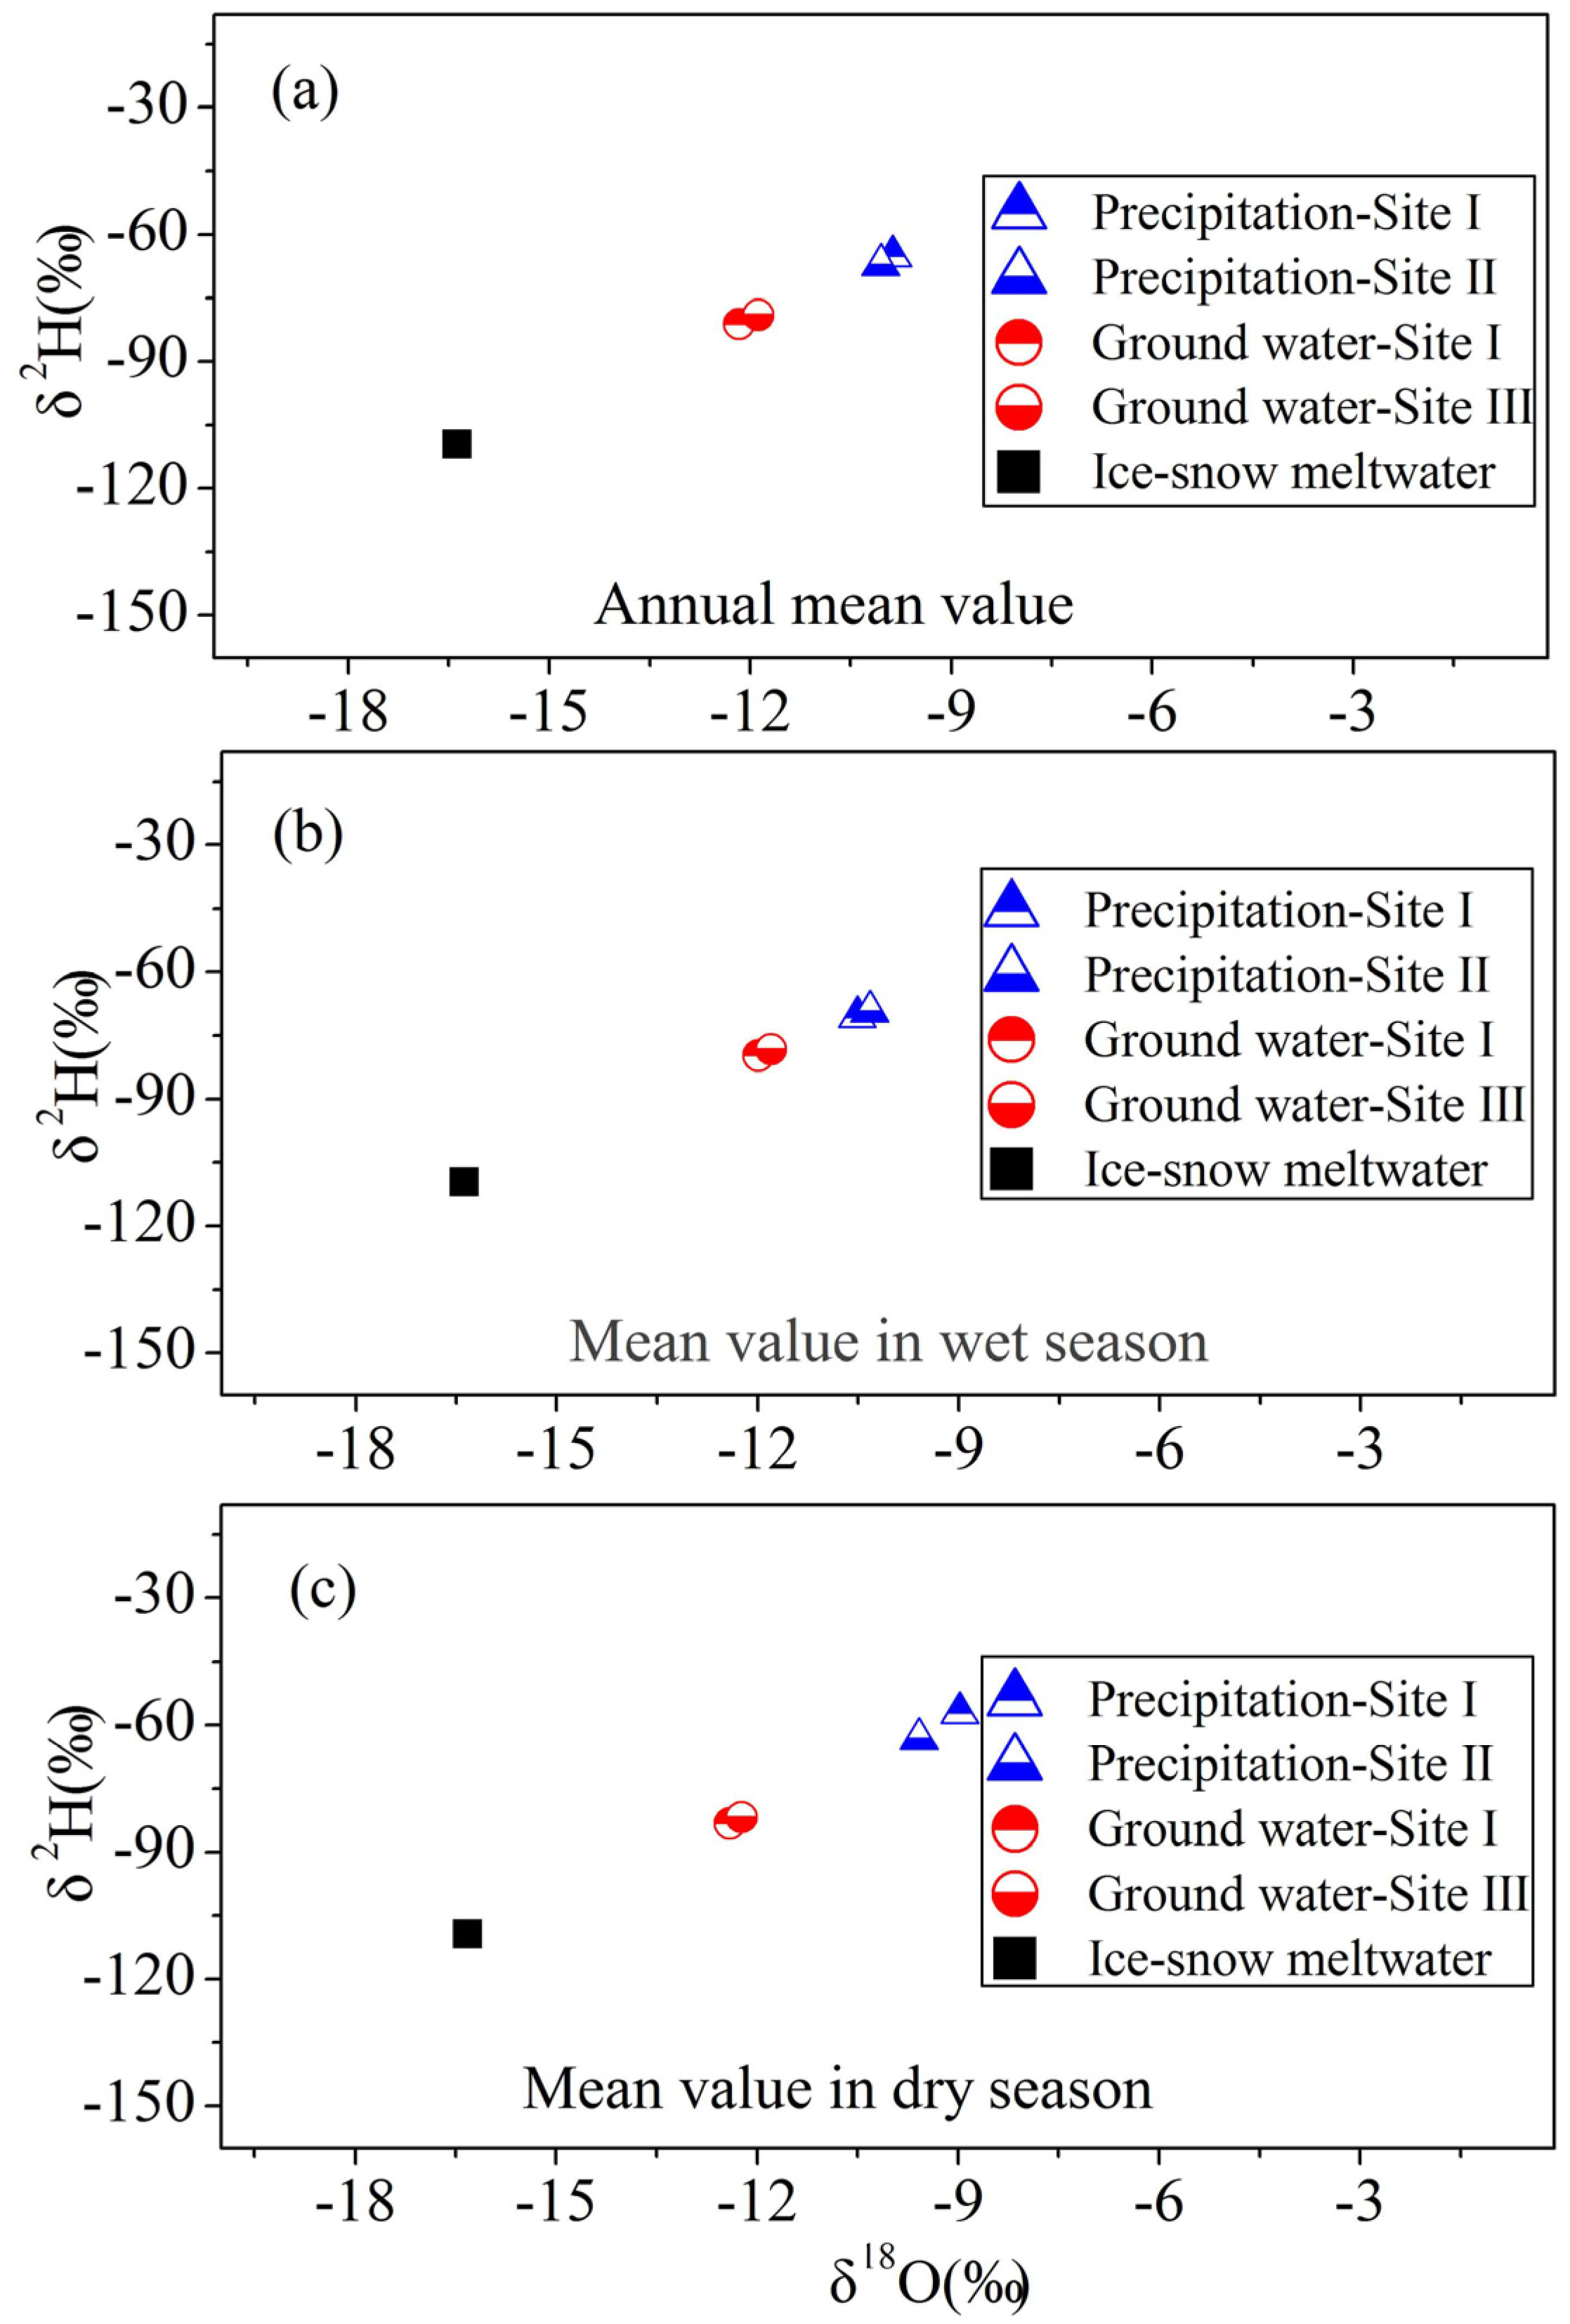
4.2.1. Isotopic Compositions of Water Samples

| Sample Type | Category | Minimum | Maximum | Annual Mean Value | Mean Value in Wet Season | Mean Value in Dry Season | |
|---|---|---|---|---|---|---|---|
| Groundwater | Site I | δ18O(‰) | −13.5 | −11.1 | −12.2 | −12.0 | −12.4 |
| δ2H (‰) | −90 | −75 | −81 | −80 | −83 | ||
| d-excess(‰) | 13 | 19 | 16 | 16 | 16 | ||
| Site III | δ18O(‰) | −12.9 | −11.0 | −11.9 | −11.8 | −12.2 | |
| δ2H (‰) | −88 | −69 | −79 | −78 | −82 | ||
| d-excess(‰) | 12 | 20 | 16 | 16 | 16 | ||
| Precipitation | Site I | δ18O(‰) | −15.3 | −3.7 | −9.9 | −10.5 | −9.0 |
| δ2H (‰) | −108 | −23 | −65 | −71 | −57 | ||
| d-excess(‰) | 6 | 19 | 14 | 13 | 15 | ||
| Site II | δ18O(‰) | −14.9 | −6.2 | −10.1 | −10.3 | −9.6 | |
| δ2H (‰) | −109 | −39 | −67 | −69 | −63 | ||
| d-excess(‰) | 7 | 19 | 13 | 13 | 13 | ||
| Ice-snow meltwater | δ18O(‰) | −18.0 | −15.2 | −16.4 | −16.4 | −16.3 | |
| δ2H (‰) | −123 | −101 | −110 | −110 | −109 | ||
| d-excess(‰) | 17 | 25 | 21 | 21 | 21 | ||

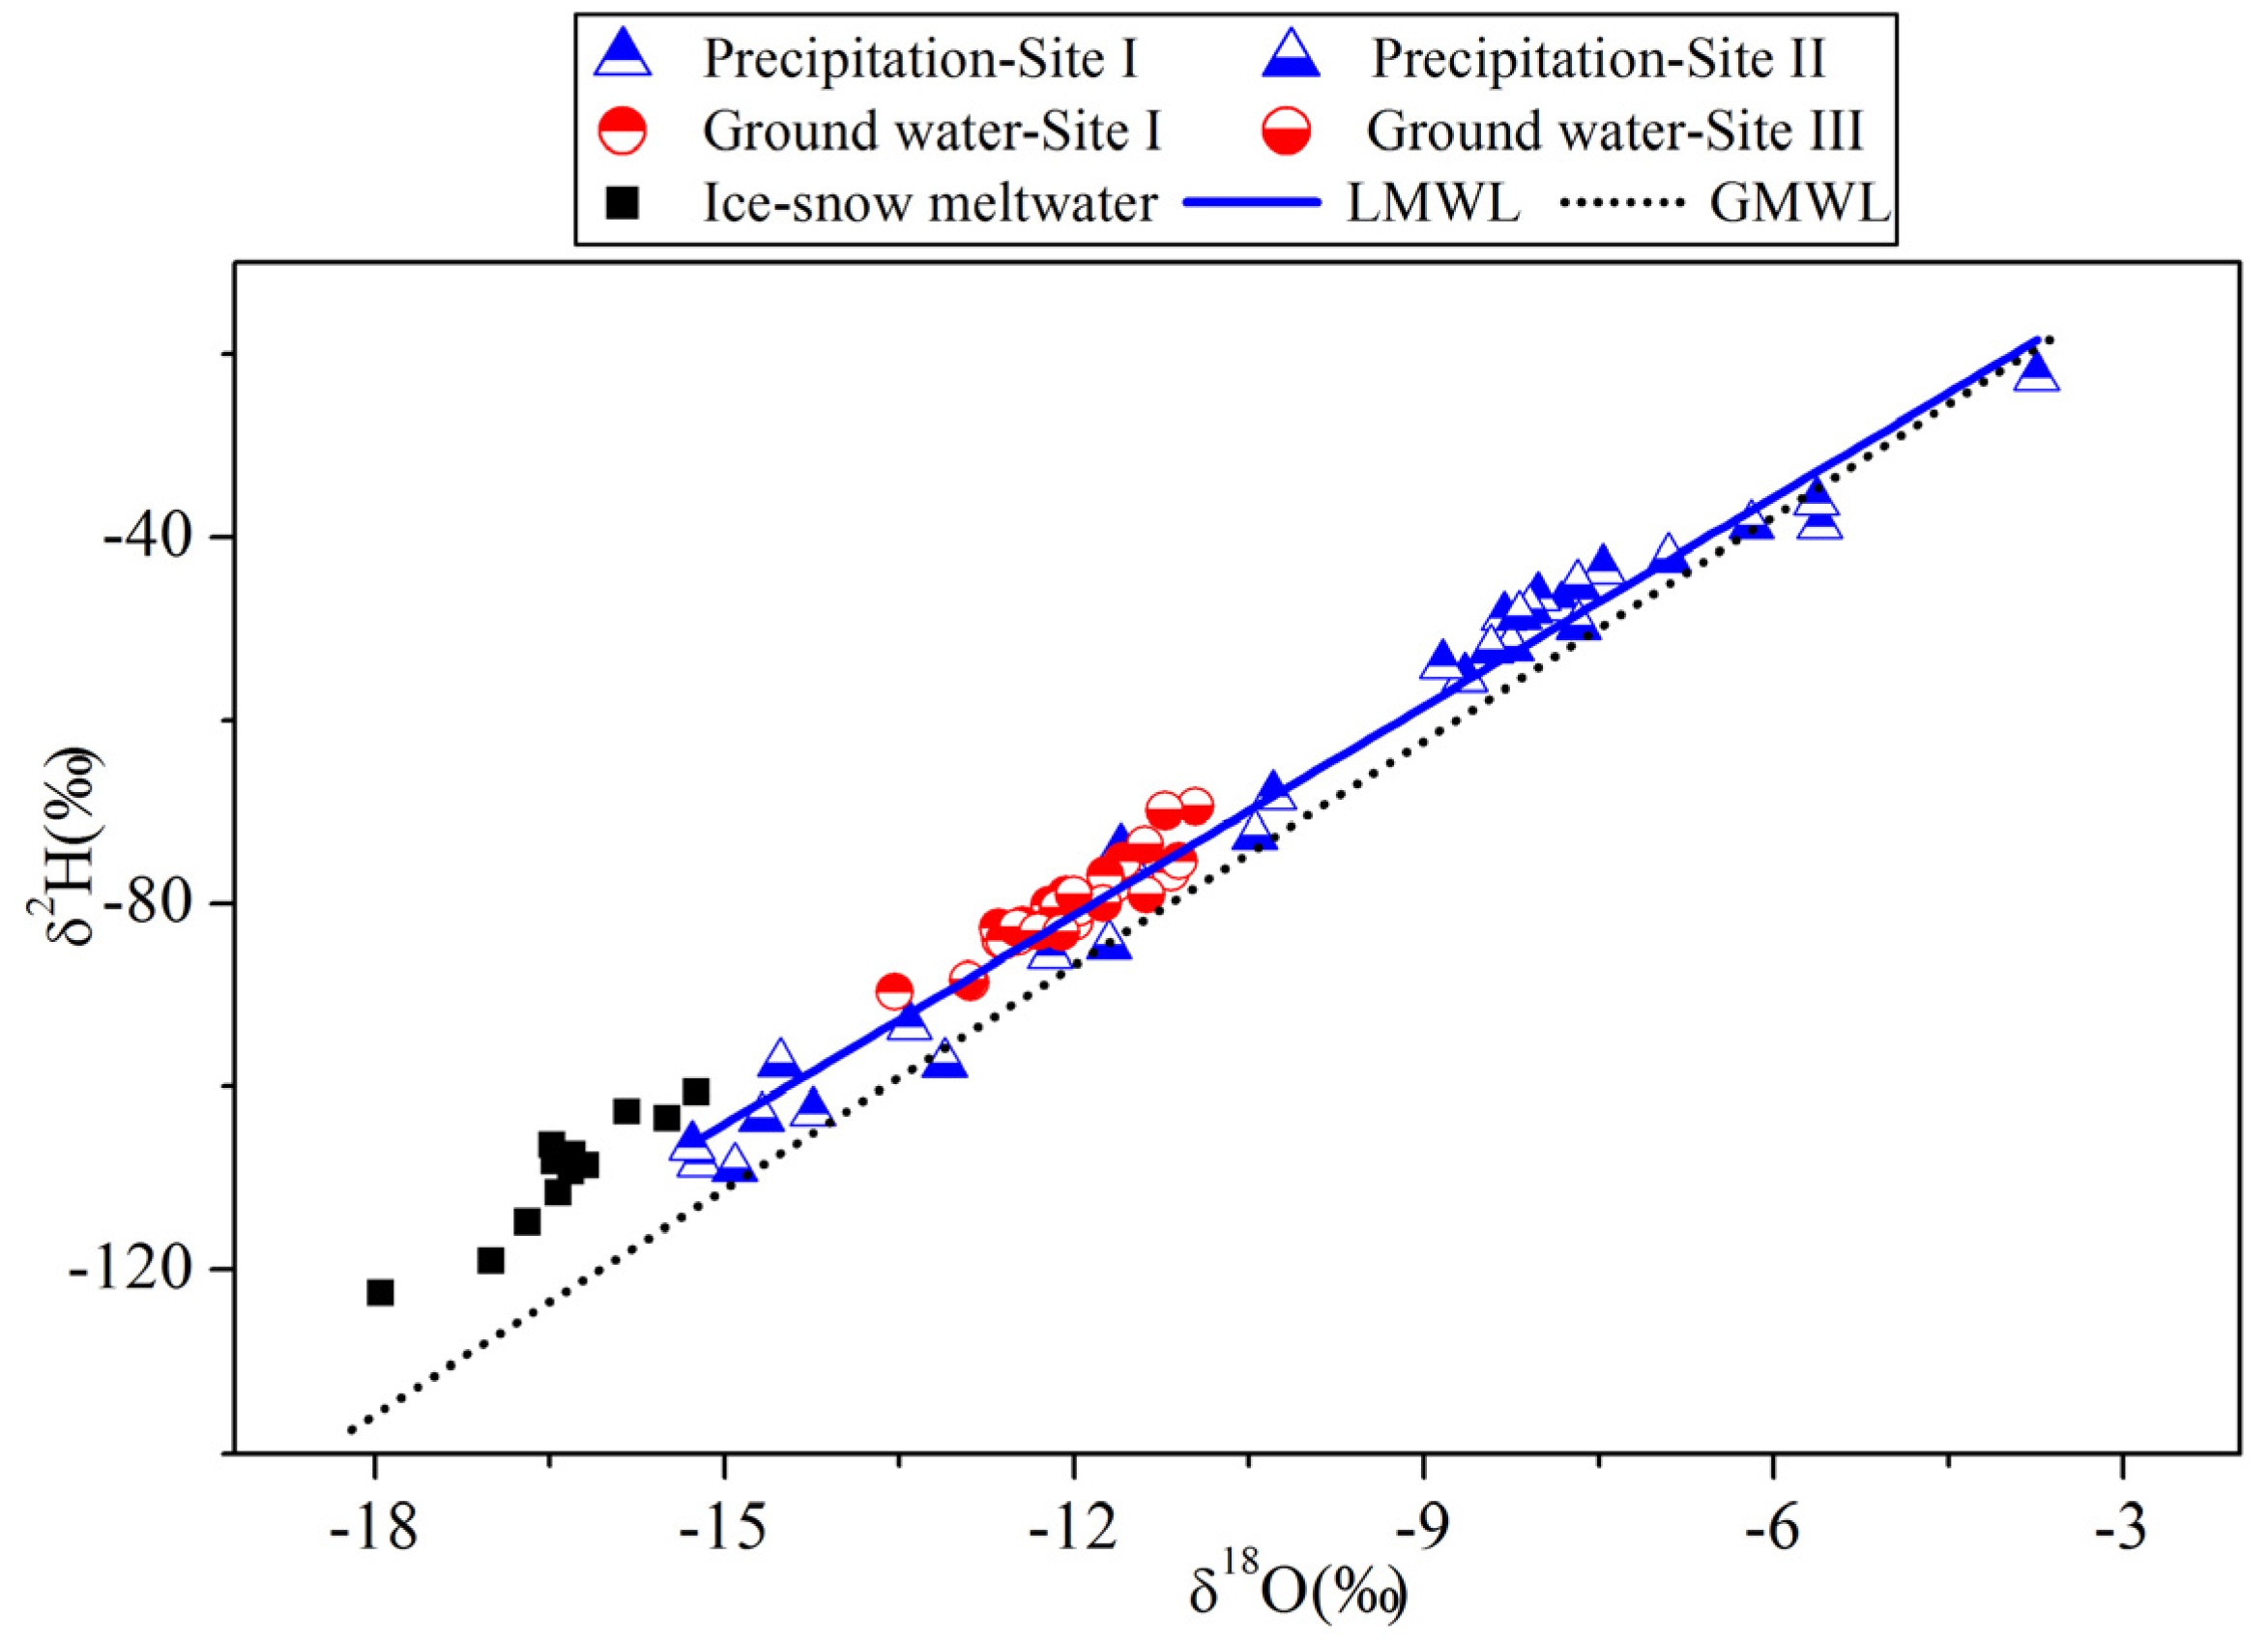
4.2.2. Relationship between δ18O and δ2H

| Sample Type | Date | δ18O(‰) | δ2H (‰) | d-excess(‰) | |
|---|---|---|---|---|---|
| Groundwater | Site I | 8 June | −8.7 | −55 | 14 |
| 8 July | −8.8 | −54 | 17 | ||
| 8 August | −15.2 | −108 | 13 | ||
| 8 October | −14.2 | −103 | 11 | ||
| 8 November | −15.3 | −107 | 16 | ||
| 8 December | −5.6 | −39 | 6 | ||
| 9 January | −7.8 | −48 | 15 | ||
| 9 February | −8.3 | −49 | 18 | ||
| 9 March | −8.0 | −47 | 18 | ||
| 9 April | −7.5 | −44 | 16 | ||
| 9 May | −5.6 | −36 | 9 | ||
| 9 June | −3.7 | −23 | 7 | ||
| 9 July | −13.4 | −93 | 14 | ||
| 9 August | −12.2 | −86 | 12 | ||
| 9 September | −11.6 | −75 | 18 | ||
| 9 October | −11.6 | −74 | 19 | ||
| 9 November | −10.3 | −68 | 14 | ||
| Groundwater | Site III | 8 June | −8.3 | −52 | 14 |
| 8 July | −8.1 | −48 | 17 | ||
| 8 August | −14.9 | −109 | 10 | ||
| 8 October | −14.5 | −97 | 19 | ||
| 8 November | −14.7 | −103 | 14 | ||
| 8 December | −6.9 | −42 | 13 | ||
| 9 February | −8.2 | −49 | 17 | ||
| 9 April | −7.7 | −50 | 12 | ||
| 9 May | −6.2 | −39 | 11 | ||
| 9 July | −13.1 | −98 | 7 | ||
| 9 August | −11.7 | −85 | 9 | ||
| 9 September | −7.7 | −45 | 16 | ||
| 9 October | −8.4 | −52 | 15 | ||
| Precipitation | Site I | 8 May | −13.5 | −90 | 19 |
| 8 June | −12.5 | −84 | 16 | ||
| 8 July | −12.2 | −80 | 17 | ||
| 8 August | −11.2 | −77 | 13 | ||
| 8 October | −11.9 | −80 | 15 | ||
| 8 November | −12.0 | −82 | 14 | ||
| 8 December | −12.9 | −89 | 15 | ||
| 9 January | −12.4 | −82 | 17 | ||
| 9 February | −12.3 | −83 | 15 | ||
| 9 March | −12.1 | −79 | 18 | ||
| 9 April | −12.6 | −84 | 17 | ||
| 9 May | −12.7 | −83 | 19 | ||
| 9 June | −11.7 | −78 | 15 | ||
| 9 July | −11.6 | −75 | 17 | ||
| 9 August | −11.1 | −75 | 13 | ||
| 9 September | −11.7 | −77 | 17 | ||
| 9 October | −12.0 | −81 | 15 | ||
| 9 November | −12.6 | −84 | 17 | ||
| Site II | 8 June | −12.5 | −83 | 17 | |
| 8 August | −11.0 | −69 | 18 | ||
| 8 October | −11.8 | −80 | 14 | ||
| 8 November | −12.1 | −81 | 17 | ||
| 9 April | −12.3 | −83 | 15 | ||
| 9 May | −12.1 | −83 | 14 | ||
| 9 June | −11.4 | −74 | 18 | ||
| 9 July | −11.2 | −70 | 20 | ||
| 9 August | −12.0 | −79 | 17 | ||
| 9 September | −11.4 | −79 | 12 | ||
| 9 October | −12.9 | −88 | 15 | ||
| Ice-snow meltwater | 8 May | −15.8 | −103 | 24 | |
| 8 June | −16.2 | −109 | 21 | ||
| 8 July | −16.7 | −115 | 19 | ||
| 8 August | −16.5 | −106 | 25 | ||
| 8 October | −16.5 | −108 | 23 | ||
| 9 April | −16.3 | −109 | 21 | ||
| 9 May | −15.2 | −101 | 21 | ||
| 9 June | −15.5 | −104 | 20 | ||
| 9 July | −16.3 | −107 | 23 | ||
| 9 August | −17.0 | −119 | 17 | ||
| 9 September | −18.0 | −123 | 21 | ||
| 9 October | −16.4 | −112 | 20 | ||
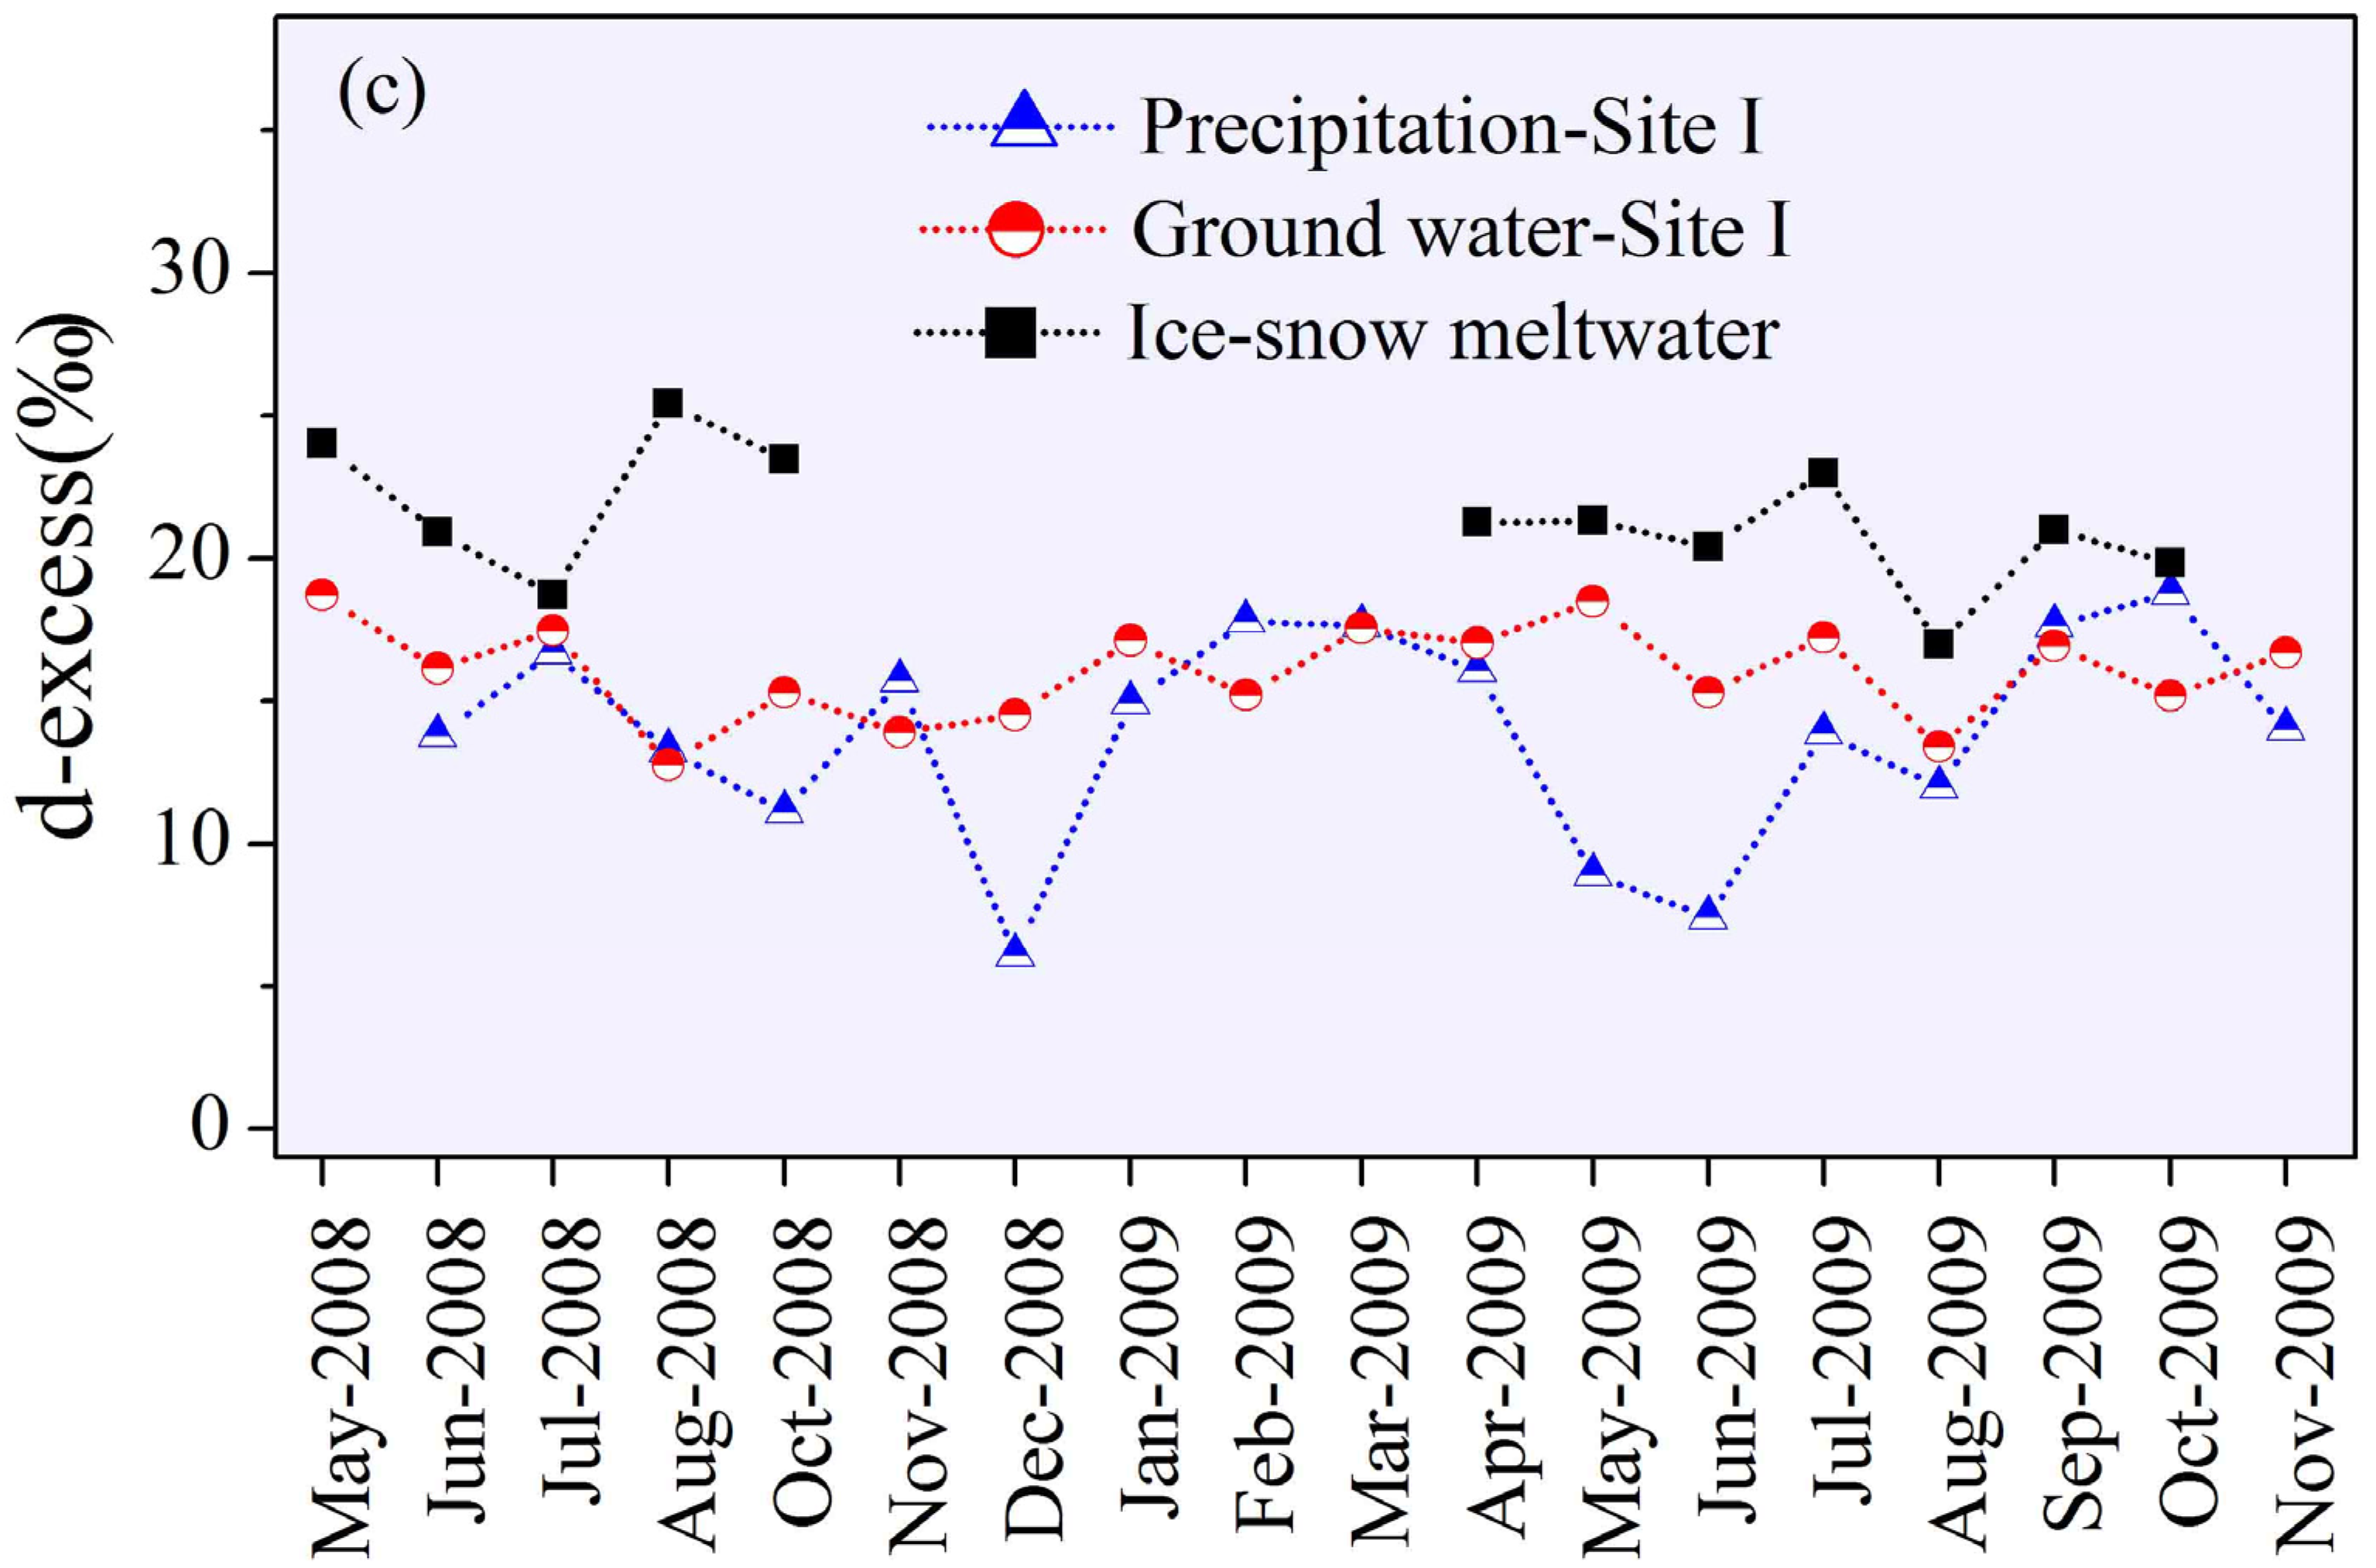
4.2.3. Characteristics of d-excess
5. Discussion
5.1. Comparing Groundwater with Precipitation

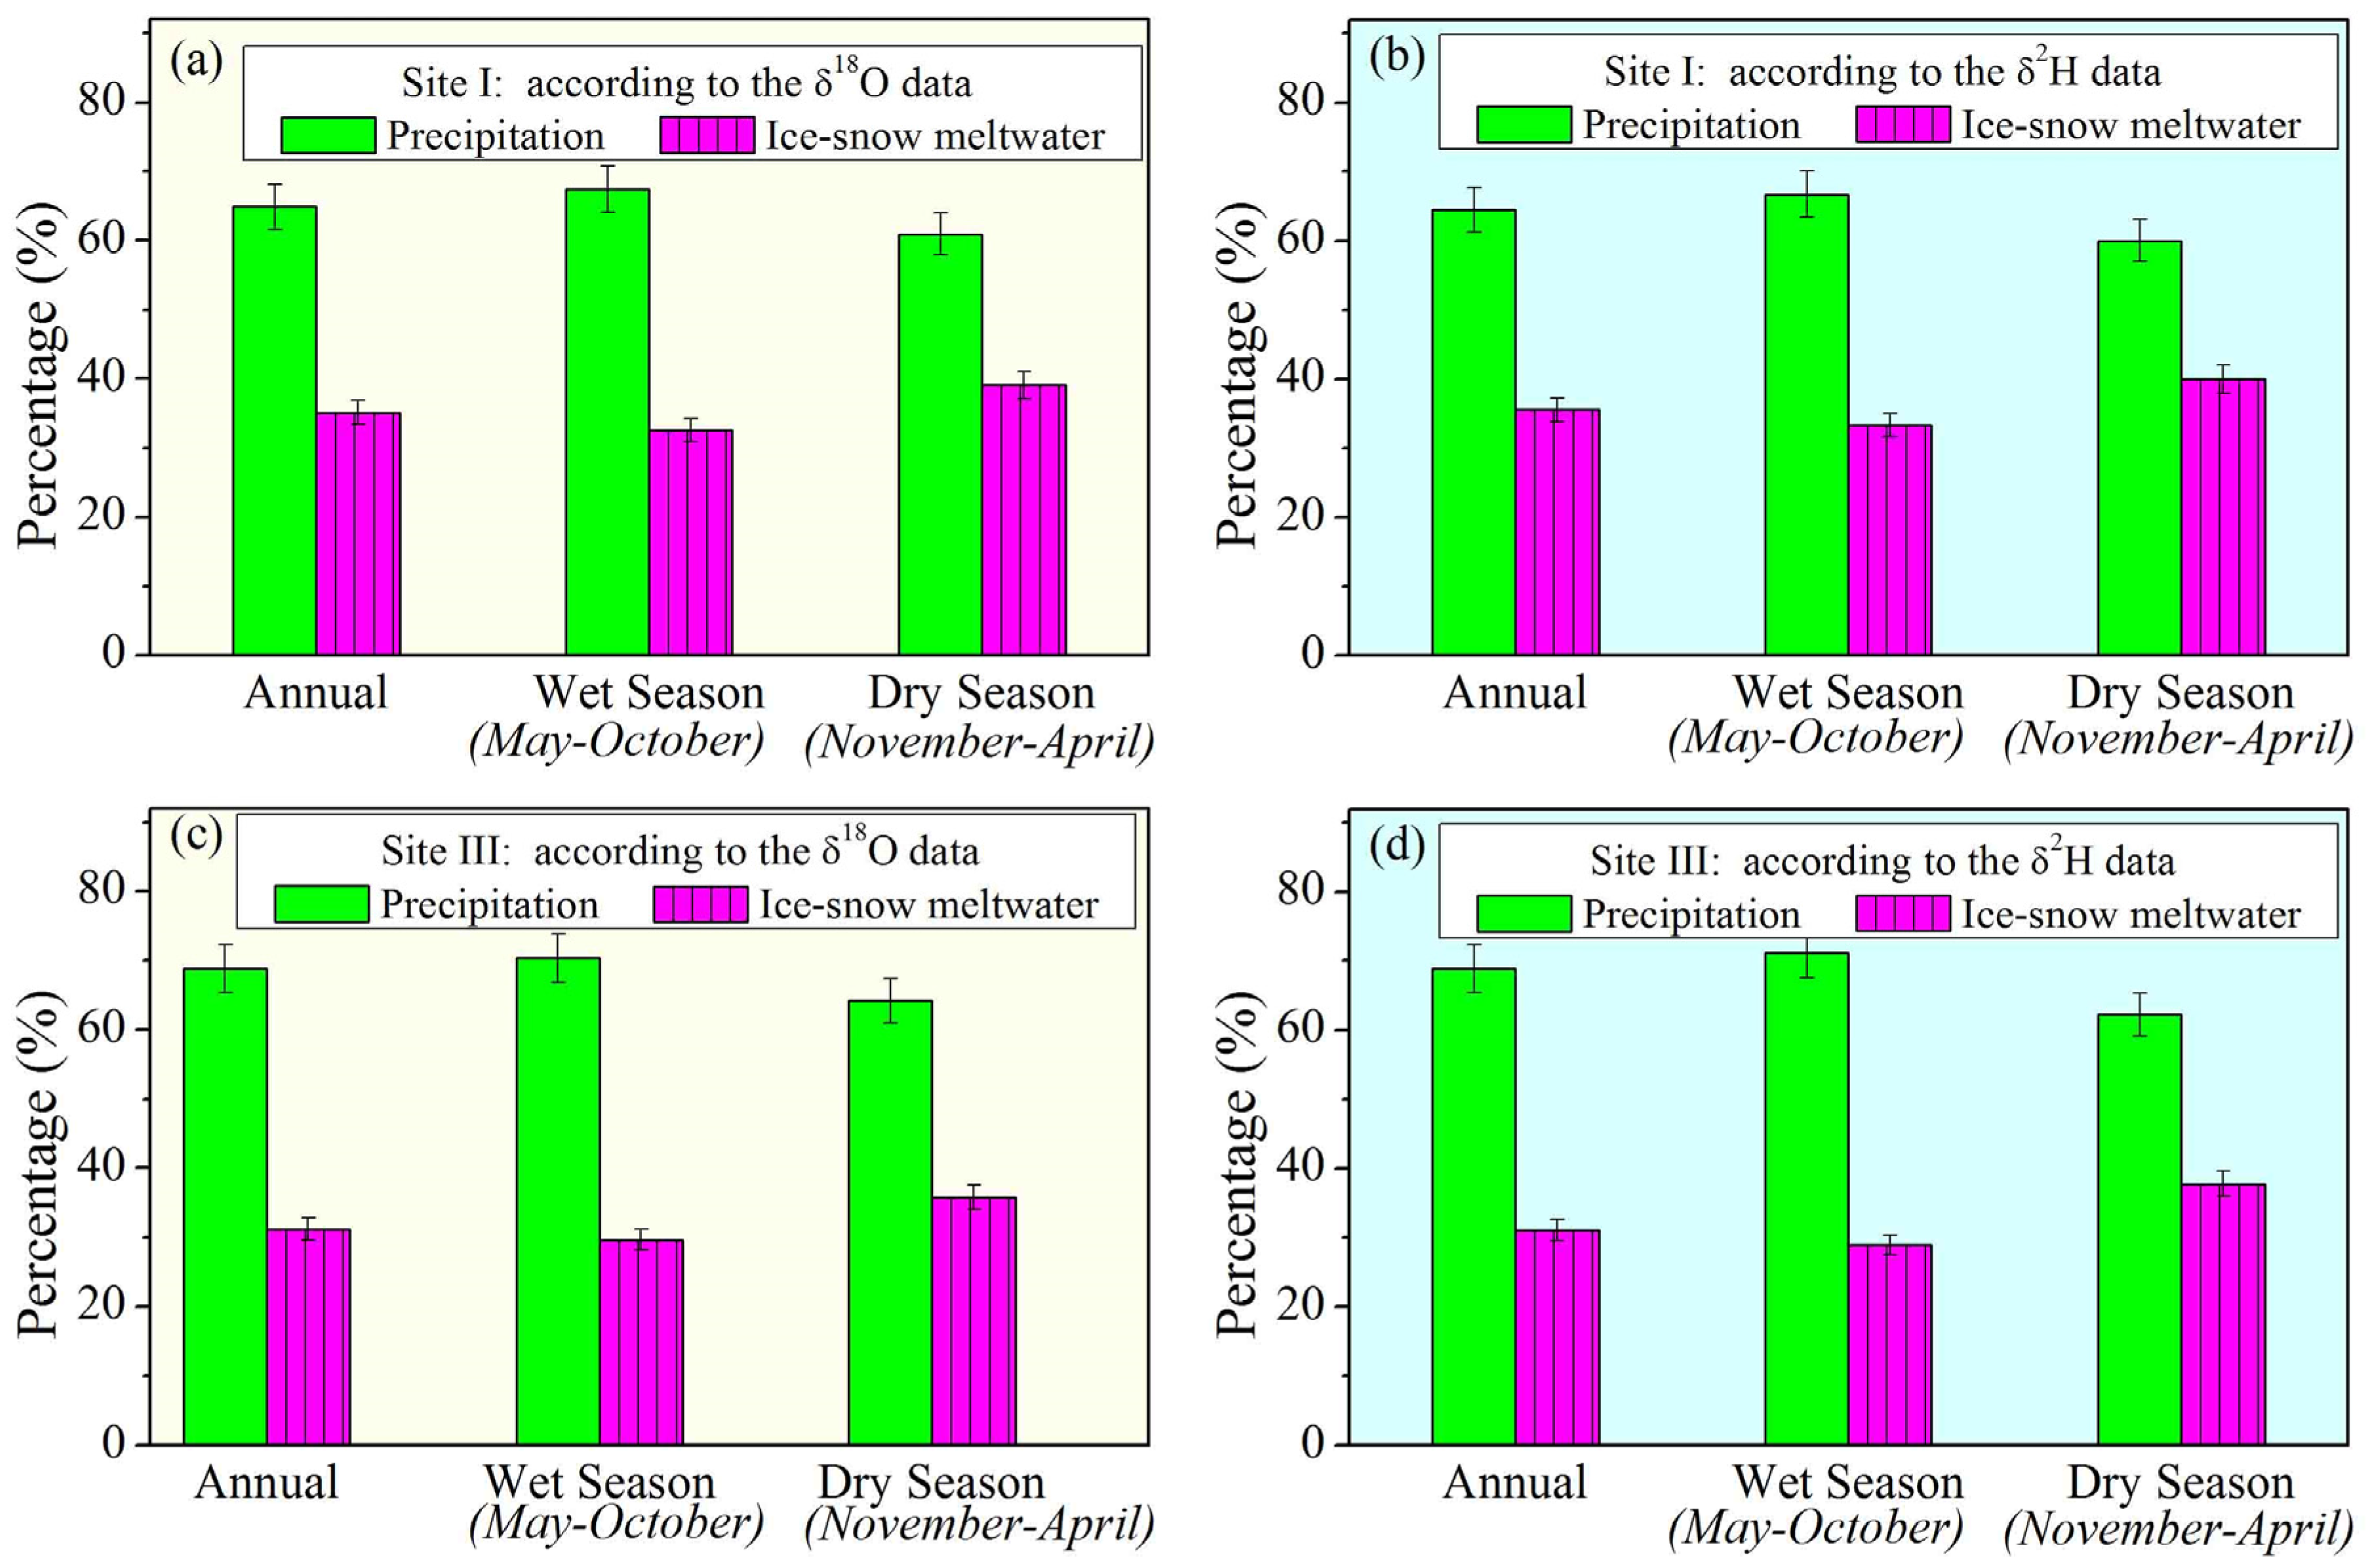
5.2. Groundwater Mixing in the Study Region
6. Conclusions
Acknowledgments
Author Contributions
Conflicts of Interest
References
- Beniston, M. Climatic change in mountain regions: A review of possible impacts. Clim. Chang. 2003, 59, 5–31. [Google Scholar] [CrossRef]
- Deng, M.Z.; Qin, D.H.; Zhang, H.G. Public perceptions of climate and cryosphere change in typical arid inland river areas of China: Facts, impacts and selections of adaptation measures. Quat. Int. 2012, 282, 48–57. [Google Scholar] [CrossRef]
- Salama, M.S.; van der Velde, R.; Zhong, L.; Ma, Y.; Ofwono, M.; Su, Z. Decadal variations of land surface temperature anomalies observed over the Tibetan Plateau by the special sensor microwave imager (SSM/I) from 1987 to 2008. Clim. Chang. 2012, 114, 769–781. [Google Scholar] [CrossRef]
- Li, Z.X.; He, Y.Q.; Wang, C.F.; Wang, X.F.; Xin, H.J.; Zhang, W.; Cao, W.H. Spatial and temporal trends of temperature and precipitation during 1960-2008 at the Hengduan Mountains, China. Quat. Int. 2011, 236, 127–142. [Google Scholar] [CrossRef]
- Dedieu, J.P.; Lessard-Fontaine, A.; Ravazzani, G.; Cremonese, E.; Shalpykova, G.; Beniston, M. Shifting mountain snow patterns in a changing climate from remote sensing retrieval. Sci. Total Environ. 2014, 493, 1267–1279. [Google Scholar] [CrossRef] [PubMed]
- Parish, R.; Funnell, D.C. Climate change in mountain regions: Some possible consequences in the Moroccan High Atlas. Glob. Environ. Chang. 1999, 9, 45–48. [Google Scholar] [CrossRef]
- Bauder, A.; Funk, M.; Huss, M. Ice-volume changes of selected glaciers in the Swiss Alps since the end of the 19th century. Ann. Glaciol. 2007, 46, 145–149. [Google Scholar] [CrossRef]
- Lambrecht, A.; Kuhn, M. Glacier changes in the Austrian Alps during the last three decades, derived from the new Austrian glacier inventory. Ann. Glaciol. 2007, 46, 177–184. [Google Scholar] [CrossRef]
- Lambrecht, A.; Mayer, C. Temporal variability of the non-steady contribution from glaciers to water discharge in western Austria. J. Hydrol. 2009, 376, 353–361. [Google Scholar] [CrossRef]
- Baraer, M.; Mark, B.G.; McKenzie, J.M.; Condom, T.; Bury, J.; Huh, K.I.; Portocarrero, C.; Gomez, J.; Rathay, S. Glacier recession and water resources in Peru’s Cordillera Blanca. J. Gloaciol. 2012, 58, 134–150. [Google Scholar] [CrossRef]
- Barnett, T.P.; Adam, J.C.; Lettenmaier, D.P. Potential impacts of a warming climate on water availability in snow-dominated regions. Nature 2005, 438, 303–309. [Google Scholar] [CrossRef] [PubMed]
- Immerzeel, W.W.; van Beek, L.P.H.; Bierkens, M.F.P. Climate change will affect the Asian water towers. Science 2010, 328, 1382–1385. [Google Scholar] [CrossRef] [PubMed]
- Rees, H.G.; Collins, D.N. Regional differences in response of flow in glacier-fed Himalayan rivers to climatic warming. Hydrol. Process 2006, 20, 2157–2169. [Google Scholar] [CrossRef]
- Marshall, S.J.; White, E.C.; Demuth, M.N.; Bolch, T.; Wheate, R.; Menounos, B.; Beedle, M.J.; Shea, J.M. Glacier Water Resources on the Eastern Slopes of the Canadian Rocky Mountains. Can. Water Resour. J. 2011, 36, 109–133. [Google Scholar] [CrossRef]
- Finger, D.; Hugentobler, A.; Huss, M.; Voinesco, A.; Wernli, H.; Fischer, D.; Weber, E.; Jeannin, P.Y.; Kauzlaric, M.; Wirz, A.; et al. Identification of glacial meltwater runoff in a karstic environment and its implication for present and future water availability. Hydrol. Earth Syst. Sci. 2013, 17, 3261–3277. [Google Scholar] [CrossRef]
- Zhao, H.X.; Moore, G.W.K. On the relationship between Tibetan snow cover, the Tibetan plateau monsoon and the Indian summer monsoon. Geophys. Res. Lett. 2004, 31. [Google Scholar] [CrossRef]
- Heim, A. The glaciation and solifluction of Minya Gongka. Geogr. J. 1936, 87, 444–454. [Google Scholar] [CrossRef]
- He, Y.Q.; Li, Z.X.; Yang, X.M.; Jia, W.X.; He, X.Z.; Song, B.; Zhang, N.N.; Liu, Q. Changes of the Hailuogou Glacier, Mt Gongga, China, against the background of global warming in the last several decades. J. China Univ. Geosci. 2008, 19, 271–281. [Google Scholar]
- Li, Z.X.; He, Y.Q.; Yang, X.M.; Theakstone, W.H.; Jia, W.X.; Pu, T.; Liu, Q.; He, X.Z.; Song, B.; Zhang, N.N.; et al. Changes of the Hailuogou glacier, Mt. Gongga, China, against the background of climate change during the Holocene. Quat. Int. 2010, 218, 166–175. [Google Scholar] [CrossRef]
- Pan, B.T.; Zhang, G.L.; Wang, J.; Cao, B.; Geng, H.P.; Wang, J.; Zhang, C.; Ji, Y.P. Glacier changes from 1966 to 2009 in the Gongga Mountains, on the south-eastern margin of the Qinghai-Tibetan Plateau and their climatic forcing. Cryosphere 2012, 6, 1087–1101. [Google Scholar] [CrossRef]
- Meng, Y.C.; Liu, G.D.; Zhang, L.T. A comparative study on stable isotopic composition in waters of the glacial and nonglacial rivers in Mount Gongga, China. Water Environ. J. 2014, 28, 212–221. [Google Scholar] [CrossRef]
- Craig, H. Isotope variations in meteoric waters. Science 1961, 133, 1702–1703. [Google Scholar] [CrossRef] [PubMed]
- Rozanski, K.; Araguas-Araguas, L.; Gonfiantini, R. Isotopic pattern in modern global precipitation. In Climatic Change in Continental Isotopic Records, 1st ed.; Swart, P.K., Lohwan, K.L., Mckenzie, J., Savin, S., Eds.; Geophysical Monograph No 78; American Geophysical Union: Washington, DC, USA, 1993; Volume 1, pp. 1–37. [Google Scholar]
- Kristiansen, S.M.; Yde, J.C.; Bárcena, T.G.; Jakobsen, B.H.; Olsen, J.; Knudsen, N.T. Geochemistry of groundwater in front of a warm-based glacier in Southeast Greenland. Geogr. Ann. Ser. A Phys. Geogr. 2013, 95, 97–108. [Google Scholar] [CrossRef]
- Wadham, J.L.; Cooper, R.J.; Tranter, M.; Bottrell, S. Evidence for widespread anoxia in the proglacial zone of an Arctic glacier. Chem. Geol. 2007, 243, 1–15. [Google Scholar] [CrossRef]
- Blaen, P.J.; Hannah, D.M.; Brown, L.E.; Milner, A.M. Water temperature dynamics in High Arctic river basins. Hydrol. Process. 2013, 27, 2958–2972. [Google Scholar] [CrossRef]
- Tan, H.B.; Rao, W.B.; Chen, J.S.; Su, Z.G.; Sun, X.X.; Liu, X.Y. Chemical and isotopic approach to groundwater cycle in western Qaidam Basin, China. Chin. Geogr. Sci. 2009, 19, 357–364. [Google Scholar] [CrossRef]
- Thomas, A. Overview of the geoecology of the Gongga Shan range, Sichuan province, China. Mt. Res. Dev. 1999, 17, 17–30. [Google Scholar] [CrossRef]
- Thomas, A. The climate of the Gongga Shan range, Sichuan Province, PR China. Arct. Alpine Res. 1997, 29, 226–232. [Google Scholar] [CrossRef]
- Shen, Z.; Lui, Z.; Fank, J. Altitudinal changes in species diversity and community structure of Abies fabri communities at Hailuo Valley of Mt. Gongga, Sichuan. Biodivers. Sci. 2004, 12, 237–244. (In Chinese) [Google Scholar]
- Zhang, Y.; Fujita, K.; Liu, S.Y.; Liu, Q.A.; Wang, X. Multi-decadal ice-velocity and elevation changes of a monsoonal maritime glacier: Hailuogou glacier, China. J. Glaciol. 2010, 56, 65–74. [Google Scholar] [CrossRef]
- Liu, Q.A.; Liu, S.Y.; Zhang, Y.; Wang, X.; Zhang, Y.S.; Guo, W.Q.; Xu, J.L. Recent shrinkage and hydrological response of Hailuogou glacier, a monsoon temperate glacier on the east slope of Mount Gongga, China. J. Glaciol. 2010, 56, 215–224. [Google Scholar] [CrossRef]
- Dansgaard, W. Stable isotopes in precipitation. Tellus 1964, 16, 436–468. [Google Scholar] [CrossRef]
- Merlivat, M.; Jouzel, J. Global climatic interpretation of the deuterium–oxygen-18 relationship for precipitation. Geophys. Res. 1979, 84, 5029–5033. [Google Scholar]
- Buttle, J.M. Isotope hydrograph separations and rapid delivery of pre-event water from drainage basins. Prog. Phys. Geog. 1994, 18, 16–41. [Google Scholar] [CrossRef]
- Iacumin, P.; Venturelli, G.; Selmo, E. Isotopic features of rivers and groundwater of the Parma Province (Northern Italy) and their relationships with precipitation. J. Geochem. Explor. 2009, 102, 56–62. [Google Scholar] [CrossRef]
- Jeelani, G.; Bhat, N.A.; Shivanna, K. Use of δ18O tracer to identify stream and spring origins of a mountainous catchment: A case study from Liddar watershed, Western Himalaya, India. J. Hydrol. 2010, 393, 257–264. [Google Scholar] [CrossRef]
- Chiogna, G.; Santoni, E.; Camin, F.; Tonon, A.; Majone, B.; Trenti, A.; Bellin, A. Stable isotope characterization of the Vermigliana catchment. J. Hydrol. 2014, 509, 295–305. [Google Scholar] [CrossRef]
- Peng, H.D.; Mayer, B.; Harris, S.; Krouse, H. A 10-yr record of stable isotope ratios of hydrogen and oxygen in precipitation at Calgary, Alberta, Canada. Tellus B 2004, 56, 147–159. [Google Scholar] [CrossRef]
- Meng, Y.C.; Liu, G.D. The Below-cloud Secondary Evaporation Effects on the Stable Isotope Composition in Precipitation in Yangtze River Basin. Adv. Water Sci. 2010, 21, 327–334. (In Chinese) [Google Scholar]
- Gat, J.R. Oxygen and hydrogen isotopes in the hydrological cycle. Annual Review of Earth Planetary. Sciences 1996, 24, 225–262. [Google Scholar]
- Cao, Z.T.; Cheng, G.W. Preliminary analysis of hydrological characteristics of Hailuogou glacier on the eastern slope of the Gongga Mountain. In Glaciers and Enviornment in the QinghaiXizang (Tibet) Plateau, [1]—The Gongga Mountain, 1st ed.; Xie, Z.C., Kotlyakov, V.M., Eds.; Science Press: Beijing, China, 1994; Volume 1, pp. 143–156. [Google Scholar]
© 2015 by the authors; licensee MDPI, Basel, Switzerland. This article is an open access article distributed under the terms and conditions of the Creative Commons Attribution license (http://creativecommons.org/licenses/by/4.0/).
Share and Cite
Meng, Y.; Liu, G.; Li, M. Tracing the Sources and Processes of Groundwater in an Alpine Glacierized Region in Southwest China: Evidence from Environmental Isotopes. Water 2015, 7, 2673-2690. https://doi.org/10.3390/w7062673
Meng Y, Liu G, Li M. Tracing the Sources and Processes of Groundwater in an Alpine Glacierized Region in Southwest China: Evidence from Environmental Isotopes. Water. 2015; 7(6):2673-2690. https://doi.org/10.3390/w7062673
Chicago/Turabian StyleMeng, Yuchuan, Guodong Liu, and Mingxi Li. 2015. "Tracing the Sources and Processes of Groundwater in an Alpine Glacierized Region in Southwest China: Evidence from Environmental Isotopes" Water 7, no. 6: 2673-2690. https://doi.org/10.3390/w7062673
APA StyleMeng, Y., Liu, G., & Li, M. (2015). Tracing the Sources and Processes of Groundwater in an Alpine Glacierized Region in Southwest China: Evidence from Environmental Isotopes. Water, 7(6), 2673-2690. https://doi.org/10.3390/w7062673