Article

Experimental Measurement of Diffusive Extinction Depth and Soil Moisture Gradients in a Dune Sand Aquifer in Western Saudi Arabia: Assessment of Evaporation Loss for Design of an MAR System

1
Water Desalination and Reuse Center, King Abdullah University of Science and Technology, Thuwal 23955-6900, Saudi Arabia
2
Earth Science and Engineering, King Abdullah University of Science and Technology, Thuwal 23955-6900, Saudi Arabia
3
U. A. Whitaker College of Engineering, Florida Gulf Coast University, 10501 FGCU Boulevard, Fort Myers, FL 33965-6565, USA
*
Author to whom correspondence should be addressed.
Water 2015, 7(12), 6967-6982; https://doi.org/10.3390/w7126669
Submission received: 5 September 2015 / Revised: 22 November 2015 / Accepted: 4 December 2015 / Published: 10 December 2015
(This article belongs to the Special Issue Water Resources Assessment and Management in Drylands)

Abstract

:
A component of designing a managed aquifer recharge system in a dune aquifer is the control of diffusive evaporative loss of water which is governed by the physical properties of the sediments and the position of the water table. A critical water table position is the “extinction depth”, below which no further loss of water occurs via diffusion. Field experiments were conducted to measure the extinction depth of sediments taken from a typical dune field in the region. The soil grain size characteristics, laboratory porosity, and saturated hydraulic conductivity were measured. The sand is classified as well-sorted, very fine sand with a mean grain diameter of 0.15 mm. Soil moisture gradients and diffusion loss rates were measured using sensors in a non-weighing lysimeter that was placed below land surface. The sand was saturated carefully with water from the bottom to the top and was exposed to the natural climate for a period of about two months. The moisture gradient showed a gradual decline during measurement until extinction depth was reached at about 100 cm below surface after 56 days. Diurnal temperature changes were observed in the upper 75 cm of the column and were negligible at greater depth.

1. Introduction

Western Saudi Arabia is a hyper-arid area that receives only about 50 mm of rainfall each year in the coastal area and slightly greater accumulations in the interior higher altitude areas [1]. When rainfall does occur, it is an intense event that causes flash floods through ephemeral channels, known as wadis [2,3]. Flood water passing through the wadi channels allows some recharge to the underlying alluvial aquifer, but most of the water is lost to discharge to tidal water or evaporates with only 3% to 10% being captured as recharge [4,5,6]. Recent research on future climatic changes in this region suggests that a greater degree of variability will occur with longer drought periods and more intense rainfall events with corresponding floods [7,8]. Therefore, it is necessary to assess a water management system that will capture freshwater from flood events and place the captured water into storage for use during drought periods.
One strategy being implemented is the construction of large dams within the ephemeral channel system to capture and store stormwater, such as the recently constructed dam in Wadi Khulays (Figure 1). While this strategy is effective at containing the captured water, the climate of the area is very hot and dry, resulting in a high degree of evaporative loss from the reservoir, on the order of 50% or greater [9,10]. To mitigate this loss of water to free surface evaporation, two managed aquifer recharge (MAR) schemes have been suggested, one using the storage within the wadi alluvial aquifer in downstream parts of the wadi system [10] and a second using a down-gradient dune field (Figure 1) [11].
Figure 1. Wadi Khulays Dam and reservoir (a) and the downstream dune field (b), Lopez et al. [11].
Water 07 06669 g001
Dune aquifers have been used in many regions for the storage of various types of treated freshwater [12,13] to impaired quality water [11,14]. There are several important issues in the use of a dune aquifer for stormwater storage in western Saudi Arabia. The aquifer must have adequate storage capacity (porosity or specific yield) to receive the stormwater, satisfactory hydraulic conductivity to allow infiltration of the water and recovery through wells or underdrains, a degree of stability to maintain the subsurface reservoir, a low hydraulic gradient to keep the water in storage, and a known extinction depth to allow a design that minimizes evaporative loss. A method of determining dune aquifer hydraulic properties and a rapid screening process in this region is presented in this special issue by Lopez et al. [15]. The primary purpose of our research is to experimentally measure the evaporative extinction depth of dune sands in this region of Saudi Arabia.
Previous research has estimated extinction depth in a variety of soil types [16,17,18,19]. The grain size characteristics of the soil or sediment, position of the water table, and climate are known to affect the extinction depth as demonstrated in actual measurements [20,21,22]. Commonly, estimates of extinction depth research have been conducted considering total evapotranspiration without a separation of diffusive evaporation loss and plant impacts via transpiration [16,17,18,19]. Furthermore, Soylu et al. [23] used different numerical models to investigate the sensitivity of land surface evapotranspiration to water table depth and soil texture. They concluded that further field-based studies and modeling are essential to improve the predictability of shallow water table and land surface interactions in numerical models, particularly as it relates to the parameterization of soil hydraulic properties. An excellent review of the evaporation from bare sandy soil in arid environments can be found in Wang [24].
In this research, we measured the diffusive evaporation loss under a condition of bare sand as would occur within an MAR site in a dune field without any influence of vegetation. The climatic conditions and soil moisture profiles were recorded. We then applied the hydrological simulator HYDRUS-1D to model the soil evaporation loss. The measured and modeled extinction depth in bare dune sand was compared to measurements made in other locations.

2. Background and Methods

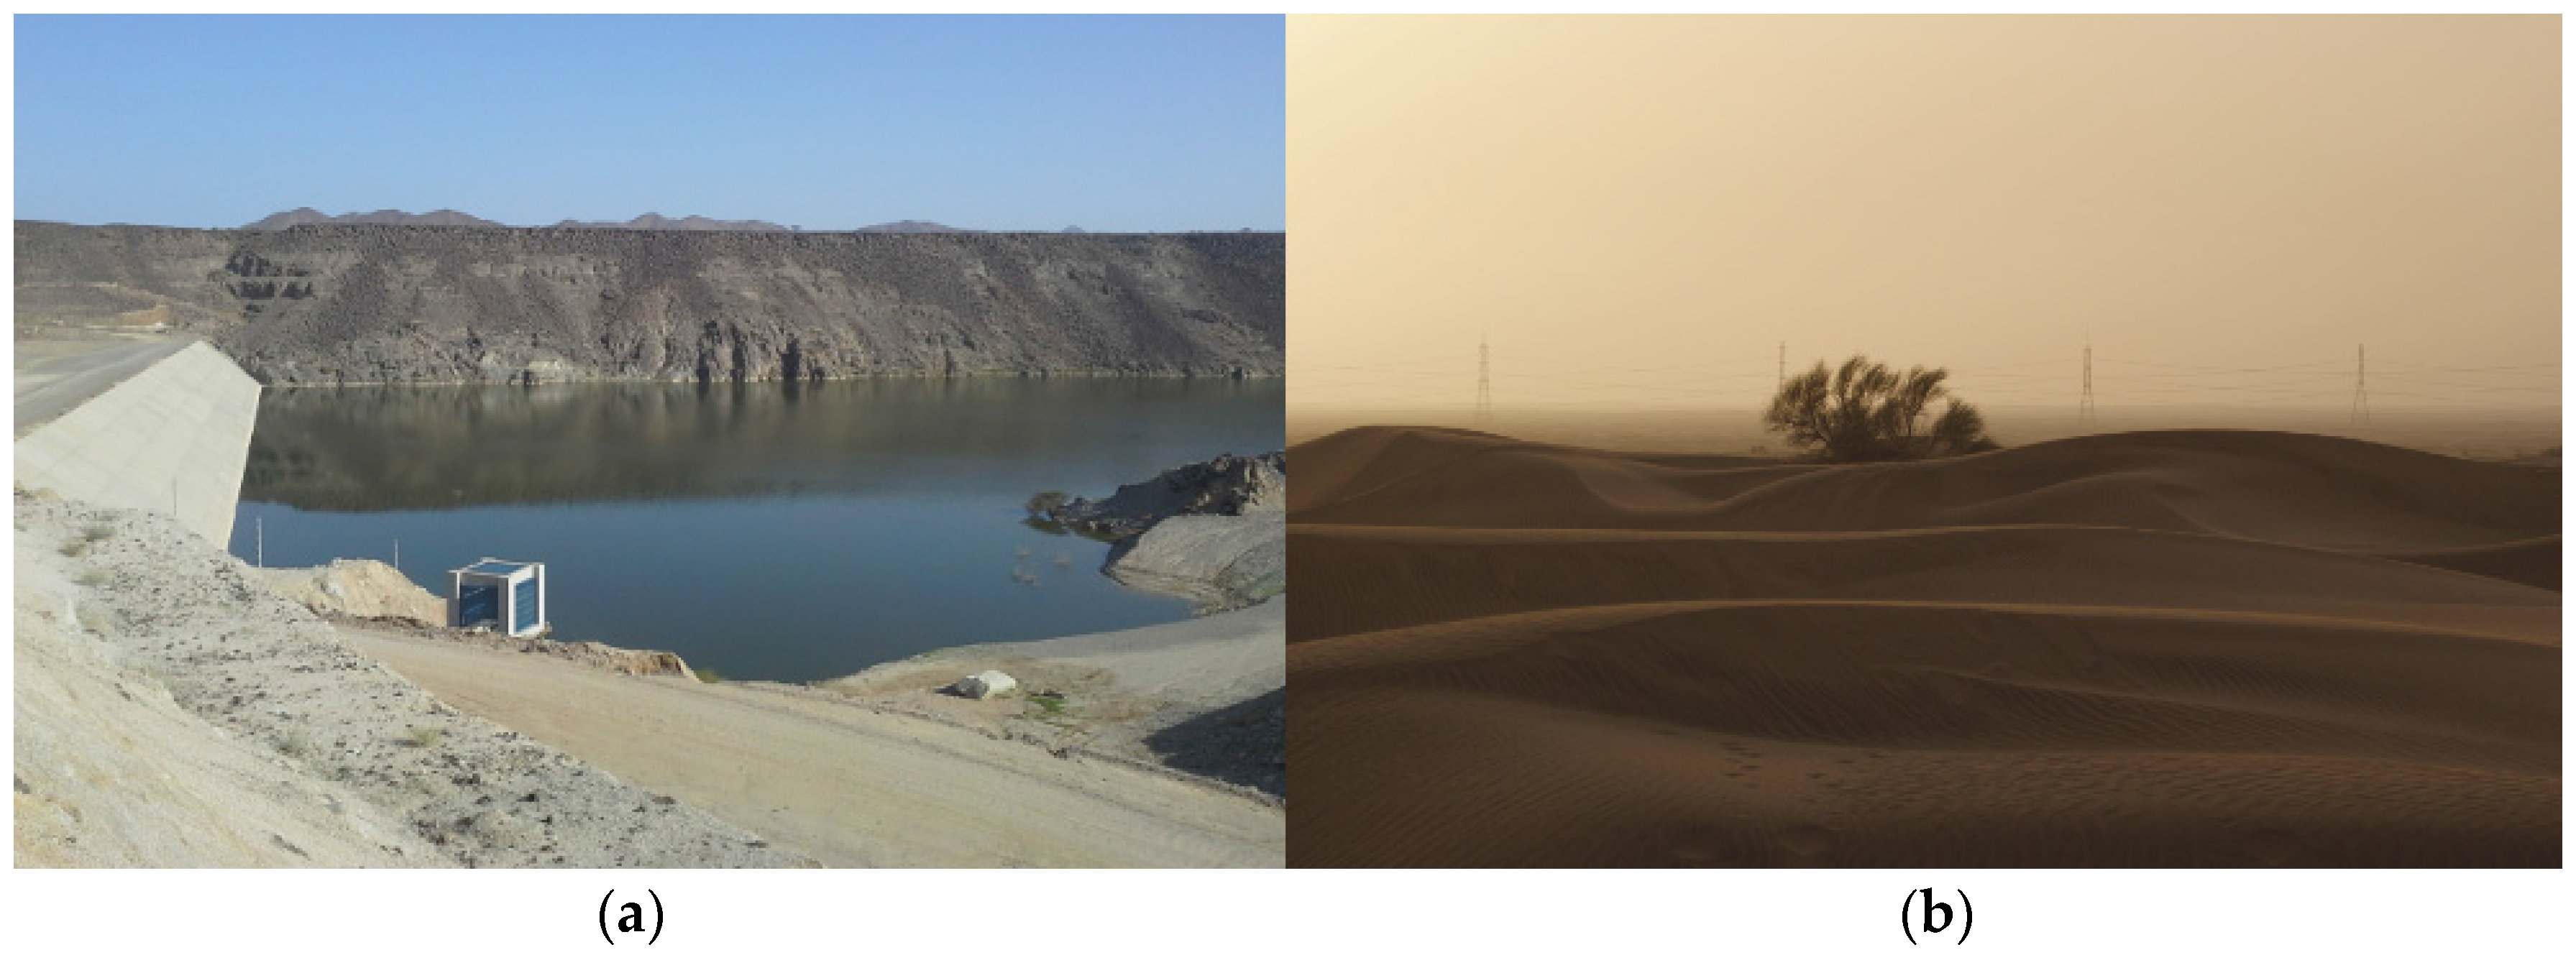
2.1. Collection of Sand Samples from Dune Fields

A field experiment was carried out to measure the diffusive extinction depth of dune sand and to monitor the soil moisture and temperature dynamics during summer for 59 days (18 July 2012–14 September 2012). The sand used in the experiment was excavated from a desert dune in the southwestern region of Saudi Arabia (22°08′7.50′′N, 39°16′17.35′′E). The samples removed from the dune were rather homogeneous but mixed and not in a natural condition. However, dune sands are typically moving and unstable to a degree, therefore making the samples representative of the dune characteristics. The minimum and maximum temperatures in the field were 24 and 43 °C, respectively, recorded by the meteorological station installed nearby the experimental site. No rainfall events occurred during the period of the field experiment.

2.2. Grain Size Distribution Analyses

The grain size distribution of the dune sand was measured using the standard sieving technique as described by Tanner and Balsillie [25] and the National Soil Survey Laboratory Methods Manual [26]. A total of 34 sieves were used in the analysis. Five samples were randomly selected from the full volume of collected sediment for analysis.

2.3. Laboratory Porosity and Hydraulic Conductivity Measurements

Porosity measurements were made in the laboratory using the water saturation method. A known volume of water was placed into a graduated cylinder. A dry sediment sample was then added to the water within the cylinder. The sediment addition was carefully controlled to avoid creation of air bubbles within the column and was terminated before the volume of sediment exceeded the top of the water in the graduated cylinder. The column was tapped carefully with a rubber mallet until the sediment volume ceased to reduce in height. This approximated the natural packing of the sediment within the dune. The volume of water was determined be subtracting the excess water found in the cylinder from the initial volume of water added. The porosity was determined by dividing the water volume by the sediment volume. This analysis was conducted on three samples collected from the excavated sand and 50 samples on which grain size distribution and hydraulic conductivity were measured from the same dune field by Lopez et al. [15]. Additional porosity measurement were made during moisture calibration.
The hydraulic conductivity was measured in the laboratory with a standing head (constant head) permeameter, using standard laboratory methods [27]. Measurements were conducted on the same five samples on which porosity and grain size distribution analyses were made.

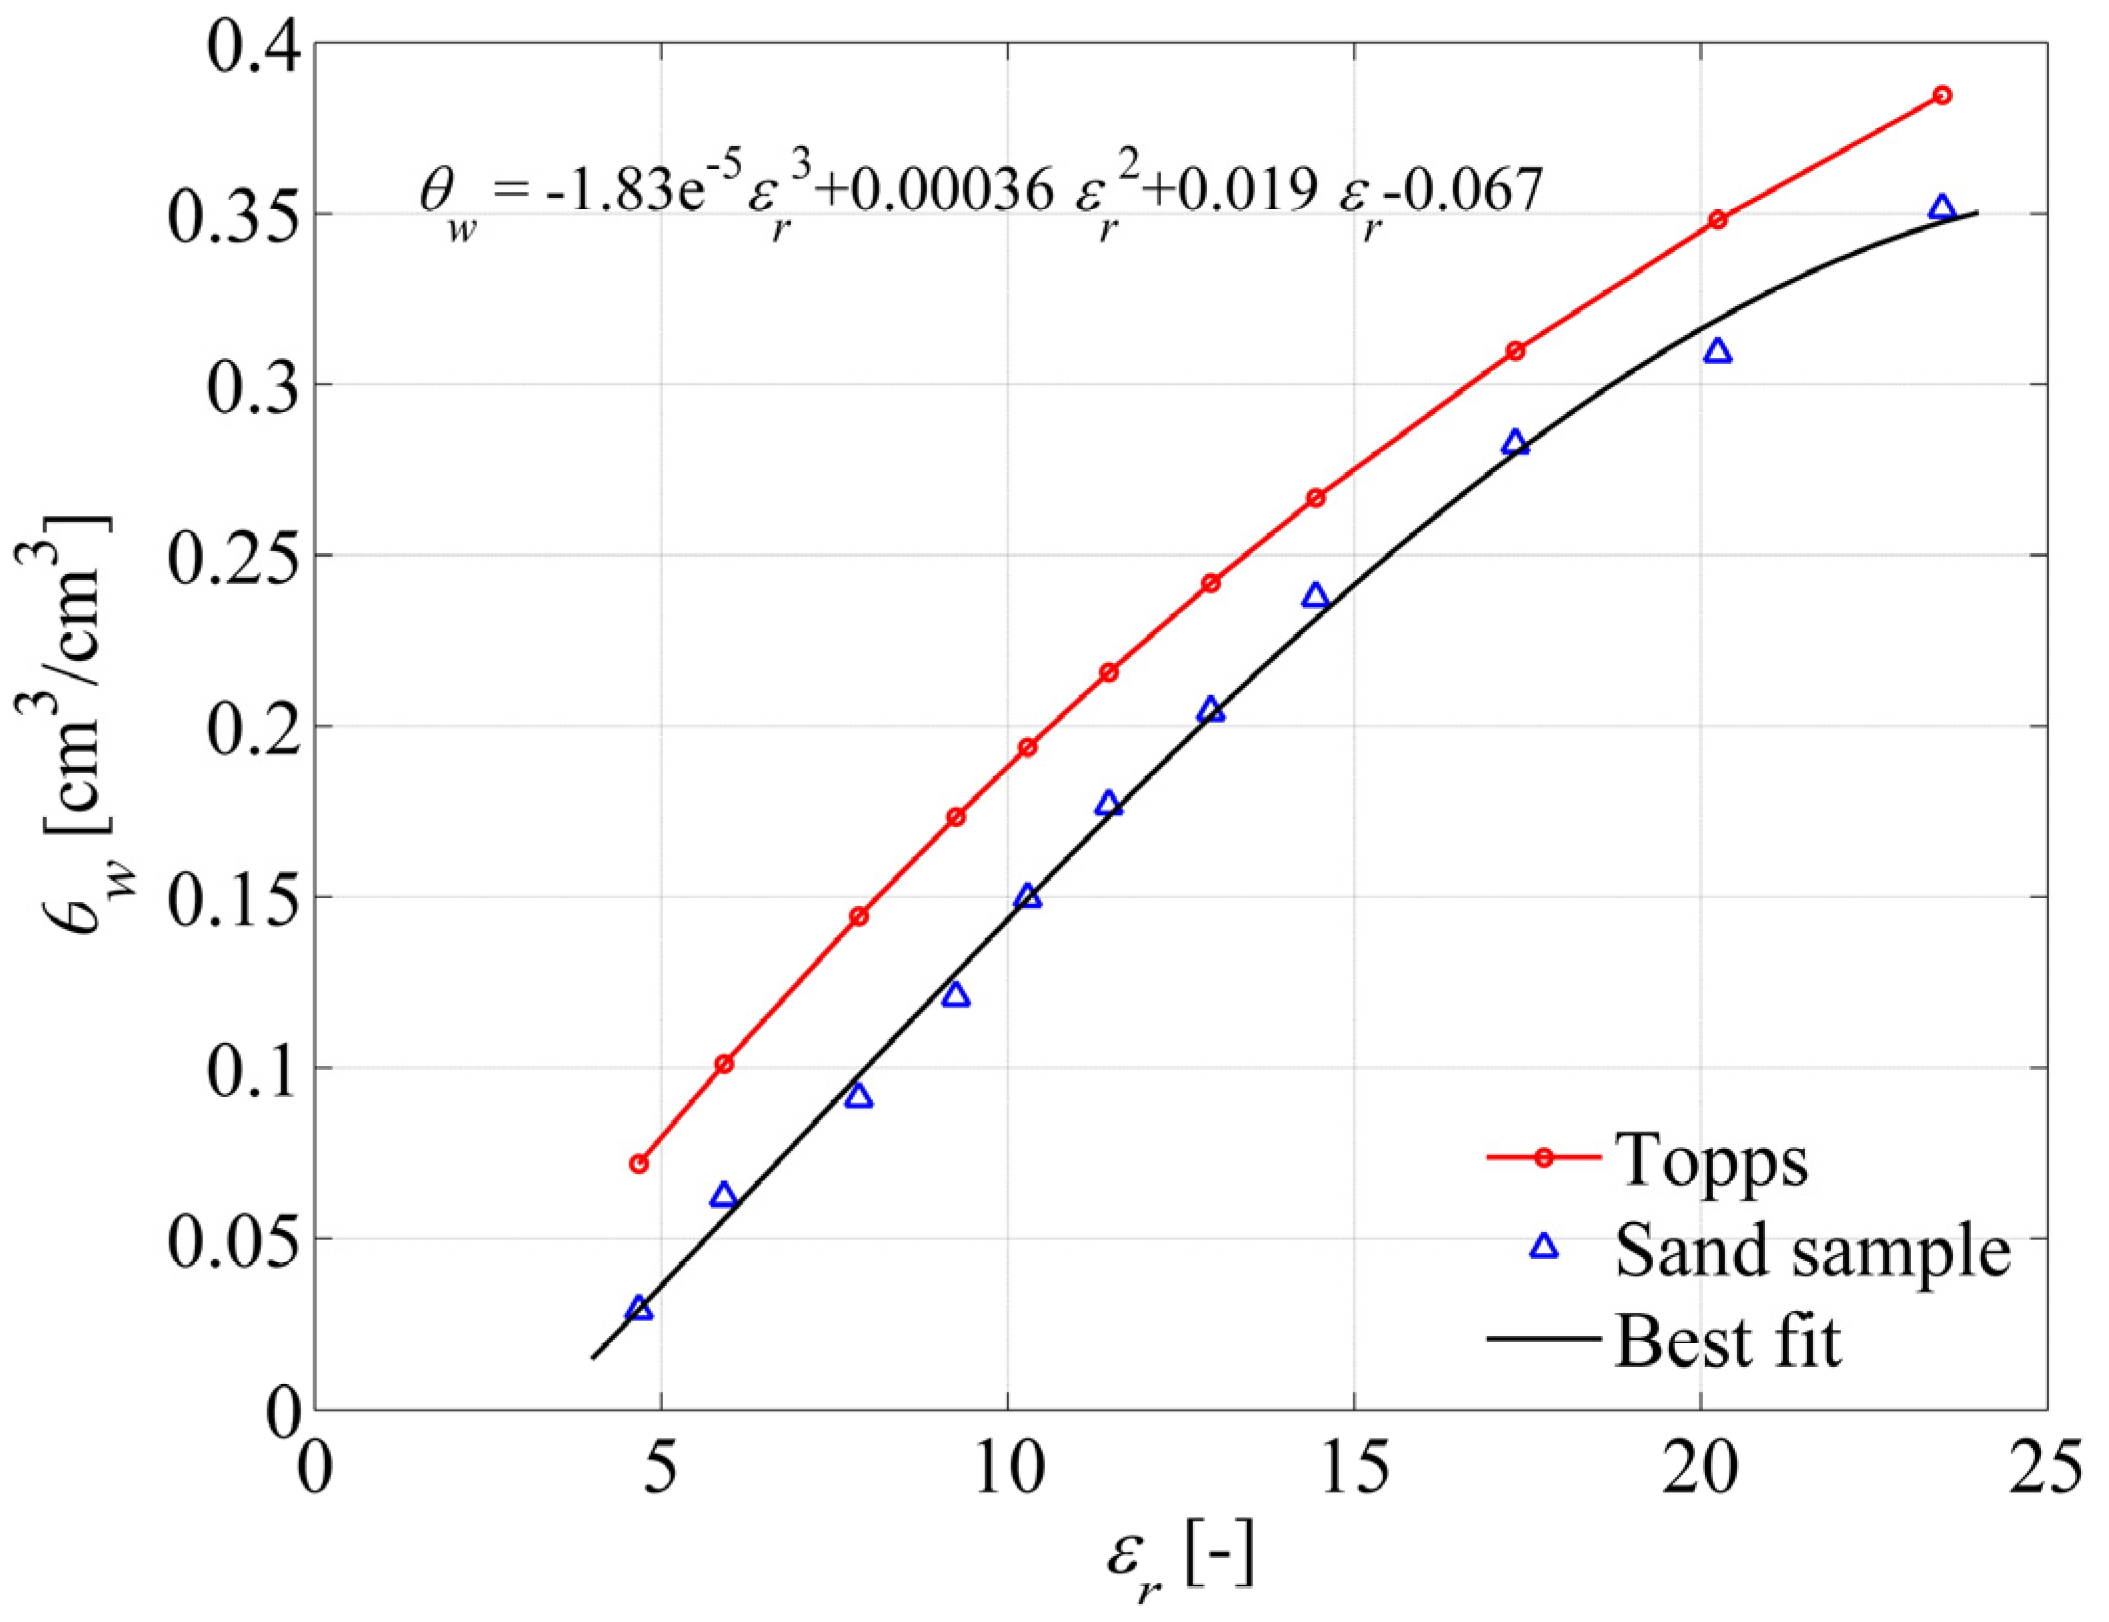
2.4. Calibration of Moisture Sensors

For monitoring the vertical profile of soil moisture content and temperature, 5TM soil moisture sensors were used, which are manufactured by Decagon Devices, Inc. (Pullman, WA, USA). These sensors measure the soil moisture content by measuring the permittivity of the soil, which is a strong function of water content, by using the Topps equation [28] given as below:
θw (m3/m3) = 4.3 × 10⁻⁶εr3 − 5.5 × 10⁻⁴εr2 + 2.92 × 10⁻²εr − 5.3 × 10⁻²
where θw is soil moisture content and εr is permittivity of soil. The natural variation in the characteristics of most soils causes the generic calibration for ECH2O soil moisture sensors to have an error of approximately ± 3%–4%. The error can be reduced to ± 1%–2% for all soils by using a soil specific calibration. Thus, the sensors were calibrated to obtain the best possible accuracy in volumetric water content measurements before using them in the experiment.
The procedure used to calibrate the sensors is: (1) a 1 kg of dune sand was collected from the excavated sand and was dried and cleaned to remove rocks and clods; (2) a container with a diameter of 19.2 cm and a 18.1 cm height was filled and packed with the dried sand; (3) the sensors were inserted vertically into the sand within the container; (4) each sensor was inserted three to four times into the packed sand to verify the readings and an average of all moisture content readings was recorded in case minor variability was observed; (5) a volume of the undisturbed soil was carefully removed using a metal ring with a diameter of 79 mm and height of 55 mm and was transferred to a foil pan which was weighed before and after transfer of the soil; (6) the dried sand was saturated in 10 episodes by adding 400 mL of water to each and then the sand was compacted with sensor readings taken in the same manner as the dried sand; (7) the sand samples were removed from the container after each episode and transferred to 10 separate foil pans, each weighed before and after filling; (8) a total of 11 pans, one dry and the others containing wet sand, were placed in an oven at a temperature of 110 °C and left to dry for 24 h; (9) after 24 h, the pans were removed from the oven and were weighed to determine the water content (θw) of the sand for each sample using Equation (2) for each sample; (10) after calculating the:
( θ w ) = ( w e i g h t   o f   p a n + s a n d + w a t e r ) ( w e i g h t   o f   p a n + d r y   s a n d ) ( w e i g h t   o f   p a n + d r y   s a n d ) ( w e i g h t   o f   p a n )
moisture content of the samples, a scatter plot was generated with the sensor data (permittivity (εr)) on the x-axis and the water content (moisture, (permittivity (εr)) on the y-axis, and (11) regression analysis was applied to a find best-fitting cubic polynomial between the parameters resulting in the best-fit curve shown in Figure 2.
Figure 2. Plot showing the relationship between permittivity (εr) and soil moisture content (θw).
Water 07 06669 g002
The red line in the plot represents the Topps equation [26] which the sensors use to calculate the soil moisture content and the black line is the best-fit of a cubic equation through the measurement points of the sand samples. The calibration function constructed by this plot was later applied on the raw sensor data that was collected during the experiment. A similar calibration procedure has been used successfully for geophysical measurements in the field to relate relative permittivity to soil water content [29,30].

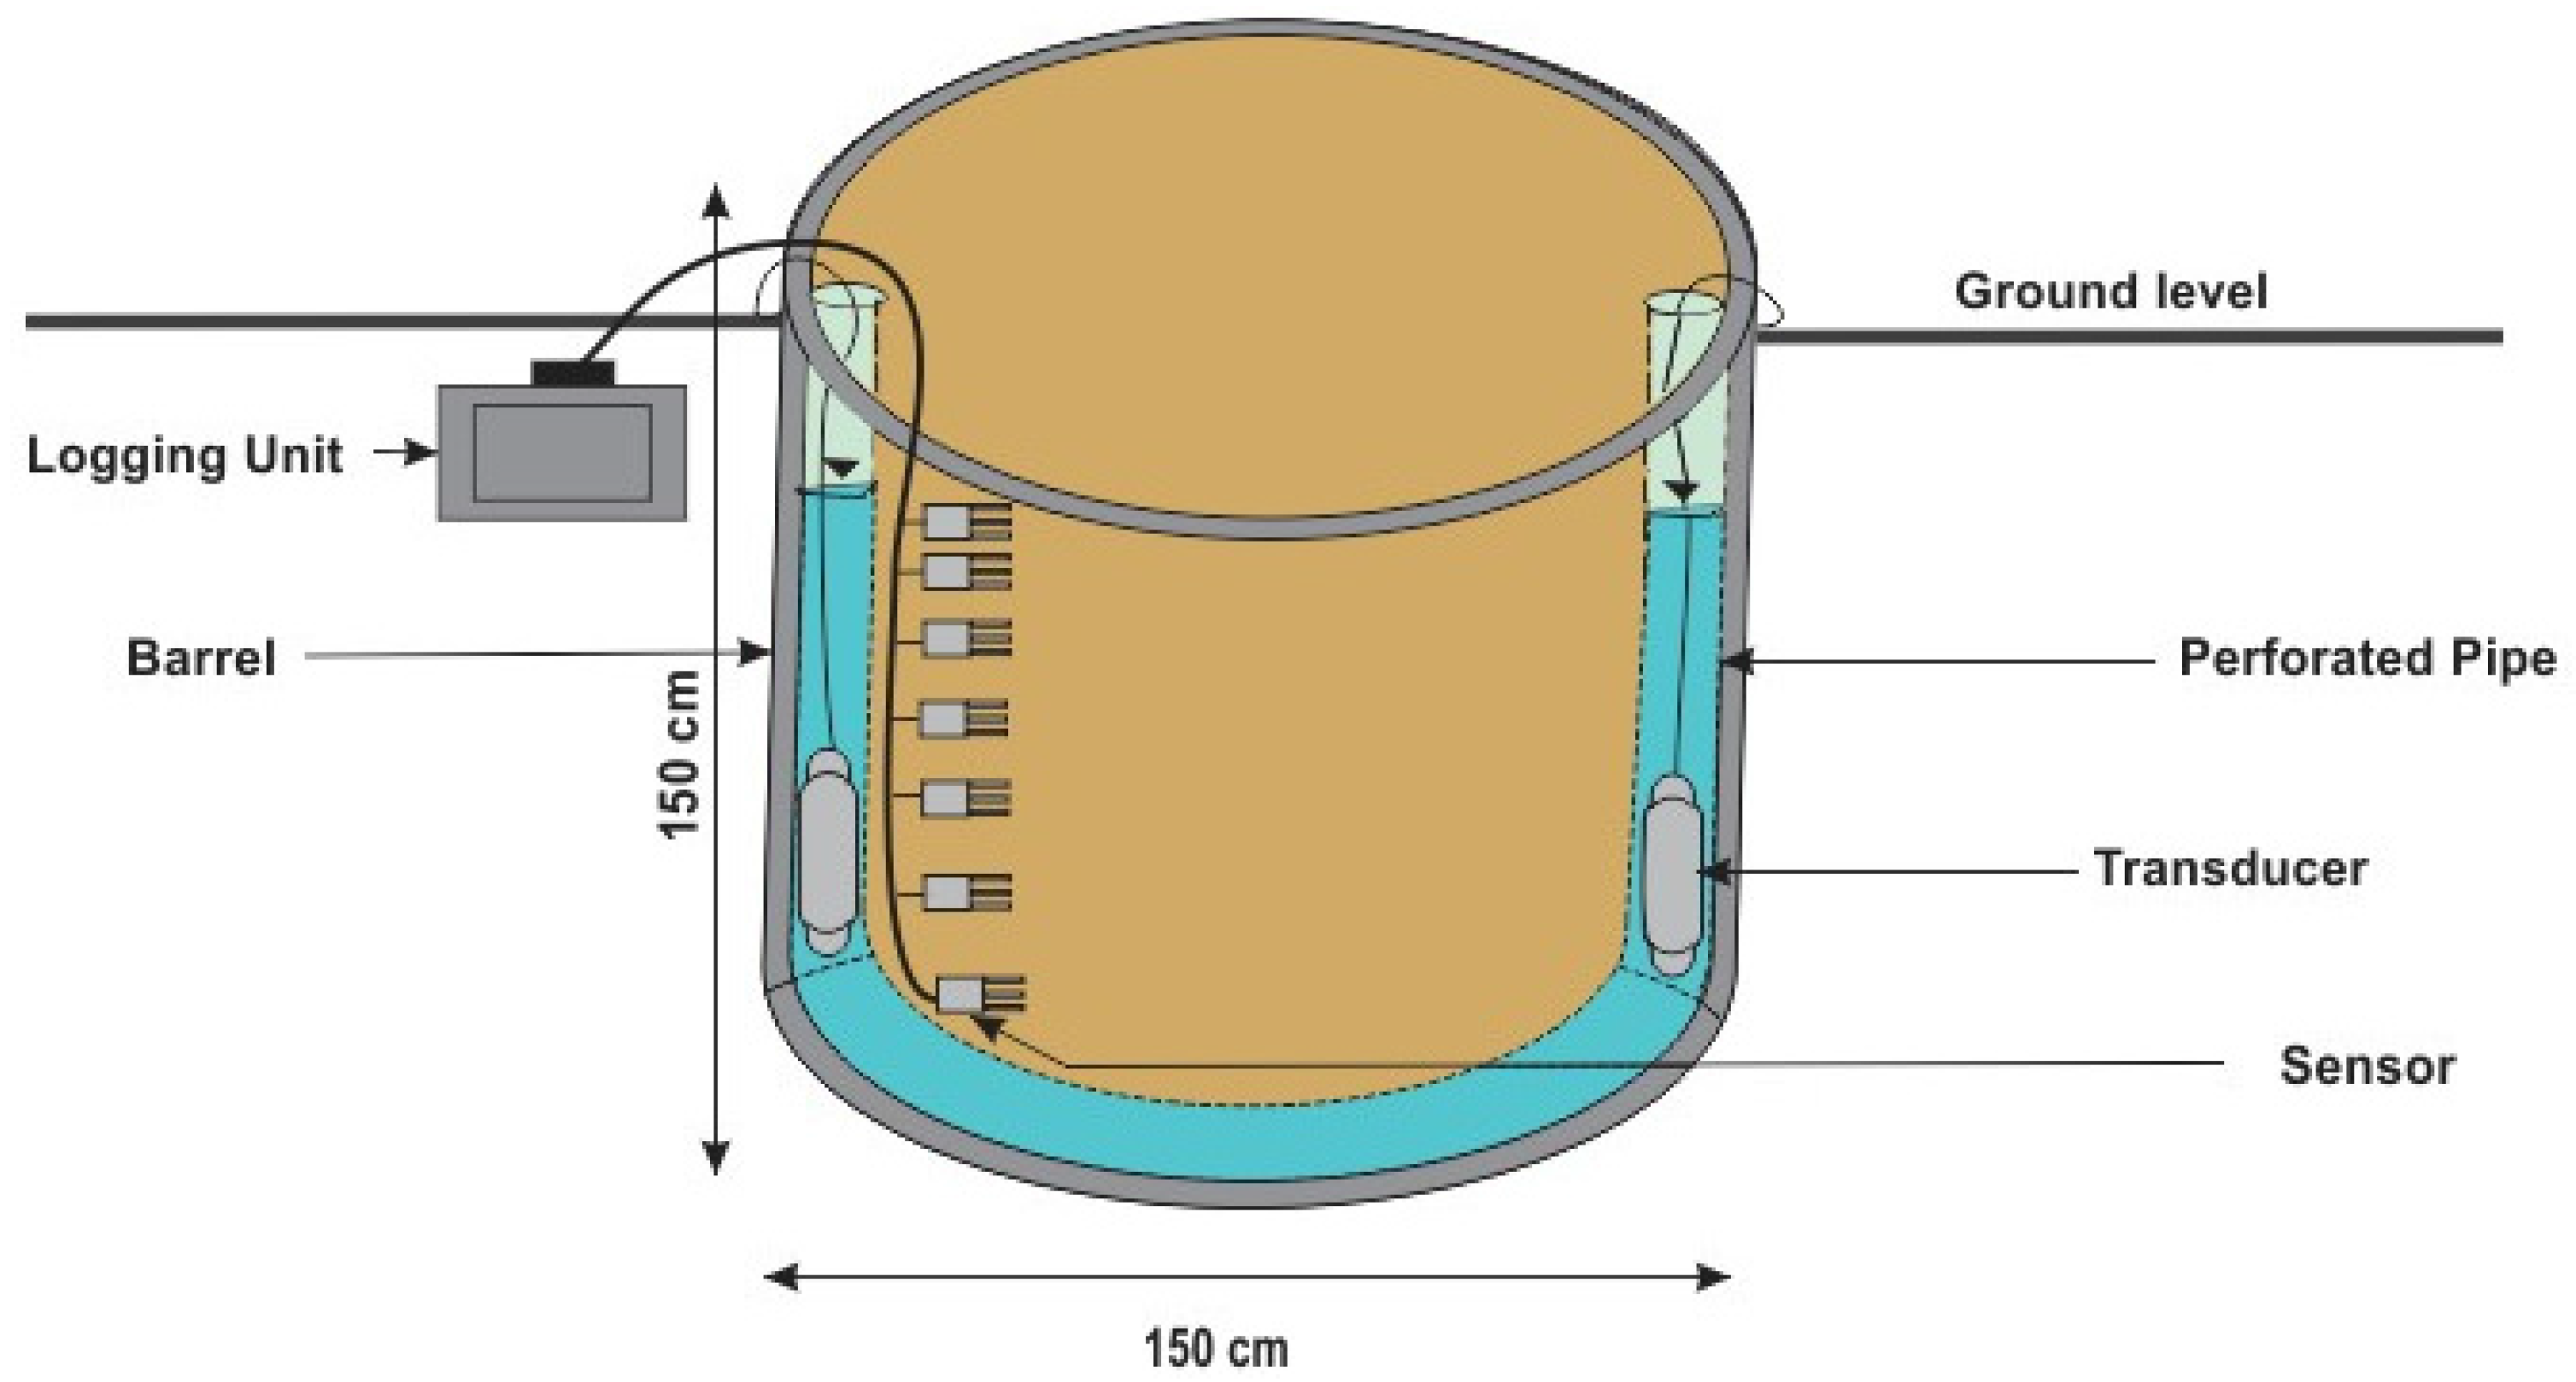
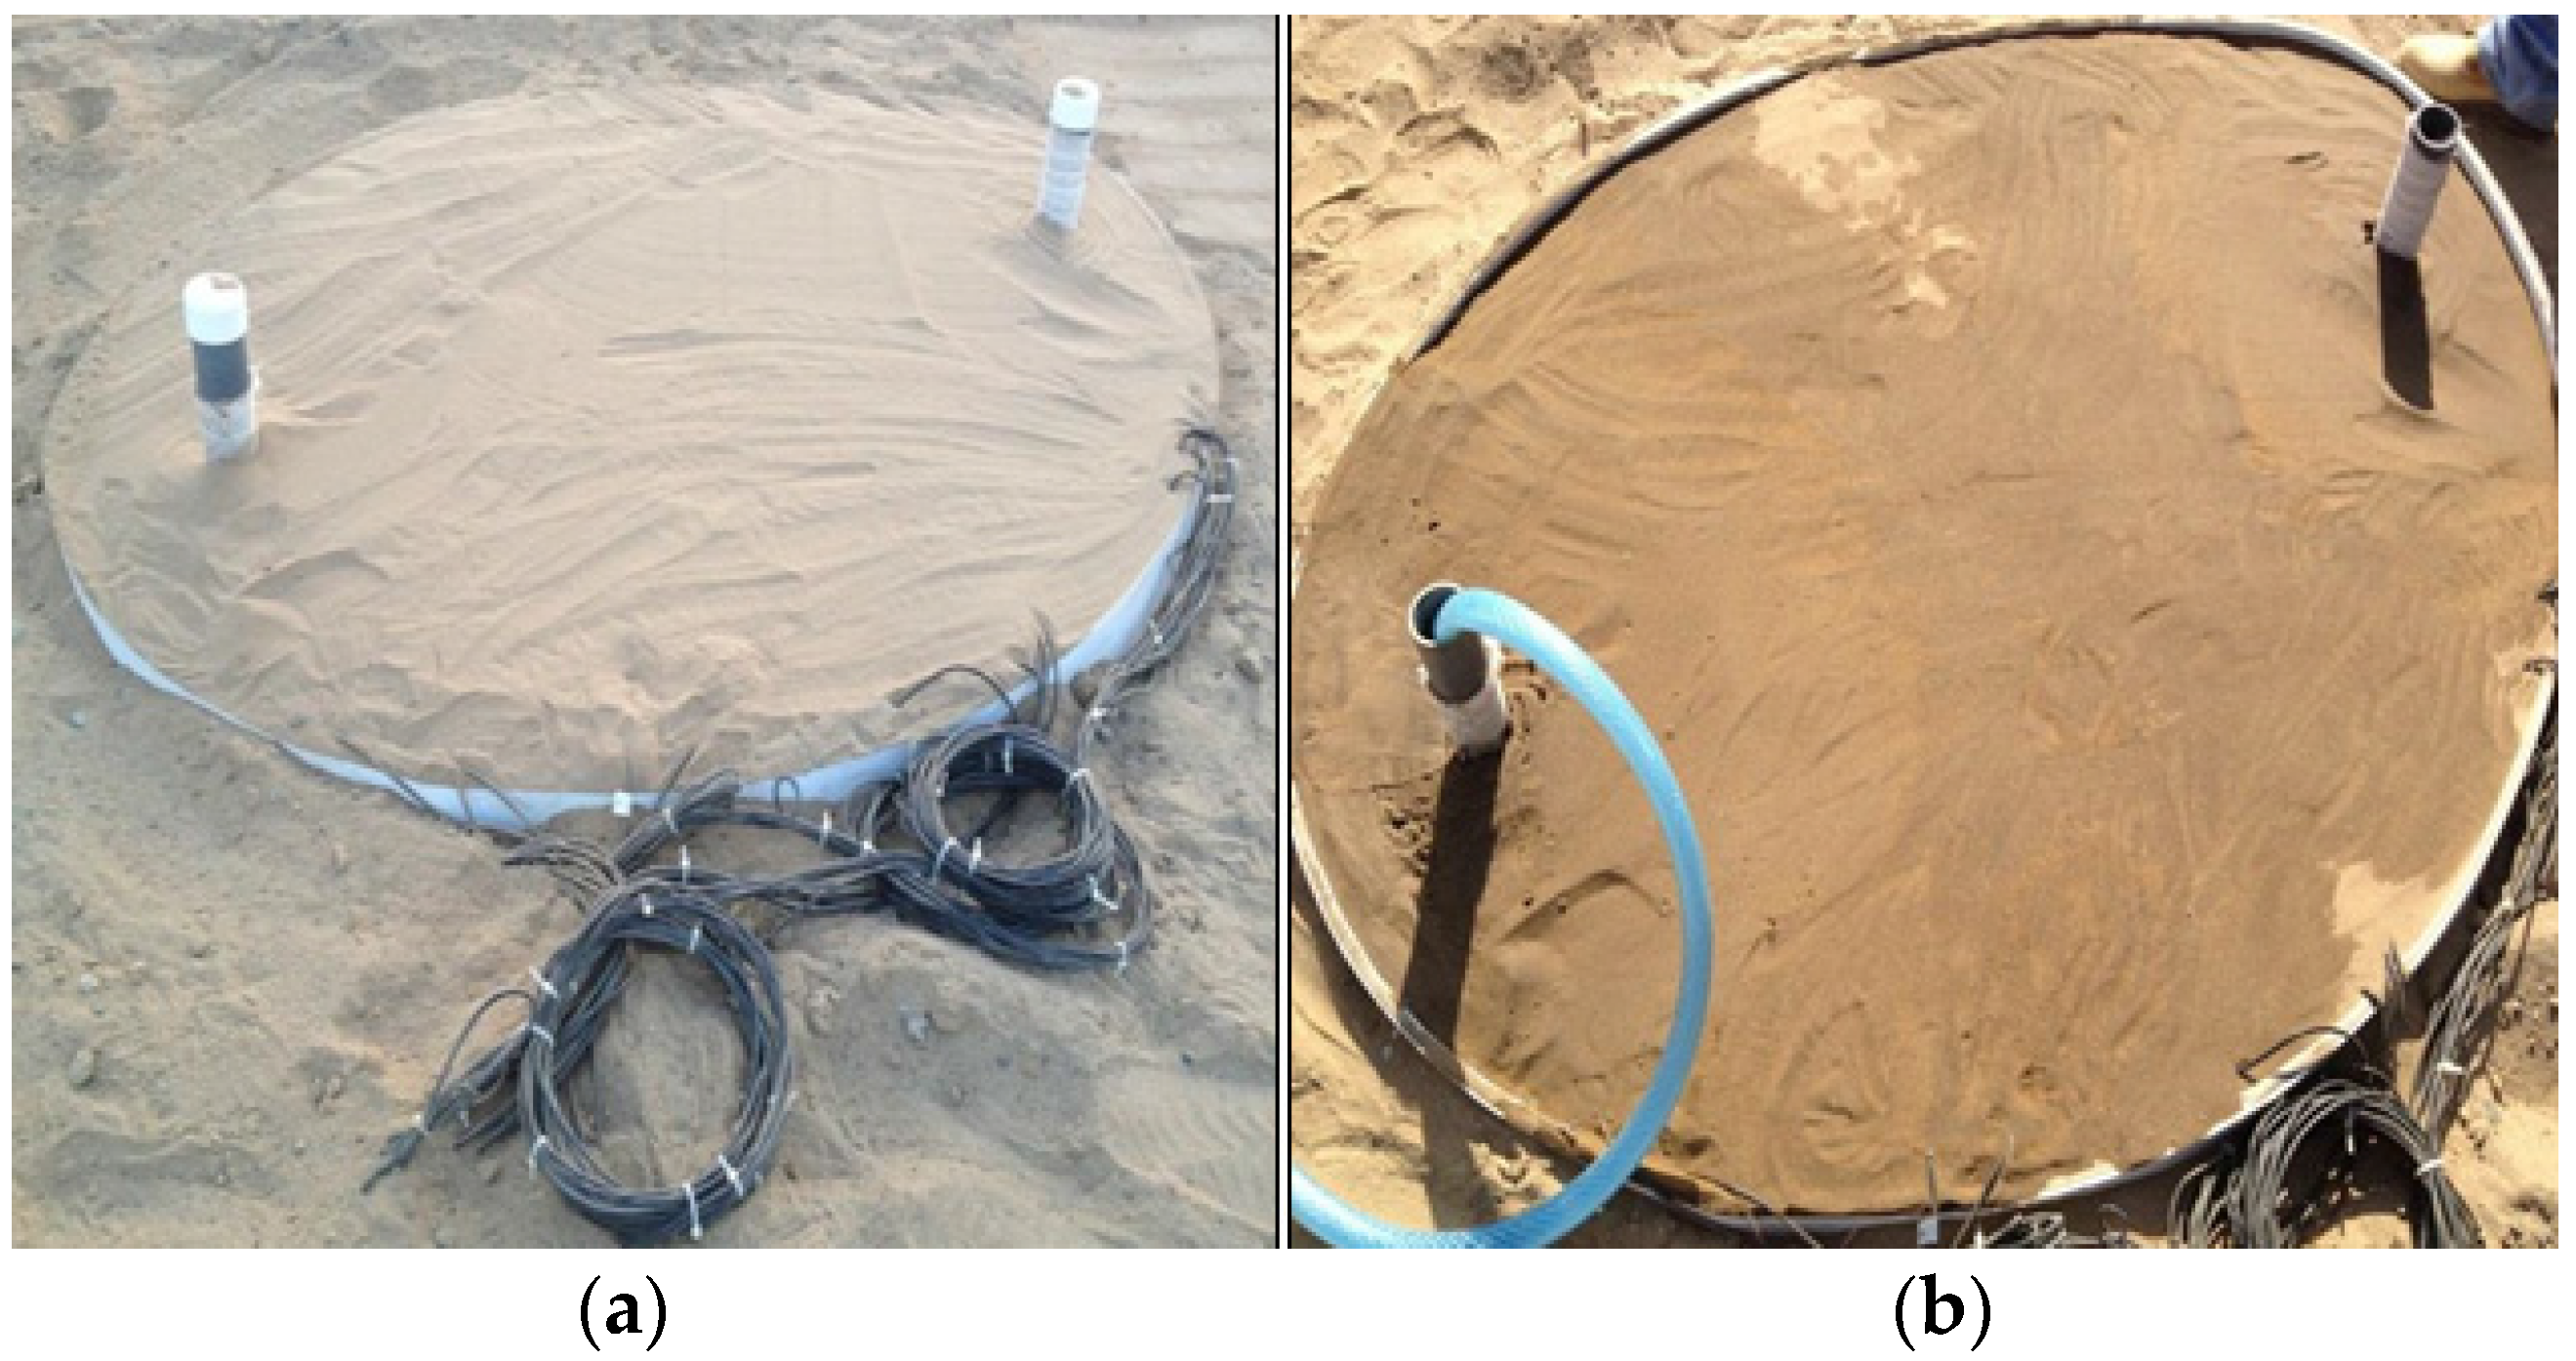
2.5. Experimental Design and Instrumentation

The experimental setup consisted of a plastic barrel with diameter 150 cm and height of 150 cm that was positioned under the ground level. Figure 3 shows the experimental arrangement and instrumentation in the field.
PVC pipes with a 5 cm diameter were perforated by drilling small holes in them and the pipes were then wrapped with a thin cotton fabric to restrict entry of small sand particles into the pipes and to avoid clogging. Two perforated vertical pipes were connected to each other by horizontal perforated pipes inside the barrel. They were fixed inside the barrel to allow saturation of the sand from bottom upwards to avoid trapping air bubbles and to accurately monitor the water level fluctuation.
Figure 3. Schematic diagram of the setup to monitor water level, temperature and soil moisture gradients.
Water 07 06669 g003
During the course of adding sand in the barrel, the already calibrated 5TM sensors were installed at different depths. Fourteen sensors were placed in the barrel at depths ranging from 3 to 100 cm. They were set to record data automatically, at a time step of five minutes, using three EM50 digital/analogue data loggers manufactured by Decagon Devices, Inc. Each logging unit has six ports, five to connect sensors and one port to transfer the data from the sensors to the computer.
A submersible pressure transducer was suspended inside the perforated pipes to monitor the varying water level during natural atmospheric conditions (evaporation, precipitation). The transducers used in the experiment were U20 titanium water level data logger manufactured by HOBO. The transducers were also set to record readings with a regular time step of five minutes.
The filled and buried barrel setup is shown in Figure 4 with the sand being dry in Figure 4a and saturated in Figure 4b. When the installation was completed, water was poured into the barrel through the vertical perforated pipes (bottom to top) to avoid the entrapment of air during saturation. The sand inside the barrel was wetted in several episodes until full saturation was reached and total volume of 0.928 m3 water was injected in the barrel. Soil moisture content and temperature were recorded throughout the filling process. Upon being satisfied that the sand was fully saturated with no significant trapped air in the barrel, the system was left to record evaporation loss from the sand.
Figure 4. The sand barrel before (a) and after (b) saturation.
Water 07 06669 g004

2.6. Hydrodynamic Modeling

A variety of different hydrodynamic modeling tools are readily available to simulate water fluxes in the vadose zone, as compared in Scanlon et al. [31]. Hydrodynamic models mainly vary with regard to inclusion of vapor and heat fluxes as well as the internal coupling approaches of these fluxes. In arid and semi-arid regions, the vapor movement is often an important part of the total water flux when the soil moisture becomes relatively low in the topsoil. In this study, we choose to apply the hydrological simulator HYDRUS-1D because of its robust numerical scheme and short calculation times [31]. The hydrological simulator HYDRUS 1-D simulates non-isothermal water and vapor flow as described by Saito et al. [32]:
θ ( h ) t = z [ ( K l h + K v h )   h z + K l h + ( K L T + K v T ) T z ] S ( h )
In Equation (3), h is the time and depth dependent pressure head (cm), t is the time (s), θ is the total volumetric water content, being the sum (θ = θv + θl) of the volumetric water vapor content, θv, and the volumetric liquid water content, θl (both expressed as an equivalent water content), θ(h) is the water content as a function of pressure head (cm3·cm−3), T is temperature (K), Klh is isothermal hydraulic conductivity for the liquid phase (cm·s−1), KLT is thermal hydraulic conductivity for the liquid phase (cm·K−1·s−1), Kvh is isothermal vapor hydraulic conductivity (cm·s−1), z is the depth positive downward in cm, and S is a sink term usually used to account for root water uptake (s−1).
The classical Mualem-van Genuchten (MVG) model was used to describe the water retention and isothermal unsaturated hydraulic conductivity functions of the subsurface system [33,34]. The water retention is given by:
θ l ( h ) = θ r + ( θ s + θ r ) [ 1 + | α h | n ] m
where θr and θs are the residual and saturated water contents (cm3·cm−3), respectively, α (cm−1) and n (–) are shape parameters which are inversely related to the air entry value and the width of the pore size distribution, respectively, and m is defined as m = 1−1/n with n > 1 [28]. The isothermal unsaturated hydraulic conductivity is given by:
K l h ( h ) = K s ( θ θ r θ s θ r ) λ [ 1 ( 1 ( θ θ r θ s θ r ) 1 m ) m ] 2
where Ks is the saturated hydraulic conductivity (cm·h−1), λ (−) represents pore tortuosity, and r determines the shape of the hydraulic conductivity function. θr is the residual water content. It is used as an empirical parameter which is either given the value of zero or the value which best fits the water retention data or it can be derived from soil texture using the pedo-transfer function. θs can be obtained by fully saturating the sand sample and then drying the sample in an oven for 24 h at 110 °C. The value of λ generally used is 0.5 or it can be estimated from bulk density and hydraulic conductivity with which it is highly correlated [35]. Values of α and n were obtained from the Rosetta database and are 0.145 and 2.18, respectively [Rosetta].
The thermal hydraulic conductivity function, KLT, in Equation (3) is defined as follows [36]:
K L T = K L h ( h G w T 1 γ 0 d γ d T )
where GwT is the grain factor (unitless), which quantifies the temperature dependence of the soil water retention curve [37], γ is the surface tension of soil water (J·m−2), and γ 0 is the surface tension at 25 °C (= 71.89 g·s−2). The temperature dependence of γ is given by:
γ = 75.6 0.1425 T 2.38 × 10 4 T 2
where γ is in g·s−2 and T in °C. The isothermal, Kvh and thermal, KvT, vapor hydraulic conductivities are described by Nassar and Horton [38].
Equation (3) is solved numerically using the hydrological simulator HYDRUS-1D [32]. The depth of the domain was fixed to z = 150 cm, the size of the barrel, and the vertical profile was discretized into 150 equally sized elements (dz = 1 cm). The time step for the top boundary condition (evaporation) was fixed to one hour, whereas the lower boundary condition was fixed to zero water flux. The top boundary condition for temperature was assumed to be equal to the air temperature and lower boundary temperature was fixed at 35 °C.

3. Results

3.1. Physical Properties of the Media

The grain size data from the five randomly selected samples showed rather uniform properties. The sediment is very well sorted and lies within the very fine sand classification of the Wentworth scale [39].
Laboratory porosity measurements also showed some degree of variation with the full range of the samples being 0.33–0.41 (Table 1). The average value was about 0.38. This is comparative to the large number of measurements made on samples from the same dune field by Lopez et al. [15]. They found a mean value of 0.39 ± 0.02 for 50 samples. However, a large number of additional samples were measured during moisture calibration with the average being 0.35. This value was consistent with the volume of water placed into the cylinder.
Table 1. Soil porosity and hydraulic conductivity data.
ParameterSample 1Sample 2Sample 3Sample 4Sample 5
Porosity0.41-0.33-0.40
Hydraulic Conductivity (m/day)6.483.30 (?)6.757.577.54
The measured hydraulic conductivity values ranged from 6.48 to 7.54 m/day. A small value of 3.30 m/d was measured which is considered to be an anomaly. The range in hydraulic conductivity occurring across the dunes at the site where the sample was collected ranges from 5 to 11 m/day [15].

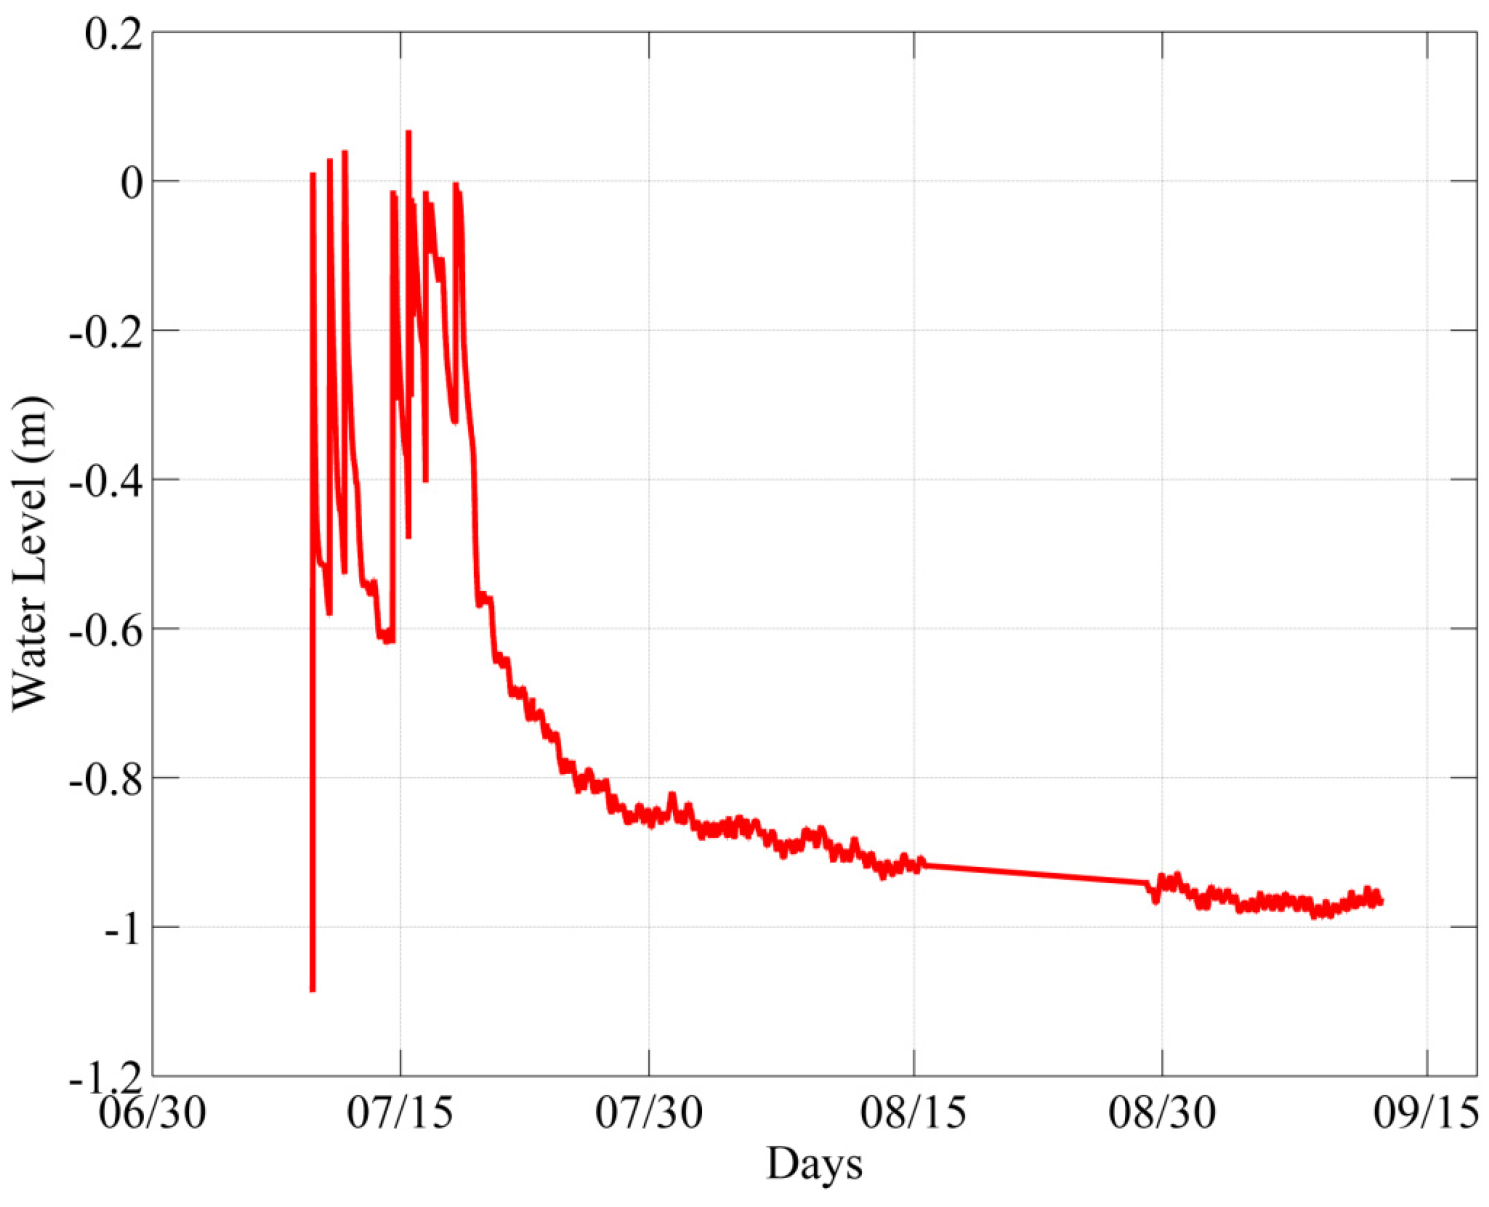
3.2. Water Level Profile

The fluctuation of the water level inside the barrel was monitored by the transducers installed in the perforated pipes as shown in Figure 5.
Figure 5. Water level fluctuations monitored with a time step of 15 min.
Water 07 06669 g005
In response to the first wetting episode, a rapid increase in the water level was recorded by the transducers. The abrupt rise in water level was followed by a decline as the water added through the perforated pipe filled the pipes quickly and then took time for imbibition in sand and to become fully stabilized. The seven prominent peaks ranging from 0 to −0.61 m (Figure 5), observed in the initial days of the experiment, were caused by the continuous wetting-infiltration cycles in the sand. After several wetting-infiltration episodes, the range of water level fluctuation shows a decrease, as the sand was gradually being saturated. After saturation, the sand was exposed to natural conditions (evaporation, infiltration) for a few days. This helped to stabilize the water level in the pipe and the barrel due to the slow imbibition of water in the sand. Consequently, a gradual decline can be noticed which lasted for almost 10 days (from 20 to 30 July) as evident in Figure 5. After declining for 35 more days, the gradient eventually stabilized at approximately 0.97 m and then remained at this depth for the duration of the experiment. Thus, this depth can be established as the extinction depth of dune sand. The data gap between August 15 and 20 can be interpolated using the average gradient during this period based on the trend.

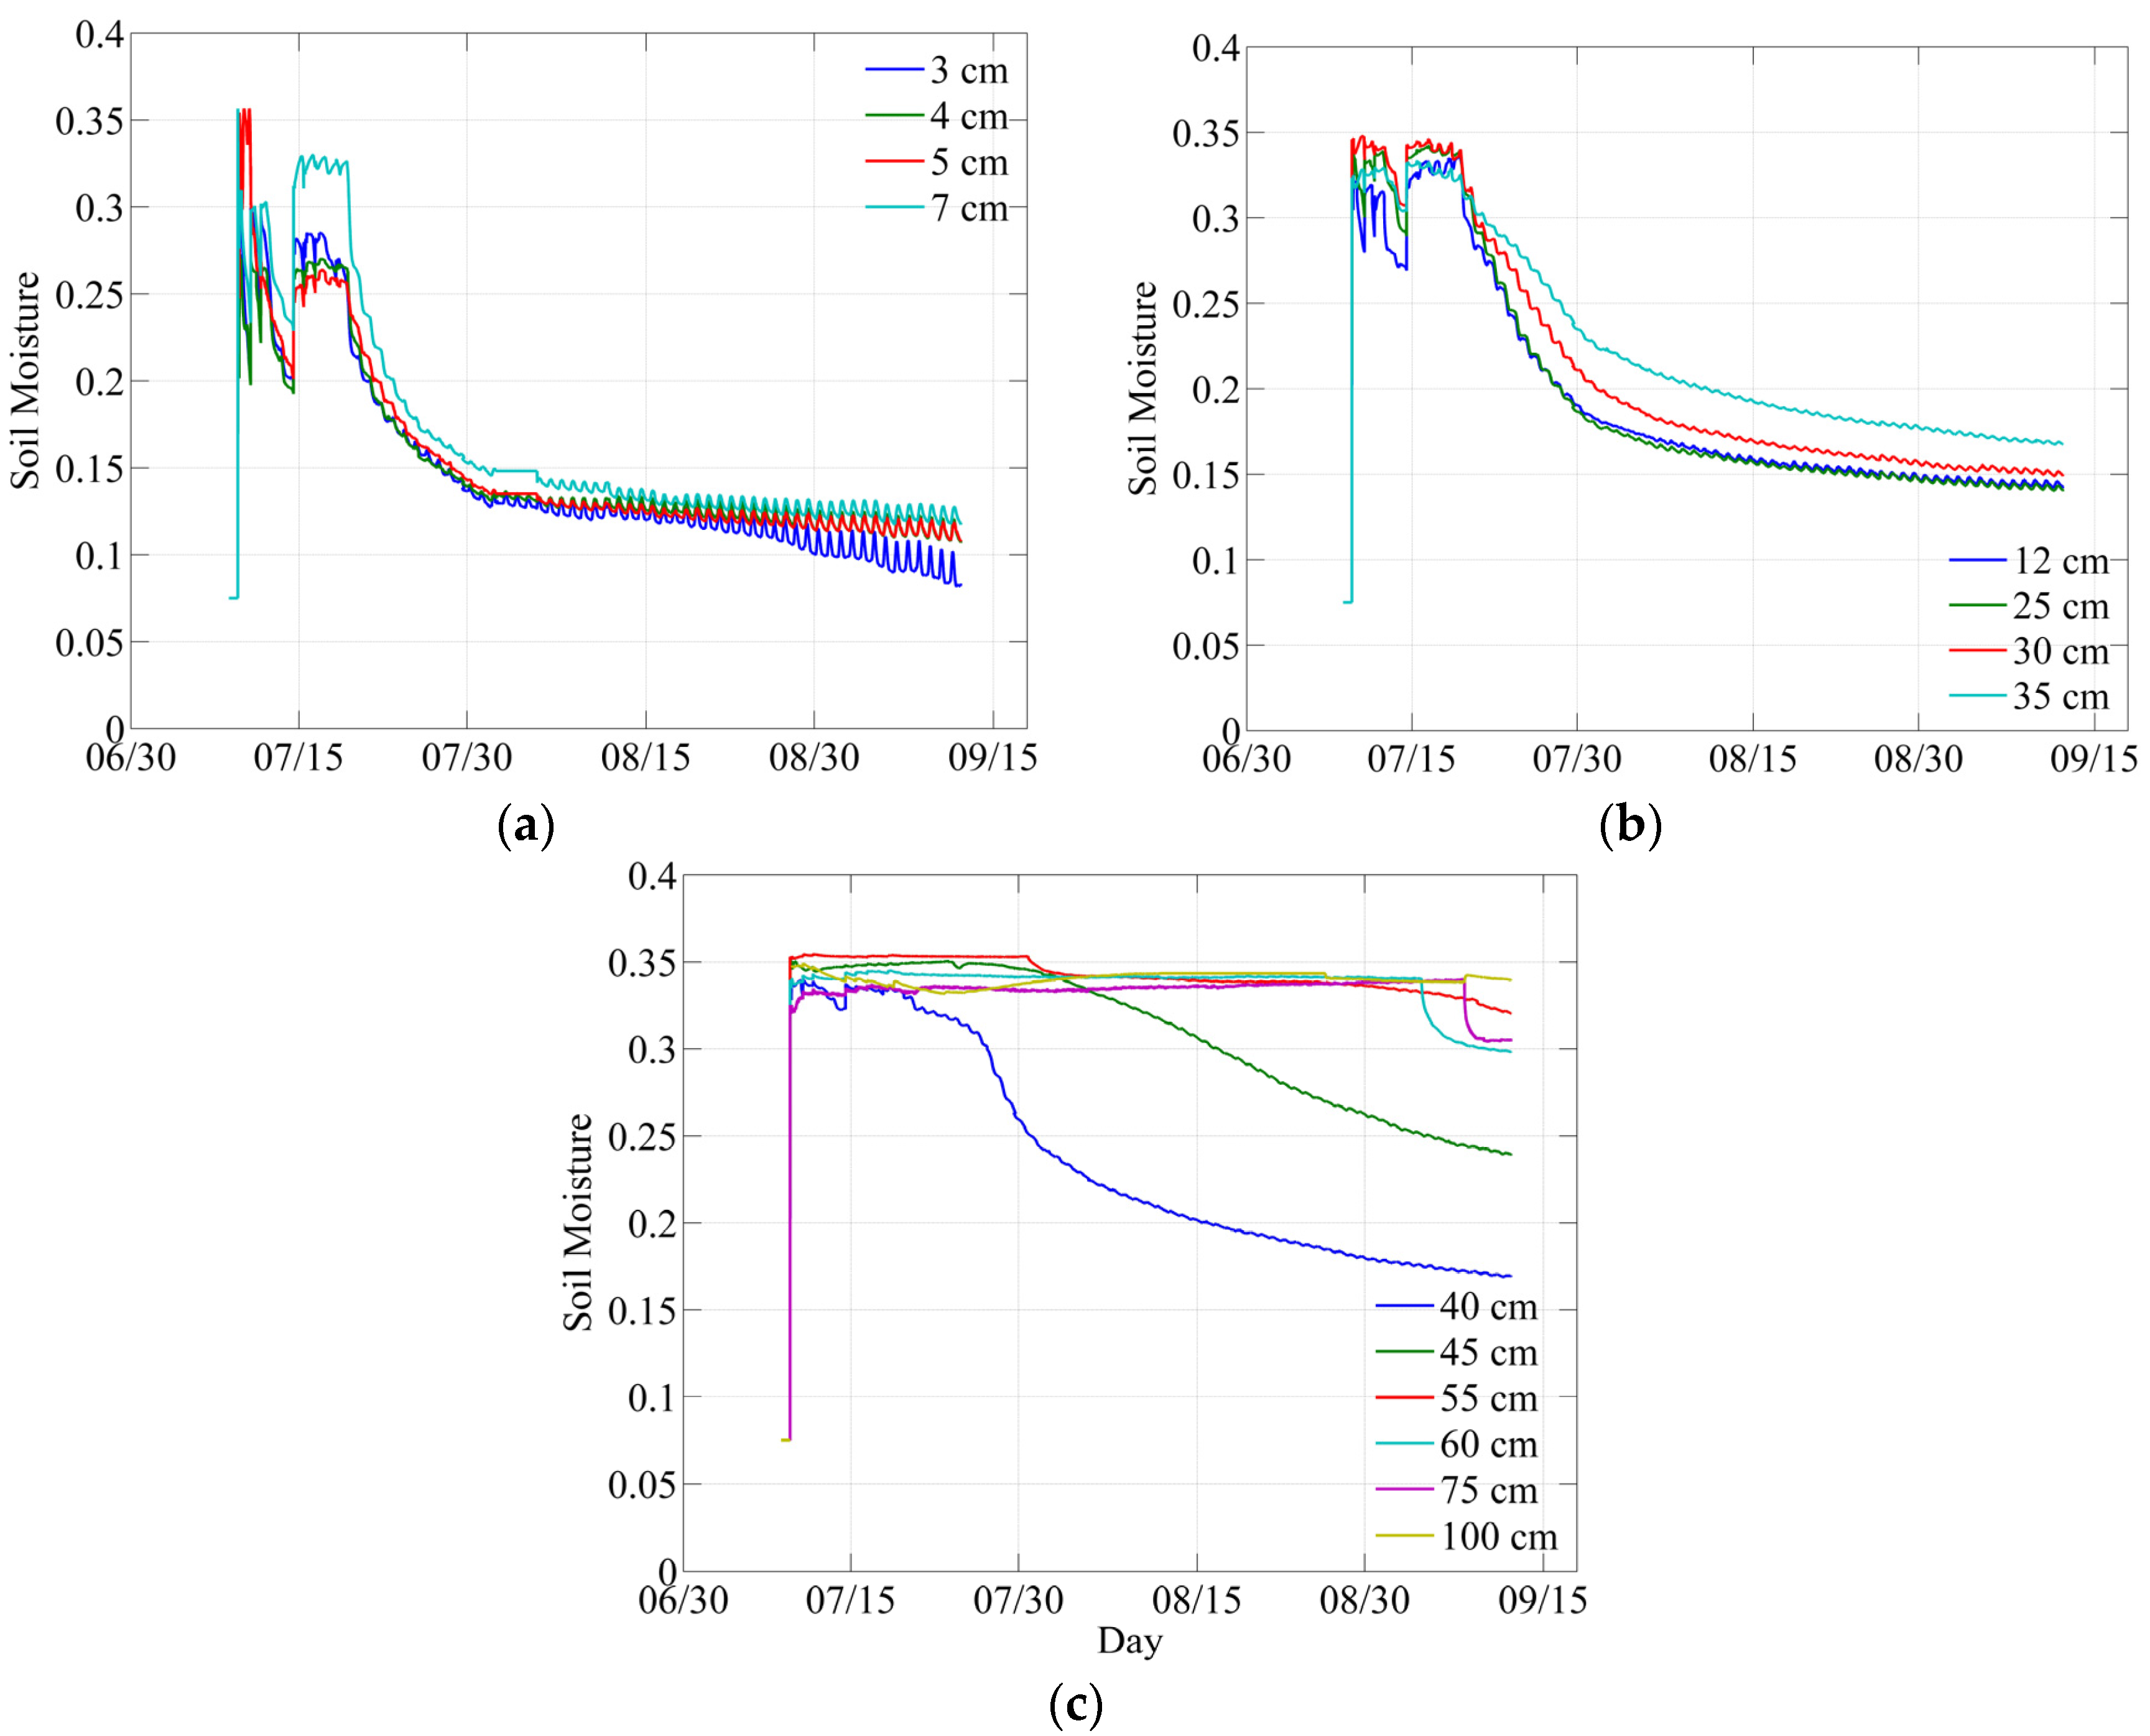
3.3. Soil Moisture Content Profile

Figure 6a–c shows the changes in soil moisture content recorded by 5TM sensors installed at various depths in the barrel. Figure 6a,b depict the instantaneous rise in soil moisture content due to the first sand wetting session. The initial high range in fluctuations of the soil moisture content were caused by the simultaneous wetting–infiltration cycles of the sand. The soil moisture content shows a negative gradient for 20 days, when the barrel was left under natural conditions (evaporation). The gradient then shows a gentle decline through 30 more days. Figure 6c depicts the soil moisture variation recorded by the deepest sensors installed in the barrel which document a decline of soil moisture content first at a depth of 40 cm, followed by the declines at 45 and 50 cm. The sensors installed deeper than 45 cm show slight declines and steadiness of the soil moisture content trend compared to the sensors that were installed at shallow depths (Figure 6c). The symmetric diurnal fluctuations are evident in the shallow profiles, which can be seen more prominently in the upper 25 cm.
Figure 6. Soil moisture content variations recorded by sensors (a) from 3 to 7 cm of depth; (b) 12 to 35 cm of depth; and (c) from 40 to 100 cm of depth.
Water 07 06669 g006

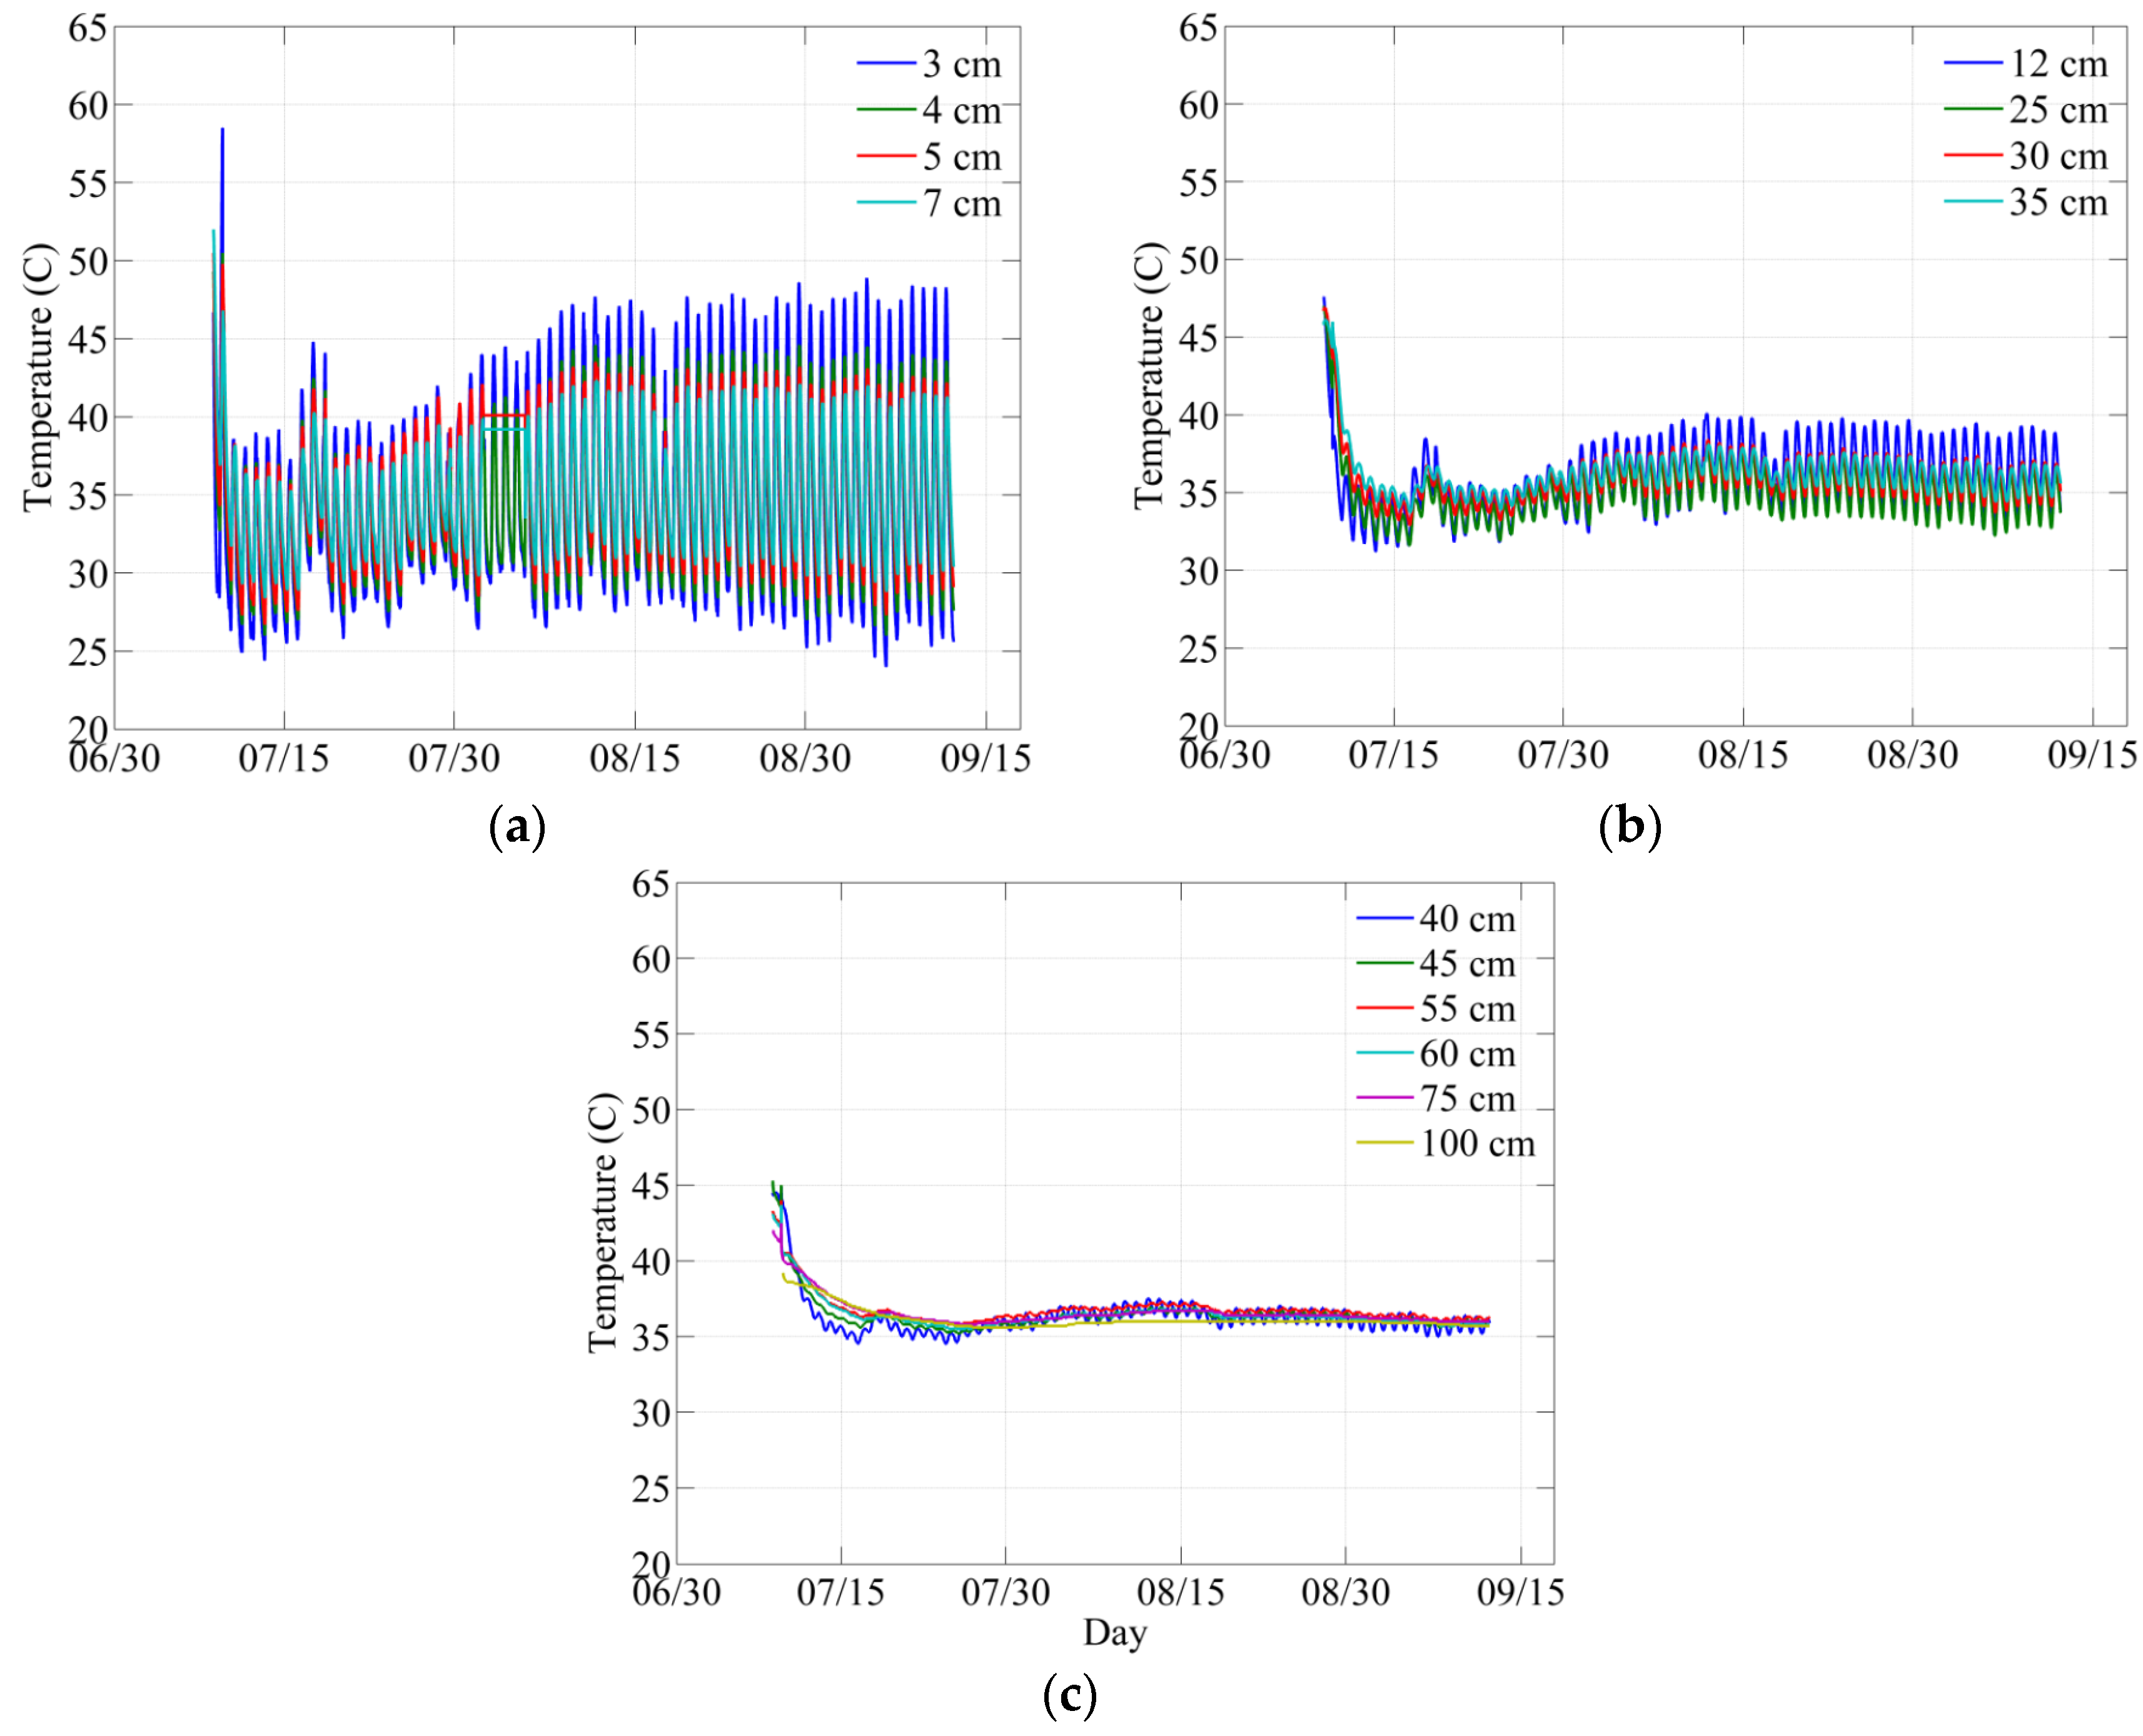
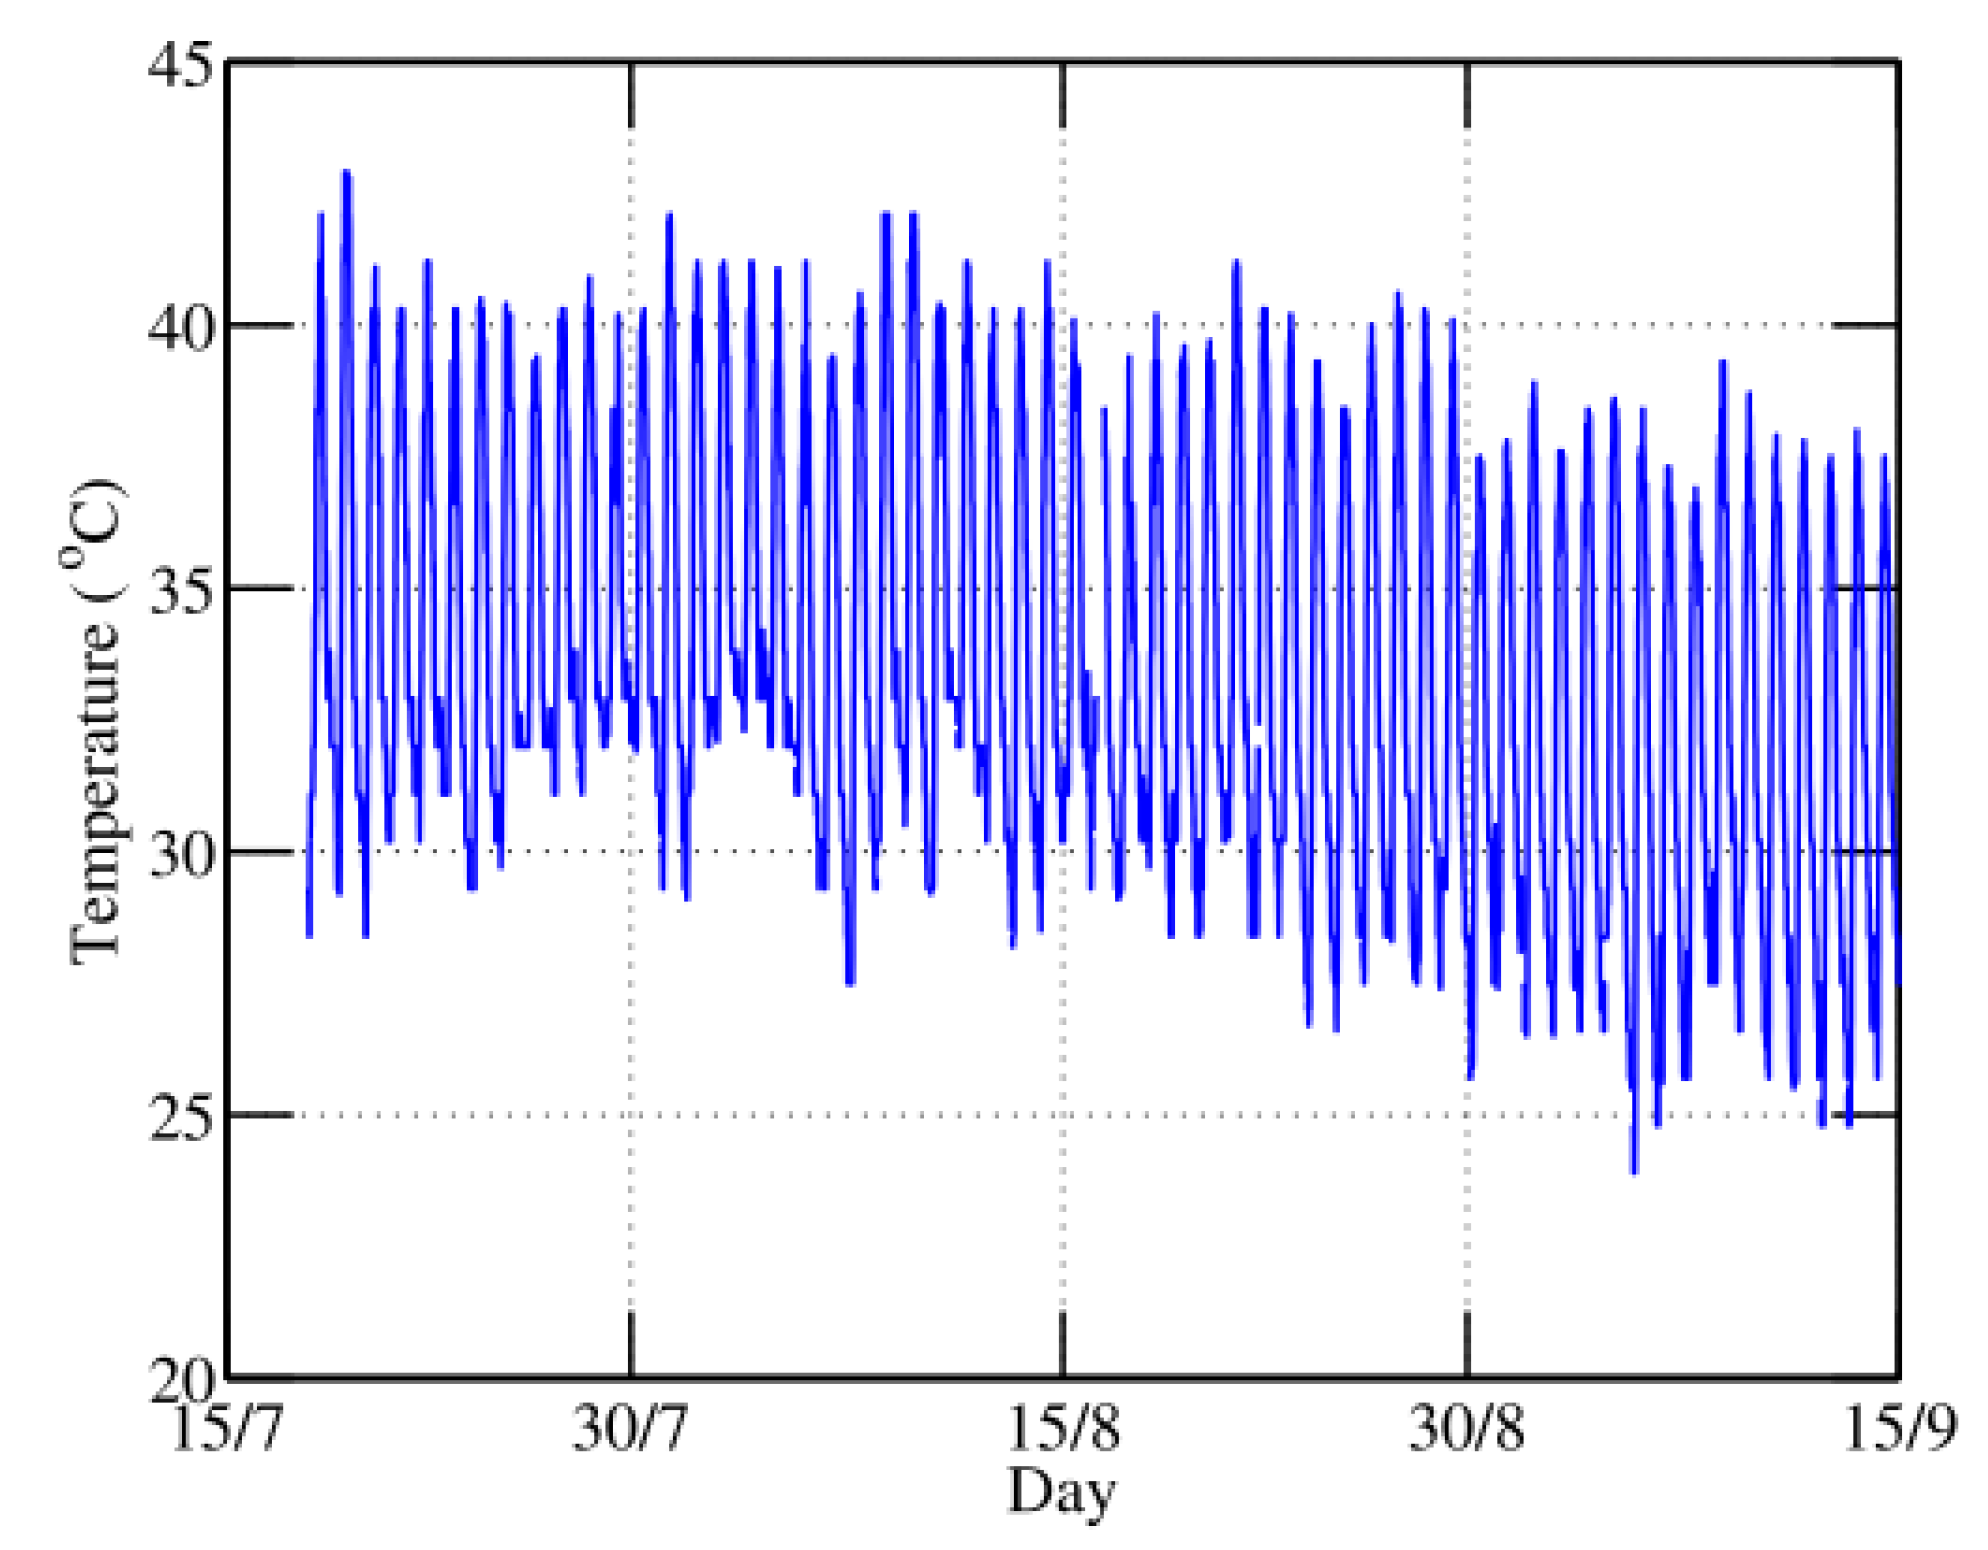
3.4. Temperature Profile

The temperature profiles were recorded using the Decagon sensors installed at depths ranging from 3 to 100 cm in the barrel (Figure 7). At the start of the experiment, the sand temperature was high as the sand was dry and hot. When the sand was wetted, a decline in the temperature was observed. An average diurnal temperature fluctuation of 10–20 °C occurred in the upper 10 cm (Figure 7a). The diurnal temperature fluctuations declined in magnitude with depth in the soil profile and between 12 and 35 cm depth the diurnal variation is the range of 3–7 °C (Figure 7b). A temperature of over 35 °C persisted throughout the profile of the dune sand event to a depth of 100 cm (Figure 7c).
Figure 7. Temperature fluctuations recorded by the sensors (a) from depths of 3–7 cm; (b) from depths of 12–35 cm; and (c) from depths of 40–100 cm.
Water 07 06669 g007

3.5. Hydrodynamic Modeling Results

Like any hydrological simulator, HYDRUS-1D requires top and initial boundary conditions. In this study, natural conditions (precipitation and evaporation) were considered as the boundary condition at the top. Meteorological variables were recorded at a weather station located near the site. No precipitation occurred during the period of the field experiment. The air temperature recorded during the evaporation period is shown in Figure 8. The maximum and minimum air temperatures were 43 and 24 °C, respectively.
The FAO-56 Penman-Monteith equation was used to determine the potential evaporation following a similar previous study [16]. The hourly potential evaporation “Ep” was estimated using the FAO-56 method as described by Allen et al. [40] (Figure 9). The method used first calculated the potential evaporation from a grass ground-cover reference Er using the modified Penman-Monteith equation [40]. Hourly average values of various meteorological variables, including air temperature, relative humidity, wind speed, incoming shortwave radiation, and barometric pressure, were input into the model. Then, the reference evapotranspiration is scaled with an empirical coefficient which is Ep = 1.15Er [34]. This coefficient defines the higher rate of diffusive evaporation potential of bare soil as compared to the reference grass cover [41].
Figure 8. Air temperature recorded during experiment.
Water 07 06669 g008
Figure 9. Estimated potential evaporation during the field experiment.
Water 07 06669 g009
In practical applications, the depth-dependent initial conditions in the hydrodynamic model are poorly known, or not at all. The initial condition used in numerical simulation with respect to the soil water content is shown in Figure 10.
Figure 10. Soil moisture content recorded in the sand column at the beginning of the experiment.
Water 07 06669 g010
It is derived from the depth-dependent water content measured by the sensors exactly after the last imbibition. The sensors showed almost full saturation below a depth of 7 cm, and the value of fully saturated sand was considered to be 0.35 (cm3·cm−3) obtained from the laboratory experiment. The sand in the top 7 cm was not completely saturated because water was added from the perforated pipes from the bottom upwards (to avoid air entrapment). Furthermore, the water added from the bottom via the perforated pipes needed more time to get imbibed in the sand to have a stable level near the surface.

3.6. Comparison of Sensor and MVG Model Results

The soil moisture content was calculated with a HYDRUS-1D simulation (Figure 11). The figure shows the soil water content profile follows the same trend as observed in the sensor data (Figure 6). The water content of the soil is lowest at 5 cm. The trends from depths 7–45 cm show increasing saturation and thus increasing moisture content until the 100 cm depth is reached where the soil moisture is highest at complete saturation (0.35).
Figure 11. Soil moisture content profile obtained by hydrodynamic simulation.
Water 07 06669 g011
The diurnal variation of soil water content can be observed in the top 5–12 cm depth. The soil moisture content data obtained from the sensors at seven depths were plotted against the water content obtained from the Mualem van-Genuchten (MVG) model by using HYDRUS 1-D at these depths (Figure 12).
Figure 12. Soil water content θw measured by sensors versus soil water content obtained by hydrodynamic modeling at shallow (a) and greater (b) depths. Blue line represents 1:1 line and red is the best linear fit.
Water 07 06669 g012
It is observed the water content obtained from the MVG model overestimated the sensor derived measurements in the top 12 cm depth (Figure 12a), whereas, at greater depths, the MVG estimated water content was overestimated (Figure 12b). The data points are somewhat scattered and yield an r2 value of 0.84 and 0.71, for shallow and greater depths, respectively. Comparing model results with the measured data shows a model overestimation at depths of 25–45 cm and an underestimation from 5 to 12 cm. Detailed comparisons of the sensor and model estimations are shown in Figure 12a,b.

4. Discussion

The field experiment and HYDRUS 1-D modeling of bare dune sand under local climatic conditions showed the diffusive extinction depth to be about 1 m. The mean grain diameter of the sand used in the experiment was at about 0.15 mm or about 2.9 phi units. For comparison, the experimental work conducted by Hellwig [22] found that the evaporative extinction depth of bare soil with a mean grain diameter of 0.53 mm was about 0.6 m. The results of the experiments of Hellwig [20,22] on the effects of particle size, position of the water table, and climate are generally consistent with the results herein obtained. However, our experiments were conducted using a finer grain size of the tested soil and was at higher average surface temperatures and low humidity compared to the Hellwig experiments.
Modeling work using HYDRUS 1-D on estimating the extinction depth of soils with various compositions and land covers was conducted by Shah et al. [18]. They concluded that pure, bare sand with no significant content of fines produced an extinction depth of 0.5 m. However, they concluded that fine-textured soils would have a greater extinction depth compared to coarse-grained soils for similar land covers. Since the dune sand tested has some mud and a fine to very fine sand mean grain diameter, the results are expected to yield a deeper extinction depth. Therefore, the experimental work conducted on the bare dune sand is in general agreement with the research conducted by Shah et al. [18], yet specific to the climatic conditions found at the site.
It is very likely that the extinction depth found in this experimental method applies to dune sands with the mean grain diameter and measured porosity values in the ranges found in most desert areas. Compaction of fine-grain, well-rounded, predominantly quartz composition dune sands is not relevant above a vertical effective stress of less than 1 to 2 MPa which corresponds to a depth of about 100 m [42]. Further, the loss of porosity between land surface and 100 m in very fine dune sand, based on experimental results, is less than 1% at about 100 m [42]. This has no impact on the measured extinction depth in the field experiment.

5. Conclusions

Experimental studies were conducted to estimate the diffusive extinction depth of dune sand and to monitor the water level, soil moisture and temperature gradients. The sand used in the experiment was excavated from dunes located in the southwestern region of Saudi Arabia. Several samples of the sand were subjected to porosity, hydraulic conductivity and grain size distribution laboratory analyses. In a field experiment, the dune sand was placed in a barrel with a height of 150 cm and a diameter of 150 cm and was left exposed under natural conditions (precipitation, evaporation) after saturation. Transducers were used to record the water level fluctuations and 5TM sensors were used to capture the dynamics of soil moisture content and temperature profiles.
The water level gradient showed stabilization at a depth of about 1 m in the sand column which was established as the extinction depth of the dune sand under a bare condition. Moreover, it was found that soil specific calibration of the soil moisture content sensors is useful in obtaining accurate volumetric water content measurements.
It was found that the hydrodynamic simulator HYDRUS 1-D, when provided with accurate hydraulic and meteorological parameters and specific initial and top boundary conditions, provides a reasonably accurate representation of vadose zone processes, making this method highly applicable in arid and semi-arid hydrological processes especially for those related to evaporation and extinction depths. The results from sensor derived soil moisture content data and that obtained from HYDRUS 1-D using the single porosity model of Maulem–van Gunechten (MVG) was compared. It was found that both datasets are correlated as the soil moisture profile obtained from hydrodynamic simulation follows the same trend as the soil moisture content profile recorded by the sensors.
The experimental and modeling results found are in general agreement with previous studies conducted on measurement of the diffusive evaporative extinction depth. Experiments conducted on bare sandy soils by Hellwig [20,21,22] and Shah et al. [40] showed the extinction depth to be 0.6 and 0.5 m respectively for coarser sands compared to those studied. This is consistent with the concept that the extinction depth increases based on a reduction in mean grain diameter and addition of clay or fine-grained organic material. The finer grain sediment tends to increase the height of the capillary fringe and aids in diffusion.
Based on the measurement of the extinction depth for this sand, an MAR project designed to store water in the source dune field would require that the water table position be maintained below a depth of 1 m. Therefore, the loss of water during the storage cycle could be minimized and a more efficient system could be designed.

Acknowledgments

The funding for this research was provided by the Water Desalination and Reuse Center at the King Abdullah University of Science and Technology and discretionary faculty funding. The authors thank the local farmer Khadr Bin Sayed AlGamdi for providing access to his farm where the field experiments were conducted.

Author Contributions

Iqra Mughal conducted the background research, the field work, and wrote part of the text. Samir Al-Mashharawi worked with Iqra Mughal on the field work and helped collect and test the samples. Khan Z. Jadoon worked with Iqra Mughal on the HYDRUS1 modeling. P. Martin Mai and Thomas M. Missimer wrote and reviewed the manuscript with added references and background.

Conflicts of Interest

The authors declare no conflict of interest.

References

  1. Subyani, A.M. Geostatistical study of annual and mean rainfall patterns in southwest Saudi Arabia. Hydrol. Sci. J. 2004, 49, 803–817. [Google Scholar] [CrossRef]
  2. Sen, Z. Wadi Hydrology; CRC Press, Taylor & Francis Group: Boca Raton, FL, USA, 2008. [Google Scholar]
  3. Maliva, R.G.; Missimer, T.M. Arid Lands Water Evaluation and Management; Springer: Heidelberg, Germany, 2012. [Google Scholar]
  4. Abdulrazzak, M.J.; Morel-Seytoux, H.J. Recharge from an ephemeral stream following wetting front arrival to water table. Water Resour. Res. 1983, 19, 194–200. [Google Scholar] [CrossRef]
  5. Sorman, A.U.; Abdulrazzak, M.J. Infiltration-recharge through wadi beds in arid regions. Hydrol. Sci. J. 1993, 38, 173–186. [Google Scholar] [CrossRef]
  6. Missimer, T.M.; Drewes, J.E.; Amy, G.; Maliva, R.G.; Keller, S. Restoration of wadi aquifers by artificial recharge with treated wastewater. Groundwater 2012, 50, 514–527. [Google Scholar] [CrossRef] [PubMed]
  7. AlSarmi, S.; Washington, R. Recent observed climate change over the Arabian Peninsula. J. Geophys. Res. 2011, 166, D11109. [Google Scholar] [CrossRef]
  8. Almazroui, M. Simulation of present and future climate of Saudi Arabia using a regional climate model (PRECIS). Int. J. Climatol. 2013, 9, 2247–2259. [Google Scholar] [CrossRef]
  9. Al-Muttair, F.F.; Sendil, U.; Al-Turbak, A.S. Management of recharge dams in Saudi Arabia. J. Water Res. Plan. Manag. 1994, 120, 749–763. [Google Scholar] [CrossRef]
  10. Missimer, T.M.; Guo, W.; Maliva, R.G.; Rosas, J.; Jadoon, K.Z. Enhancement of wadi recharge using dams coupled with aquifer storage and recovery wells. Environ. Earth Sci. 2014, 73, 1303–1315. [Google Scholar] [CrossRef]
  11. Lopez, O.; Stenchikov, G.; Missimer, T.M. Water management during climate change using aquifer storage and recovery in a dunefield in western Saudi Arabia. Environ. Res. Lett. 2014, 9. [Google Scholar] [CrossRef]
  12. Vandenbohede, A.; van Houtte, E.; Lebbe, L. Sustainable groundwater extraction in coastal areas: A Belgian example. Environ. Geol. 2009, 57, 735–747. [Google Scholar] [CrossRef]
  13. Thoa, N.T.K.; Arduino, G.; Giang, N.V.; van, P.T.K.; Vuong, B.T. The model for management of aquifer recharge in sand dune area of Bac Binh, Binh Thuan, Vietnam. J. Earth Sci. 2006, 28, 389–410. [Google Scholar]
  14. Dillion, P. Aquifer storage and recovery with stormwater and reclaimed water in Australia. In Proceedings of the UNESCO-VIETNAM Artificial Recharge in South East Asia, Ho Chin Minh City, Virtnam, 15–17 December 2004.
  15. Lopez, O.M.; Jadoon, K.Z.; Missimer, T.M. Method of relating grain size distribution to hydraulic conductivity in dune sands to assist in assessing managed aquifer recharge projects: Wadi Khulays dune field, western Saudi Arabia. Water 2015, 7, 6411–6426. [Google Scholar] [CrossRef]
  16. Droogers, P.; Allen, R.G. Estimating reference evapotranspiration under inaccurate data conditions. Irrig. Drain. Syst. 2002, 16, 33–45. [Google Scholar] [CrossRef]
  17. Inmark, S.; Irmak, A.; Allen, R.; Jones, J. Solar and net radiation-based equations to estimate reference evapotranspiration in humid climates. J. Irrig. Drain. Eng. 2003, 129, 336–347. [Google Scholar]
  18. Shah, N.; Nachabe, M.; Ross, M. Extinction depth and evapotranspiration from ground water under selected land covers. Ground Water 2007, 45, 329–338. [Google Scholar] [CrossRef] [PubMed]
  19. Xiao, X.; Li, B.; Sauer, T.; Heitman, J.; Ren, T. Cumulative soil water evaporation as a function of depth and time. Vadose Zone J. 2000, 10, 1016–1022. [Google Scholar] [CrossRef]
  20. Hellwig, D.H.R. Evaporation of water from sand, 1: Experimental set-up and climate influence. J. Hydrol. 1973, 18, 93–108. [Google Scholar] [CrossRef]
  21. Hellwig, D.H.R. Evaporation of water from sand, 2: Diurnal variations. J. Hydrol. 1973, 18, 109–118. [Google Scholar] [CrossRef]
  22. Hellwig, D.H.R. Evaporation of water from sand, 4: The influence of the depth of the water table and the particle size distribution of the sand. J. Hydrol. 1973, 18, 109–118. [Google Scholar] [CrossRef]
  23. Soylu, M.E.; Istanbulluoglu, E.; Lenters, J.D.; Wang, T. Quantifying the impact of groundwater depth on evapotranspiration in a semi-arid grassland region. Hydrol. Earth Syst. Sci. 2011, 15, 787–806. [Google Scholar] [CrossRef]
  24. Wang, X. Vapor flow resistance of dry soil layer to soil water evaporation in arid environment: An overview. Water 2015, 7, 4552–4574. [Google Scholar] [CrossRef]
  25. Tanner, W.F.; Balsillie, J.H. Environmental Granulometry; Special Publication No. 40; Florida Geological Survey: Tallahassee, FL, USA, 1995. [Google Scholar]
  26. United States Department of Agriculture-Natural Resources Conservation Service (USDA-NRCS). Soil Survey Laboratory Methods Manual; Report No. 42, Version 4.0; National Soil Center: Lincoln, NE, USA, 2004.
  27. American Society for Testing and Materials (ASTM). Standard Test Method for Permeability of Granular Soils, ASTM Standard D2434–68; ASTM: West Conshocken, PA, USA, 2006. [Google Scholar]
  28. Topp, S.; Grasmueck, M.; Vega, S.; Viggiano, D.A. Electromagnetic determination of soil water content: Measurement in coaxial transmission lines. Water Res. 1980, 16, 574–582. [Google Scholar] [CrossRef]
  29. Jadoon, K.Z.; Weihermüller, L.; Scharnagl, B.; Kowalsky, M.B.; Bechtold, M.; Hubbard, S.S.; Vereecken, H.; Lambot, S. Estimation of soil hydraulic parameters in the field by integrated hydrogeophysical inversion of time-lapse ground-penetrating radar data. Vadose Zone J. 2012, 11, 1–17. [Google Scholar] [CrossRef]
  30. Dimitrov, M.; Vanderborght, J.; Kostov, K.G.; Jadoon, K.Z.; Weihermuller, L.; Jackson, T.J.; Bindlish, R.; Pachepsky, Y.; Schwank, M.; Vereecken, H. Soil hydraulic parameters and surface soil moisture of a tilled bare soil plot inversely derived from L-band brightness temperatures. Vadose Zone J. 2014, 13, 1–18. [Google Scholar] [CrossRef]
  31. Scanlon, B.R.; Christman, M.; Reedy, R.C.; Porro, I.; Simunek, J.; Flerchinger, G.N. Intercode comparisons for simulating water balance of surficial sediments in semiarid regions. Water Res. 2002, 38, 1323–1339. [Google Scholar] [CrossRef]
  32. Saito, H.J.; Simunek, J.; Mohanty, B. Numerical analyses of coupled water, vapor and heat transport in the vadose zone. Vadose Zone J. 2006, 5, 784–800. [Google Scholar] [CrossRef]
  33. Mualem, Y. A new model for predicting the hydraulic conductivity of unsaturated porous media. Water Res. 1976, 12, 513–522. [Google Scholar] [CrossRef]
  34. Van Genuchten, M.T. A closed form equation for predicting the hydraulic conductivity of unsaturated soils. Soil Sci. Soc. Am. J. 1980, 44, 892–898. [Google Scholar] [CrossRef]
  35. Vereecken, H. Estimating the unsaturated hydraulic conductivity from theoretical models using simple soil properties. Geodema 1995, 65, 81–92. [Google Scholar] [CrossRef]
  36. Noborio, K.; McInnes, K.J.; Heilman, J.L. Two-dimensional model for water, heat, and solute transport in furrow-irrigated soil: II. Field evaluation. Soil Sci. Soc. Am. J. 1996, 60, 1010–1021. [Google Scholar] [CrossRef]
  37. Nimmo, J.R.; Miller, E.E. The temperature dependence of isothermal moisture vs. potential characteristics of soils. Soil Sci. Soc. Am. J. 1986, 50, 1105–1113. [Google Scholar] [CrossRef]
  38. Nassar, I.N.; Horton, R. Simultaneous transfer of heat, water, and solute in porous media: I. Theoretical development. Soil Sci. Soc. Am. J. 1992, 56, 1350–1356. [Google Scholar] [CrossRef]
  39. Wentworth, C.K. A scale of grade and class terms for clastic sediments. J. Geol. 1922, 30, 377–392. [Google Scholar] [CrossRef]
  40. Allen, R.G.; Pereira, L.S.; Smith, M. Crop Evapotranspiration: Guidelines for Computing Crop Water Requirements; Irrigation and Drainage Paper 56; Food and Agriculture Organization of the United Nations: Roma, Italy, 1998. [Google Scholar]
  41. Scharnagl, B.; Vrugt, J.; Vereecken, H.; Herbst, M. Inverse modeling of in situ soil water dynamics: Investigation the effect of different prior distributions of the soil hydraulic parameters. Hydrol. Earth Syst. Sci. 2011, 15, 3043–3059. [Google Scholar] [CrossRef]
  42. Chuhan, F.A.; Kjeldstad, A.; Bjorlykke, K.; Hoeg, K. Experimental compression of loose sands: Relevance to porosity reduction during burial in sedimentary basins. Can. Geotech. J. 2003, 40, 997–1011. [Google Scholar] [CrossRef]

