3.1. Maximum Scour Depth and Location
The scour depth results for spillway operating conditions tested are shown in
Table 1 in prototype units. (In this and succeeding sections, results are given in prototype units unless otherwise noted or in dimensionless form.) The flow types are categorized as uncontrolled submerged (US), uncontrolled free (UF), controlled submerged (CS), controlled free (CF), and uncontrolled jet (UJ). Submerged flow refers to cases for which the modular limit of the spillway was exceeded in contrast to free flows for which there was no tailwater influence on the discharge, while controlled
vs. uncontrolled modifiers signify orifice flow under vertical gates as opposed to gates fully open with weir flow over the spillway. All experimental runs are reported in
Table 1 for the spillway design discharge,
Qd, of 680 m
3/s and a gate opening height,
Go, of 2.54 m for controlled flow. Run 1 applied the maximum allowable tailwater condition, while Run 2 tailwater corresponded to the hydraulic jump occurring in the stilling basin with the toe of the jump at the base of the spillway consistent with the stilling basin design. In Run 3, tailwater was at its maximum allowable elevation and the gate opening was set so that the maximum allowable headwater elevation also occurred. Run 4 had the same tailwater elevation as Run 2 with a free hydraulic jump but with orifice flow under the gates rather than weir flow with the gates fully open. Finally, the uncontrolled jet case in Run 5 was for a low tailwater elevation that caused the hydraulic jump to be swept to the end sill of the basin resulting in a jet coming off the sill. Runs 6 through 10 paired up with Runs 1 through 5, respectively, but with the longer riprap apron of
La/
Lsb = 2.0. All variables in the table were previously defined in
Figure 3.
Table 1.
Experimental conditions and results in prototype units. (Qd = 680 m3/s, Go = 2.54 m).
Table 1.
Experimental conditions and results in prototype units. (Qd = 680 m3/s, Go = 2.54 m).
| Run | Flow Type | La/Lsb | HW (m) | TW (m) | He (m) | Ht (m) | ds (m) | Xs (m) |
|---|
| 1 | US | 1.0 | 6.96 | 5.79 | 4.08 | 2.83 | 2.64 | 33.5 |
| 2 | UF | 1.0 | 6.43 | 3.96 | 3.56 | 1.00 | 4.76 | 51.3 |
| 3 | CS | 1.0 | 7.60 | 6.00 | 4.71 | 3.04 | 2.94 | 33.5 |
| 4 | CF | 1.0 | 7.02 | 3.97 | 4.15 | 1.01 | 5.17 | 53.9 |
| 5 | UJ | 1.0 | 6.32 | 3.21 | 3.45 | 0.25 | 5.42 | 75.3 |
| 6 | US | 2.0 | 7.06 | 5.84 | 4.18 | 2.88 | 1.64 | 46.3 |
| 7 | UF | 2.0 | 6.45 | 3.87 | 3.58 | 0.91 | 4.31 | 68.6 |
| 8 | CS | 2.0 | 7.67 | 6.03 | 4.79 | 3.07 | 1.94 | 48.1 |
| 9 | CF | 2.0 | 7.00 | 3.88 | 4.14 | 0.92 | 4.80 | 70.1 |
| 10 | UJ | 2.0 | 6.35 | 3.18 | 3.48 | 0.22 | 5.60 | 79.5 |
As discussed previously, the model scale was chosen to minimize Reynolds number and Weber number effects. Furthermore, the spillway design variables of upstream head to design head ratio (
He/Hd), spillway height ratio (
P/He), and upstream head to gate opening height ratio (
He/Go) were varied within narrow ranges for the various design operating conditions in
Table 1. In addition, the stilling basin length (
Lsb) was fixed at the design value for a standard ogee spillway so that variability of the ratio
He/Lsb was small. With these study specifications, in which the primary independent variables of interest were the effects of riprap apron length and tailwater submergence on downstream scour, the results of a dimensional analysis for maximum scour depth,
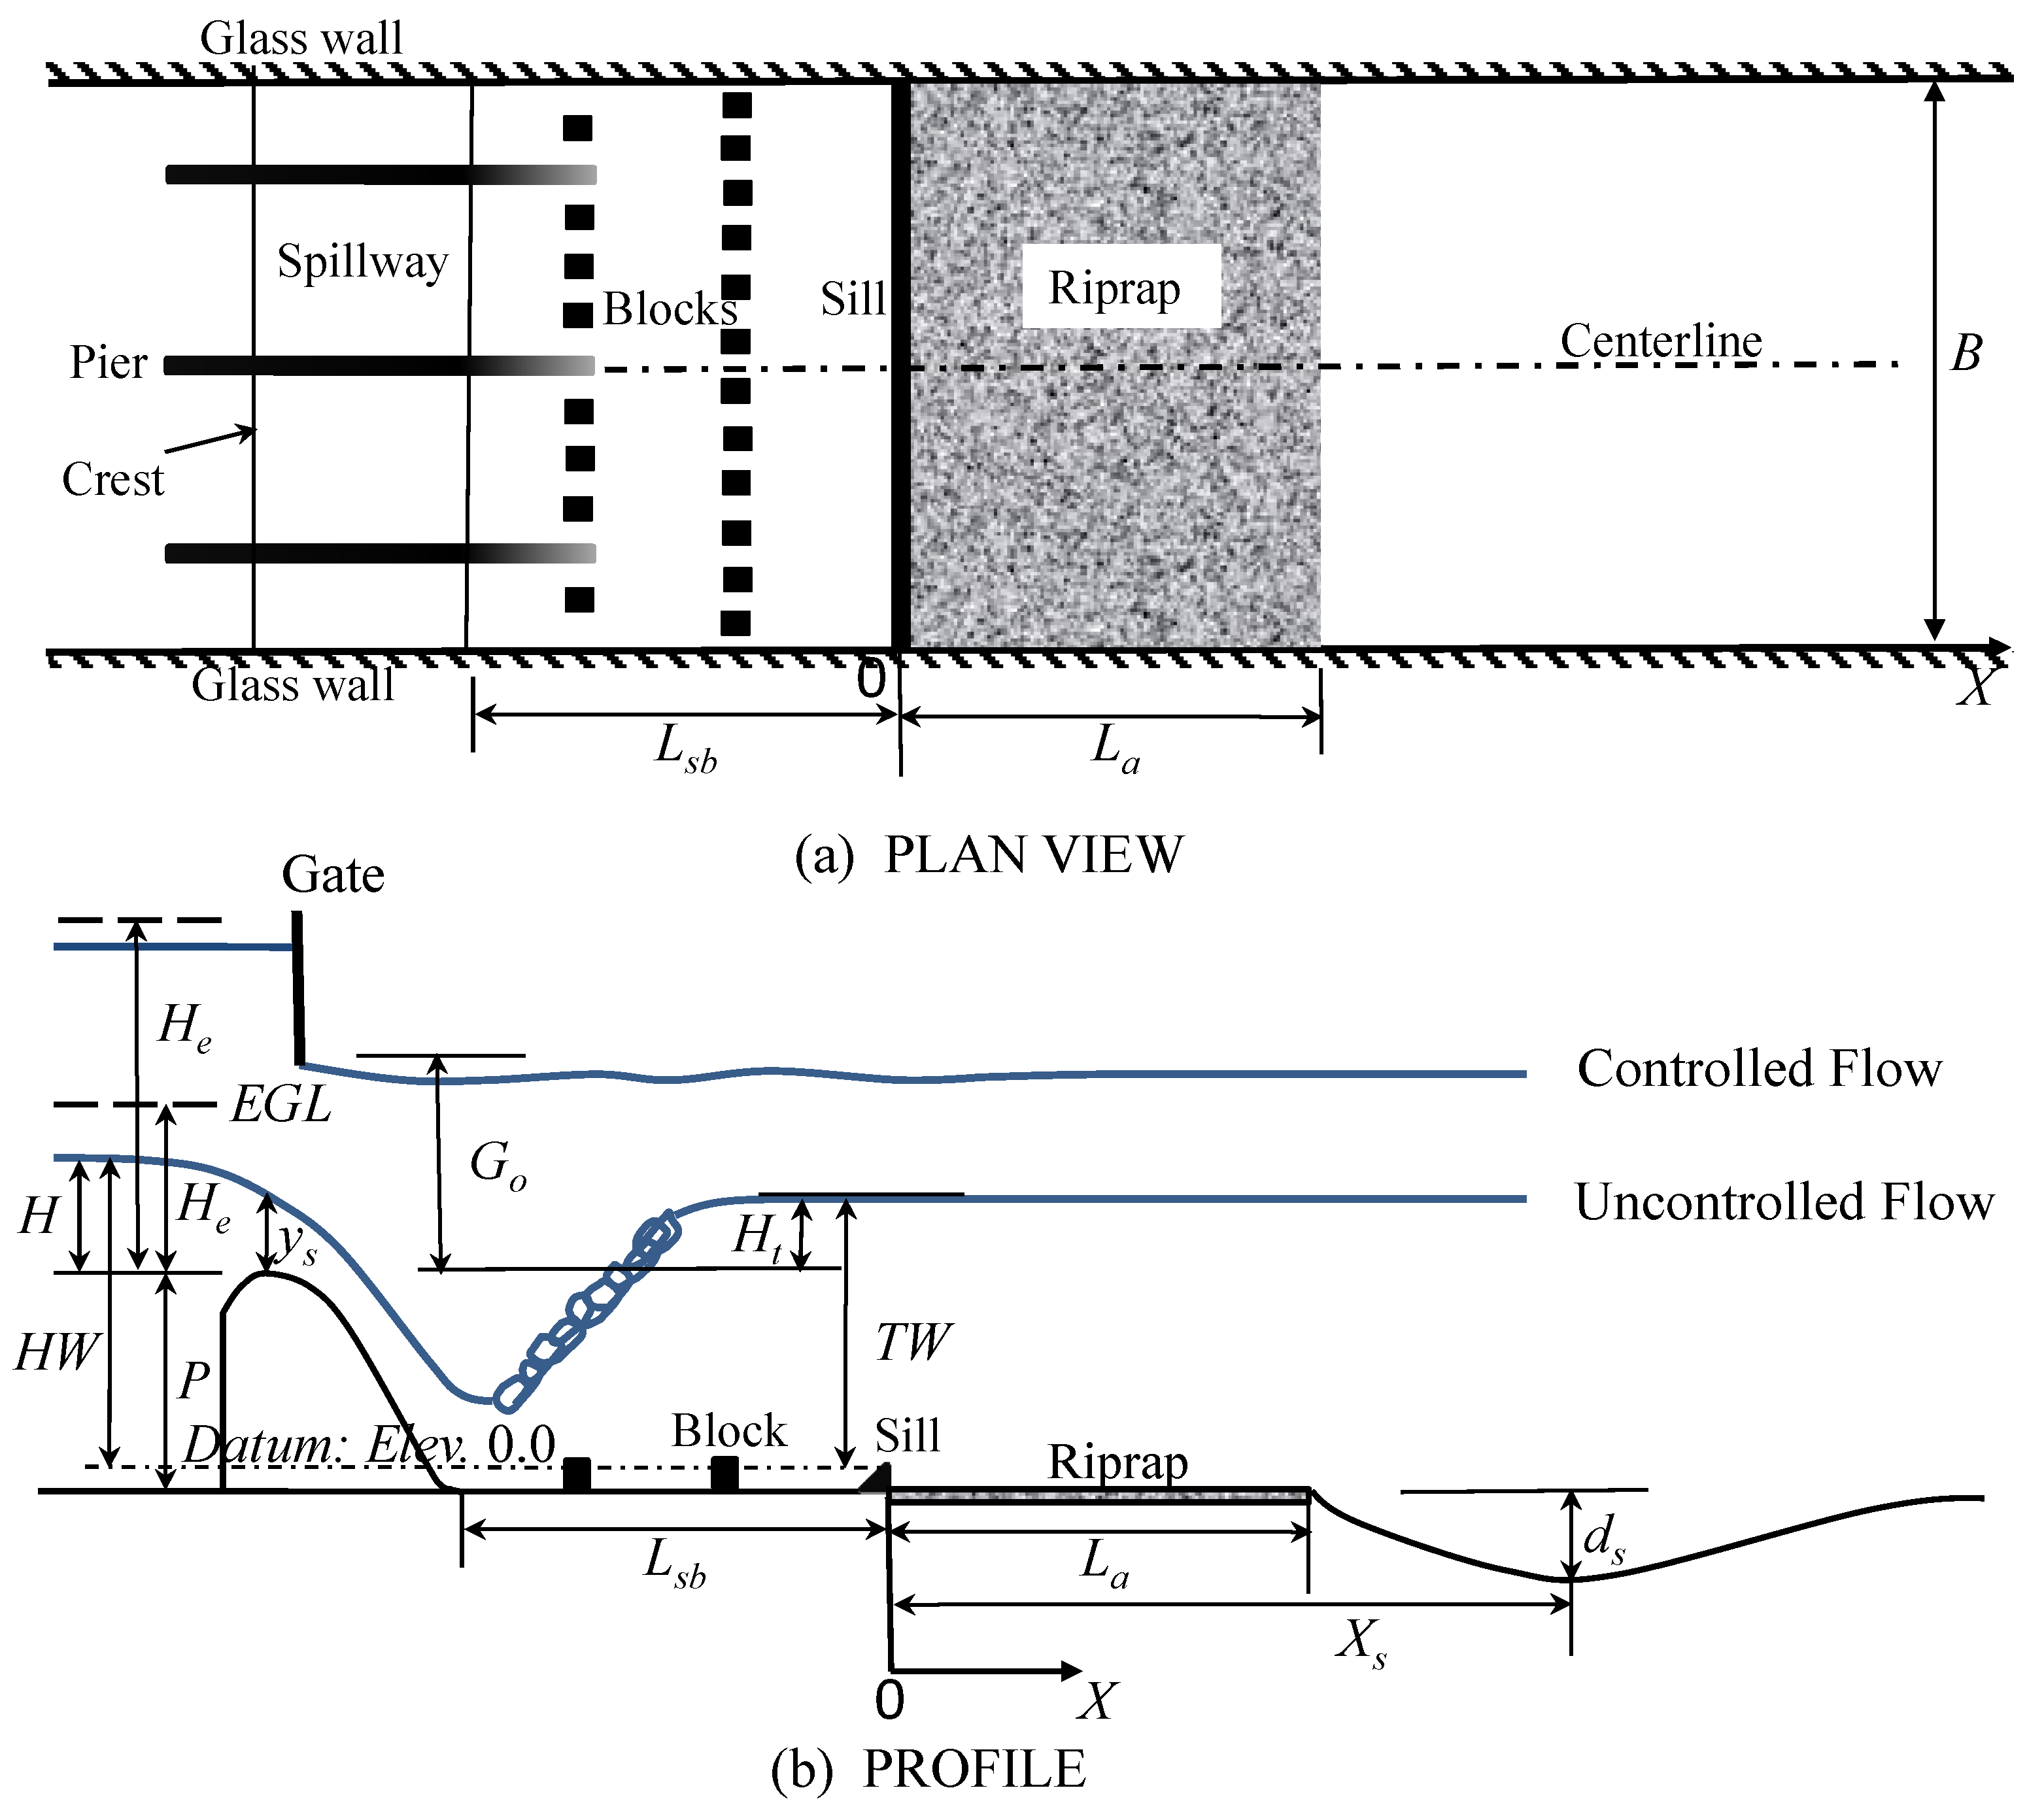
ds, can be presented as:
in which Δ
Z = height of the headwater relative to the stilling basin floor,
Ht = tailwater head relative to the spillway crest,
He = total energy head upstream of the spillway relative to the crest,
La = length of riprap apron and
d50 = median grain size of the mobile bed (
Figure 3). Proceeding in a similar fashion for the distance from the stilling basin end sill to the location of maximum scour depth,
Xs, the dimensional analysis yields
The effect of model sediment size is reflected in the variables
KD in Equation (1),
He/
d50 in Equations (2), (4) and (5), and
yt/
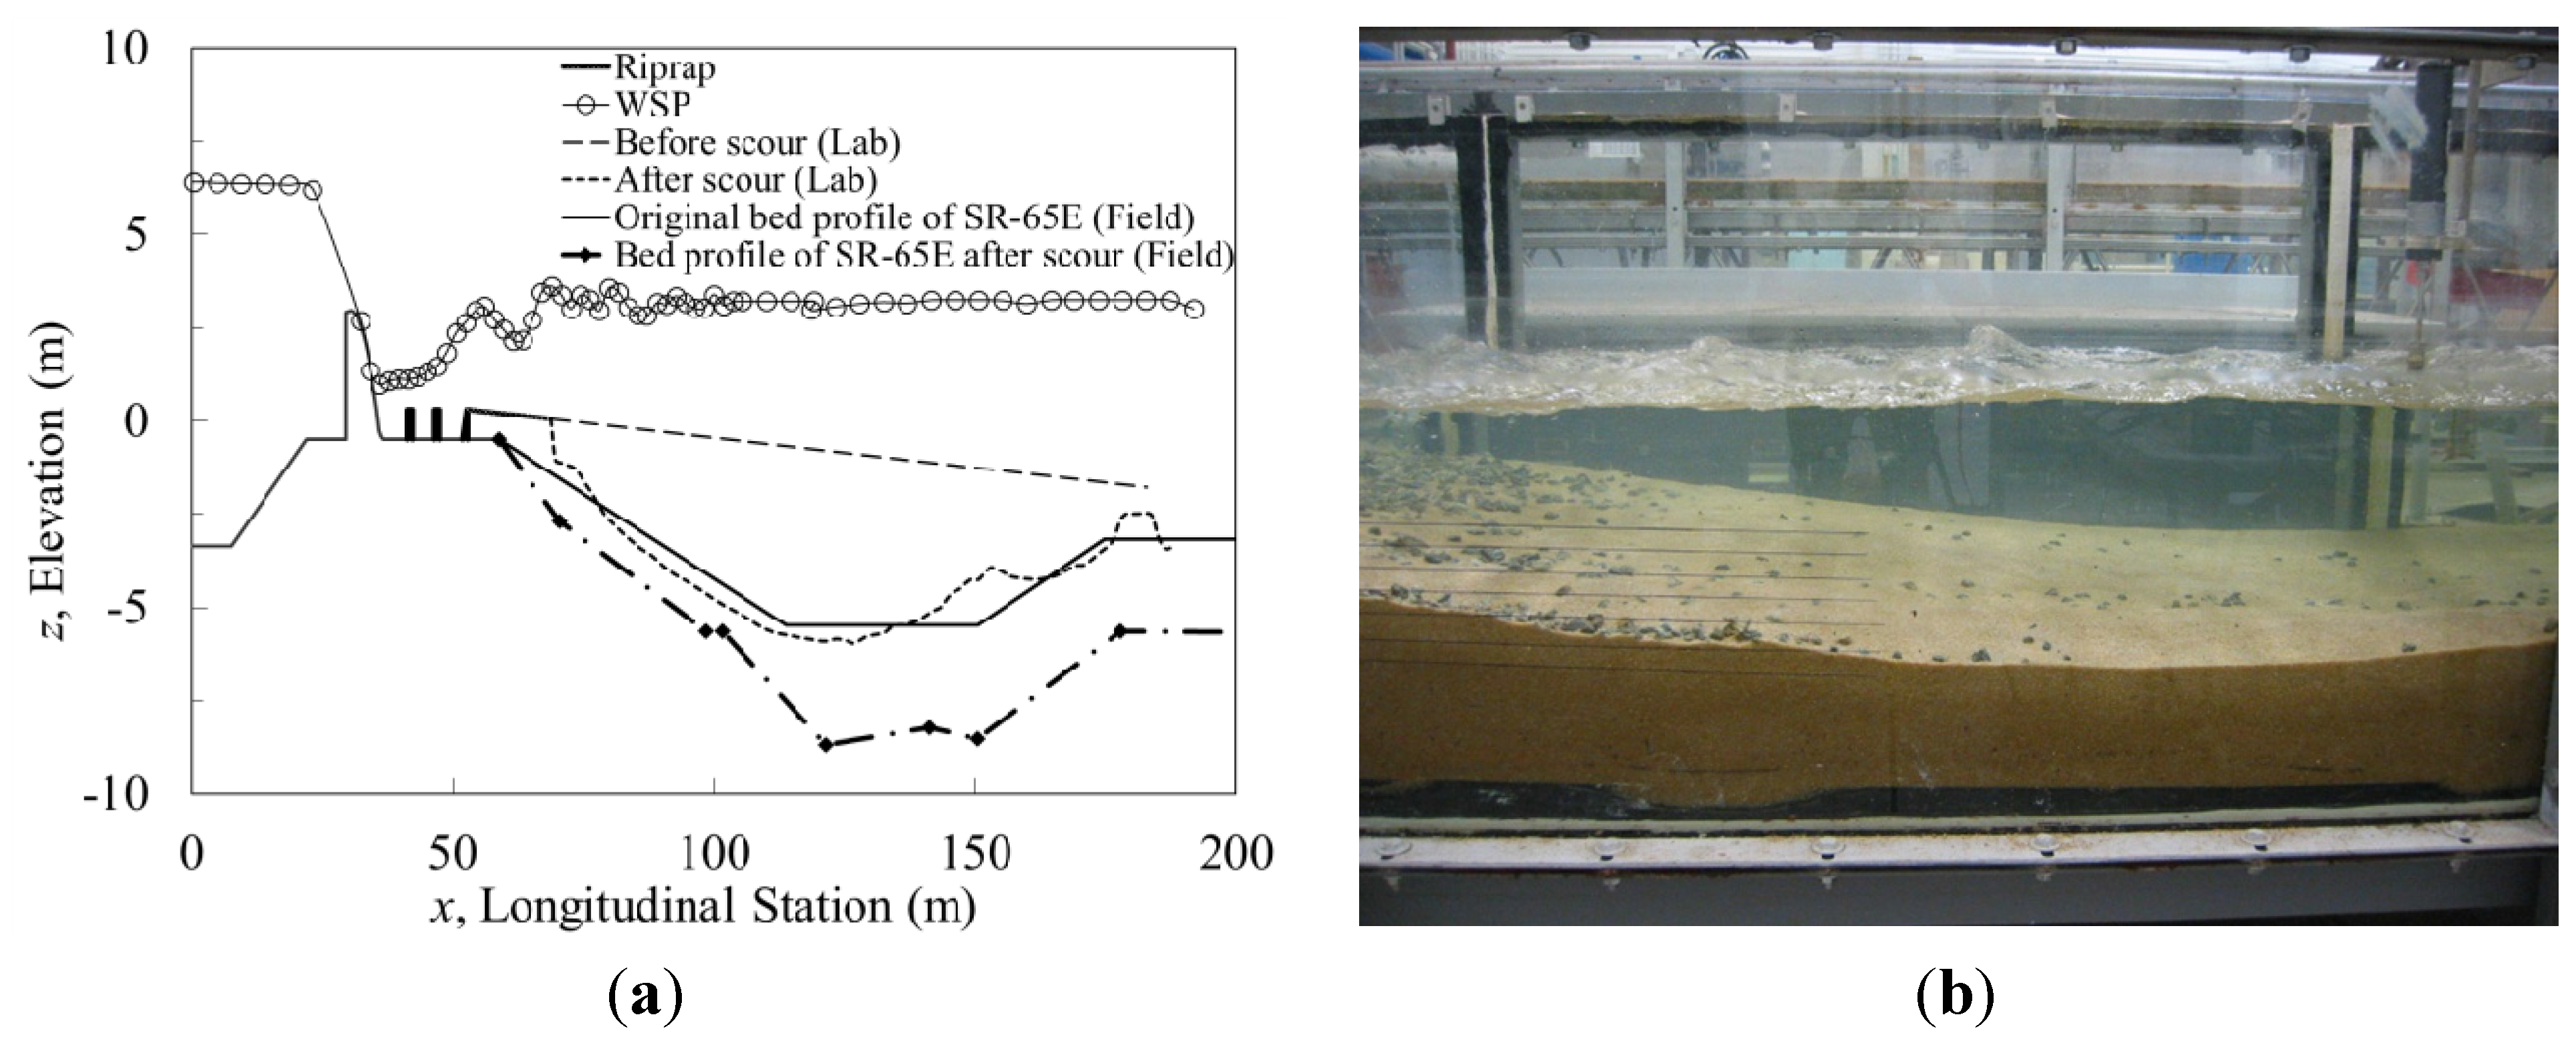
d50 in Equation (3), and it is difficult to predict without testing a range of sediment sizes or by determining the critical velocity for initiation of motion of the sediment in the field. The latter approach is especially challenging in the present case for which organic matter in the sediment can introduce interparticle forces that affect its resistance to scour. However, a comparison of the original plunge pool design with the size and geometry of the scour hole from this study is shown in
Figure 4 for the UJ case (Run 5 in
Table 1) which corresponds to the lower expected design limit for tailwater elevation. In this case, the lab data match very well the original plunge pool profile determined from a previous model study [
20]. The additional plunge pool scour shown in
Figure 4 during the drought of 2007 and 2008 is based on a field bathymetric survey provided by SFWMD [
21]. The observed field scour profile is consistent with the tailwater elevation, as determined by the water level in Lake Okeechobee, falling below the expected minimum operating level and causing hydraulic jump sweepout as suggested by the USACE MAGO (maximum allowable gate opening) curves [
21].
Although the validation of model sediment size shown in
Figure 4 is somewhat limited, measured values of
ds/Δ
Z and
Xs/Lsb are presented in
Figure 5 as a function only of the first two dimensionless ratios on the right hand sides of Equations (6) and (7) which are a measure of the effects of tailwater submergence and riprap apron length on downstream maximum scour depth and location, respectively. The horizontal axis is modified slightly to become
hd/He = (1.0 –
Ht/He) to provide additional generality. With this definition,
hd becomes the difference between upstream energy grade line elevation and tailwater elevation such that scour depth would be expected to increase with increasing values of
hd.
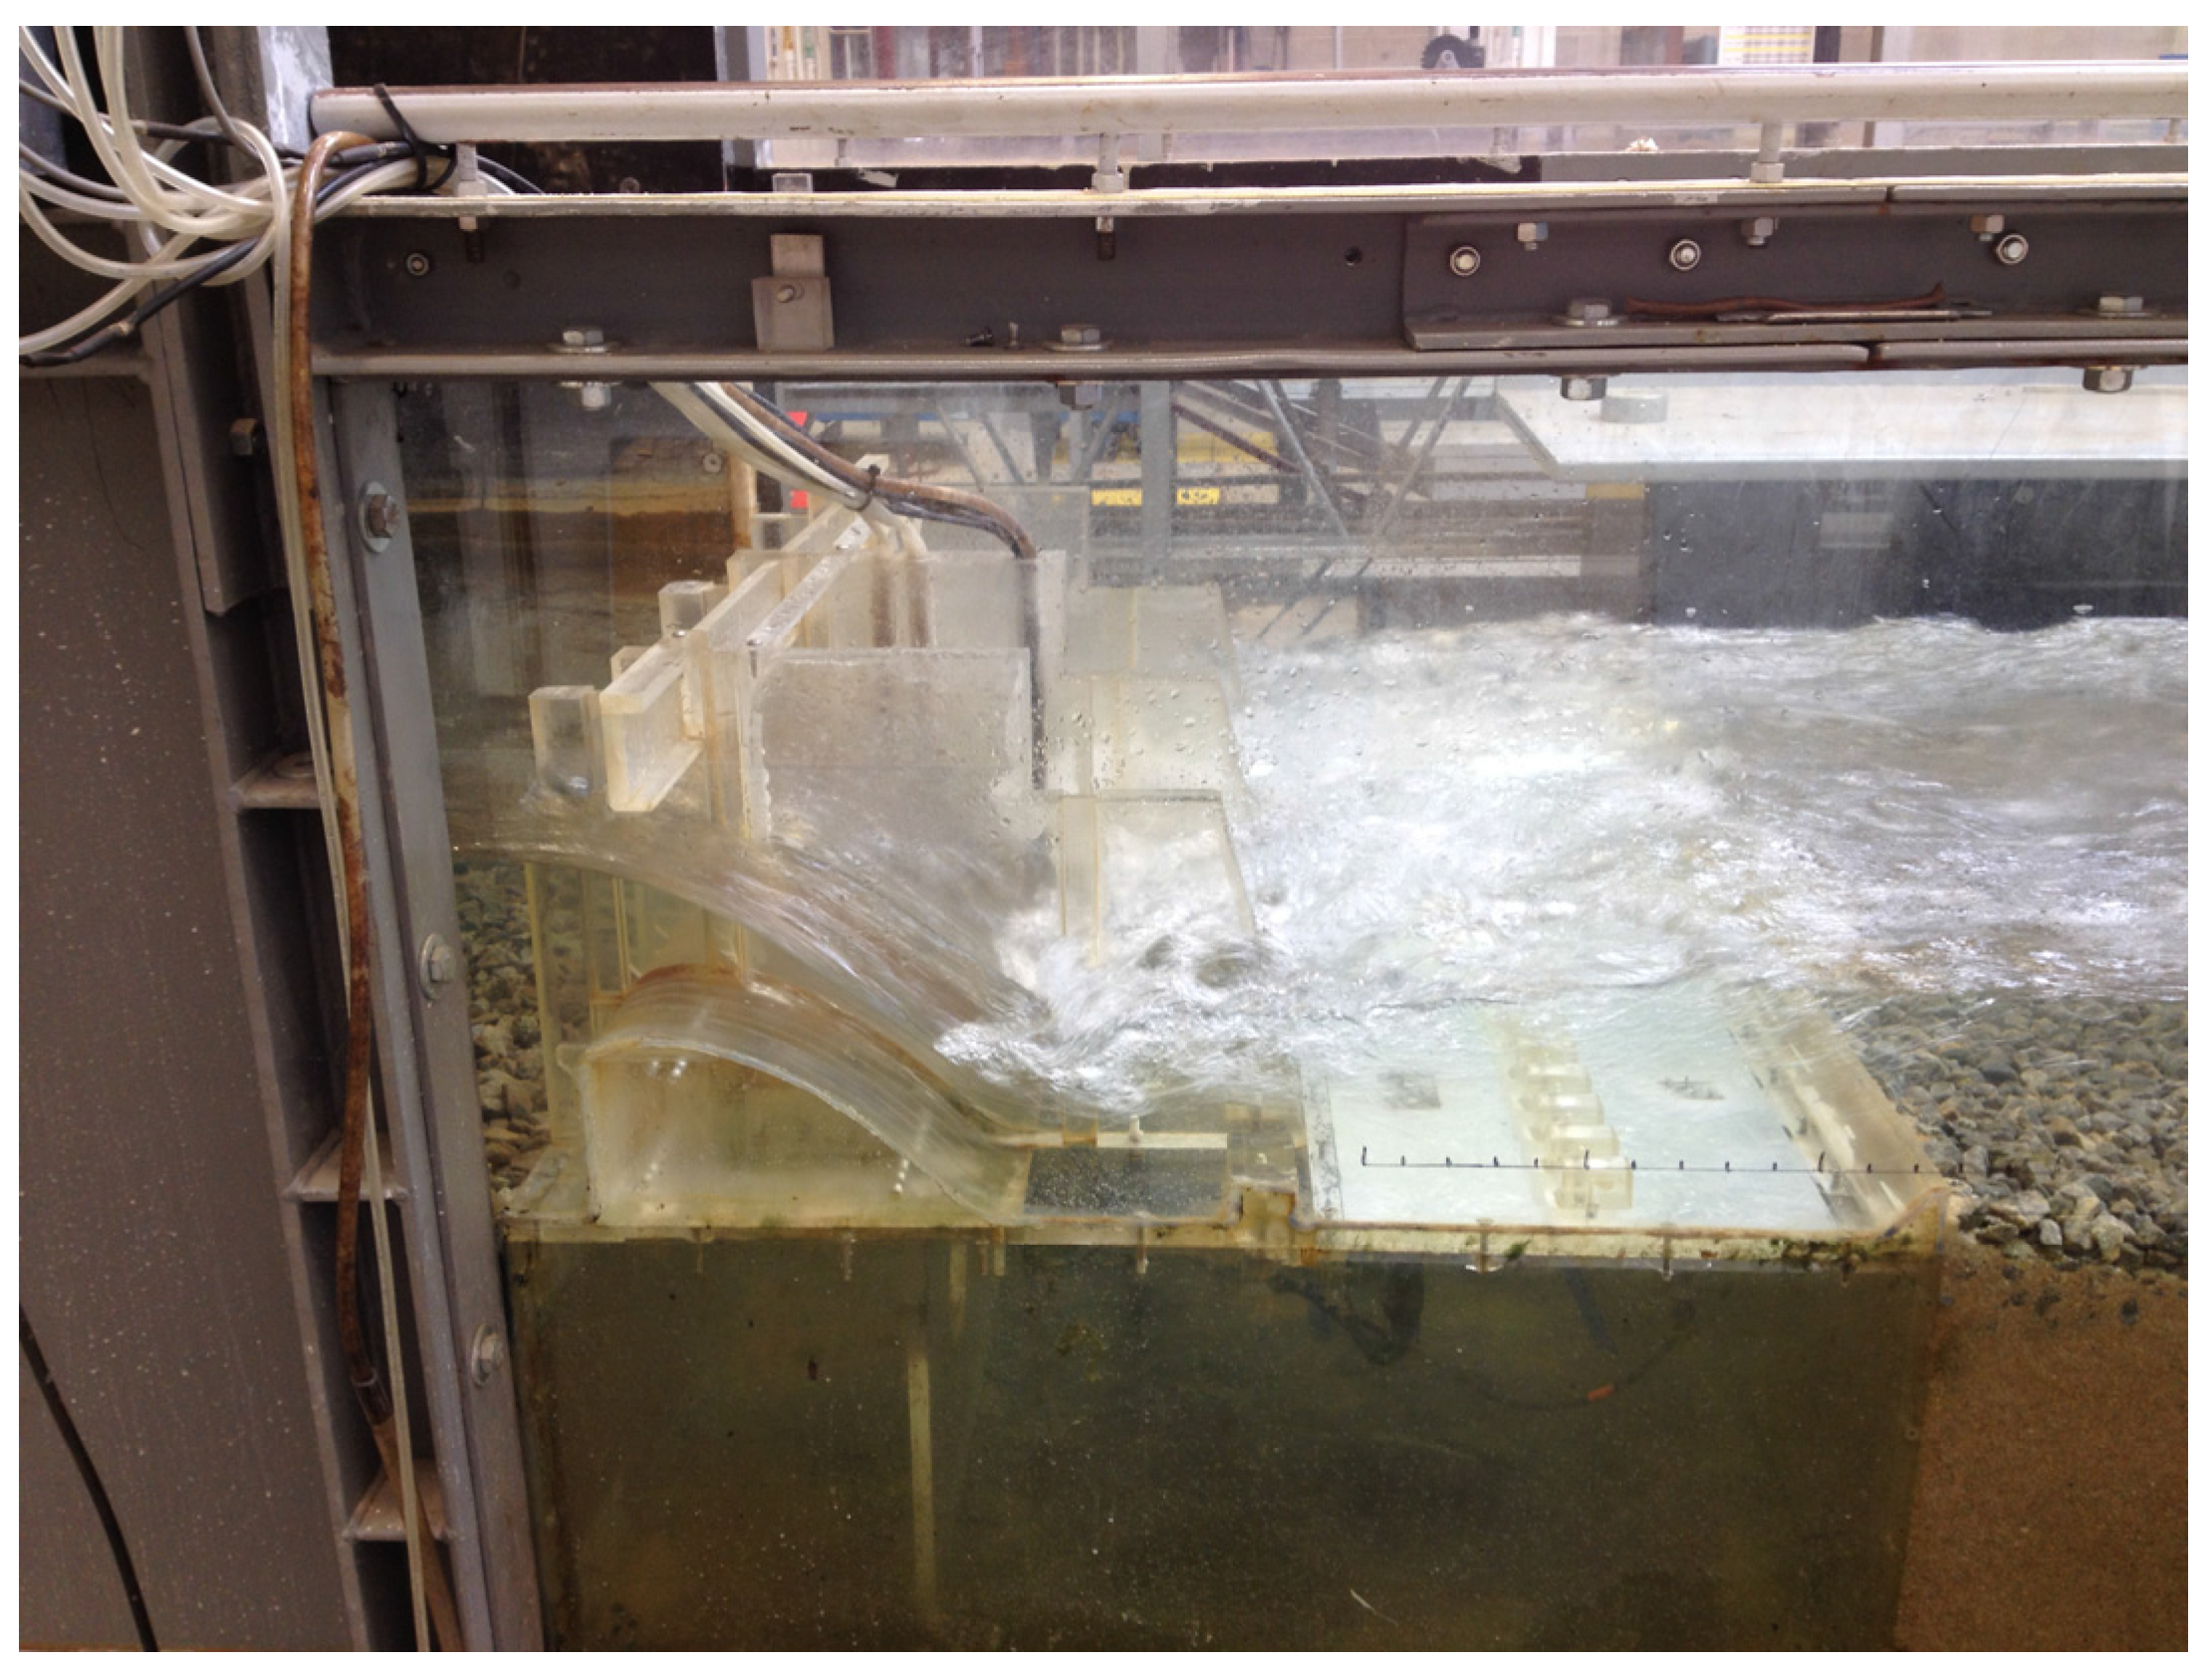
Figure 4.
(a) Comparison of experimental centerline scour profile for Run 5 with stilling pool design and historic scour due to low tailwater; (b) Equilibrium scour profile photo for Run 5.
Figure 4.
(a) Comparison of experimental centerline scour profile for Run 5 with stilling pool design and historic scour due to low tailwater; (b) Equilibrium scour profile photo for Run 5.
Figure 5.
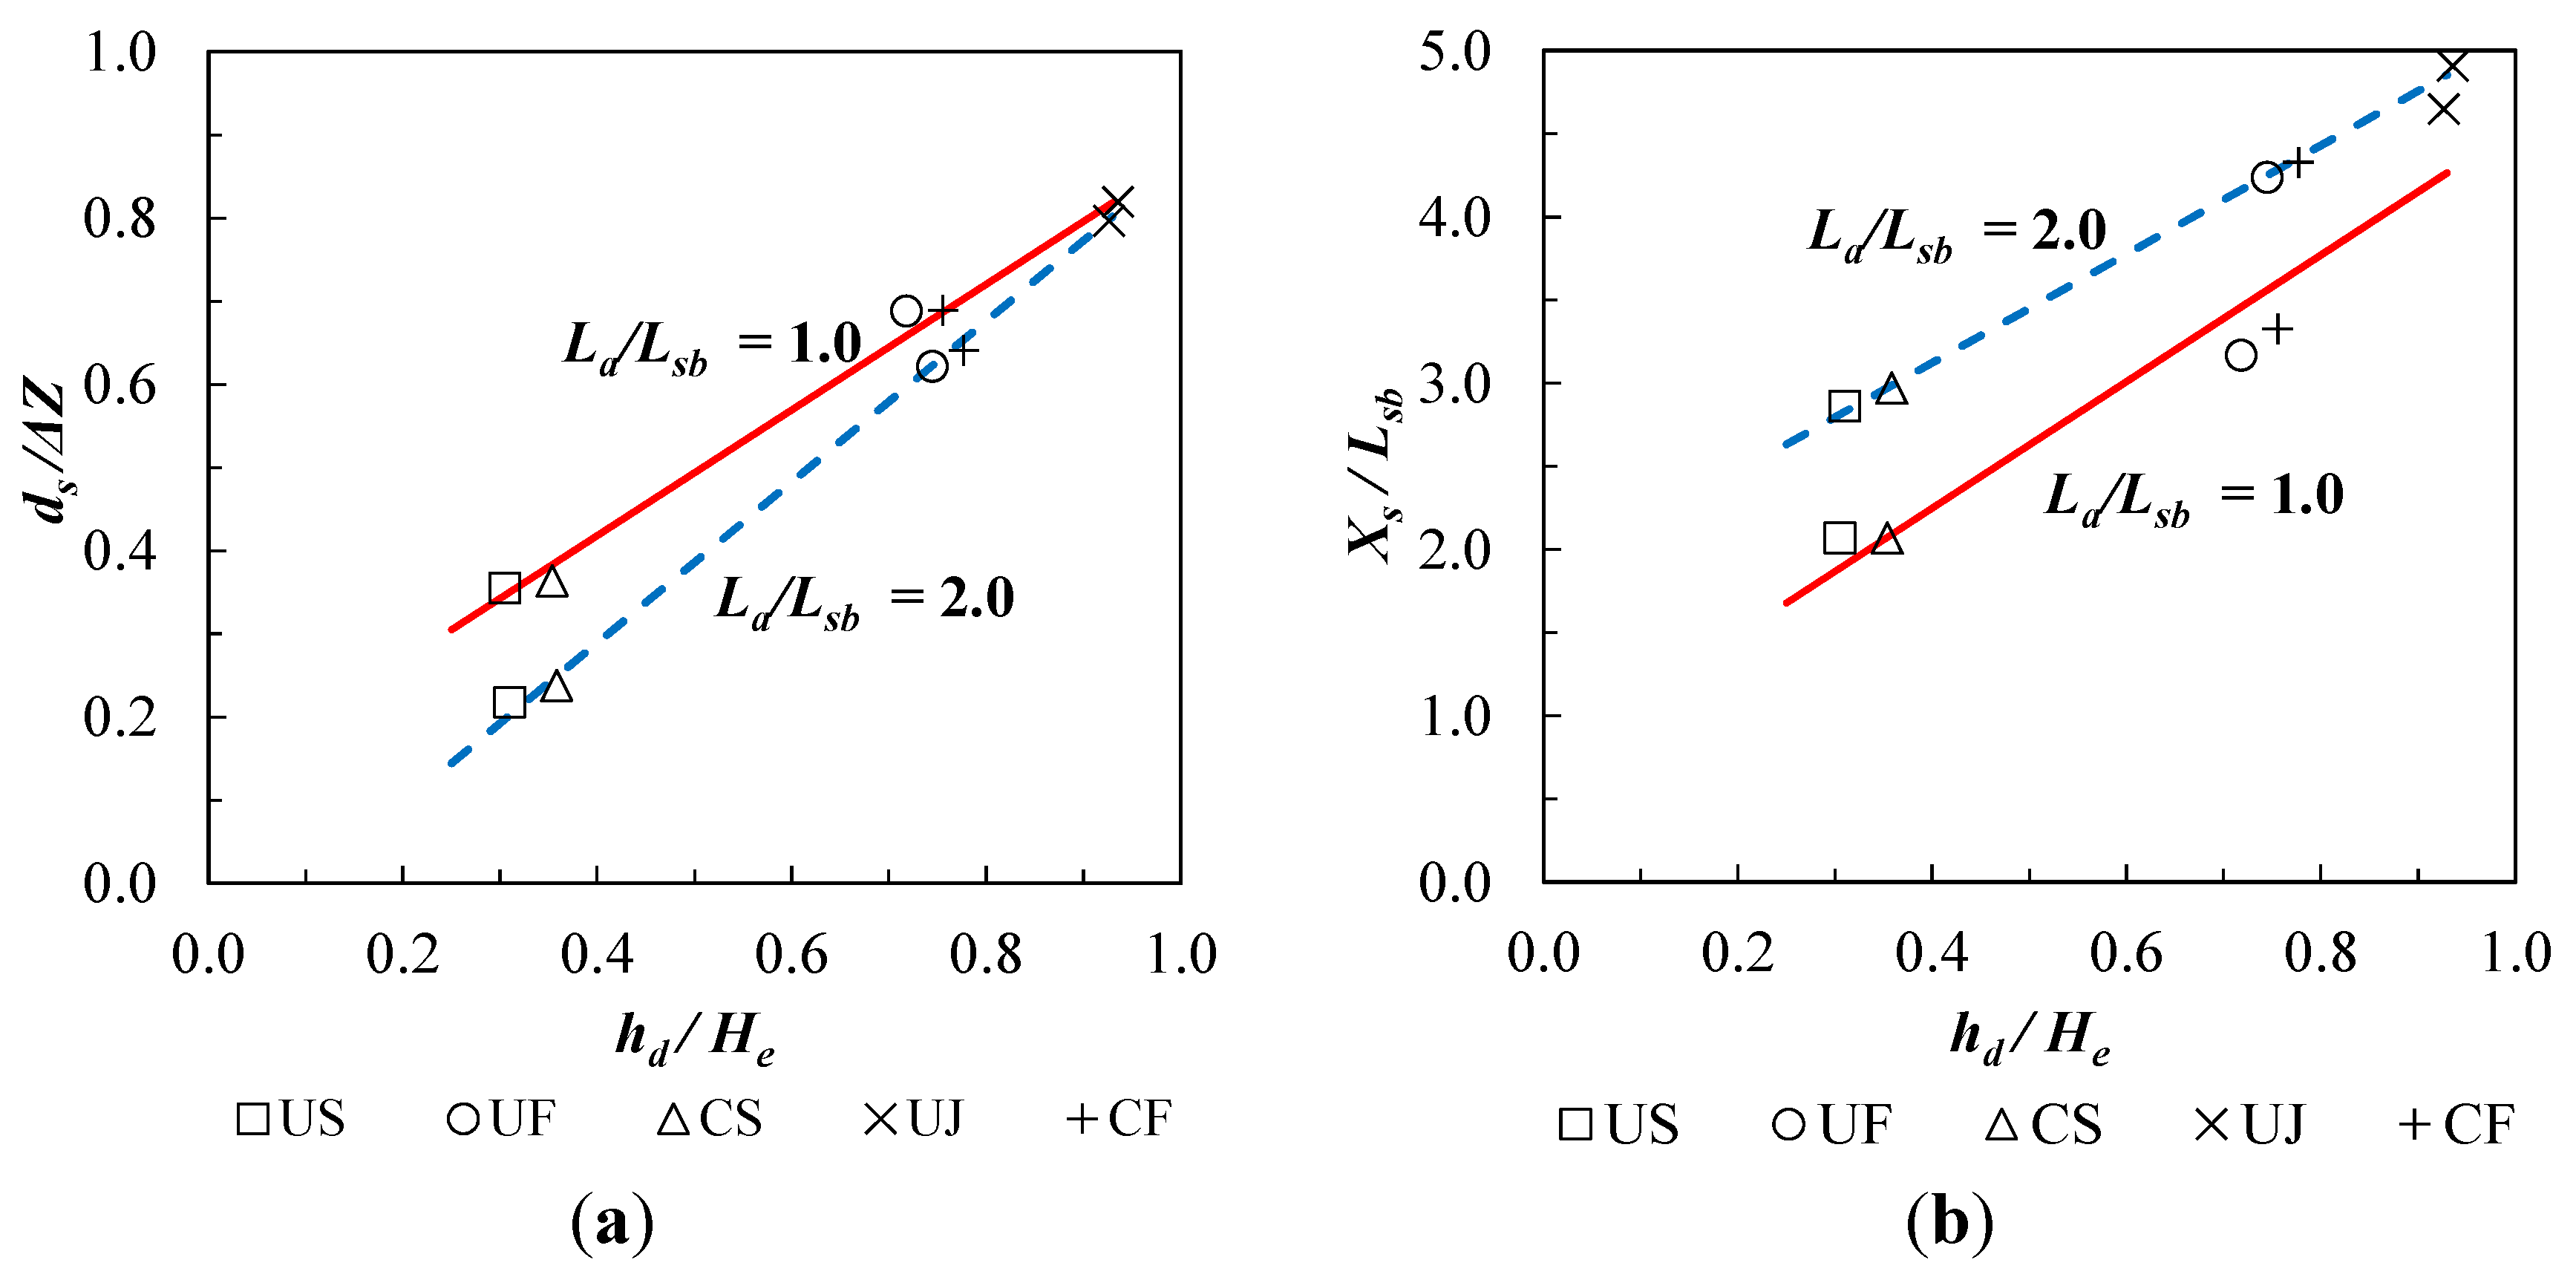
(a) Maximum scour depth for riprap apron lengths of La/Lsb = 1.0 and 2.0; (b) Location of maximum scour depth relative to stilling basin end sill for La/Lsb = 1.0 and 2.0.
Figure 5.
(a) Maximum scour depth for riprap apron lengths of La/Lsb = 1.0 and 2.0; (b) Location of maximum scour depth relative to stilling basin end sill for La/Lsb = 1.0 and 2.0.
For each apron length, maximum scour depth
ds and its distance downstream of the stilling basin end sill
Xs both increased with increasing differential head
hd associated with decreasing tailwater elevation as shown in
Figure 5. For a given apron length,
ds and
Xs were relatively insensitive to the flow being controlled or uncontrolled; instead, the degree of submergence relative to submerged, free, or jet flow classifications was paramount in determining maximum scour depth and location. In general, the increased apron length reduced
ds and increased
Xs except for the UJ flow case for which there was relatively little influence of apron length. Doubling the apron length reduced
ds by approximately 38% and 34% for US and CS flows, respectively, while it was reduced by approximately 9% and 7% for UF and CF flows, respectively. The values of
Xs increased by about 40% for US and CS flows and about 30% for UF and CF flows. These results show that increasing the riprap apron length effectively reduced maximum scour depth and moved it further downstream in both submerged and free flows but not for UJ flow on which its influence was minor.
For the UF and CF flows, the free hydraulic jump in the stilling basin was effective in energy dissipation but scour still occurred. Submergence of both the jump and the spillway itself in US and CS flows reduced scour compared to CF and UF flows partly due to smaller mean flow velocities downstream of the stilling basin. In the UJ jet flow case, sweeping out of the hydraulic jump caused severe disturbance in the water surface profile downstream of the stilling basin [
15] and the largest scour depth. Although the longer riprap apron with greater surface roughness lengthened the zone of water surface disturbance, the maximum scour depth and its location were virtually the same as for the shorter apron.
3.2. Flow Fields
Velocity profiles for submerged flow, both uncontrolled and controlled, are shown in
Figure 6 prior to scour. The streamwise point velocities are nondimensionalized by a reference bulk velocity,
U, at the location of the spillway crest, while the vertical coordinate
y is nondimensionalized by the local depth,
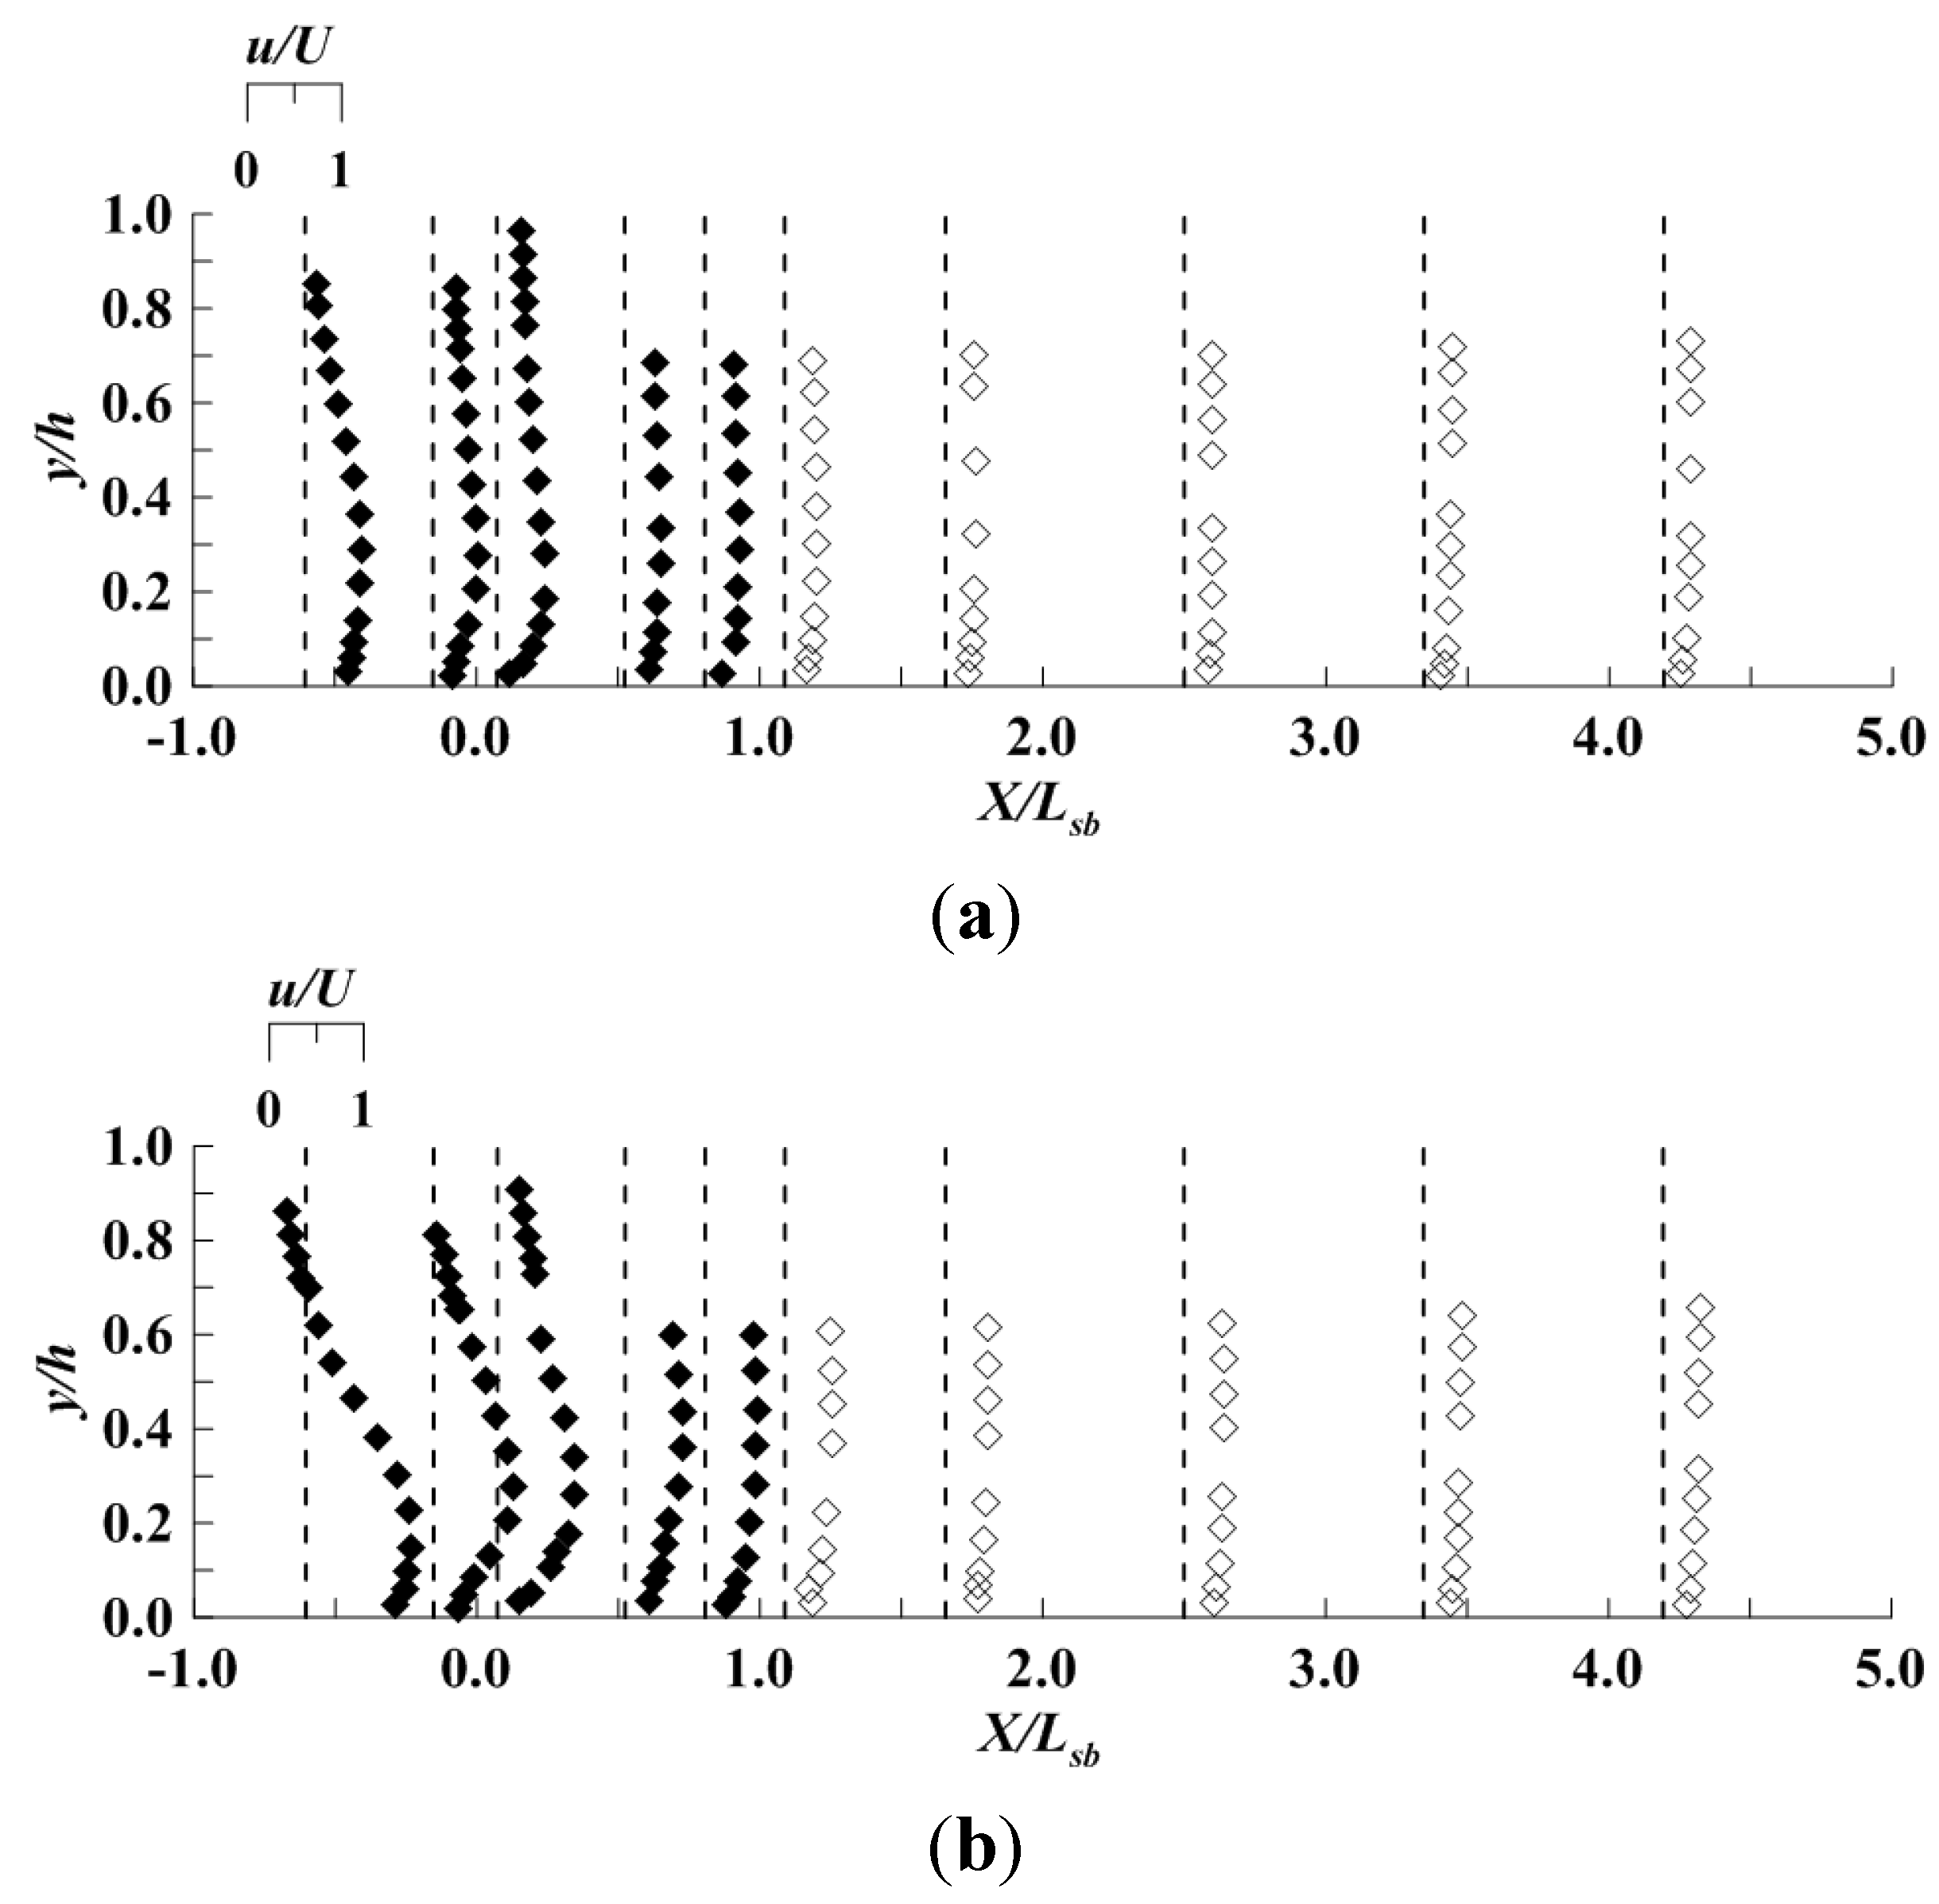
h, which is determined by the water surface and bed profiles. A prominent bulge occurred in the CS flow velocity profile in
Figure 6b at
y/
h ≈ 0.2 within the stilling basin due to plunging of the submerged jet and an overlying reverse flow circulation; however, the bulge of excess velocity mixed upward within the stilling basin and over the riprap apron rapidly such that a monotonic increase in streamwise velocity with distance above the bed occurred at the exit from the riprap apron (
X/
Lsb = 1.0) and was maintained over the scour zone. For the US flow in
Figure 6a, the velocity bulge was at a slightly higher elevation and less pronounced; however, flow visualization showed a reverse circulation in the upper part of the flow in the stilling basin as for CS flow but in a thinner layer near the free surface. Taking into account the difference in reference velocities for the CS flow
vs. the US flow, the velocity profiles downstream of the riprap apron had a similar shape and magnitude near the bed consistent with maximum scour depths that were nearly the same for these two submerged flow cases.
For comparison with the submerged flow velocity profiles in
Figure 6, unsubmerged or free flow profiles can be seen in
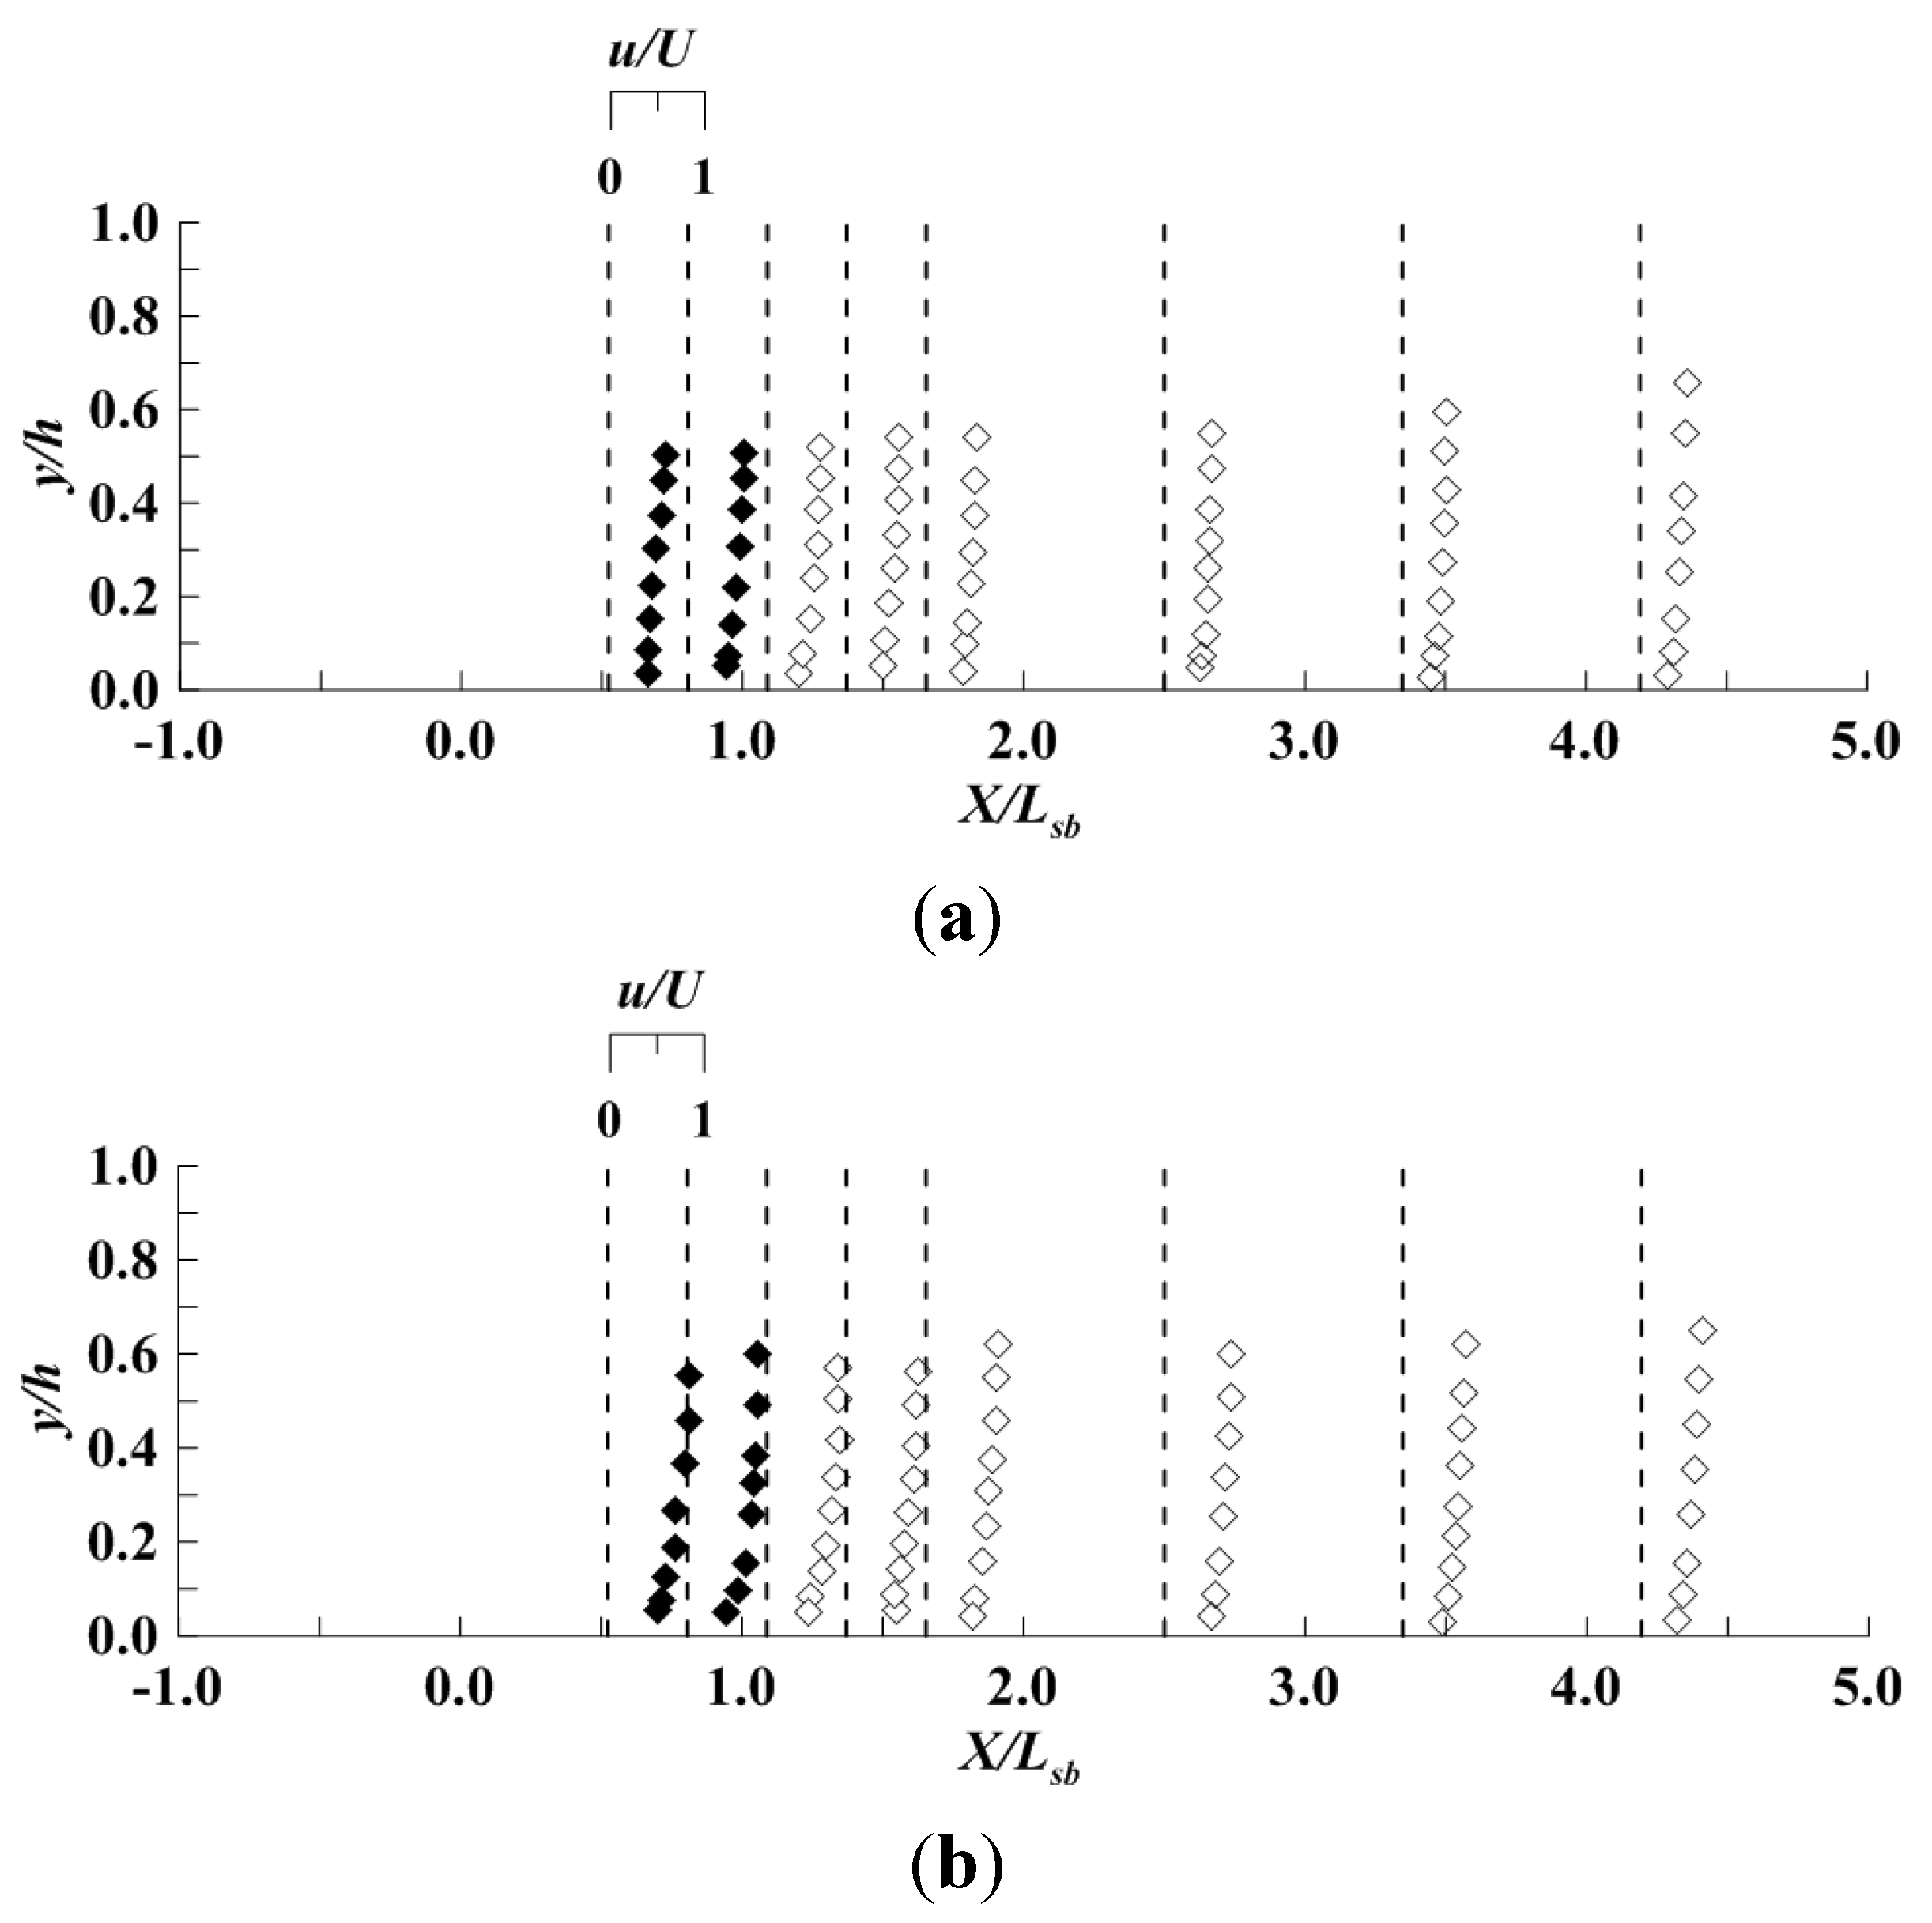
Figure 7. Because of entrained air and flow separation within the stilling basin due to the hydraulic jump, only velocity profiles after the jump are shown downstream of the stilling basin where the flow had reattached and air bubbles had dissipated. Velocity profile shapes and maximum velocities near the bed are similar for the UF and CF flows in
Figure 7 which accounts for similar maximum scour depths for these two unsubmerged flow cases. The combination of the blocks and end sill in the stilling basin, and the flow over the riprap apron, resulted in significant energy dissipation and vertical mixing of the nonuniform velocity profile within the jump itself. However, scour depths were significantly larger for the free flow cases in
Figure 7 than for submerged flows shown in
Figure 6 primarily because of lower tailwater elevations and higher velocities in the free flows near the bed.
Figure 6.
Vertical velocity profiles of non-dimensional values of u in submerged flow for La/Lsb = 1.0: (a) Run 1 (US; Umodel = 1.40 m/s) and (b) Run 3 (CS; Umodel = 1.03 m/s). (Closed symbols above stilling basin floor and riprap apron; open symbols for scour region).
Figure 6.
Vertical velocity profiles of non-dimensional values of u in submerged flow for La/Lsb = 1.0: (a) Run 1 (US; Umodel = 1.40 m/s) and (b) Run 3 (CS; Umodel = 1.03 m/s). (Closed symbols above stilling basin floor and riprap apron; open symbols for scour region).
An examination of near-bed velocities for the longer riprap apron at y/h = 0.10, which was the vertical location where maximum turbulent kinetic energy was found, revealed that they had nearly the same magnitude at X/Lsb = 2.5 just downstream of the end of the apron as at the corresponding downstream distance for the shorter apron for both submerged and free flows. Defining the bed velocity as the streamwise velocity ub at y/h = 0.10, and nondimensionalizing it by the critical shear velocity u*c, values of ub /u*c were approximately 14.5 for US and CS flows at X/Lsb = 1.1 and 2.5 regardless of the apron length. Similarly, values of ub/u*c for UF and CF flows were approximately 18.0 at X/Lsb = 1.1 and 2.5 for both apron lengths. Hence, the values of streamwise velocities near the bed are consistent with observed larger scour depths for free flow as opposed to submerged flow, but they do not seem to explain the observed smaller maximum scour depths for the longer riprap apron.
Figure 7.
Vertical velocity profiles of non-dimensional values of u in unsubmerged flow for La/Lsb = 1.0: (a) Run 2 (UF; Umodel = 1.35 m/s) and (b) Run 4 (CF; Umodel = 1.03 m/s). (Closed symbols above stilling basin floor and riprap apron; open symbols for scour region).
Figure 7.
Vertical velocity profiles of non-dimensional values of u in unsubmerged flow for La/Lsb = 1.0: (a) Run 2 (UF; Umodel = 1.35 m/s) and (b) Run 4 (CF; Umodel = 1.03 m/s). (Closed symbols above stilling basin floor and riprap apron; open symbols for scour region).
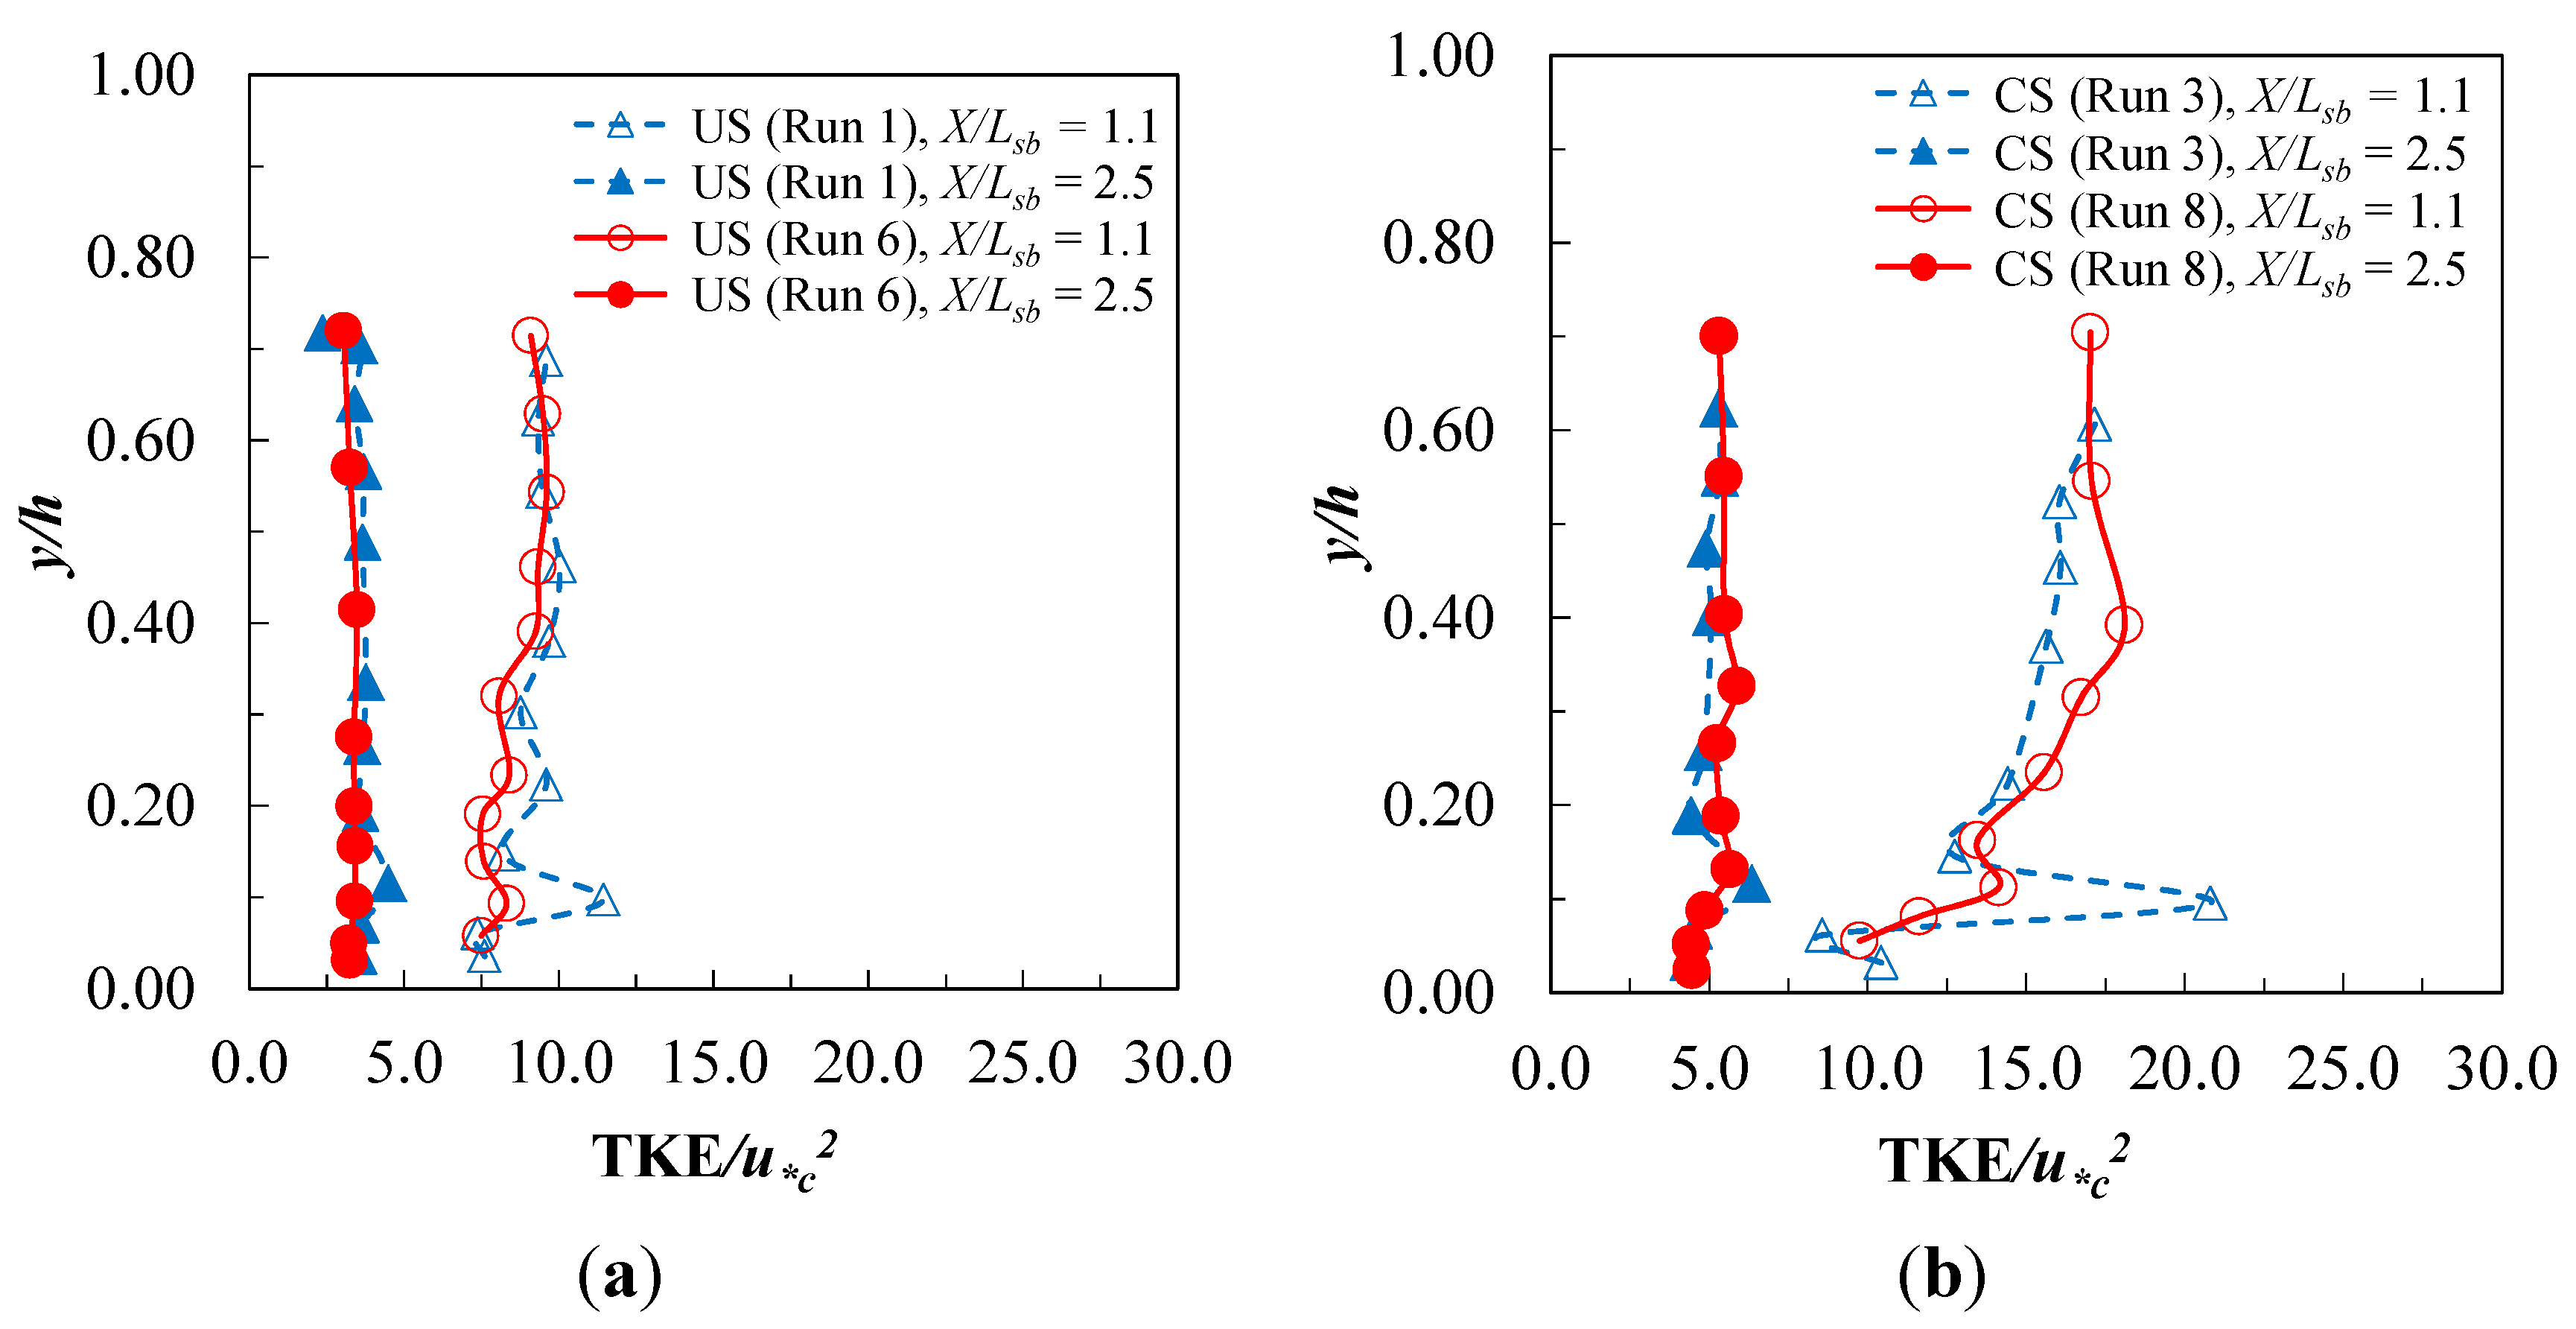
In order to further study the effect of riprap apron length on maximum scour depth, vertical profiles of turbulent kinetic energy (TKE) prior to scour were measured along the length of the stilling basin and downstream scour area where
, and the symbols < > refer to a time average of the enclosed component of turbulent velocity fluctuation squared. Profiles for CS and US flows are shown in
Figure 8 at two stations,
X/
Lsb = 1.1 and 2.5, each just downstream of the end of the short and long riprap aprons, respectively. The profiles show a relatively constant value of TKE over much of the depth, except for a maximum value near the bed, and there is general diminishment in TKE over the full depth in the streamwise direction. Reverse circulation in the upper portion of the stilling basin created a shear zone that likely contributed to elevated TKE that persisted into the scour zone albeit at a diminishing rate as the jet flow profile recovered. Although not showing TKE profiles, Dey and Sarkar [
4] presented similar profile shapes for longitudinal and vertical turbulence intensities downstream of a sluice gate from which a submerged wall jet issued onto a solid apron.
The value of TKE
max near the bed was determined for each measured vertical profile, and downstream of the stilling basin it was found to occur at a relative depth of
y/h ≈ 0.10 for both submerged and free flows regardless of the riprap apron length. Biron
et al. [
22] suggested that the maximum TKE in a vertical profile, which occurred in their experiments of flow around lateral deflectors at
y/h ≈ 0.10, was the best indicator of bed shear stress when multiplied by a constant factor of 0.19. In an experimental study of scour around bridge abutments, Hong
et al. [
23] showed that elevated values of TKE near the bed prior to scour were coincident with maximum local scour depths caused by flow separation and accompanying turbulent eddies as the flow was blocked and diverted around the abutment.
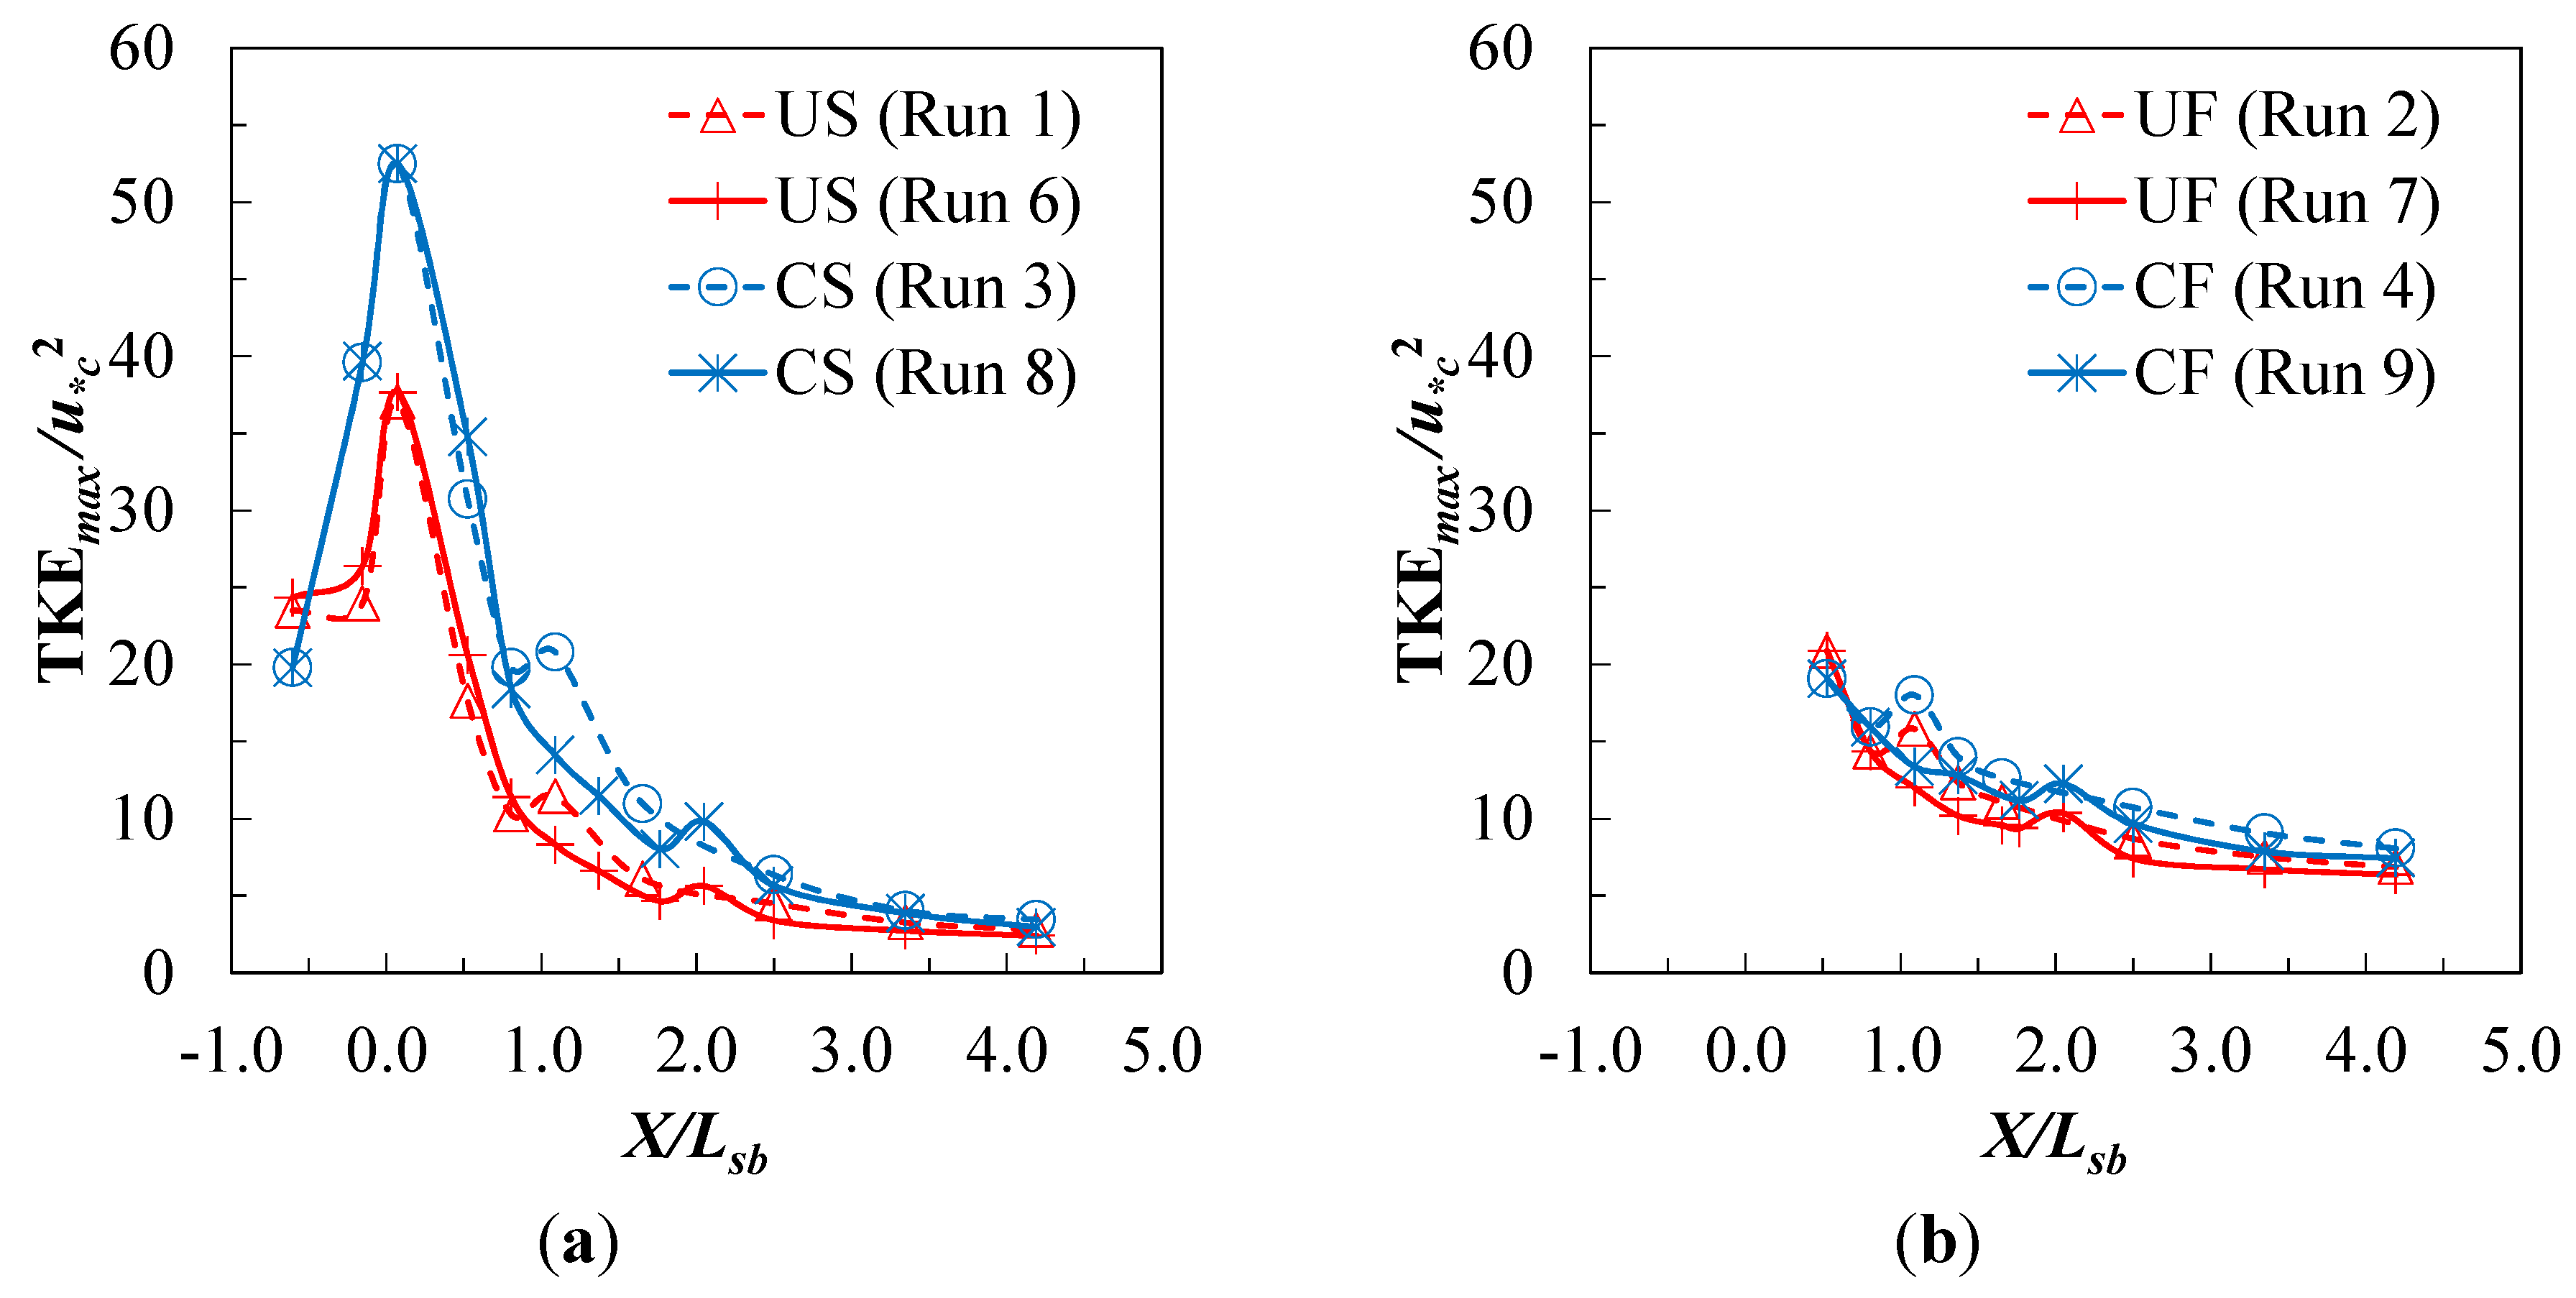
Streamwise profiles of TKE
max for submerged and free flows are shown in
Figure 9. For the submerged flows in this study, the largest value of TKE
max occurred just downstream of the end sill of the stilling basin (
X/
Lsb = 0.073) as shown in
Figure 9a. At this location, TKE
max/
u*c2 for CS flow was 53 while it was 37 for US flow. The difference in these maximum values may be attributable to flow separation and turbulence production near the bed due to the plunging jet in CS flows and its impact with the end sill. Downstream of the largest near-bed TKE values, rapid decay of TKE occurred due to turbulent energy dissipation such that less difference in TKE existed between CS and US flows in the downstream direction. Bed roughness contribution to the TKE distribution can be observed as a slight local rise in TKE at the transition from the end of the riprap apron to the sand bed at
X/
Lsb = 1.0 for the short riprap apron and
X/
Lsb = 2.0 for the long apron. The maximum scour-depth location was
X/
Lsb ≈ 2.0 for the short apron where TKE
max was considerably higher than for the longer apron with maximum scour depth at
X/
Lsb ≈ 3.0. Thus, the greater decay of TKE for the longer riprap apron may contribute to the observed smaller scour depths for this case. What also follows from this interpretation is that further increases in riprap apron length may not be useful because TKE
max approached a constant value in the downstream direction. For UF and CF flows, the TKE
max distribution shown in
Figure 9b decayed more rapidly but to a higher constant value than for submerged flows consistent with greater scour depths but still with some influence of riprap apron length due to shifting of the scour region downstream by the longer apron where TKE
max was slightly less. Although accurate measurements of TKE and velocity distributions could not be made for the UJ flow due to shallow depths and extreme free-surface fluctuations, it is possible that rapid dissipation of turbulent energy in the streamwise direction to a constant value for this case resulted in essentially no influence of riprap apron length on maximum scour depths.
Figure 8.
Vertical profiles of TKE just downstream of end of riprap aprons at X/Lsb = 1.1 and 2.5 for (a) US flow and (b) CS flow.
Figure 8.
Vertical profiles of TKE just downstream of end of riprap aprons at X/Lsb = 1.1 and 2.5 for (a) US flow and (b) CS flow.
Figure 9.
Streamwise distribution of maximum TKE near the bed for (a) submerged flows and (b) free flows.
Figure 9.
Streamwise distribution of maximum TKE near the bed for (a) submerged flows and (b) free flows.


