Article

Assessing the Effects of Periodic Flooding on the Population Structure and Recruitment Rates of Riparian Tree Forests

by
Jean-Sébastien Berthelot
1,
Diane Saint-Laurent
2,*,
Verhnar Gervais-Beaulac
1 and
Dominic Savoie
1
1
Environmental Science, Université du Québec à Trois-Rivières, C.P. 500, Trois-Rivières, QC G9A 5H7, Canada
2
Laboratoire de recherche en géomorphologie fluviale et sols, Université du Québec à Trois-Rivières, C.P. 500, Trois-Rivières, QC G9A 5H7, Canada
*
Author to whom correspondence should be addressed.
Water 2014, 6(9), 2614-2633; https://doi.org/10.3390/w6092614
Submission received: 4 June 2014 / Revised: 12 August 2014 / Accepted: 14 August 2014 / Published: 27 August 2014
(This article belongs to the Special Issue Wetlands and Sustainability)

Abstract

:
Riparian forest stands are subjected to a variety of hydrological stresses as a result of annual fluctuations in water levels during the growing season. Spring floods create additional water-related stress as a result of a major inflow of water that floods riverside land. This exploratory study assesses the impacts of successive floods on tree dynamics and regeneration in an active sedimentation area, while determining the age of the stands using the recruitment rates, tree structure and tree rings based on dendrochronological analysis. Environmental data were also recorded for each vegetation quadrat. In total, 2633 tree stems were tallied throughout the quadrats (200 m2), and tree specimens were analyzed based on the various flood zones. A total of 720 specimens were counted (100 m2 strip) to measure natural regeneration. Higher recruitment rates are noted for the no-flood zones and lower rates in active floodplains. During the period of the establishment of tree species, the survival rates are comparable between the flood zones and the no-flood zones. Tree diameter distribution reveals a strong predominance of young trees in flooded areas. Different factors appear to come into play in the dynamics of riparian forest stands, including the disruptions associated with successive flooding.

1. Introduction

For riparian forest stands, variations in the water balance (e.g., floods, low and high stream flows) is an important factor that acts on tree growth [1,2]. In cold temperate regions, spring floods associated with the thawing of the snow cover create additional water stress as a result of a major inflow of water that floods the riparian areas, sometimes over a period of several days or weeks, which can hinder the growth of certain species or even cause them to die [3,4]. Floods can also strip surface litter and uproot young shrubs and tree saplings not able to withstand the strong currents associated with high stream flows [5,6]. All of these factors associated with successive floods necessarily create a long-term change in tree composition and the structure of riparian forest stands affected by such special water conditions [7,8,9].
Various approaches are used in the assessment of the change in the structure of forest stands, including the measurement of tree growth based on indicators, such as height and diameter and tree ring patterns [10,11,12]. Tree age-class structure and distribution are also the most commonly used parameters for describing forest stands and assessing changes in individuals from the same tree species [12,13,14]. These measurements may sometimes be carried over or extrapolated to smaller-scale wooded areas in order to obtain an overview of changes in the forest cover. Furthermore, the establishment of the age bracket grouping individuals from the same community or wooded area helps decipher the overall stand structure. This allows changes to the stand to be tracked using different observation scales [14,15,16]. In the natural environment, however, it is known that environmental conditions and various disturbances (allogenic or autogenic) can induce marked differences between the stands, in particular with respect to the composition, structure, tree diameter and age of the individuals [15,16,17].
In previous studies [4,7,12,14], the sampling sites of the selected stands were often located in controlled experimental sites, natural or protected forest areas, or sites with few environmental constraints. However, studies on riparian vegetation subjected to periodic flooding are rarer [13,18], especially for areas affected by successive flooding, which causes alluvial plain aggradation [5,19]. One of the major disruptions that needs to be considered in fluvial environments is the successive effect of floods on forest stands. Frequent floods and heavy flooding are dominant factors in the dynamics and structure of riparian stands [20,21]. It is known that heavy floods can cause considerable destruction of trees. Furthermore, it is recognized that the flood regime and sediment mobility are responsible for the configuration of channels, floodplains and riparian vegetation [22,23]. Furthermore, the physiological characteristics of forest communities may indeed vary depending on soil and sediment properties, as well as the microtopography of the riverbanks, which are gradually shaped by successive floods [18,21,24].
The aim of this study is to: (1) assess the effects of frequent floods on the regeneration of tree seedlings and saplings in the areas affected by successive flooding; and (2) measure the structure of tree populations in different flooded areas and outside of the floodplains. We also examined the edaphic conditions associated with forest stands. The aim of this study is to better understand the dynamics of these wooded areas that are affected by frequent flooding, especially over the last 30 years and which take the form of an increase in the frequency of flooding and earlier spring snow melts in southern Québec [6,19,25]. This study could also serve to establish a frame of reference that could be used to monitor changes in these wooded areas and possibly to recommend restoration measures for riverside areas.

2. Materials and Methods

2.1. Study Area

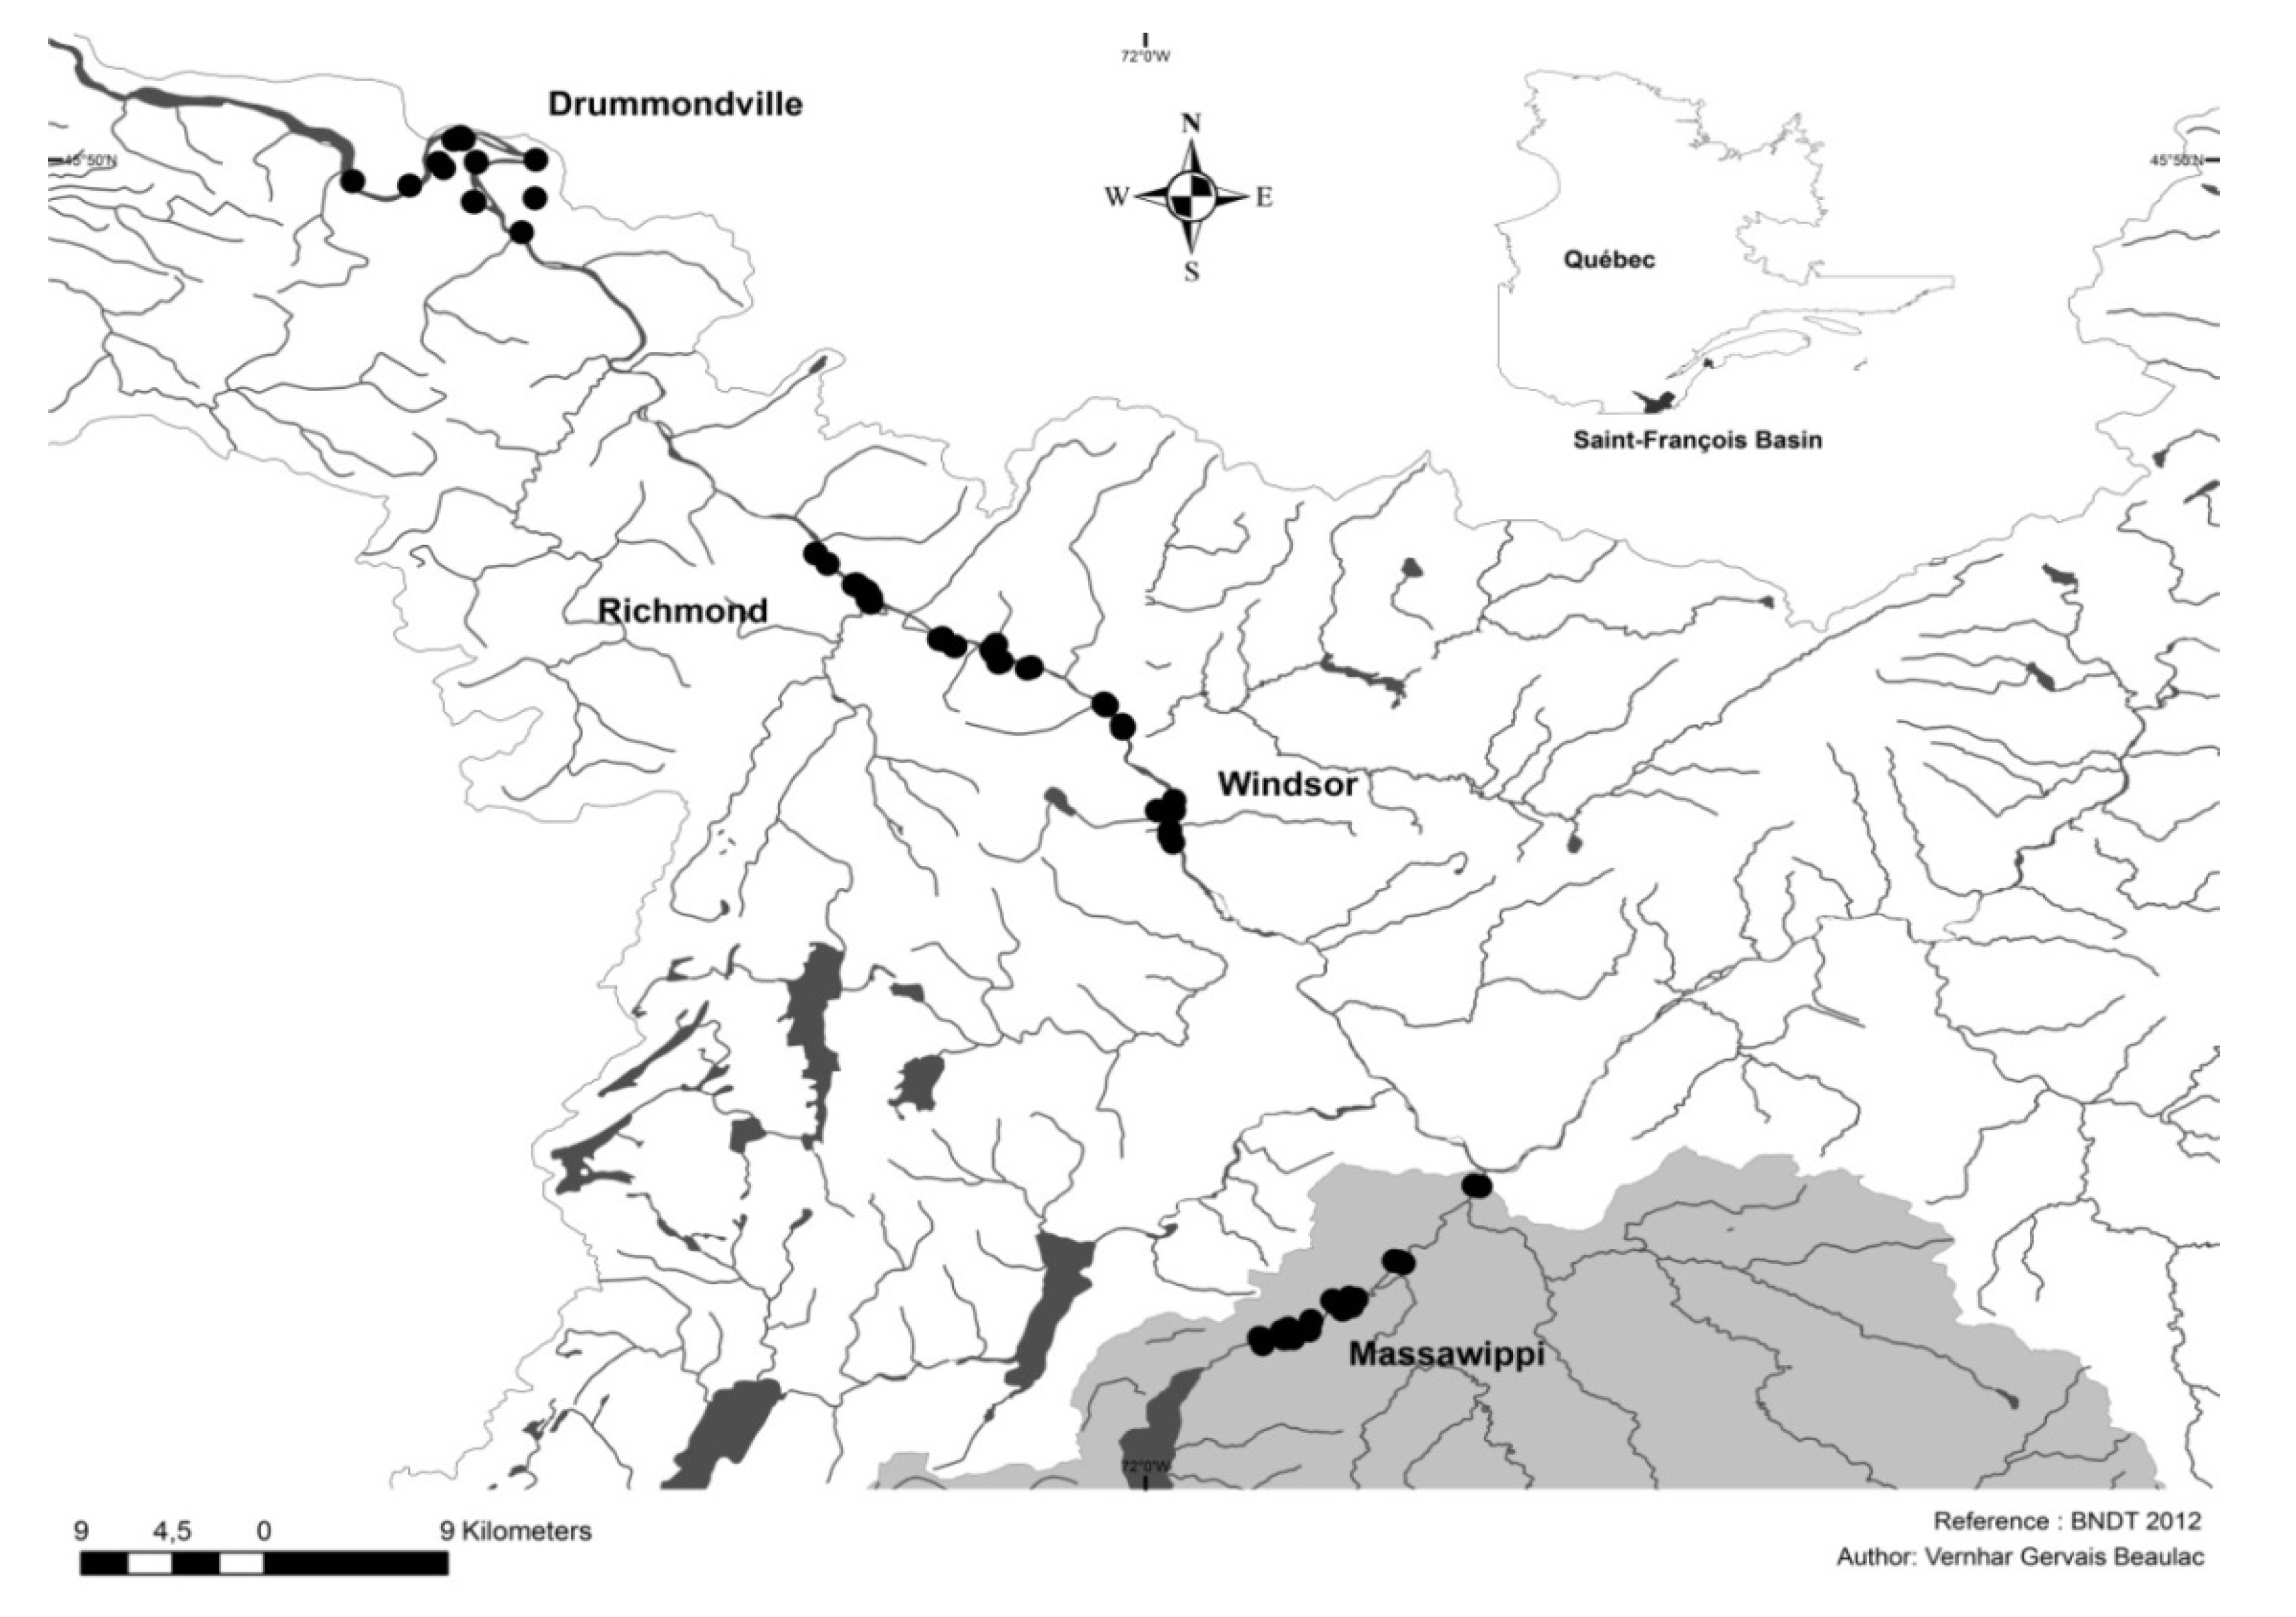
The forest stands under study are located along the Massawippi and Saint-François rivers, which occupy the large Saint-François River catchment in south-central Québec (Figure 1). These two rivers contain river sections considered to be flood-risk zones for which official government maps have been created [26,27]. The forest areas are mainly found on the riverbanks and are characterized by stands of red and black ash (Fraxinus pennsylvanica Marsh.; Fraxinus nigra Marsh.) and silver maple (Acer saccharinum L.). The areas outside the floodplains are mainly characterized by mixed stands made up of red maple (Acer rubrum L.), sugar maple (Acer saccharum L.), balsam fir (Abies balsamea Mill.) and hemlock (Tsuga canadensis L.). The forest areas in the floodplains under study are generally made up of young stands, whereas the areas outside the floodplains contain forests that are more representative of uneven-aged stands with individuals of all ages, but mainly young trees with a few old ones. The age structure distribution curve has a somewhat asymmetrical unimodal shape typical of Eastern North American forests [12,22].
Figure 1. Location of sampling sites along the Massawippi and Saint-François rivers (Southern Québec, Canada) [28].
Water 06 02614 g001
A diachronic analysis of forest stands conducted for the periods of 2006–2010 and 1945–2000 in the middle portion of the Saint-François Basin [29,30] shows that the riverside forest areas have remained roughly the same in terms of land area, except for highly urbanized municipalities (e.g., Sherbrooke and Drummondville), where losses of wooded areas and farmland have been on the decline for the past few decades. For the other riverside areas less affected by urban development (e.g., Richmond, Windsor), however, an increase in wooded areas was noted, often to the detriment of cropland. Several wooded areas located on floodplains remained after 1945, and an expansion of the vegetation cover inside the riparian strip was even noted from 1945 to 2000. In the freshwater reach of the Saint-François River, there were gains in wooded areas for 1945–2000 (Table 1). These wooded areas are not always found on the riverbanks, as is the case in Richmond and Windsor, where there were gains especially outside the flood zones. Losses in wooded areas totalled 354 km2 from 1945 to 1979 and 733 km2 from 1945 to 2000, which is relatively minimal.
Table 1. Gains and losses in wooded areas along the Saint-François River between 1945 and 2000. Sources: compilation by the authors with georeferenced aerial photos [29,30].
PeriodGain in wooded area (km2)Loss in wooded area (km2)
1945–19792,598.04354.15
1945–200012,183.09733.77
A comparison of the years 2006 and 2010 using digital orthophotos also shows relatively minor changes in woodland areas for this period. For instance, for the downstream section of the Saint-François River (Drummondville, Saint-Nicéphore sector), the loss in woodlands is very small and estimated at 0.087 km2 and the gains at 0.024 km2 for 2006–2010. However, no major change was reported for the other sites that were studied for this area. Note that these forest entities are subject to various disturbances (both natural and man-made) and are a major component of existing man-made landscapes. It is important to gain a better understanding of the dynamics of these wooded areas, which are widespread along the rivers, which form common landscape units in the agricultural and agroforestry system in southern Québec and are that also representative of many parts of Eastern Canada.
The downstream section of the Massawippi River and the middle course of the Saint-François River are frequently affected by flooding, i.e., every 3 or 4 years (Table 2) [19], and these successive floods favour alluvial plain aggradation and progressively modify the riverside environment [5,29]. Based on the frequency of the floods that were surveyed and the sedimentary rates that were calculated [19] in floodplain zones (a recurrence interval of 0–20 years), a mean alluvial contribution of 14.9 mm y−1 is estimated with deviations from 6.0 to 27.0 mm y−1. Furthermore, the direct field observations indicate a sediment inflow of about 15–35 mm for a single flood event [19]. Table 2 shows the hydrological characteristics for the Massawippi and Saint-François rivers, which differ in particular through their width, length and flow regime. For instance, the mean annual discharge in the Saint-François River is 183 m3 s−1, and the peak discharge is 2080 m3 s−1 (Richmond sector). The mean annual and peak discharges of the Massawippi River are significantly lower, i.e., 10 m3 s−1 and 135 m3 s−1, respectively [27]. Data on flood occurrences from 1900 to 2013 are provided by sector for these two rivers.
Table 2. Hydrological characteristics and flood occurrences of the Massawippi (MAS) and Saint-François rivers (STF) in southern Québec. Sources of data: [26,27,29,30].
Massawippi and Saint-François Rivers/SectorsMean channel width (m)Mean channel height (m)Gauging station numberGeographic coordinatesPeriod recordedMean annual discharge (m3/s)Peak discharge (m3/s)Flood occurrence (1900–2013) *
MAS/Lennoxville301–1.502OE01945°17ʹ03ʺ N 71°57ʹ45ʺ W1952–19961013537
STF/Sherbrooke1401–1.502OE00545°24ʹ22ʺ N 71°53ʹ20ʺ W1919–20111011,55361
STF/Windsor1801–202OF00445°33ʹ50ʺ N 72°00ʹ21ʺ W1936–19721652,08027
STF/Richmond1801–202OF00145°39ʹ32ʺ N 72°08ʹ37ʺ W1915–19651832,08044
Note: * Uncertain dates of flood events have not been compiled in the table.

2.2. Field Measurements and Data Analysis

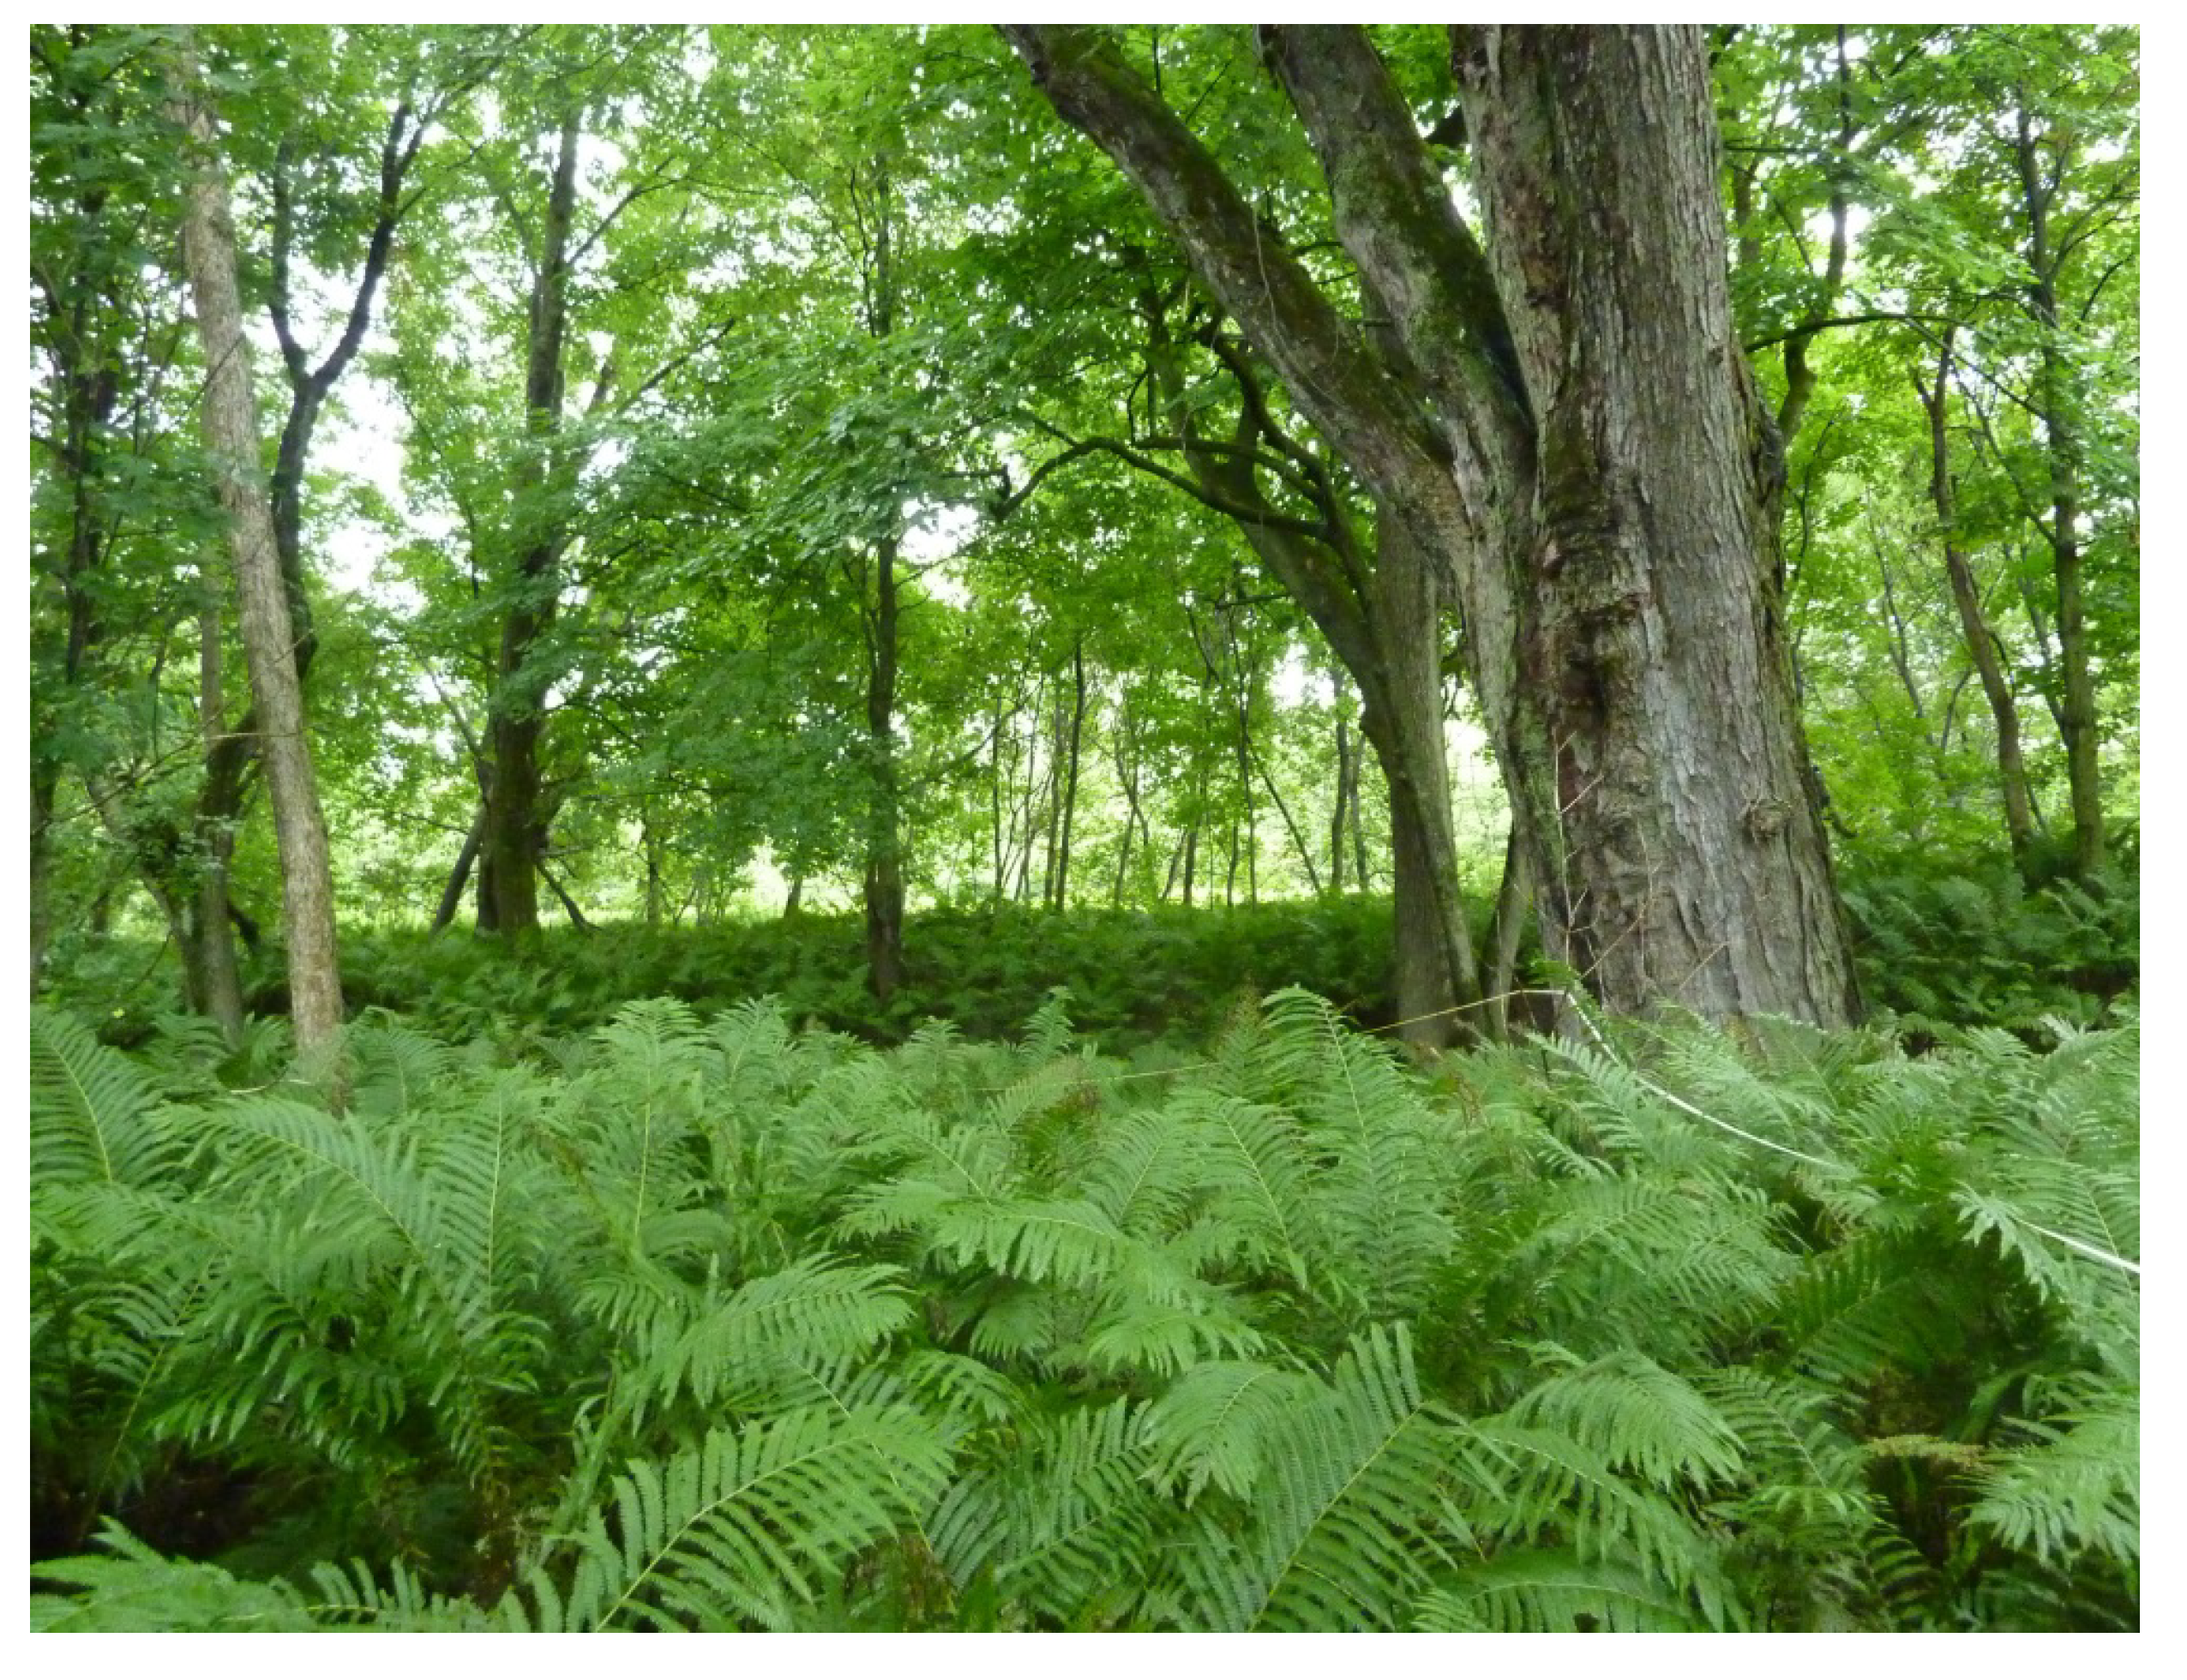
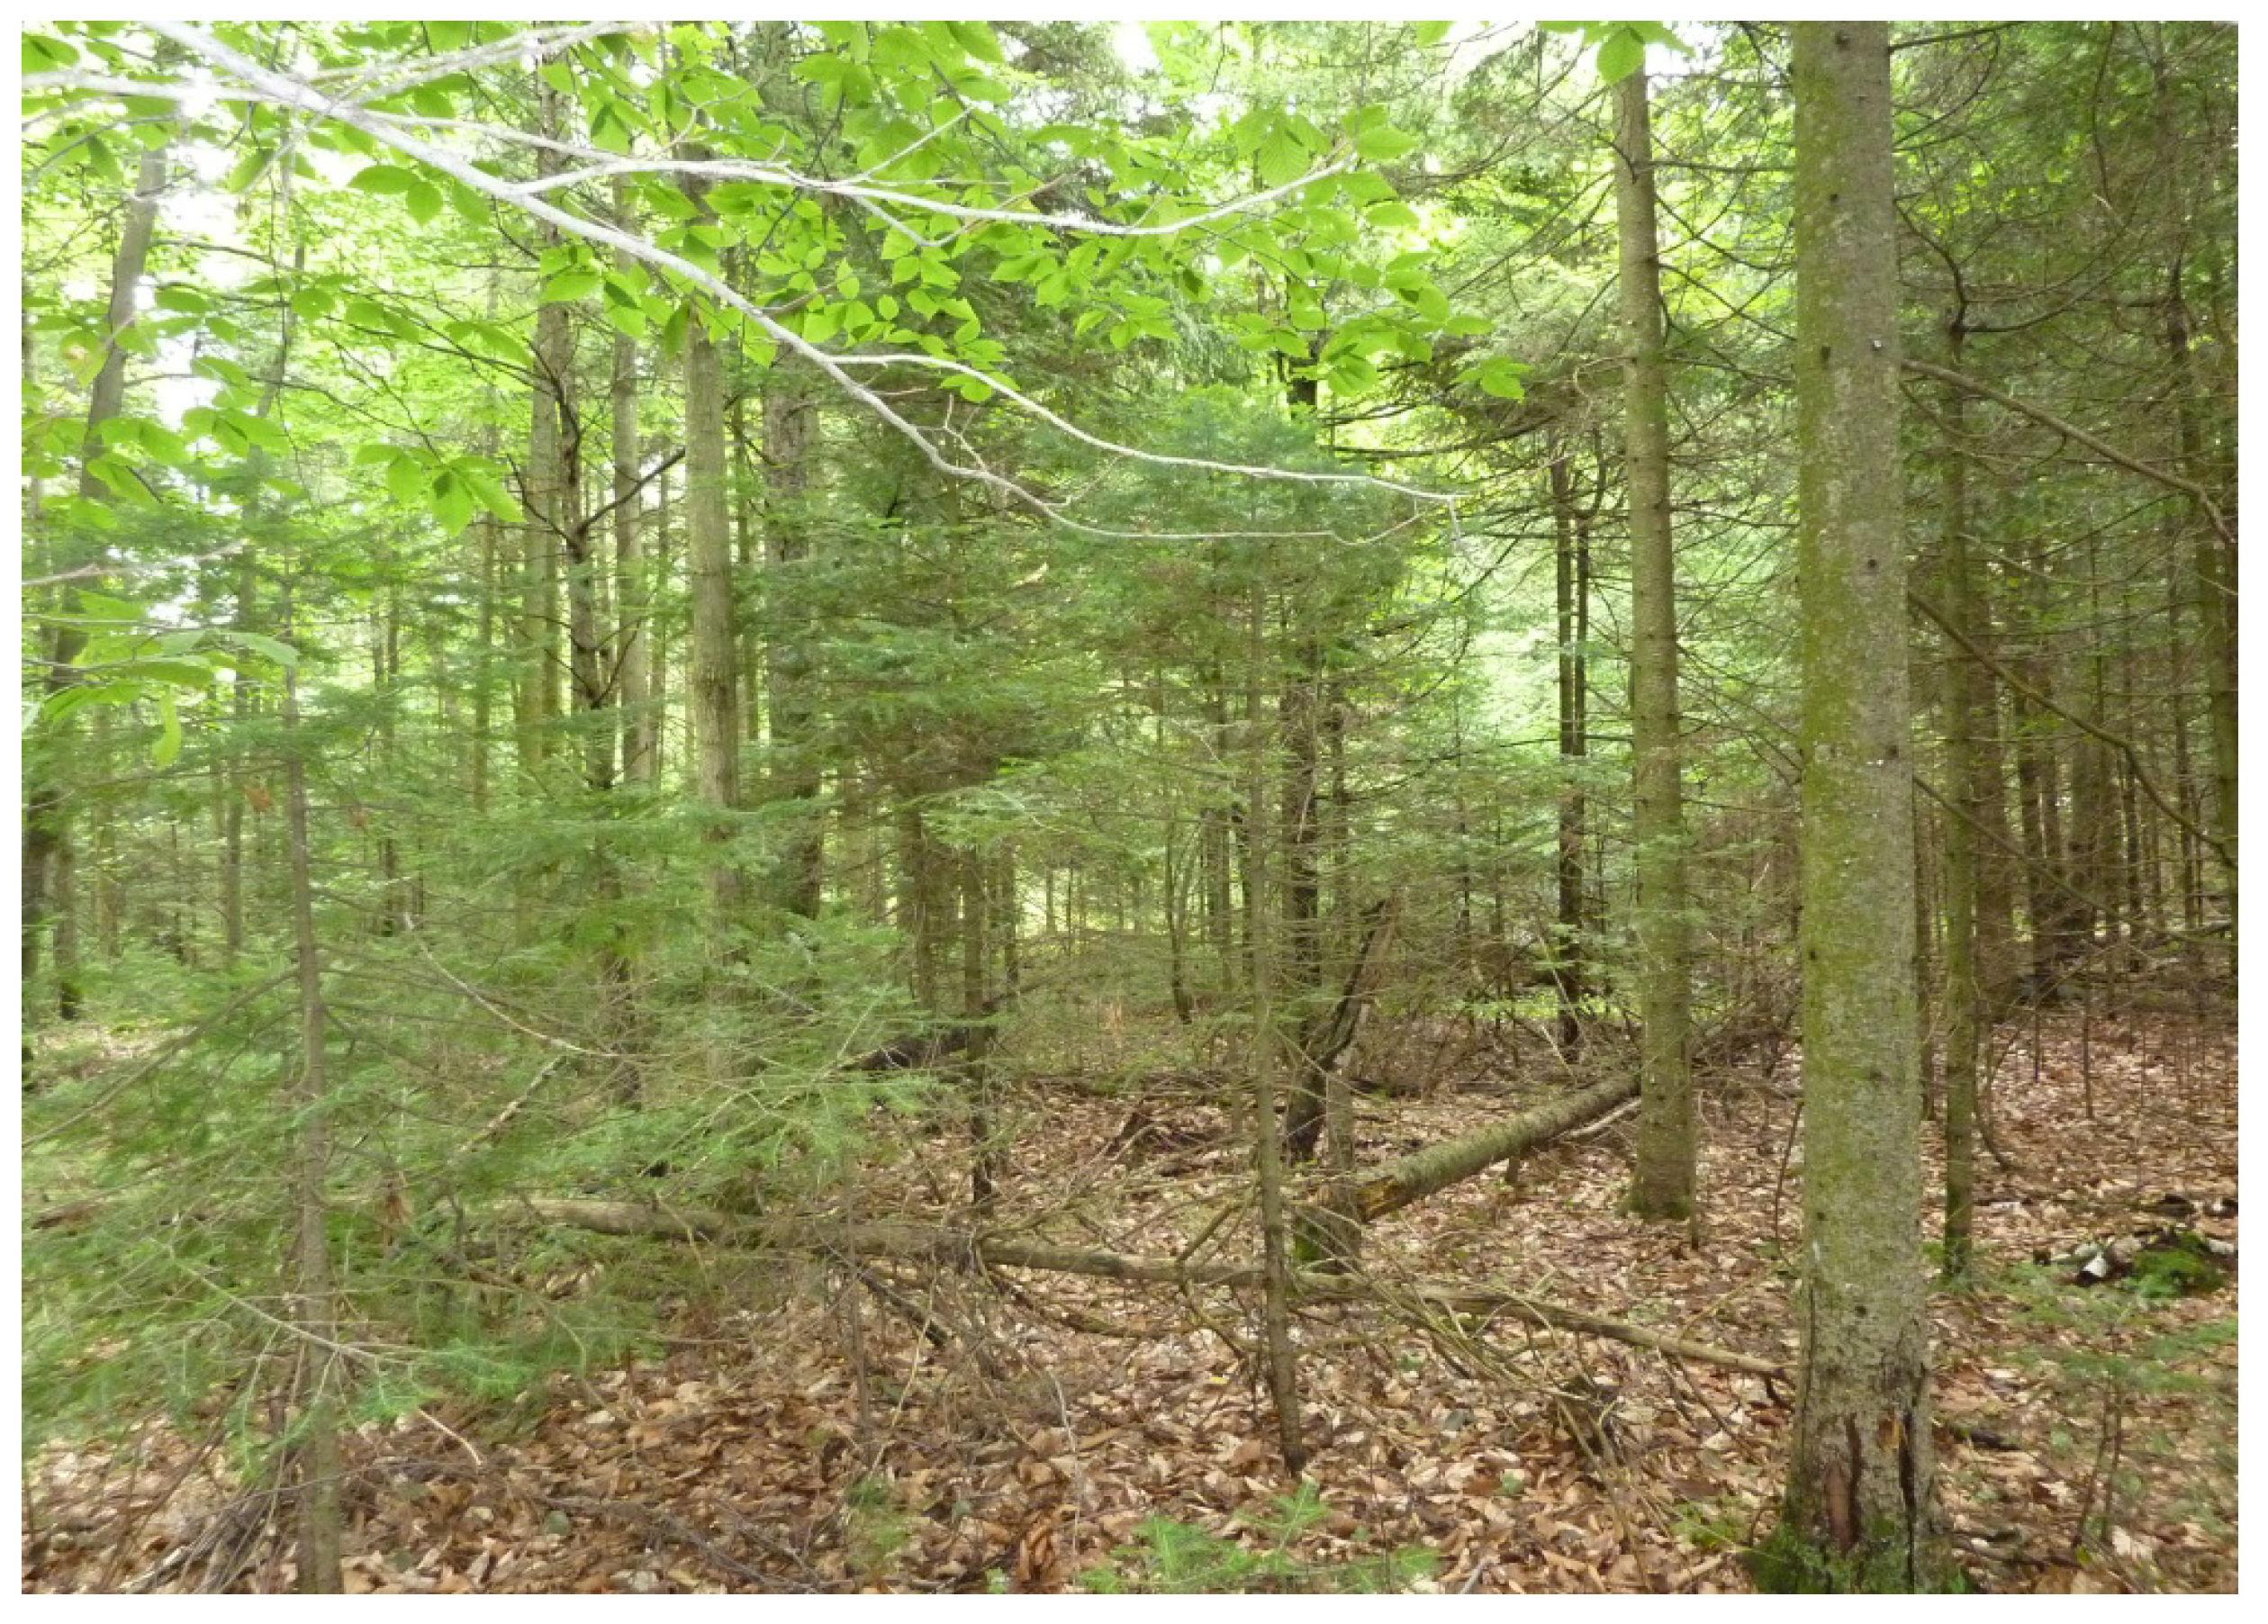
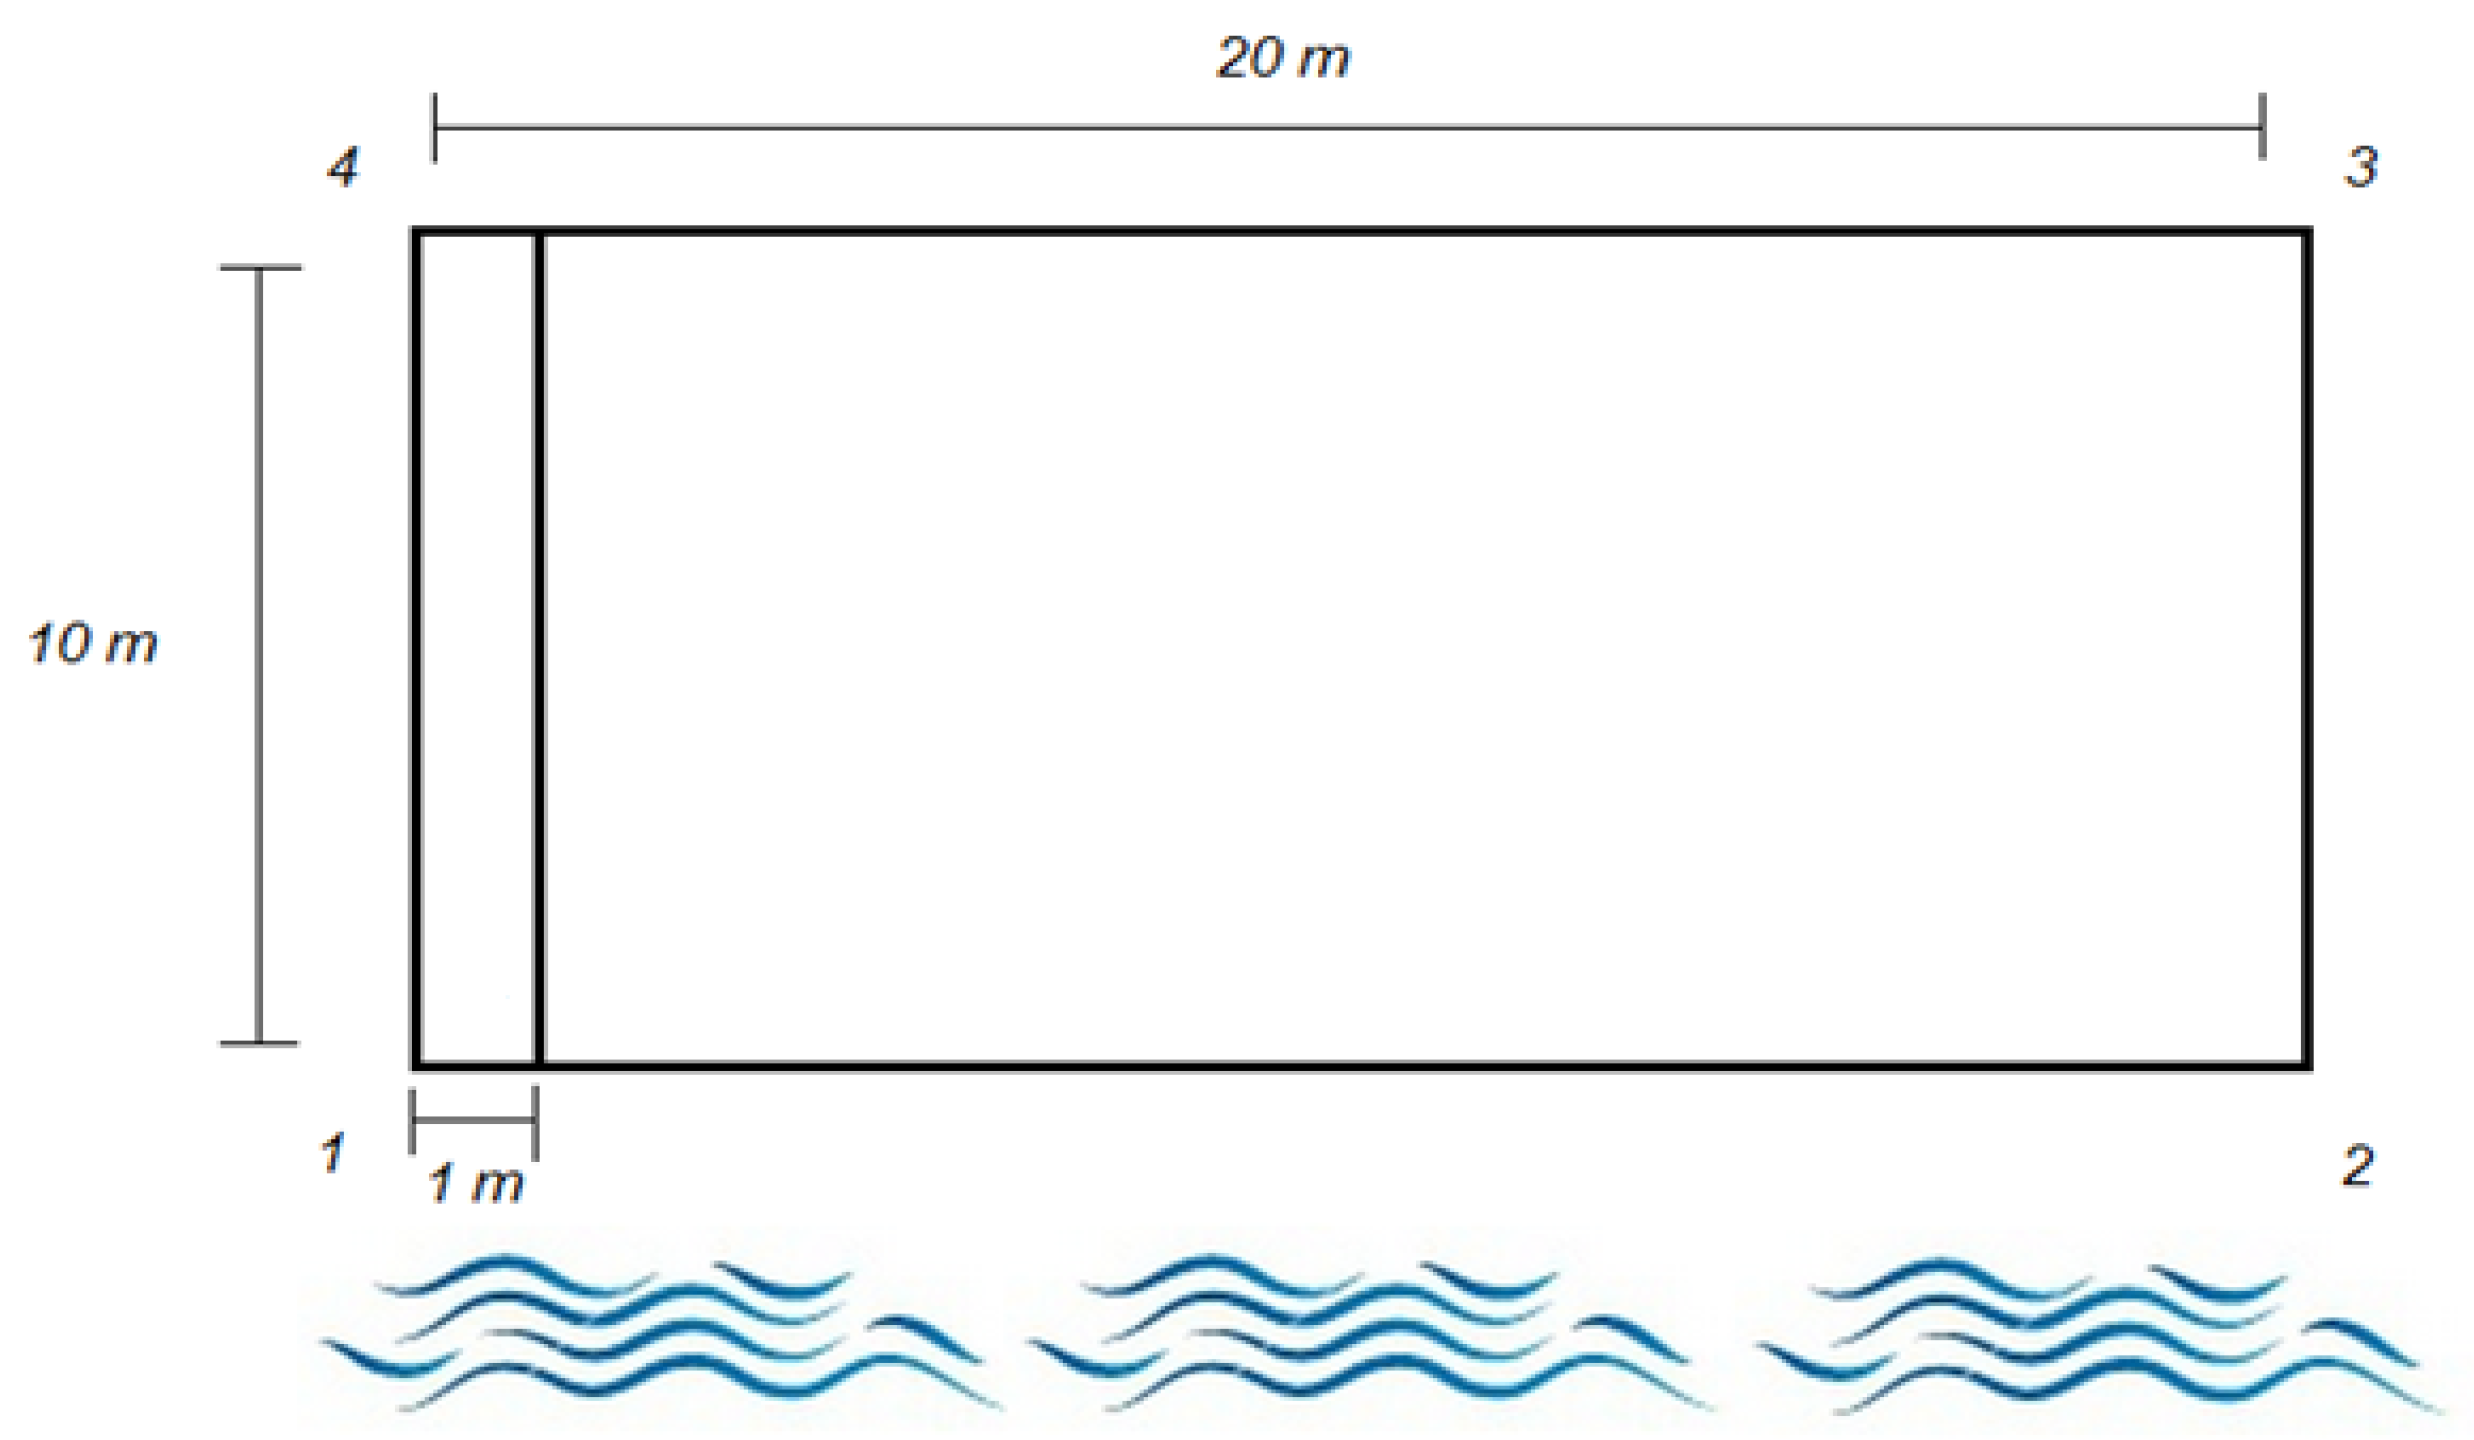
The sampling sites are located in wooded areas in the different flood-risk zones. The delineation of the riparian stands affected by flooding uses the official flood-zone maps (flood recurrence intervals of 0–20 years and 20–100 years) created by government agencies [26,27], as well as the flood maps found in municipal development plans. Zones outside the floodplains, but near the sampling sites, were also selected in order to compare the various zones with each other. Figure 2, Figure 3 and Figure 4 show different forest stands that are representative of the forest stands studied in different flood zones (FFz: flood recurrence interval of 0–20 years; MFz: recurrence interval of 20–100 years) and no-flood zones (NFz). Quadrats of vegetation 200 m2 in size (10 m × 20 m) served as a reference unit (Figure 5) for the sampling sites found across the various flood recurrence zones (0–20 years and 20–100 years) and outside the flood zones, for a total of 94 quadrats (i.e., 44 quadrats/interval 0–20 years; 22 quadrats/interval 20–100 years; and 28 quadrats outside the floodplains). Surveys of the tree stratum were done for each quadrat to tally and identify the tree species in the total quadrat area (200 m2). Nearly a third of the quadrats were selected (randomly sorted) to determine the regeneration and tree age using dendrochronology analysis.
Figure 2. Photograph of a tree stand located in the frequent flood zones (FFz) along the Saint-François River (left bank in the Richmond sector, Quadrat 7). The tree density is low, and the herbaceous cover is dense and dominated by ostrich fern (Matteuccia struthiopteris). The dense herbaceous cover can threaten the establishment of young tree shoots.
Water 06 02614 g002
The regeneration of the stands was determined inside the quadrat in a 1 m × 10 m strip perpendicular to the riverbank (Figure 5). The sampling was done by counting the first 30 tree stems surveyed in the strip, based on the total surface area. If the number of individuals collected in the strip was less than 30, the surface area was increased to attain 30 total samples, as stem density is lower for larger surface areas. Seedlings and saplings were identified and counted in the field and laboratory and were also noted according to various classes of stem diameter as follows: S1, tree seedlings less than 1 cm in diameter and less than 1 m in height; S2, tree seedlings less than 1 cm in diameter and more than 1 m in height; G1, tree saplings 1–5 cm in diameter at breast height (DBH: 1.3 m); G2, tree saplings 5–10 cm DBH; as well as trees more than 5 m in height. The diameter of the trees was measured with a circumferential tape for all of the tree specimens located in the quadrats. In addition, different characteristics of the tree stands were noted (e.g., topography, drainage, soil texture, ground litter, exposure, canopy cover, disruptions). Table 3 lists the main characteristics of the sampling sites along the Massawippi and Saint-François rivers, as well as the distribution of the quadrats based on the various flood zones and study areas.
Figure 3. The tree stand is located in the moderate flood zones (MFz) along the Saint-François River (right bank in the Windsor sector, Quadrat 26). The stand is dominated by young trees and some shrubs.
Water 06 02614 g003
Figure 4. This tree stand is representative of forests located outside the floodplains (NFz), but near the channel (Drummondville, St-Nicéphore sector, Quadrat 33). The tree population (conifer and hardwood) is more varied in age, and significant ground litter can be observed.
Water 06 02614 g004
Figure 5. Diagram of a quadrat along the longitudinal axis of a river. Each quadrat covers a surface area of 10 m × 20 m, including a 1 m × 10 m strip inside the quadrat.
Water 06 02614 g005
Table 3. Characteristics of tree stands along the Massawippi (MAS) and Saint-François (STF) rivers (Southern Québec).
Site/SectorMassawippi (MAS)Windsor (STF)Richmond (STF)Drummondville (STF)
Total quadrats31281619
Maximum tree ages72547541
Major soil groups (CSSC, 1998) aRegosol, Cumulic Regosol, Gleyed Regosol, BrunisolRegosol, Cumulic Regosol, Gleyed Regosol,Regosol, Cumulic Regosol, Gleyed Regosol,Regosol, Cumulic Regosol, Gleyed Regosol,
Drainage classes (CSSC, 1998)Good, good to moderate, bad to very badVery good, good to moderate, bad and very badGood, good to moderate, bad to very badVery good, good to moderate, bad
Dominant soil texture classes (CSSC, 1998)Loam, silt loam, sandy loamSandy loam, fine sandy loam, sandLoam, fine sandy loam, Sandy loamFine sandy loam, loam, fine sand
Notes: a CSSC: Canadian System of Soil Science; Sources: [5,6,29].

2.3. Tree-Ring Dating

Dendrochronology analyses were done on 76 tree specimens (>1.3 m in height) across the two flood recurrence zones, as well as outside the flood zones. The specimens consist of various species of trees, with the main ones being red ash, black ash, red maple, balsam fir and hemlock. Young stems, tree cores and slices (cross sections) were collected and analyzed in order to determine the age of tree specimens. Samples from individuals with an adequate diameter were taken by coring using an increment borer (Haglof/5 mm model), and the other specimens were cut at neck height with a small hand saw. The tree samples were taken at neck height to determine the age structure of the stands and the period when each individual was established. When samples could not be collected by coring at neck height (e.g., rotting of the tree core or uneven growth of the tree rings), the samples were collected at DBH. The trees selected for the dendrochronology analysis were identified by species and categorized by zone (FFz, MFz and NFz), as well as by study area (Massawippi and Saint-François rivers).
In the laboratory, the tree core samples were numbered and dried on wooden stands, while the slices were air-dried. Once dried, the samples were sanded and polished with glass paper (coarse to fine) to make the tree rings easier to read. A translucent stain was also applied to the samples to make the tree rings easier to read. The tree rings in the specimens were counted at the Université du Québec à Trois-Rivières (UQTR) laboratory using a binocular loupe (40× magnification).

2.4. Edaphic Conditions

In addition to the tree survey performed throughout the quadrats and the tally of seedlings, data on topographic characteristics and edaphic conditions were recorded. The following data were gathered: angle of slope measured with a clinometer; microtopography (e.g., depressions, mounds, flat terrain) was recorded and surface drainage was categorized qualitatively (e.g., good, poor) based on the soil drainage class systems [31]. The thickness of the forest litter was measured at the four ends of the quadrats and their characteristics recorded on field data sheets. Lastly, the type of land use and habitat were recorded (dense forest, young forest or scrubland), along with the presence of any disturbances (e.g., cutting, diseases, dead trees).

2.5. Statistical Analysis

Descriptive statistics (mean, median, standard deviation, etc.) were calculated for all data (e.g., stems, tree diameter, soil properties). In addition, a stem density index was determined for the tree stems (seedlings and saplings) inventoried inside the quadrats. The stem density index was calculated based on the number of stems for a given species per surface unit area. The Shapiro–Wilk test was used to check the assumption of normality of the regeneration data. A normal data distribution is required for the use of the various statistical tests (e.g., Student’s test). A logarithmic transformation was applied to the data matrix for the various statistical tests (e.g., Student’s, Mann–Whitney–Wilcoxon). Logarithmic transformations are often recommended for ecological variables, since raw data often have an asymmetric distribution [32]. Most of the samples were statistically compared using the Student’s test and the Mann–Whitney–Wilcoxon and Kolmogorov–Smirnov tests (non-parametric tests) when a normal distribution was not attained. Processing and analysis was done using R statistical software and the Vegan package for Windows [33]. A significance level of 95% was applied to all of the data that were processed.

3. Results and Discussion

3.1. Tree Recruitment in the Forest Stands

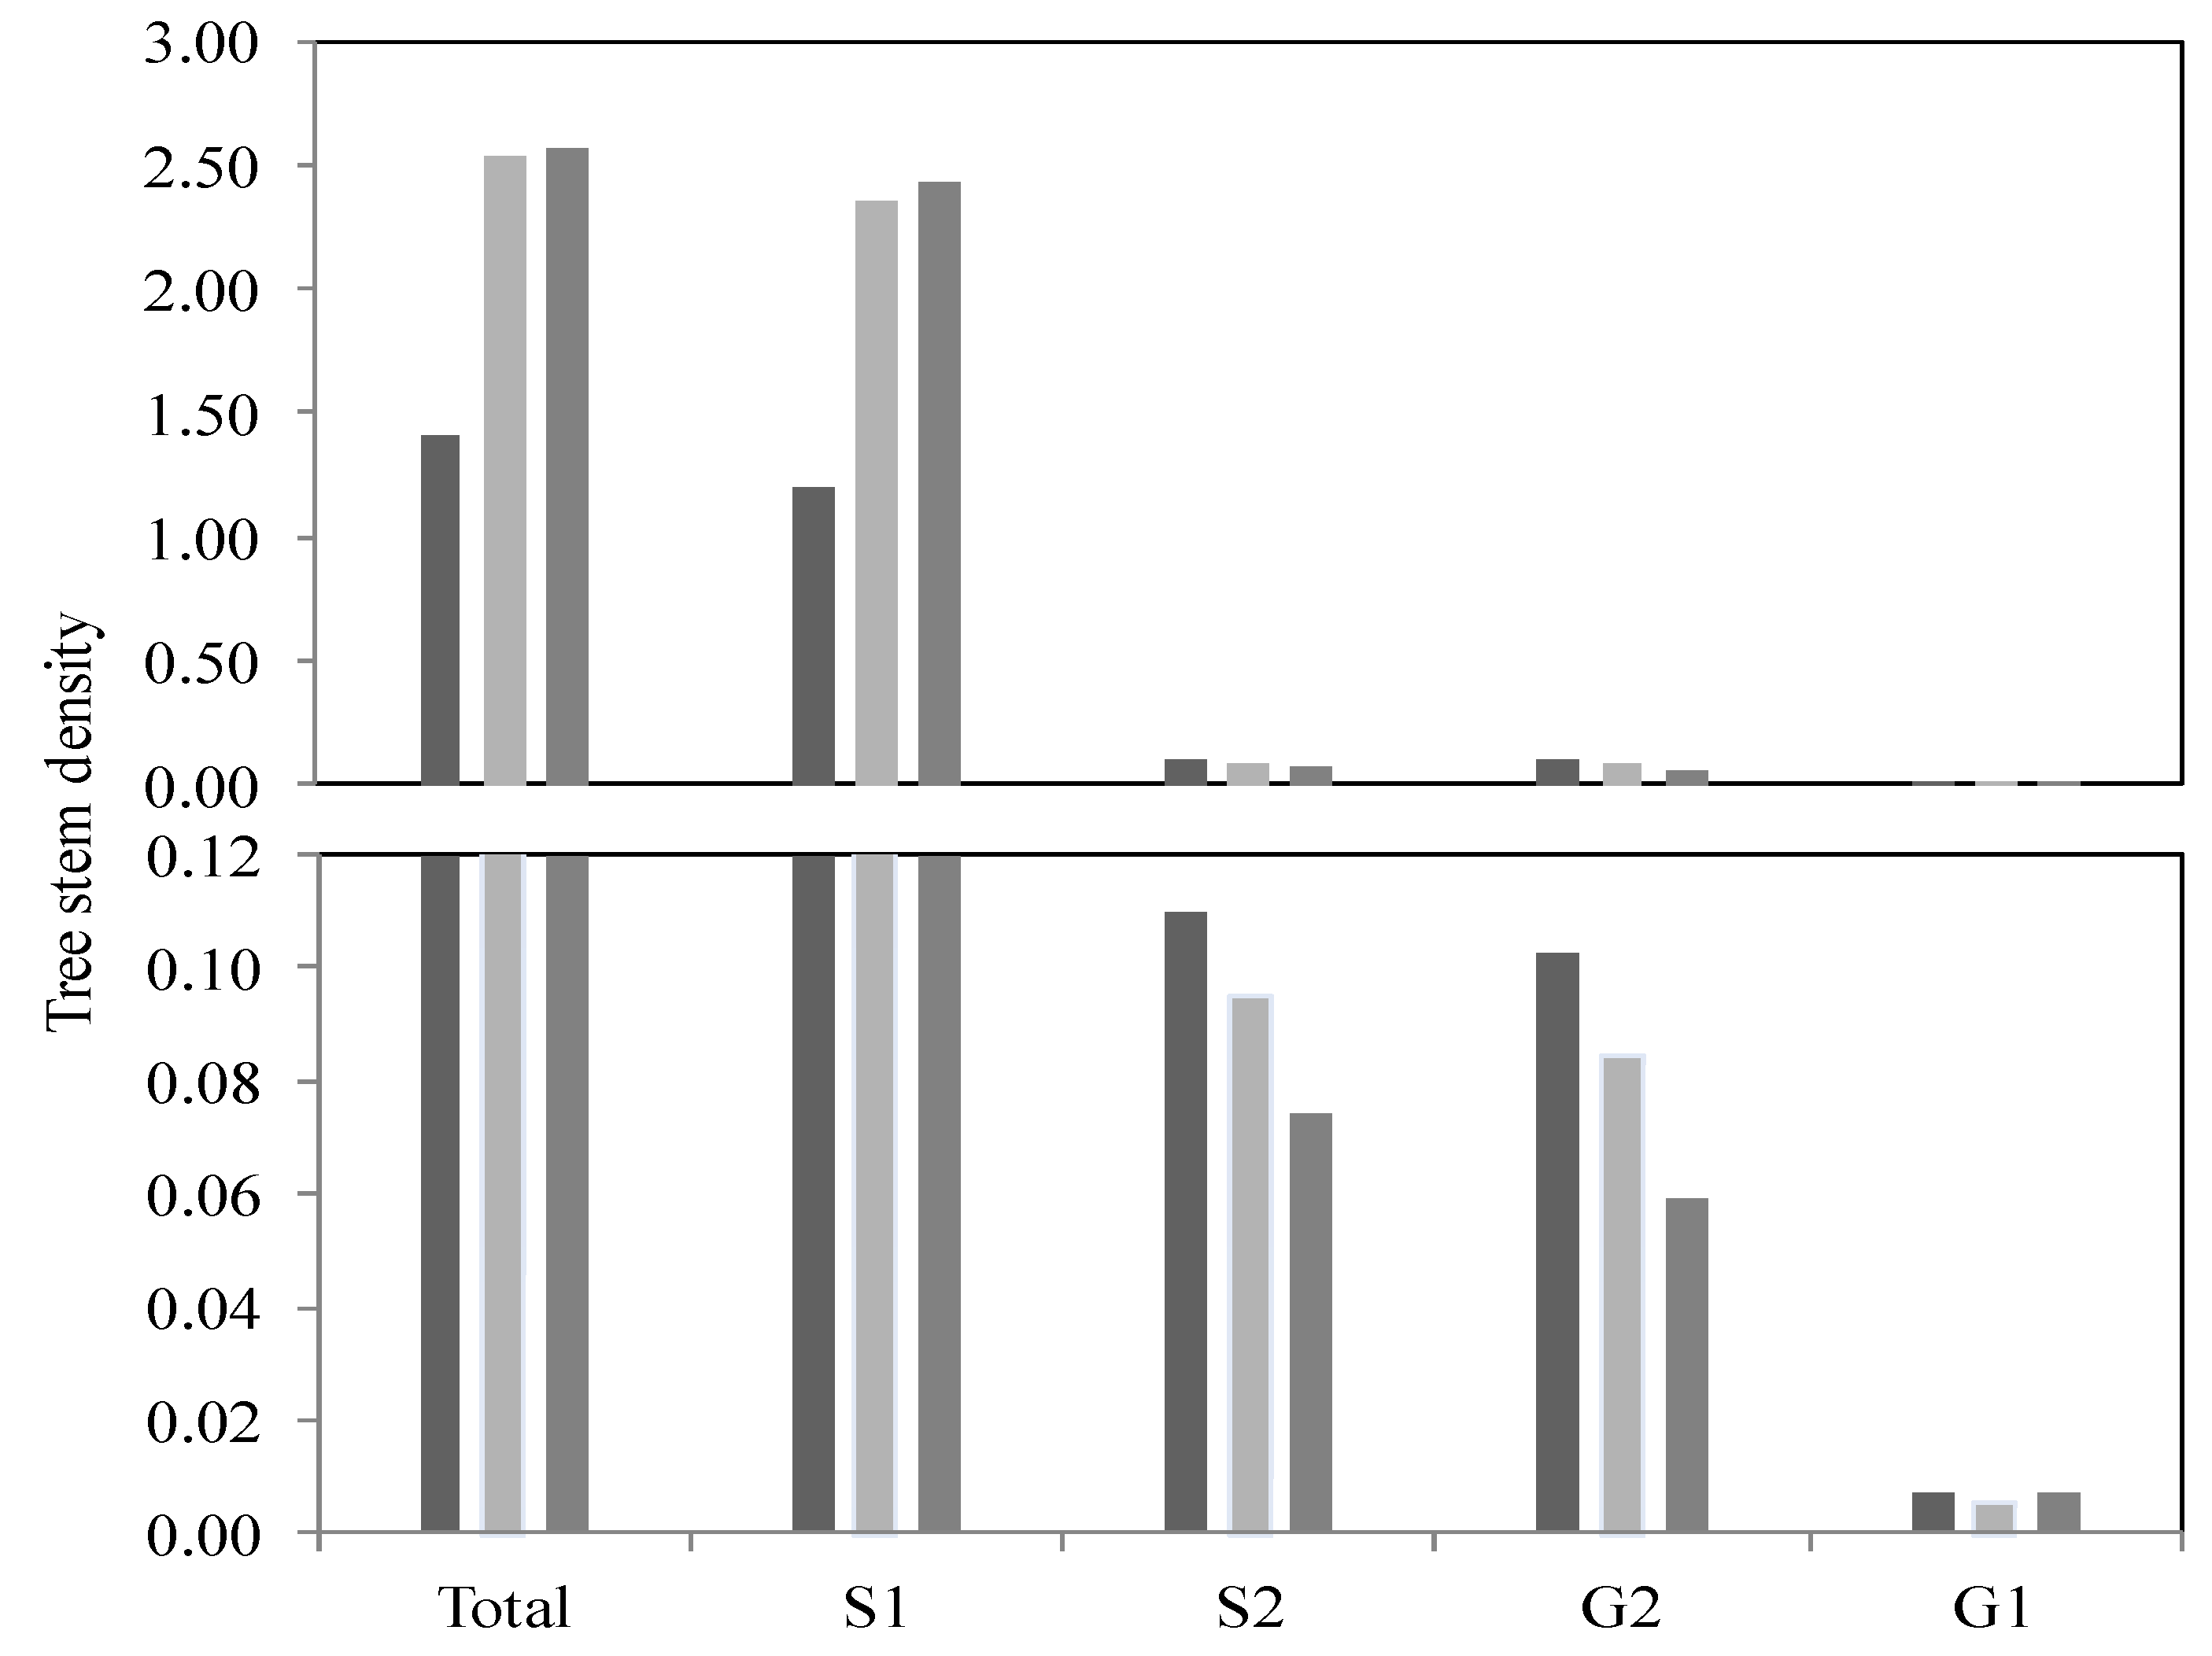
The values shown in Table 4 provide the tree stem density indices (seedlings and saplings) based on the means, medians, quartiles and standard deviations. The upper part of the table contains all of the regeneration data from the quadrats (strip of 1 m × 10 m) for the Massawippi and Saint-François river sectors (n = 720). By grouping the data based on the flood recurrence zones, it can be seen that regeneration is lower in the high-flood zone (FFz) than in the other two zones (MFz and NFz). Mean values of 1.41 and 1.20 are obtained for the 0–20-year zone (FFz) compared to 2.39 and 2.26 for the no-flood zone (NFz). For the seedlings in Category S1, the density indices are comparable with the total indices for all of the quadrats based on the different zones. Note that the establishment of seedlings (S1) in the high-flood zones (FFz) shows a lower index. This low recruitment rate could be explained by the higher flood frequency, which prevents annual shoots from being maintained and causes a drop in the survival rate of the young saplings in subsequent years. As floods can sometimes occur once or twice a year [19], saplings have a smaller chance of survival. The saplings in fact are at risk of being rooted up and carried away by the current. The other phenomenon to consider is the inflow of sediment during floods, which could completely cover the year’s saplings. It is estimated that 15 to 35 mm of flood sediment could be deposited along flooded rivers in this area [19,34,35]. It is also important to consider the presence of herbaceous species, such as ostrich fern (Matteuccia struthiopteris) and stinging nettle (Urtica dioica), which densely populate the alluvial plains (Figure 2) in these areas and which can hinder the establishment of the young tree stems by shade and their very dense root system. Furthermore, some species, such as silver maple and ash, pioneer species that are able to better adapt to poorly-drained soils, can affect the growth of young tree stems by their canopy, particularly for shade-intolerant species. All of these phenomena combined—strong current, buried seedlings and interspecific competition—can affect the recruitment of the various tree species and their survival in active alluvial zones, in addition to altering the structure of the communities over the long term [20,36].
Table 4. Stand density index of tree stems in different flood zones and no-flood zones.
Flood and no Flood Zones aMinQ1MedianMeanQ3MaxSD
Total
0–20 years0.100.400.851.41 **1.6510.101.87
20–100 years0.100.801.402.54 **3.1014.403.26
No flood0.100.901.602.39 **3.1012.672.46
S1
0–20 years0.000.250.651.20 **1.4010.101.81
20–100 years0.000.501.402.35 **3.0513.403.10
No flood0.100.701.602.26 **3.1012.672.48
S2
0–20 years0.000.000.000.11 *0.180.800.19
20–100 years0.000.000.000.09 *0.100.400.14
No flood0.000.000.000.07 *0.100.700.16
G1 *
0–20 years0.000.000.000.01 *0.000.100.03
20–100 years0.000.000.000.01 *0.000.100.02
No flood0.000.000.000.01 *0.000.100.03
G2 *
0–20 years0.000.000.000.10 *0.180.800.18
20–100 years0.000.000.000.08 *0.100.500.16
No flood0.000.000.000.06 *0.000.700.15
Notes: a FFz, frequent flood zone/0–20-year recurrence interval; MFz, moderate flood zone/20–100-year recurrence interval; NFz, no flood zone; Q1 and Q3 = first and third quartiles; SD: standard deviation; S1: tree seedlings <1 cm in diameter and <1 meter in height; S2, tree seedlings <1 cm in diameter and >1 m in height; G1, tree saplings of 1–5 cm in diameter at DBH; G2, tree saplings 5–10 cm in diameter at DBH. Sampling area: 1 m × 10 m. * No statistical difference between groups (p > 0.05); ** statistical difference between groups (p < 0.05).
For the other diameter categories (S2, G1 and G2), the density indices have relatively comparable values among the various zones (Table 4). The results show that the density of stems from the three categories of saplings and seedlings is significantly lower than that obtained with the S1 saplings group. Lastly, with regard to the stands in the no-flood zones, the densities obtained in the categories (S2, G1 and G2) are relatively comparable to those obtained for the flood zones, i.e., densities close to the maximum values of 0.70 to 0.10.
To validate the regeneration data, Student’s and Mann–Whitney tests were applied for the three study areas (FFz, MFz and NFz). The normality of the data was checked using the Shapiro–Wilk test, and a logarithmic transformation was done to reach a normal data distribution, required for the use of the Student’s test. In the FFz zones, the resulting values reveal a significant difference in the regeneration of the tree stratum (S1) between the other two zones (MFz: p = 0.098; NFz: p = 0.000). A significant difference is also observed between the MFz zone (p = 0.095) and the NFz zone (p = 0.000) for the density of the saplings (S1), which shows greater regeneration for these two zones compared to the FFz zone (Figure 6). The lower measured indices are associated with the high-flood zones (FFz). However, no significant value was obtained for the S2, G1 and G2 groups.
Figure 6. Histogram depicting tree stem density (n = 720) based on the diameter category (S1, S2, G1 and G2 groups) and as a function of the different flood zone recurrences and outside of the floodplain zones. (dark color = interval of 0–20 years; gray color = interval of 20–100 years; pale grey color = outside the floodplains; sampling area: 1 m × 10 m).
Water 06 02614 g006
Regeneration is the result of several conditions, such as seed dispersal, germination and the establishment of young stems, survival success, edaphic conditions, and interspecific competition [22,23,36]. Interspecific competition is likely an important factor in the successful establishment and maintenance of tree species in the zones outside the floodplains. The effect of competition among the species for resources (e.g., light, nutrients) and their survival rate are linked to endogenous factors, which, in fact, are common to all vegetation communities [17,22,24]. These main factors generally impact the recruitment rate and likelihood of the survival of young tree stems [15]. The trend observed for forest stands in Eastern North America is characterized by high sapling mortality during the first years of establishment and the stabilization of the surviving individuals in subsequent years [12,22,36].
Finally, an important factor that appears to be more critical is the impact of successive floods (i.e., interval of 0–20 years), which seems to result in the low recruitment rate of the tree species. The velocity of the current and the sediment (1–3.5 cm in thickness) left behind following the flood recession very likely contribute to reducing the young saplings’ likelihood of survival and, over time, decreasing the regeneration potential of these riparian populations. This, coupled with other factors, such as interspecies competition (common in all tree stands), the establishment of non-indigenous species and all other anthropogenic disruptions, makes these riparian stands and their short- and medium-term development especially precarious.

3.2. Forest Stands Structure

The data based on tree diameter and the dendrochronology analysis show that the stands are young in all of the zones, with a higher contingency of individuals found between 13 and 42 years (2001–1972) and 43–52 years of age (1971–1962) (Figure 7). Despite the presence of a few old individuals, most of the tree specimens analyzed are found in the following age classes: 13–22 years (2001–1992) and 33–42 years (1981–1972). These forests are therefore mainly made up of young stands with a low rate of renewal, especially in high-frequency flood zones (Figure 8). Furthermore, the age structure of the stands outside the floodplain zones (NFz) shows a higher number of young individuals versus older trees. The number of trees drops as the age of the individuals increases. This pattern of distribution is the same as the one observed for the other two flood zones (FFz and MFz). The Mann–Whitney and Kolmogorov–Smirnov tests that were applied to all of the data did not, however, show significant differences statistically between each zone, except for one site (p = 0.029).
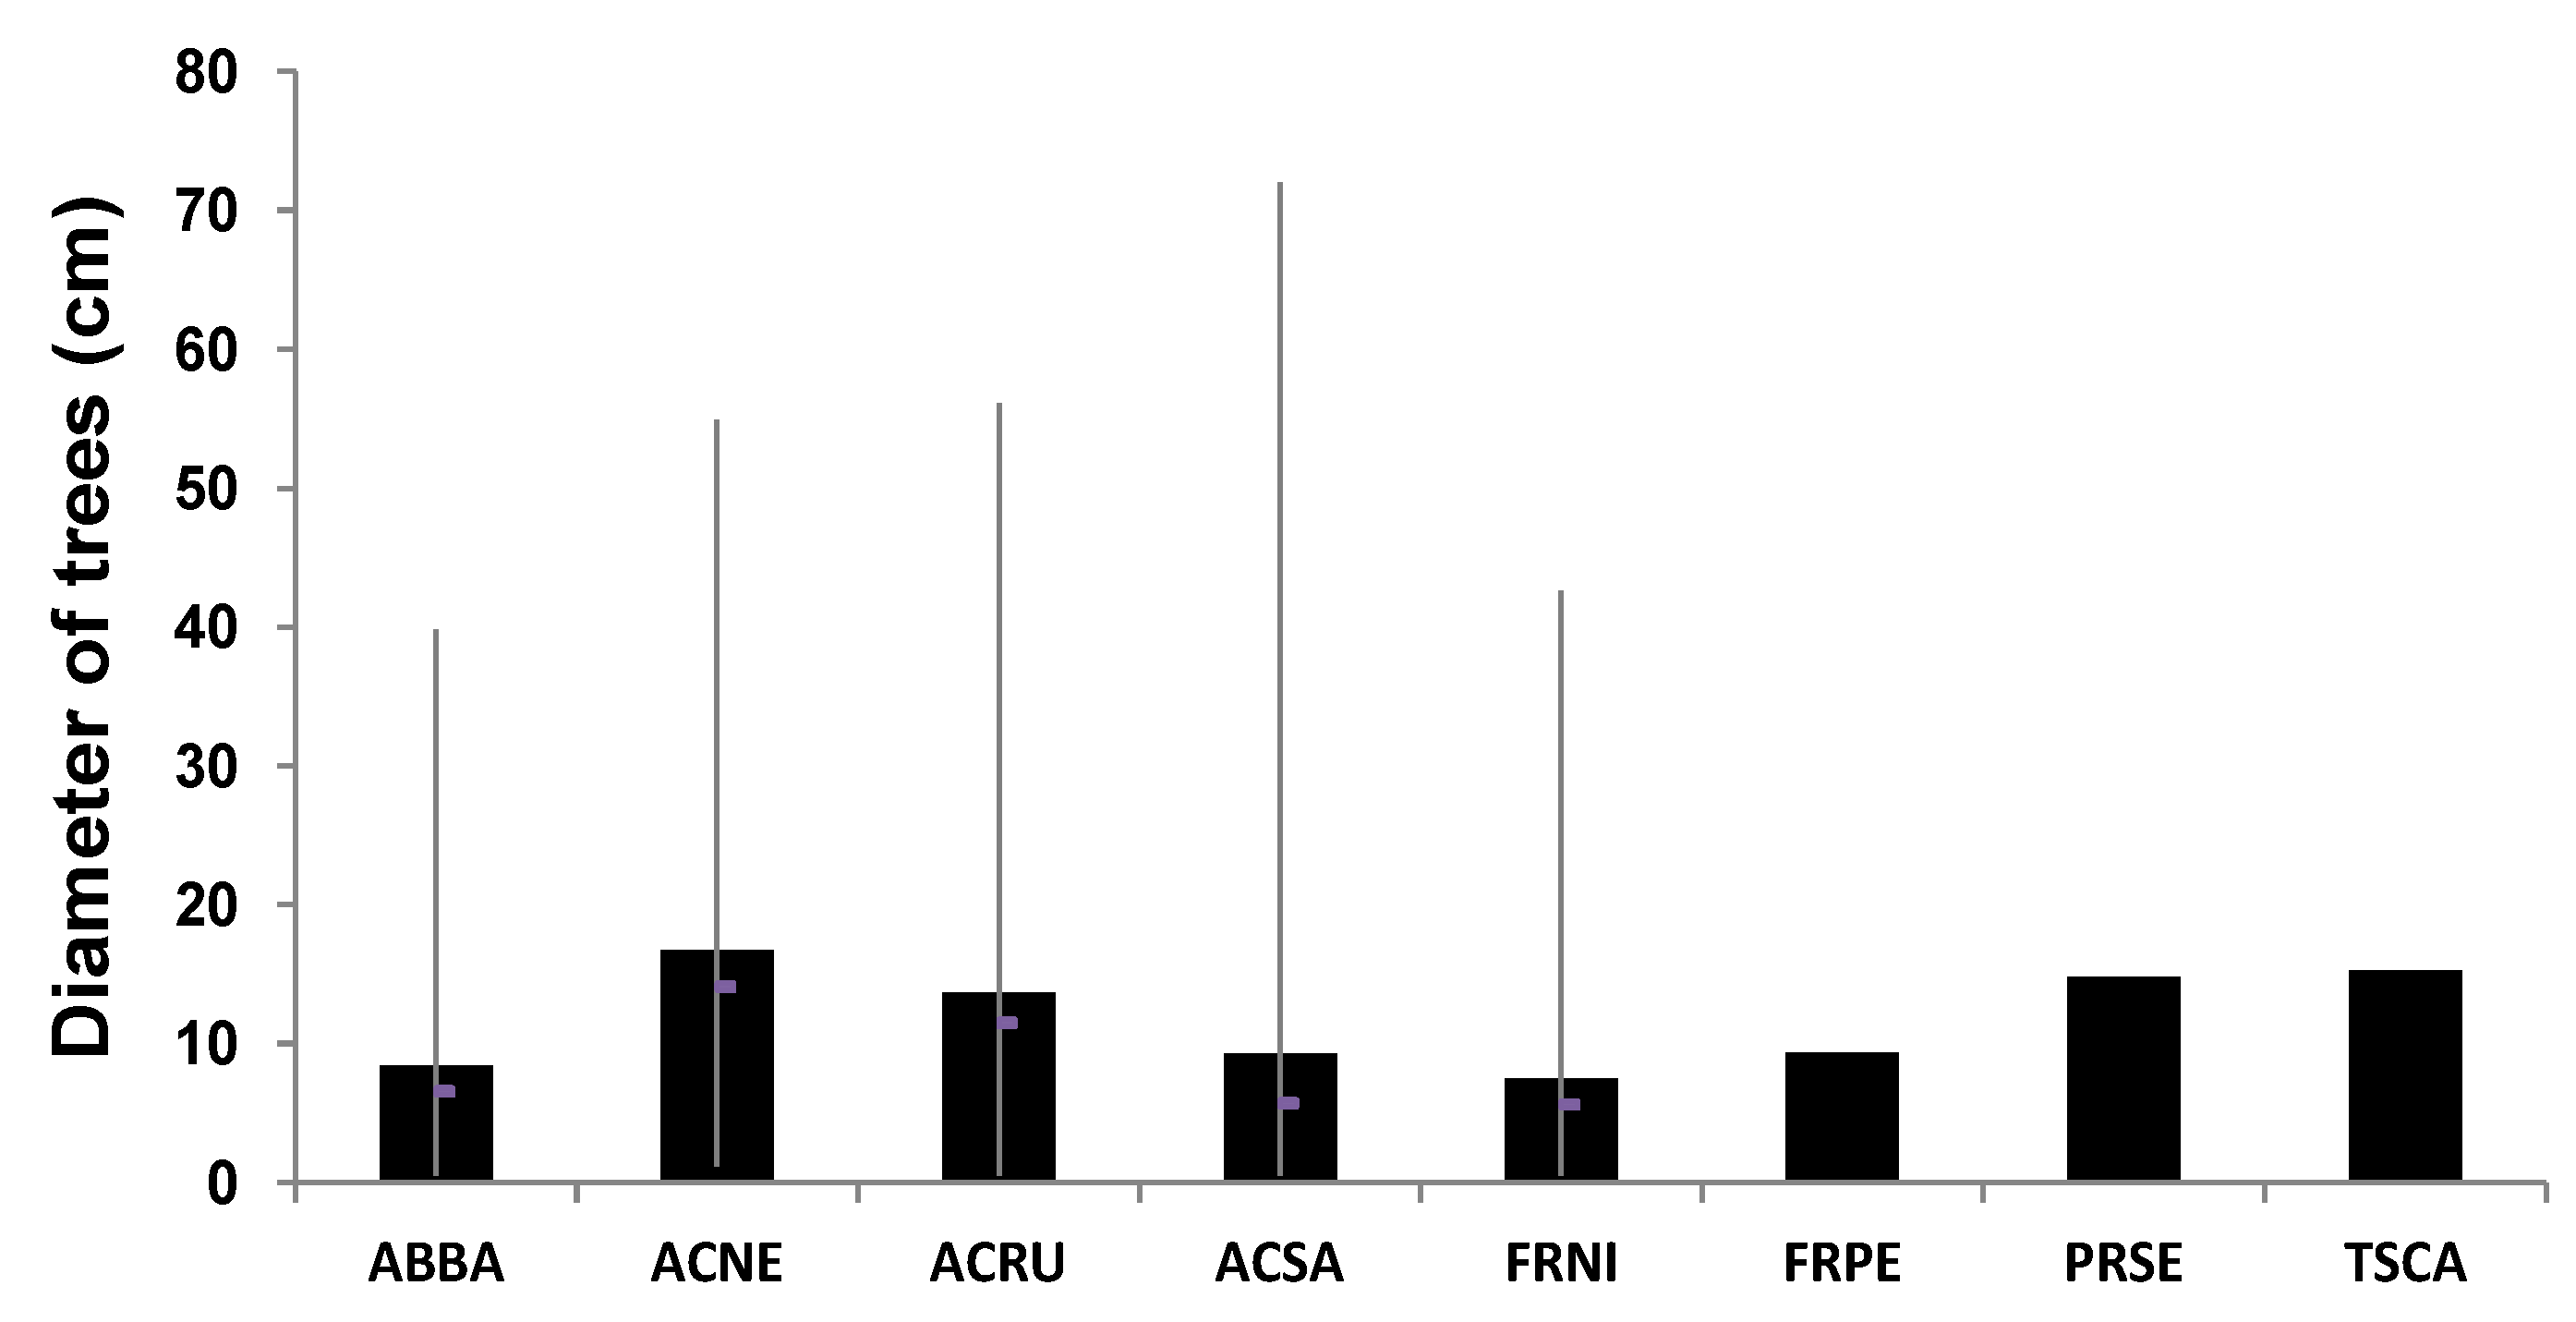
Several of the riparian stands that were analyzed were already established on the riverbanks in 1945 [30], and they basically still occupy the same land area. In some locations (e.g., Richmond and Windsor areas), an extension of woodland was even noted along the banks of the Saint-François River corridor ([30], pp. 64–66). In short, most of the wooded areas have remained in place since 1945, but younger individuals (e.g., 70–80 years) are found in the riparian stands. It is therefore estimated that a significant proportion of trees found in the frequent flood zones were established between 1962 and 1971, a period that coincides with a decrease in flood frequency in these areas [19]. In fact, the period of 1956–1970 was characterized by a marked decrease in floods throughout the Saint-François River catchment. It is likely that this decrease in the number of floods over this period had the effect of favouring the chances of the survival of young saplings that were newly established and that now account for a major portion of the trees in the current riparian stands. Many tree species, such as red ash (Fraxinus pennsylvanica) and black ash (F. nigra), located in active floodplains, also have a diameter greater than 15 centimeters (Figure 9), which would indicate an age from 20 and 30 years. However, further field work in the coming years will probably confirm these observations. Finally, there are marked differences in the composition of the tree species found in the flood zones (FFz and MFz) and those in the zones (NFz) outside the floodplains (Table 5). Species, such as red ash (Fraxinus pennsylvanica), black ash (F. nigra), silver maple (Acer saccharinum) and, occasionally, box elder (Acer negundo), are the main species that form the riparian tree stands, whereas the outer zones are characterized by species commonly found in wood stands in the temperate zones of southern Québec (e.g., Acer saccharum, Betula alleghaniensis, Tsuga canadensis). Red ash is the dominant species in the flood zones, with 91 (FFz) and 25 (MFz) individuals surveyed, accounting for 40.3% and 25.9%, respectively, while red maple (Acer rubrum) dominates the no-flood zones (NFz) with 107 (40.8%) individuals. The latter species is also well represented in the flood plains with 39 (17.3%) and 65 (28.0%) individuals surveyed.
Figure 7. Histogram showing the distribution of the number of tree stems (n = 720) according to age group and as a function of the different flood zone recurrences and outside floodplain zones. (dark color = interval of 0–20 years; gray color = interval of 20–100 years; and pale grey color = outside the floodplains).
Water 06 02614 g007
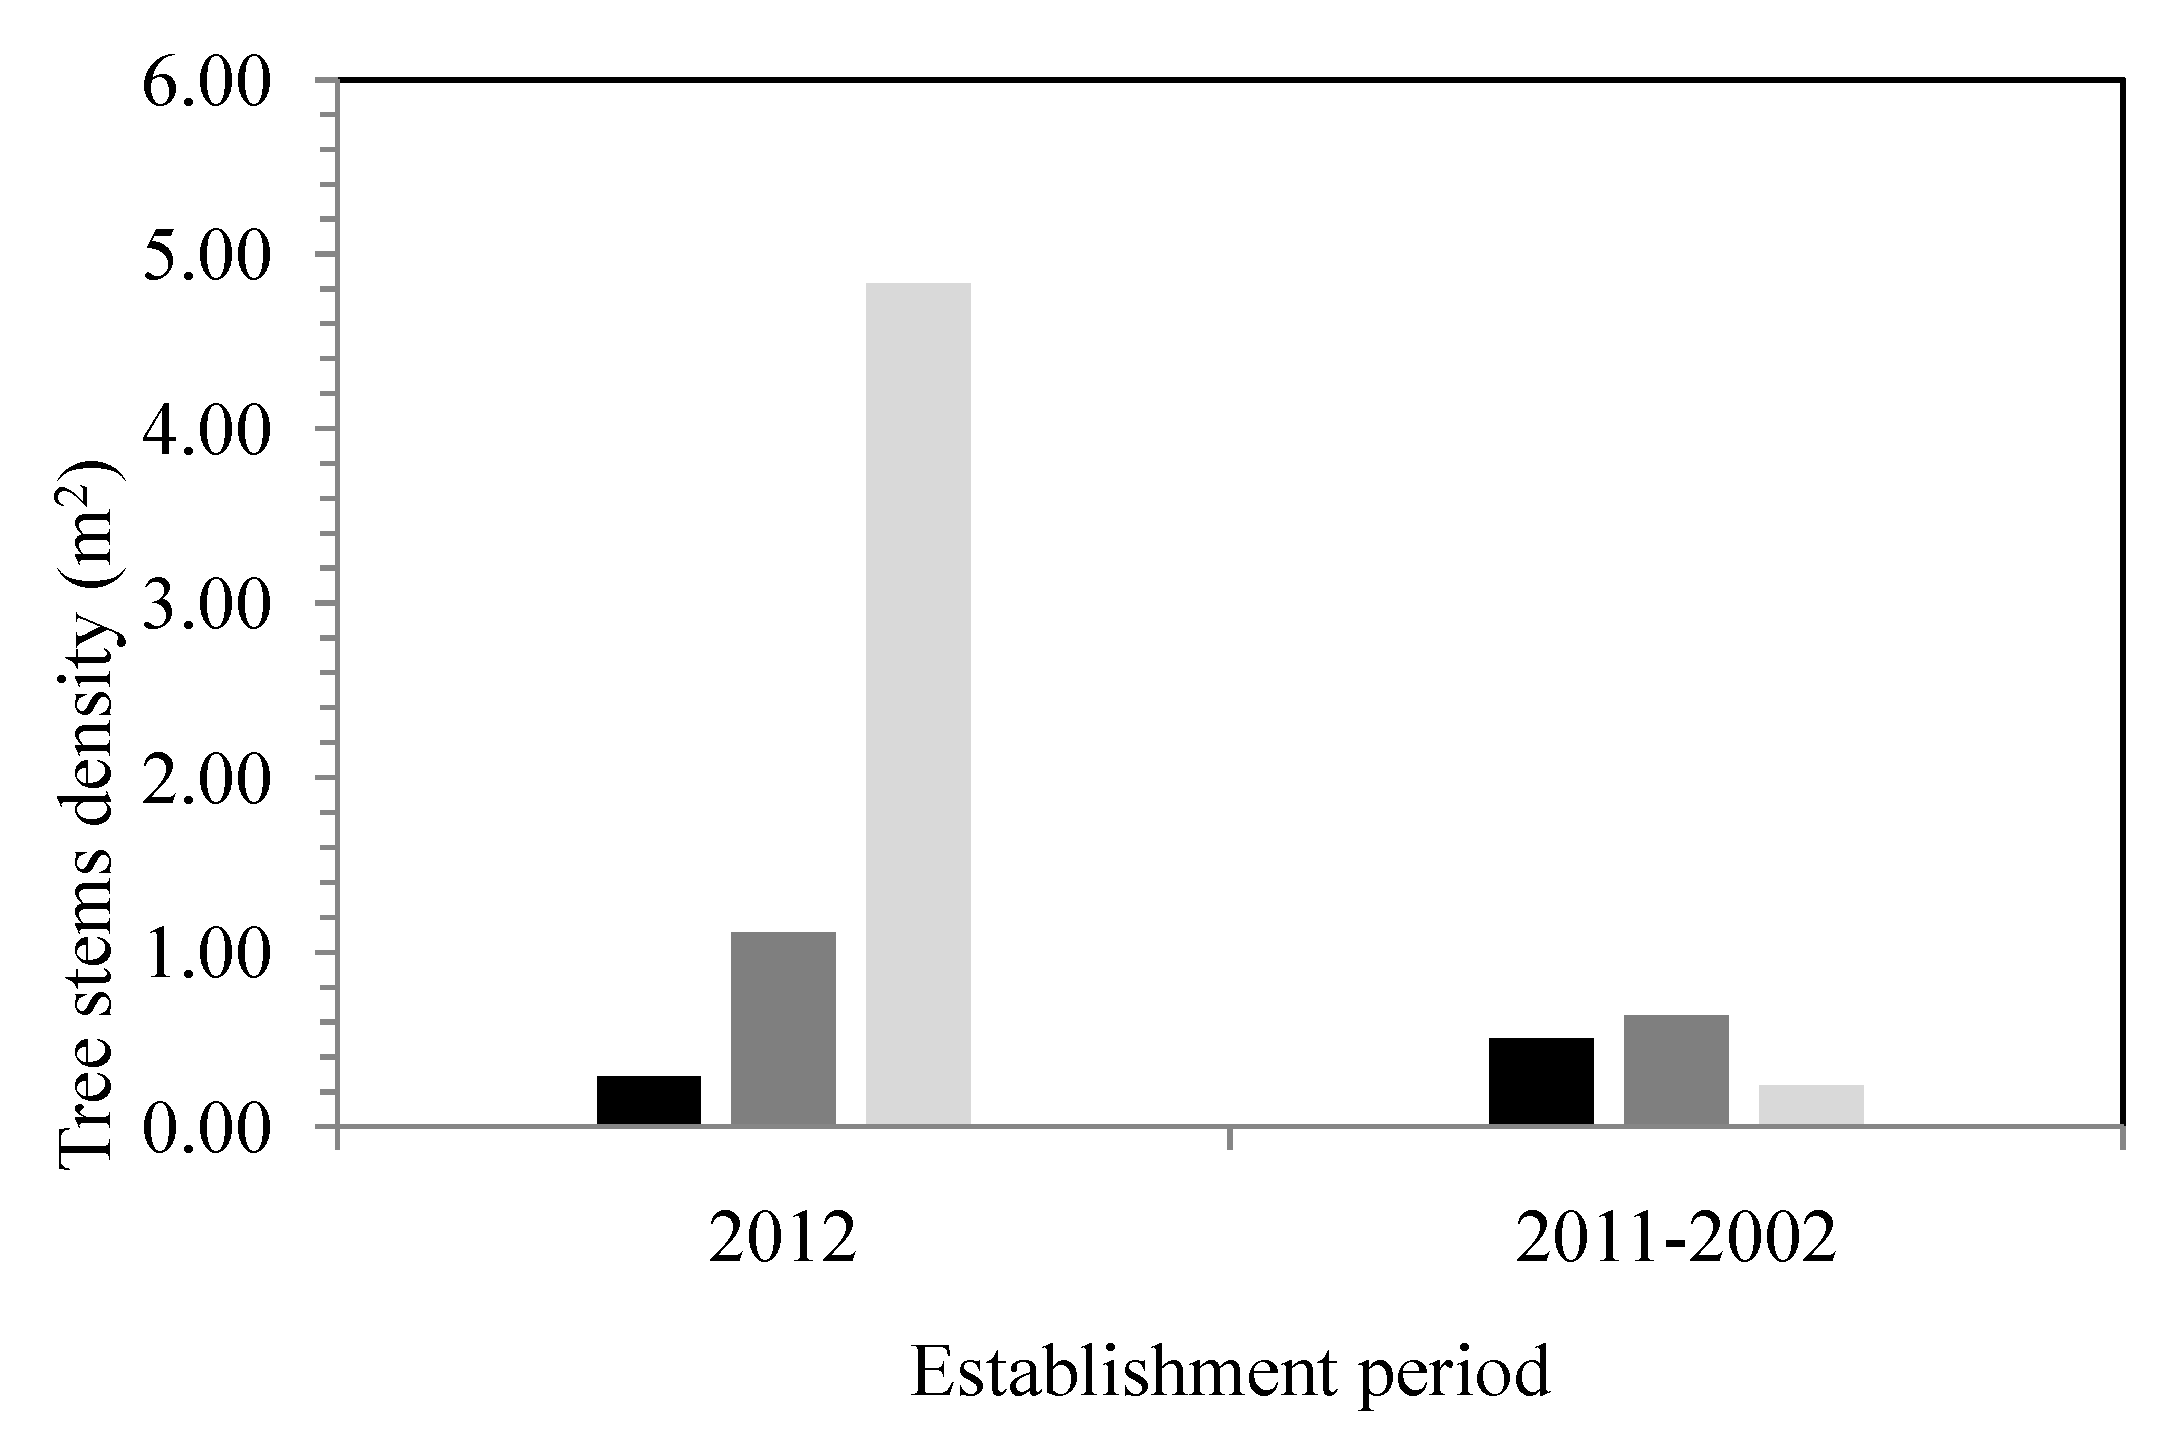
Figure 8. Histogram showing the density of tree stems (n = 720) according to the establishment period between 2012 and 2002 and as a function of the different flood zone recurrences and outside the floodplain zones. (dark color = interval of 0–20 years; gray color = interval of 20–100 years; and pale grey color = outside the floodplains).
Water 06 02614 g008
Figure 9. Diameter of main riparian trees analyzed in the flood zones (FFz and MFz) and no flood zones (NFz). The data show the mean, maximum, minimum and median values.
Water 06 02614 g009
Notes: ABBA, Abies balsamea; ACNE, Acer negundo; ACRU, Acer rubrum; ACSA, Acer saccharinum; FRNI, Fraxinus nigra; FRPE, Fraxinus pennsylvanica; PRSE, Prunus serotina; TSCA, Tsuga canadensis.
Table 5. Distribution, number and tree species in different zones (FFz, MFz and NFz).
Tree species a/Number of tree stemsFlood interval 0–20 yearsFlood interval 20–100 yearsOutside floodplainsTotal
Abies balsamea (L.) Miller1 (0.4)031 (11.8)32 (4.5)
Acer negundo L.14 (6.2)6 (2.6)020 (2.8)
Acer rubrum L.39 (17.3)65 (28.0)107 (40.8)211 (29.5)
Acer saccharinum L.17 (7.5)0017 (2.4)
Betula alleghaniensis L.1 (0.4)3 (1.3)4 (1.5)8 (1.1)
Fagus grandifolia L.11 (4.9)3 (1.3)014 (1.9)
Fraxinus americana L.035 (15.1)1 (0.4)36 (5.0)
Fraxinus nigra Marsh.20 (8.8)20 (8.6)040 (5.6)
Fraxinus pennsylvanica Marsh.91 (40.3)60 (25.9)14 (5.3)165 (23.1)
Ostrya virginiana (Mill.) K. Koch.01 (0.4)12 (4.6)13 (1.8)
Pinus strobus L.002 (0.8)2 (0.3)
Populus balsamifera L.02 (0.9)02 (0.3)
Populus grandidentata Mich.5 (2.2)005 (2.2)
Populus tremuloides L.01 (0.4)5 (1.9)6 (0.8)
Prunus serotina L.4 (1.8)19 (8.2)20 (7.6)43 (6.0)
Quercus rubra L.001 (0.4)1 (0.1)
Tilia americana L.5 (2.2)005 (2.2)
Tsuga canadensis L.015 (6.5)49 (18.7)64 (8.9)
Ulmus rubra L.5 (2.2)2 (0.9)07 (0.9)
Note: a The number in parenthesis represents the percentage of each species. Only five specimens could not be identified on the 720 tree stems.
The data in Table 6 provide more detail on the diameter size-class frequency of the two main species (Acer rubrum and Fraxinus pennsylvanica) identified in the 94 quadrats. Of the 225 stems counted in all of the quadrats, red maple (A. rubrum) was found to occur mainly outside the floodplains (NFz), though it also occurs in flood zones, but to a lesser extent. The mean diameters range from 12.6 to 16.9 cm, with a maximum value of 56.1 cm. There is a total number of 329 red ash trees (F. pennsylvanica), with individuals being especially represented in the high-flood zone (FFz). The mean diameters range from 4.0 to 10.1 cm, with a maximum value of 58.5 cm. Most of the trees are found in the 1–10 cm diameter size class, with a very limited number of old trees (e.g., 70 years). Most of the specimens analyzed make up these two species (A. rubrum and F. pennsylvanica), which are representative of young forest stands, with a few old individuals [37].
Table 6. Diameter of the two dominant tree species, size-class frequency in different flood zones (FFz and MFz) and no flood zones (NFz).
Tree speciesTotal tree stems aAverage diameter (cm)Median diameter (cm)Min–max diameter (cm)Diameter size-class frequency
Acer rubrum22513.611.50.5–56.11–1010–2020–3030–40
FFz (interval 0–20 years)2816.915.51.7–39.011665
MFz (interval 20–100 years)3515.513.51.2–44.9131092
NFz (Outside of the floodplains)16112.611.00.5–56.17452313
Fraxinus pennsylvanica3299.35.20.2–58.41–1010–2020–3030–40
FFz (interval 0–20 y)27110.15.90.2–58.4174512813
MFz (interval 20–100 y)354.82.40.4–52.92011
NFz (Outside floodplains)236.83.10.4–40.01931
Notes: a A total of 2633 tree stem diameters (DBH) were measured in the 94 quadrats; A dash (“–”) means there are no data for this size class.

3.3. Edaphic Conditions of the Tree Stands

The Appendix provides additional elements on edaphic conditions (e.g., drainage, soil pH, particle size, SOC (%), nitrogen, soil biomass) for the various areas under study (FFz, MFz and NFZ ) in the two study sectors (MAS and STF). In terms of soil pH, the FFz is characterized by slightly more acidity, but comparable to the MFz, whereas soil acidity is higher in the no-flood zones (NFz). In general, the soils outside the flood zones have the lowest pH values in both sectors (MAS and STF), which can probably be explained by the greater abundance of biomass in the soil. It is known that litter decomposition and humification releases acidifying products (e.g., fulvic and humic acids), which can increase soil acidity, especially in the surface horizons [38]. The no-flood zones have significantly thicker litter, namely three to four times more than the frequent flood zones. The soils located outside the floodplains also have the highest concentrations of SOC (%), i.e., close to twice the levels found in the other zones (FFz and MFz). From a textural standpoint, the soil in the FFz have textures with higher proportions of silt, which is characterized by loam, silty loam or loamy sand matrices. In the no-flood zones, the soil particle sizes (%) are comparable with the FFz, but the proportion of sand is generally coarser, and in some places, the soil profile contains gravel or pebbles. However, the slightly coarser textures do not seem to affect the regeneration of the annual saplings, which is greater in the NFz zones.
With respect to edaphic conditions, the most marked differences among the three zones mainly pertain to textural variations (e.g., coarser sand and presence of gravel), soil pH levels, soil organic carbon and nitrogen concentrations, along with the variable thickness of the litter, which are significantly greater in the no-flood zones. The presence of a fair amount of litter in fact modifies the soil properties by helping increase organic carbon and nitrogen levels, especially on the soil surface, which, in turn, helps release acidifying products associated with the breakdown of organic matter and its mineralization and humification [38], thus increasing soil pH. Lastly, the presence of thick ground litter observed in the NFz zones definitely favours seed germination, whereas in the areas where there is no litter, as can be observed in several frequent flood zones, germination is more compromised. Soils with high organic carbon and nitrogen concentrations also likely promote the establishment of new stems and their maintenance in the tree stratum [16,17].

4. Conclusions

Regarding seedling and sapling recruitment, we noted that tree regeneration is lower in frequent flood zones (FFz) than in the other two zones (MFz and NFz). The low recruitment rate, especially for the S1 group, can be explained by many factors (endogenous and exogenous). Although successive flooding likely has a major impact on the recruitment rate, it seems unlikely that this factor alone accounts for the low regeneration rate observed in the frequent-flood zones. Higher flood frequency definitely prevents annual shoots from being maintained and causes a drop in the survival rate of the young saplings in subsequent years. As floods can occur once or twice a year (in the spring and fall), depending on the years, saplings have a lesser chance of survival. It seems that tree recruitment and regeneration in riparian areas is influenced by successive floods.
For the other diameter categories, the density indices have relatively comparable values among the various zones. The results show that the total number of stems from the three categories of saplings and seedlings (S2, G1 and G2) is significantly lower than that obtained with the S1 saplings group. This indicates that the survival rate of young saplings, once they have been established, is relatively low and few reach advanced growth.
The dendrochronology data show that the stands are young, with a higher contingency of individuals between 13 and 42 years of age. Despite the presence of a few old individuals (e.g., 70 years), most of the tree specimens analyzed are 13–22 years (2001–1992) and 33–42 years (1981–1972). These riparian forests are therefore mainly made up of young stands with a low rate of renewal, especially in high-frequency flood zones (FFz). If the recruitment and survival rates remain low in frequently flooded zones, a gradual decline in riparian tree populations and possibly a loss of tree species diversity can be expected.

Appendix

Table A1. Edaphic conditions and soil properties in the tree stands in the different flood zones and outside the floodplains, including the two river sectors (MAS and STF).
MAS and STF Sectors
Edaphic Variables aFFzMMzNFz
Microtopography (slope %)
Flat (0%–2%)73.876.251.9
Low slope (2%–5%)11.99.50.0
Moderate slope (5%–10%)4.89.57.4
Slope (>10%)9.54.840.7
Drainage
Very good14.34.818.5
Good40.542.944.4
Good to moderate16.714.325.9
bad21.423.87.4
very bad7.114.33.7
Litter (cm)
0–0.559.523.87.4
0.5–1.016.79.511.1
1.0–2.516.742.918.5
2.5–3.50.019.17.4
3.5–4.57.14.829.6
>4.50.00.025.9
Soil PropertiesFFzMFzNFz
Soil pH
3.5–4.526.257.192.6
4.5–5.545.238.17.4
5.5–6.528.64.80.0
Particle size
Clay (>5%)3.66.712.5
Sand (>50%)39.353.329.2
Silt (>60%)57.140.058.3
SOC (%)
0.5–1.09.54.83.7
1.0–2.040.528.611.1
2.0–3.028.619.125.9
3.0–4.09.523.825.9
4.0–5.511.923.833.3
N (%)
0.01–0.052.40.00.0
0.05–0.2585.766.763.0
0.25–0.357.128.622.2
0.35–0.454.84.614.8
Note: a All data are expressed in percentages (see also [6] for more soil analysis details).

Acknowledgments

This study was supported by the Natural Sciences and Engineering Research Council of Canada (NSERC-RGPIN-2011-2016). We thank two anonymous referees for their helpful advice and suggestions. We thank Ann Delwaide (from Université Laval’s dendroecology laboratory) for her advice and assistance, as well as the students (Claudine Ouellet, Lorraine Pelletier and Ilias Bazier) for their help with the field work.

Author Contributions

The field work was conducted by Jean-Sébastien Berthelot, Diane Saint-Laurent, Vernhar Gervais-Beaulac and Dominic Savoie with assistance of Ilias Bazier. The paper was written by Jean-Sébastien Berthelot and Diane Saint-Laurent and data compilation and statistical analyzes by all authors.

Conflicts of Interest

The authors declare no conflict of interest.

References

  1. Hupp, C.R.; Osterkamp, W.R. Riparian vegetation and fluvial geomorphic processes. Geomorphology 1996, 14, 277–295. [Google Scholar] [CrossRef]
  2. Walters, C.; Korman, J. Cross-Scale modeling of riparian ecosystem responses to hydrologic management. Ecosystems 1999, 2, 411–421. [Google Scholar] [CrossRef]
  3. Denneler, B.; Bergeron, Y.; Bégin, Y. Flooding effects on tree-ring formation of riparian eastern White-Cedar (Thuja occidentalis L.), Northwestern Quebec, Canada. Tree-Ring Res. 2010, 66, 3–17. [Google Scholar] [CrossRef]
  4. Boucher, É.; Ouarda, T.B.M.; Bégin, Y.; Nicault, A. Spring flood reconstruction from continuous and discrete tree ring series. Water Res. 2011, 47. [Google Scholar] [CrossRef]
  5. Drouin, A.; Saint-Laurent, D.; Lavoie, L.; Ouellet, C. High-Precision Digital Elevation Model to evaluate the spatial distribution of soil organic carbon in active floodplains. Wetlands 2011, 31, 1151–1164. [Google Scholar] [CrossRef]
  6. Saint-Laurent, D.; Gervais-Beaulac, V.; Berthelot, J.-S. Variability of soil properties in different flood-risk zones and link with hydroclimatic changes (Southern Québec, Canada). Geoderma 2014, 214–215, 80–90. [Google Scholar] [CrossRef]
  7. Balian, E.V.; Naiman, R.J. Abundance and production of riparian trees in the lowland floodplain of the Queets River, Washington. Ecosystems 2005, 8, 841–861. [Google Scholar]
  8. Capon, S.J. Flood variability and spatial variation in plant community composition and structure on a large arid floodplain. J. Arid Environ. 2005, 60, 283–302. [Google Scholar] [CrossRef]
  9. Matías, L.; Zamora, R.; Castro, J. Repercussions of simulated climate change on the diversity of woody-recruit bank in a Mediterranean type Ecosystem. Ecosystems 2011, 14, 672–682. [Google Scholar] [CrossRef]
  10. Cairns, D.M.; Charles, W.; Lafon, C.W.; Mouton, M.F.; Stuteville, R.L.; Young, A.B.; Moen, J. Comparing two methods for aging trees with suppressed, diffuse-porous rings (Betula pubescens ssp. czerepanovii). Dendrochronologia 2012, 30, 252–256. [Google Scholar] [CrossRef]
  11. Sumida, A.; Miyaura, T.; Torii, H. Relationships of tree height and diameter at breast height revisited: analyses of stem growth using 20 year data of an even-aged Chamaecyparis obtusa stand. Tree Physiol. 2013, 33, 1–13. [Google Scholar] [CrossRef]
  12. Goodburn, J.M.; Lorimer, G.G. Population structure in old-growth and managed northern hardwoods: An examination of the balanced diameter distribution concept. Forest Ecol. Manag. 1999, 118, 11–29. [Google Scholar] [CrossRef]
  13. Franklin, S.C.; Kupfer, J.A.; Pezeshki, S.R.; Gentry, R.; Smith, R.D. Complex effects of channelization and levee construction on western Tennessee floodplain forest function. Wetlands 2009, 29, 451–464. [Google Scholar] [CrossRef]
  14. Keyes, C.K.; Teraoka, E.K. Structure and composition of old-growth and unmanaged second-growth riparian forests at Redwood National Park, USA. Forests 2014, 6, 256–268. [Google Scholar] [CrossRef]
  15. Payette, S.; Filion, L. La dendroécologie. Principes, méthodes et applications; Presses de l’Université Laval: Québec, QC, Canada, 2010; p. 758. [Google Scholar]
  16. Gutsell, S.L.; Johnson, E.A. Accurately aging trees and examining their height growth rates: Implications for interpreting forest dynamics. J. Ecol. 2002, 90, 153–166. [Google Scholar] [CrossRef]
  17. Finzi, A.C.; Canham, C.D. Sapling growth in response to light and nitrogen availability in a southern New England forest. For. Ecol. Manag. 2000, 131, 153–165. [Google Scholar] [CrossRef]
  18. Hamdan, M.A.; Asada, T.; Hassan, F.M.; Warner, B.G.; Douabul, A.A.; Al-Hilli, M.R.A.; Alwan, A.A. Vegetation response to re-flooding in the Mesopotamian wetlands, South Irak. Wetlands 2010, 30, 177–188. [Google Scholar] [CrossRef]
  19. Saint-Laurent, D.; St-Laurent, J.; Lavoie, L.; Drouin, A.; Ghaleb, B. Floodplain sedimentation rates, soil properties and recent flood history in Southern Québec. Glob. Planet. Chang. 2010, 70, 76–91. [Google Scholar] [CrossRef]
  20. Guilherme, F.A.G.; Oliveira-Filho, A.T.; Appolinário, V.; Bearzoti, E. Effects of flooding regime and woody bamboos on tree community dynamics in a section of tropical semi deciduous forest in South-Eastern Brazil. Plant Ecol. 2004, 174, 19–36. [Google Scholar] [CrossRef]
  21. Asaeda, T.; Gomes, P.I.A.; Sakamoto, K.; Rashid, M.H. Tree colonization trends on a sediment bar after a major flood. River Res. Appl. 2010, 27, 976–984. [Google Scholar]
  22. Foster, D.R. Disturbance history, community organization and vegetation dynamics of the old-growth Pisgah forest, South-Western, New Hampshire, U.S.A. J. Ecol. 1988, 76, 105–134. [Google Scholar] [CrossRef]
  23. Berland, A.; Shuman, B.; Manson, S.M. Simulated importance of dispersal, disturbance, and landscape history in long-term ecosystem change in the Big woods of Minnesota. Ecosystems 2011, 14, 398–414. [Google Scholar] [CrossRef]
  24. Pettit, N.E.; Froend, R.H. Variability in flood disturbance and the impact on riparian tree recruitment in two contrasting river systems. Wetl. Ecol. Manag. 2001, 9, 13–25. [Google Scholar] [CrossRef]
  25. Yagouti, A.; Boulet, G.; Vincent, L.; L Vescovi, L. Observed changes in daily temperature and precipitation indices for southern Québec, 1960–2005. Atmos. Ocean 2008, 46, 243–256. [Google Scholar] [CrossRef]
  26. Environment Canada and Ministère de l’Environnement. Flood Risk Map: Saint-François River Basin (scales 1:15,000, 1:10,000); Environment Canada and Ministère de l’Environnement: Québec, QC, Canada, 1982. [Google Scholar]
  27. Centre d’expertise hydrique du Québec. Cartographie des Zones de Risques D’inondation. Ministère du Développement Durable, de la Faune et des Parcs, Gouvernement du Québec: Québec, Canada, 2013. Available online: http://www.cehq.gouv.qc.ca/zones-inond/cartographie/ (accessed on 10 June 2013).
  28. Base Nationale des Données Topographiques (BNDT). Government of Canada: Ottawa, ON, Canada, 2012. Available online: http://geogratis.gc.ca/api/fr/nrcan-rncan/ess-sst/-/(urn:iso:series)base-nationale-de-donnees-topographiques-bndt (accessed on 11 May 2012).
  29. Saint-Laurent, D.; Hähni, M. Crues et inondations majeures des villes de l’Estrie: Variations climatiques et modifications anthropiques (Québec, Canada). Environ. Urbain Urban Environ. 2008, 2, 50–72. Available online: http://www.erudit.org/revue/eue/2008/v2/n/019221ar.pdf (accessed on 14 April 2011). [Google Scholar]
  30. Castonguay, S.; Saint-Laurent, D. Reconstructing Reforestation: Changing Land Use Patterns along the Saint-François River in the Eastern Townships. In Method and Meaning in Canadian Environmental History; MacEachern, A., Turkel, E.J., Eds.; Th. Nelson: Toronto, Canada, 2009; pp. 273–292. [Google Scholar]
  31. Canadian System of Soil Classification, 3rd ed.Soil Classification Working Group, Research Branch, Agriculture and Agri-Food Canada, Publication 1646; Government of Canada: Ottawa, Canada, 1998.
  32. Legendre, P.; Legendre, L. Numerical Ecology. Development in Environmental Modelling, 2nd ed.; Elsevier Science B.V.: Amsterdam, The Netherlands, 1998. [Google Scholar]
  33. R Development Core Team. A Language and Environment for Statistical Computing. R Foundation for Statistical Computing: Vienna, Austria, 2011. [Google Scholar]
  34. Lavoie, L.; Saint-Laurent, D.; St-Laurent, J. Pedological and sedimentological analyses of alluvial soils and paleosols on floodplain terraces. Can. J. Soil Sci. 2006, 86, 813–826. [Google Scholar] [CrossRef]
  35. Saint-Laurent, D.; Duplessis, P.; St-Laurent, J.; Lavoie, L. Reconstructing contamination events on the riverbanks in southern Québec using dendrochronology and dendrochemical methods. Dendrochronologia 2011, 29, 31–40. [Google Scholar] [CrossRef]
  36. Lorimer, C.G. Age structure and disturbance history of a southern Appalachian virgin forest. Ecology 1980, 61, 1169–1184. [Google Scholar] [CrossRef]
  37. Berthelot, J.-S. Structure et Évolution des Peuplements Riverains en Fonction des Zones de Récurrence D’inondation (Bassin centre-sud du Québec). Master’s Thesis, Département des Sciences de l’Environnement, Université du Québec à Trois-Rivières, Québec, QC, Canada, 2014. [Google Scholar]
  38. Brady, N.; Weil, R.R. The Nature and Properties of Soils, 14th ed.; Pearson: Columbus, OH, USA, 2008. [Google Scholar]