Evaluating the Infiltration Performance of Eight Dutch Permeable Pavements Using a New Full-Scale Infiltration Testing Method


Abstract
:1. Introduction

1.1. Infiltration Rate Testing

2. Methodology
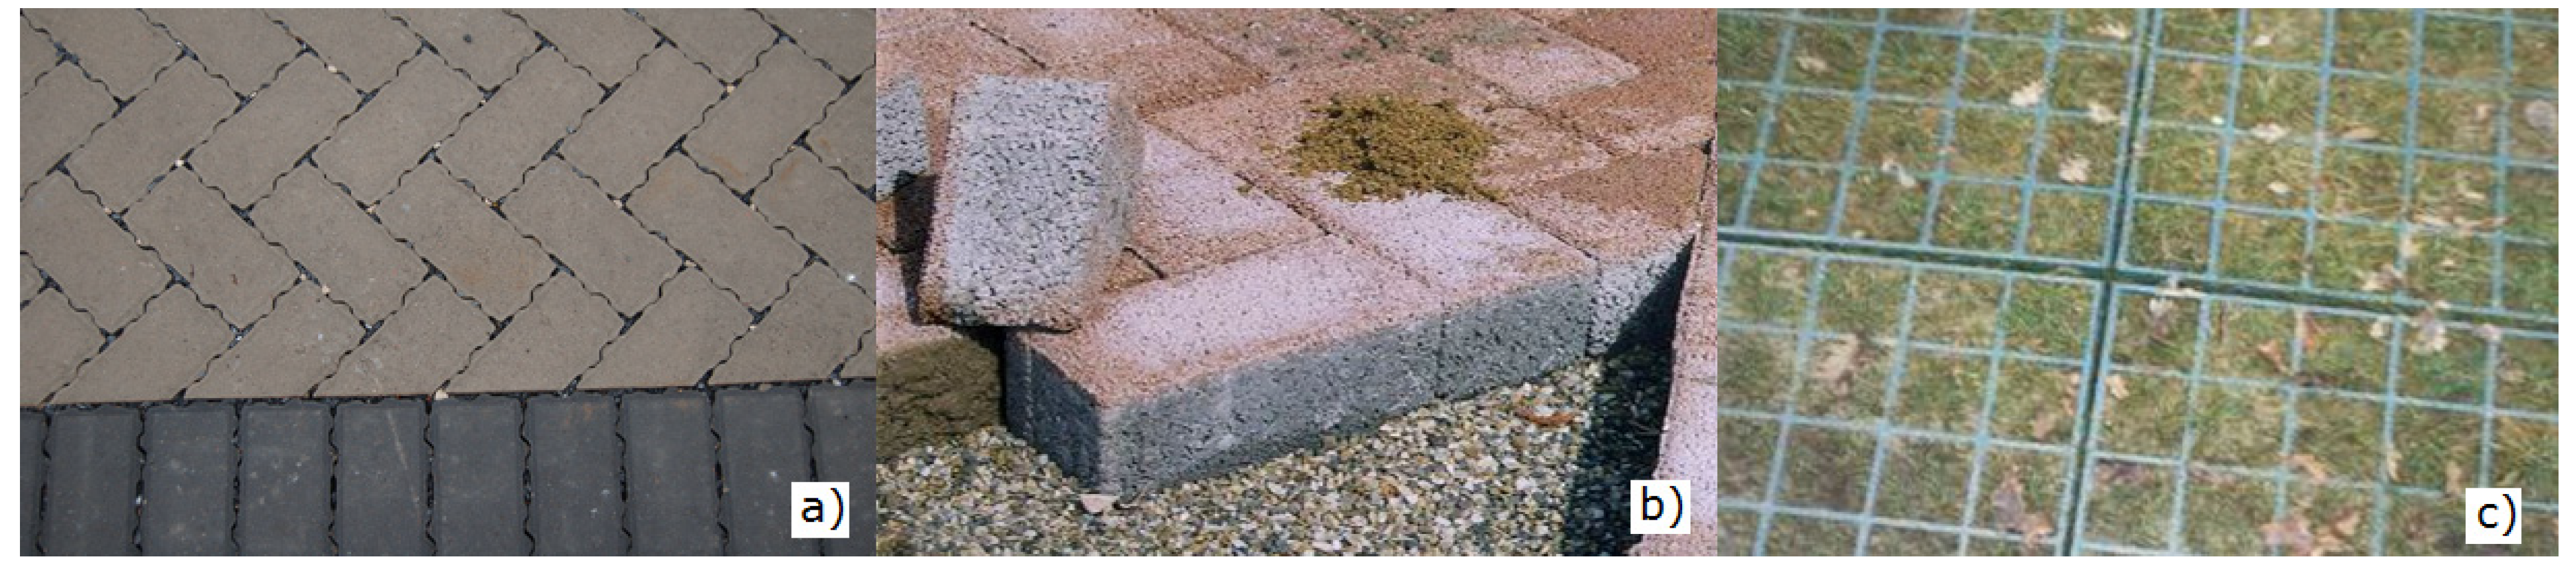
2.1. Test Area Selection
2.2. Water Containment
- Soil core wrapped in plastic sheeting;
- Sand core wrapped in geotextile;
- Soil- or sand-filled plastic bags;
- Impermeable barriers inserted into paving gaps; and
- Use of existing traffic calming devices (speed-humps).
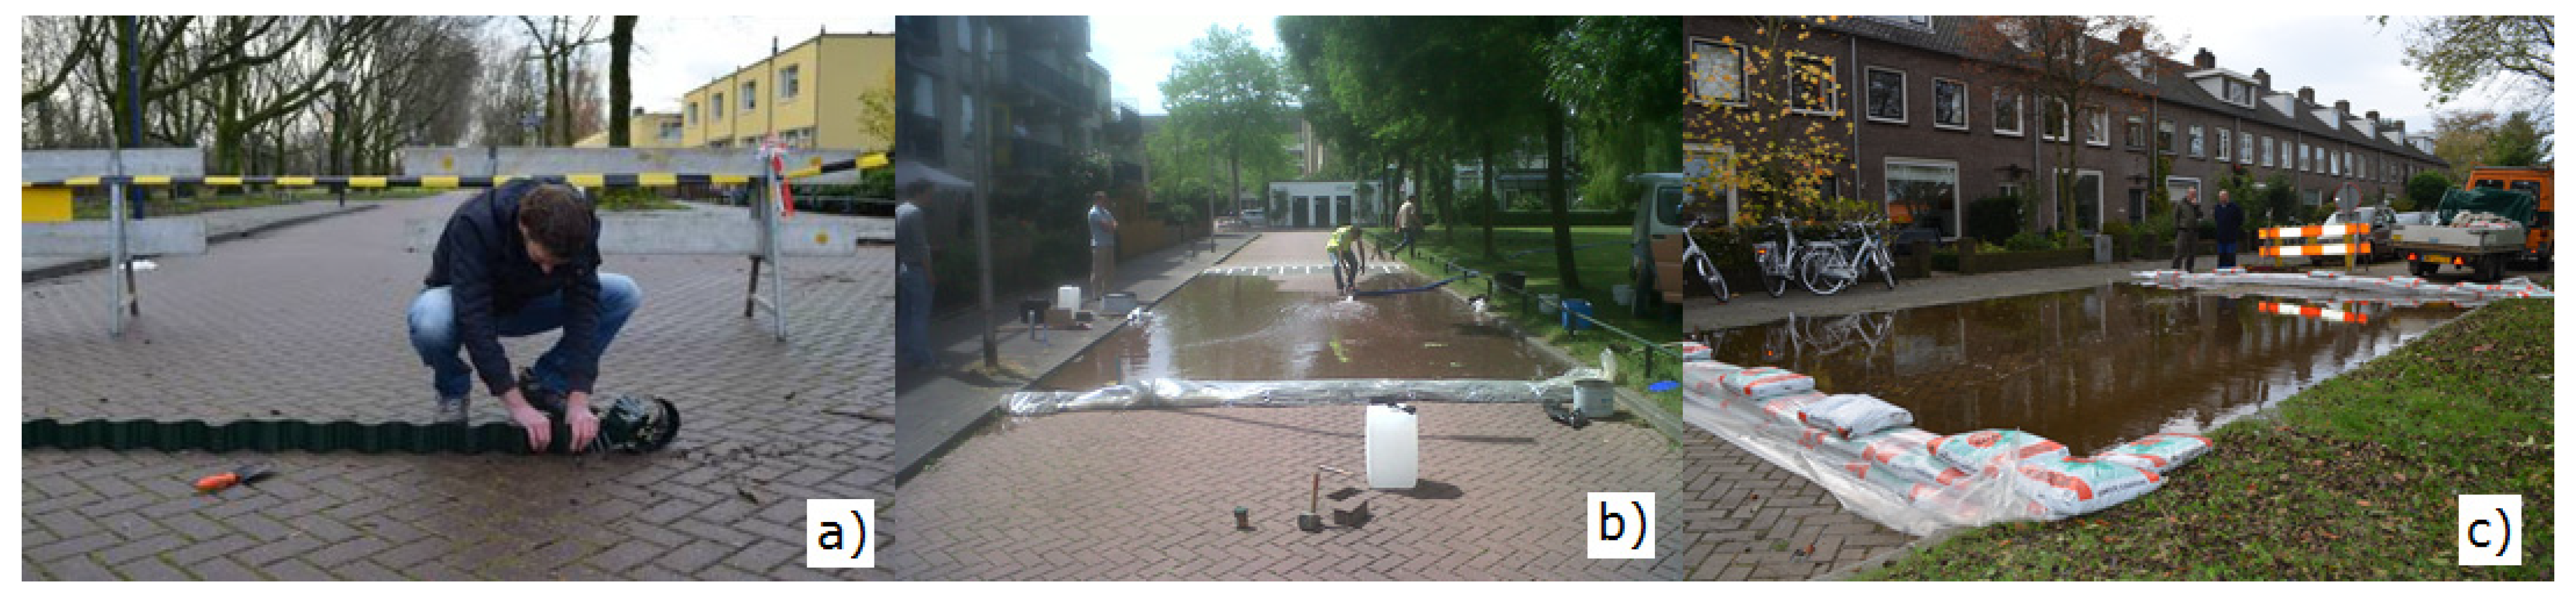
2.2.1 Recommendations
2.3. Water Supply

2.3.1 Recommendations
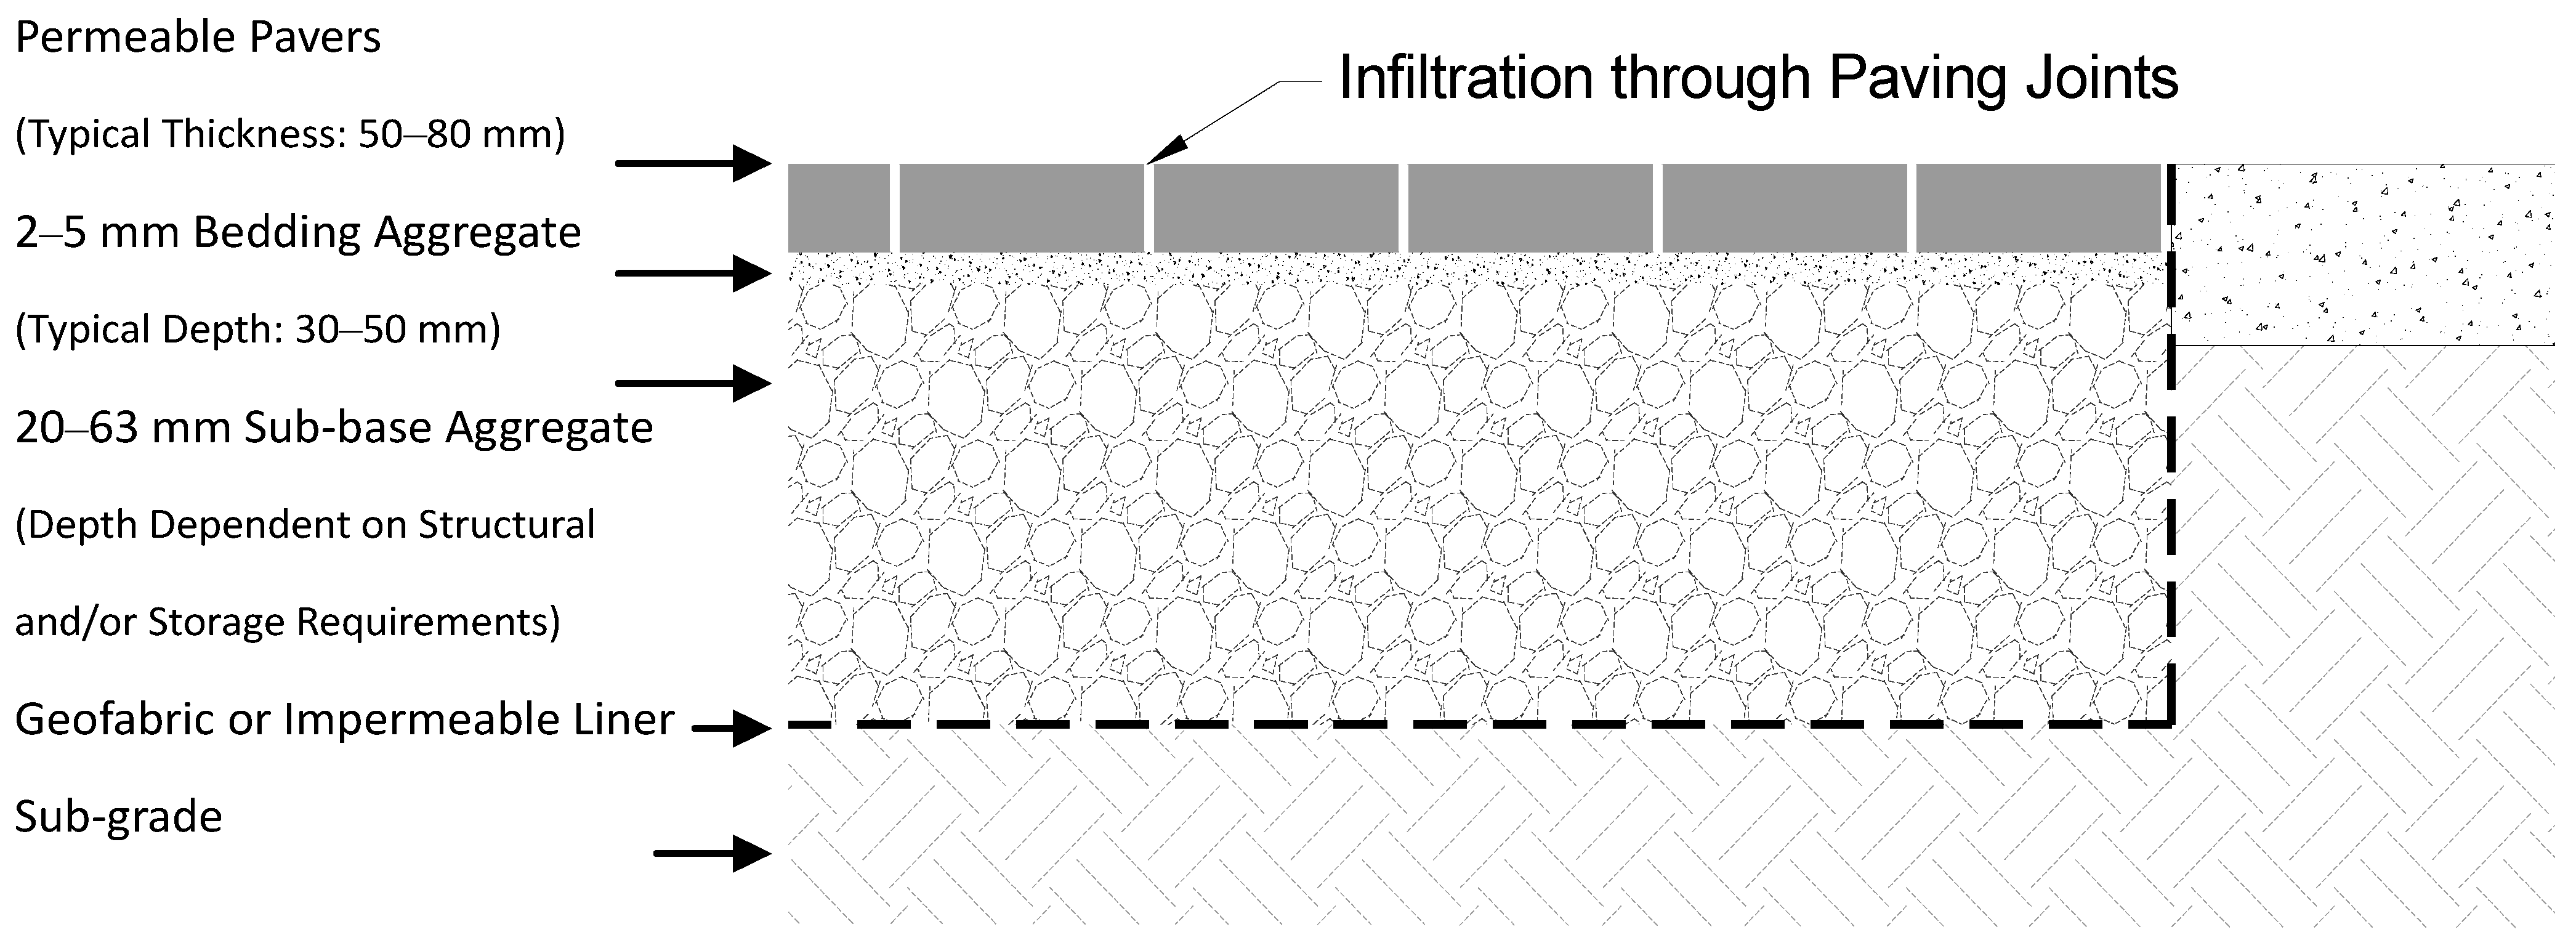
2.4. Determining Pavement Infiltration Rates
- Hand measurements;
- Calibrated underwater camera;
- Time-lapse photography.

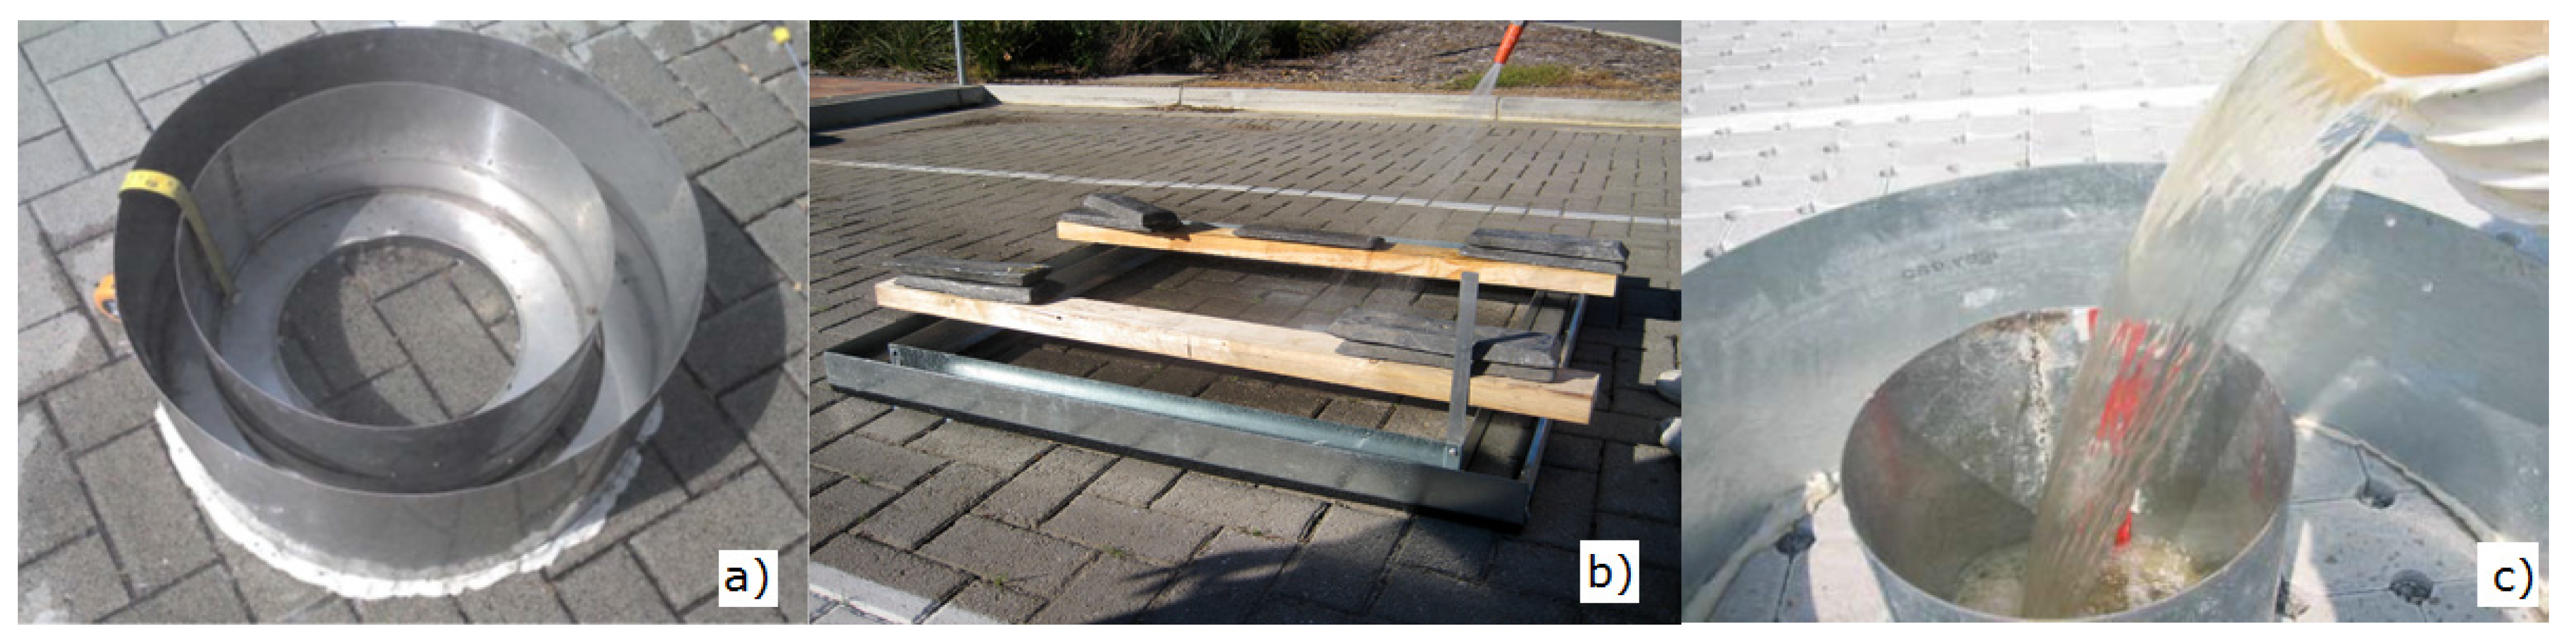
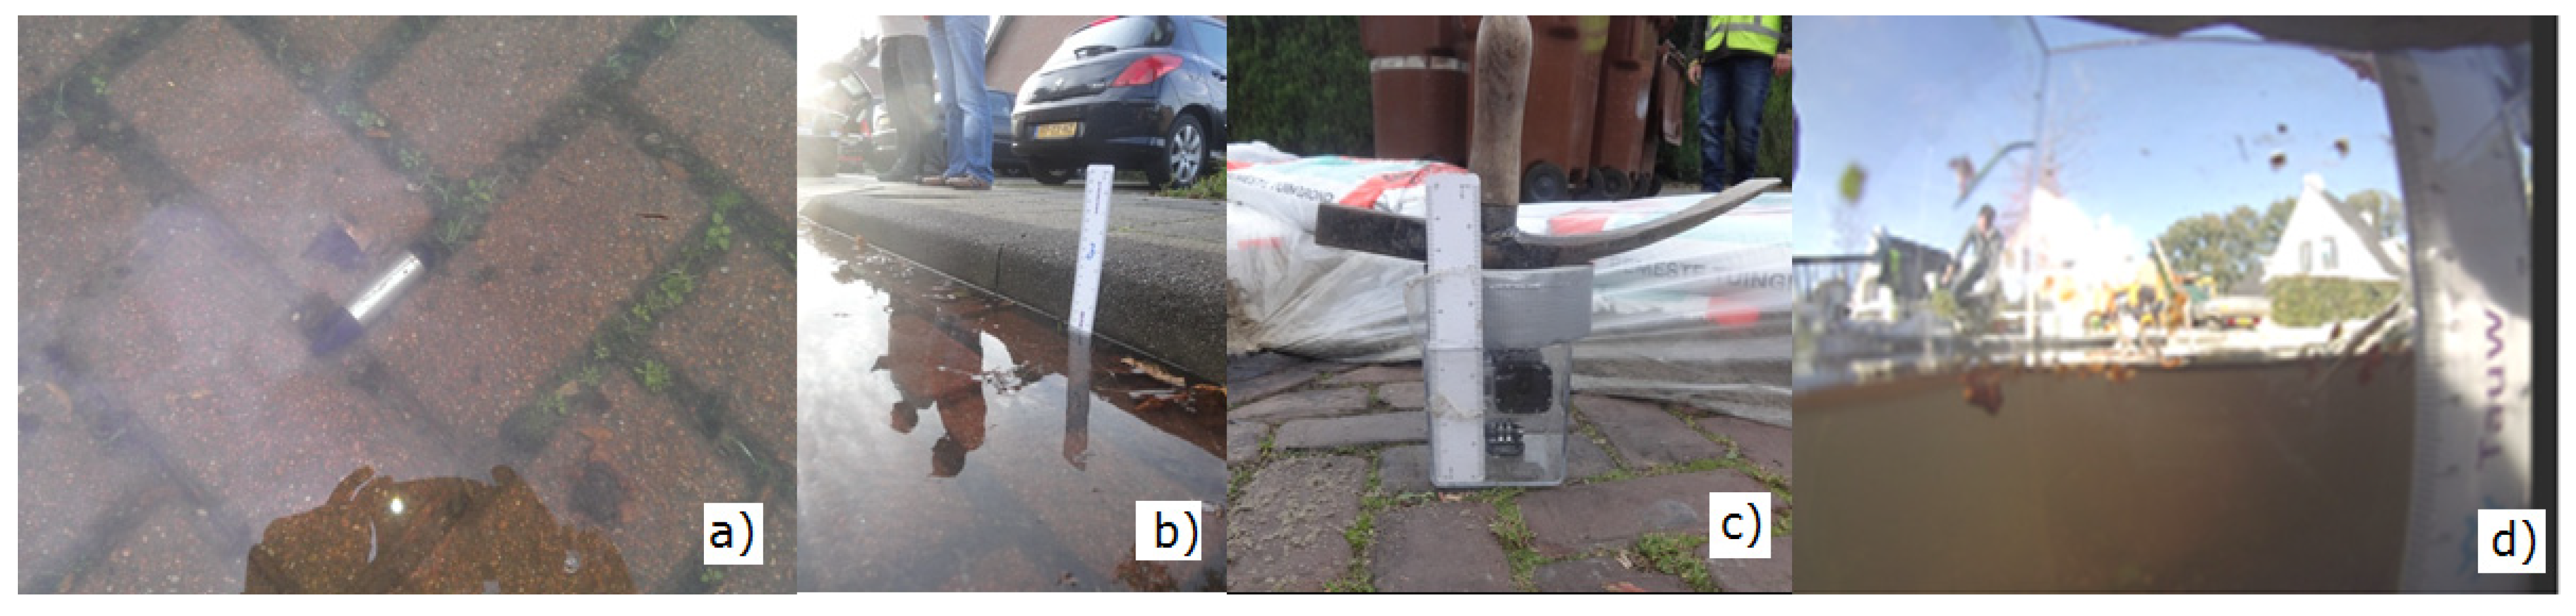
2.4.1. Hand Measurements
2.4.2. Calibrated Underwater Camera
2.4.3. Time-Lapse Photography
2.4.4. Recommendations
2.5. Study Test Locations

| Test location | Street name | Type of pavement | Year of construction | Test area (m2) | Test date |
|---|---|---|---|---|---|
| Zwolle 1 | Pieterzeemanlaan | Porous Concrete PCIP | 2006 | 44.2 | 11/15/2013 |
| Zwolle 2 | Pieterzeemanlaan | Porous Concrete PCIP | 2006 | 39.9 | 11/15/2013 |
| Dussen 1 | Groot Zuideveld | Impermeable Concrete PCIP | 2006 | 59.5 | 10/23/2013 |
| Dussen 2 | Groot Zuideveld | Impermeable Concrete PCIP | 2006 | 69.7 | 10/23/2013 |
| Effen 1 | Baanakker | Impermeable Concrete PCIP | 2006 | 29.4 | 10/30/2013 |
| Utrecht 1 | Nijeveldsingel | Impermeable Concrete PCIP | 2006 | 51.9 | 11/28/2012 |
| Utrecht 2 | Brasemstraat | Impermeable Concrete PCIP | 2006 | 60.0 | 06/13/2013 |
| Delft 1 | Drukkerijlaan | Impermeable Concrete PCIP | 2005 | 74.0 | 06/19/2013 |
2.6. Calculating Infiltration Rates

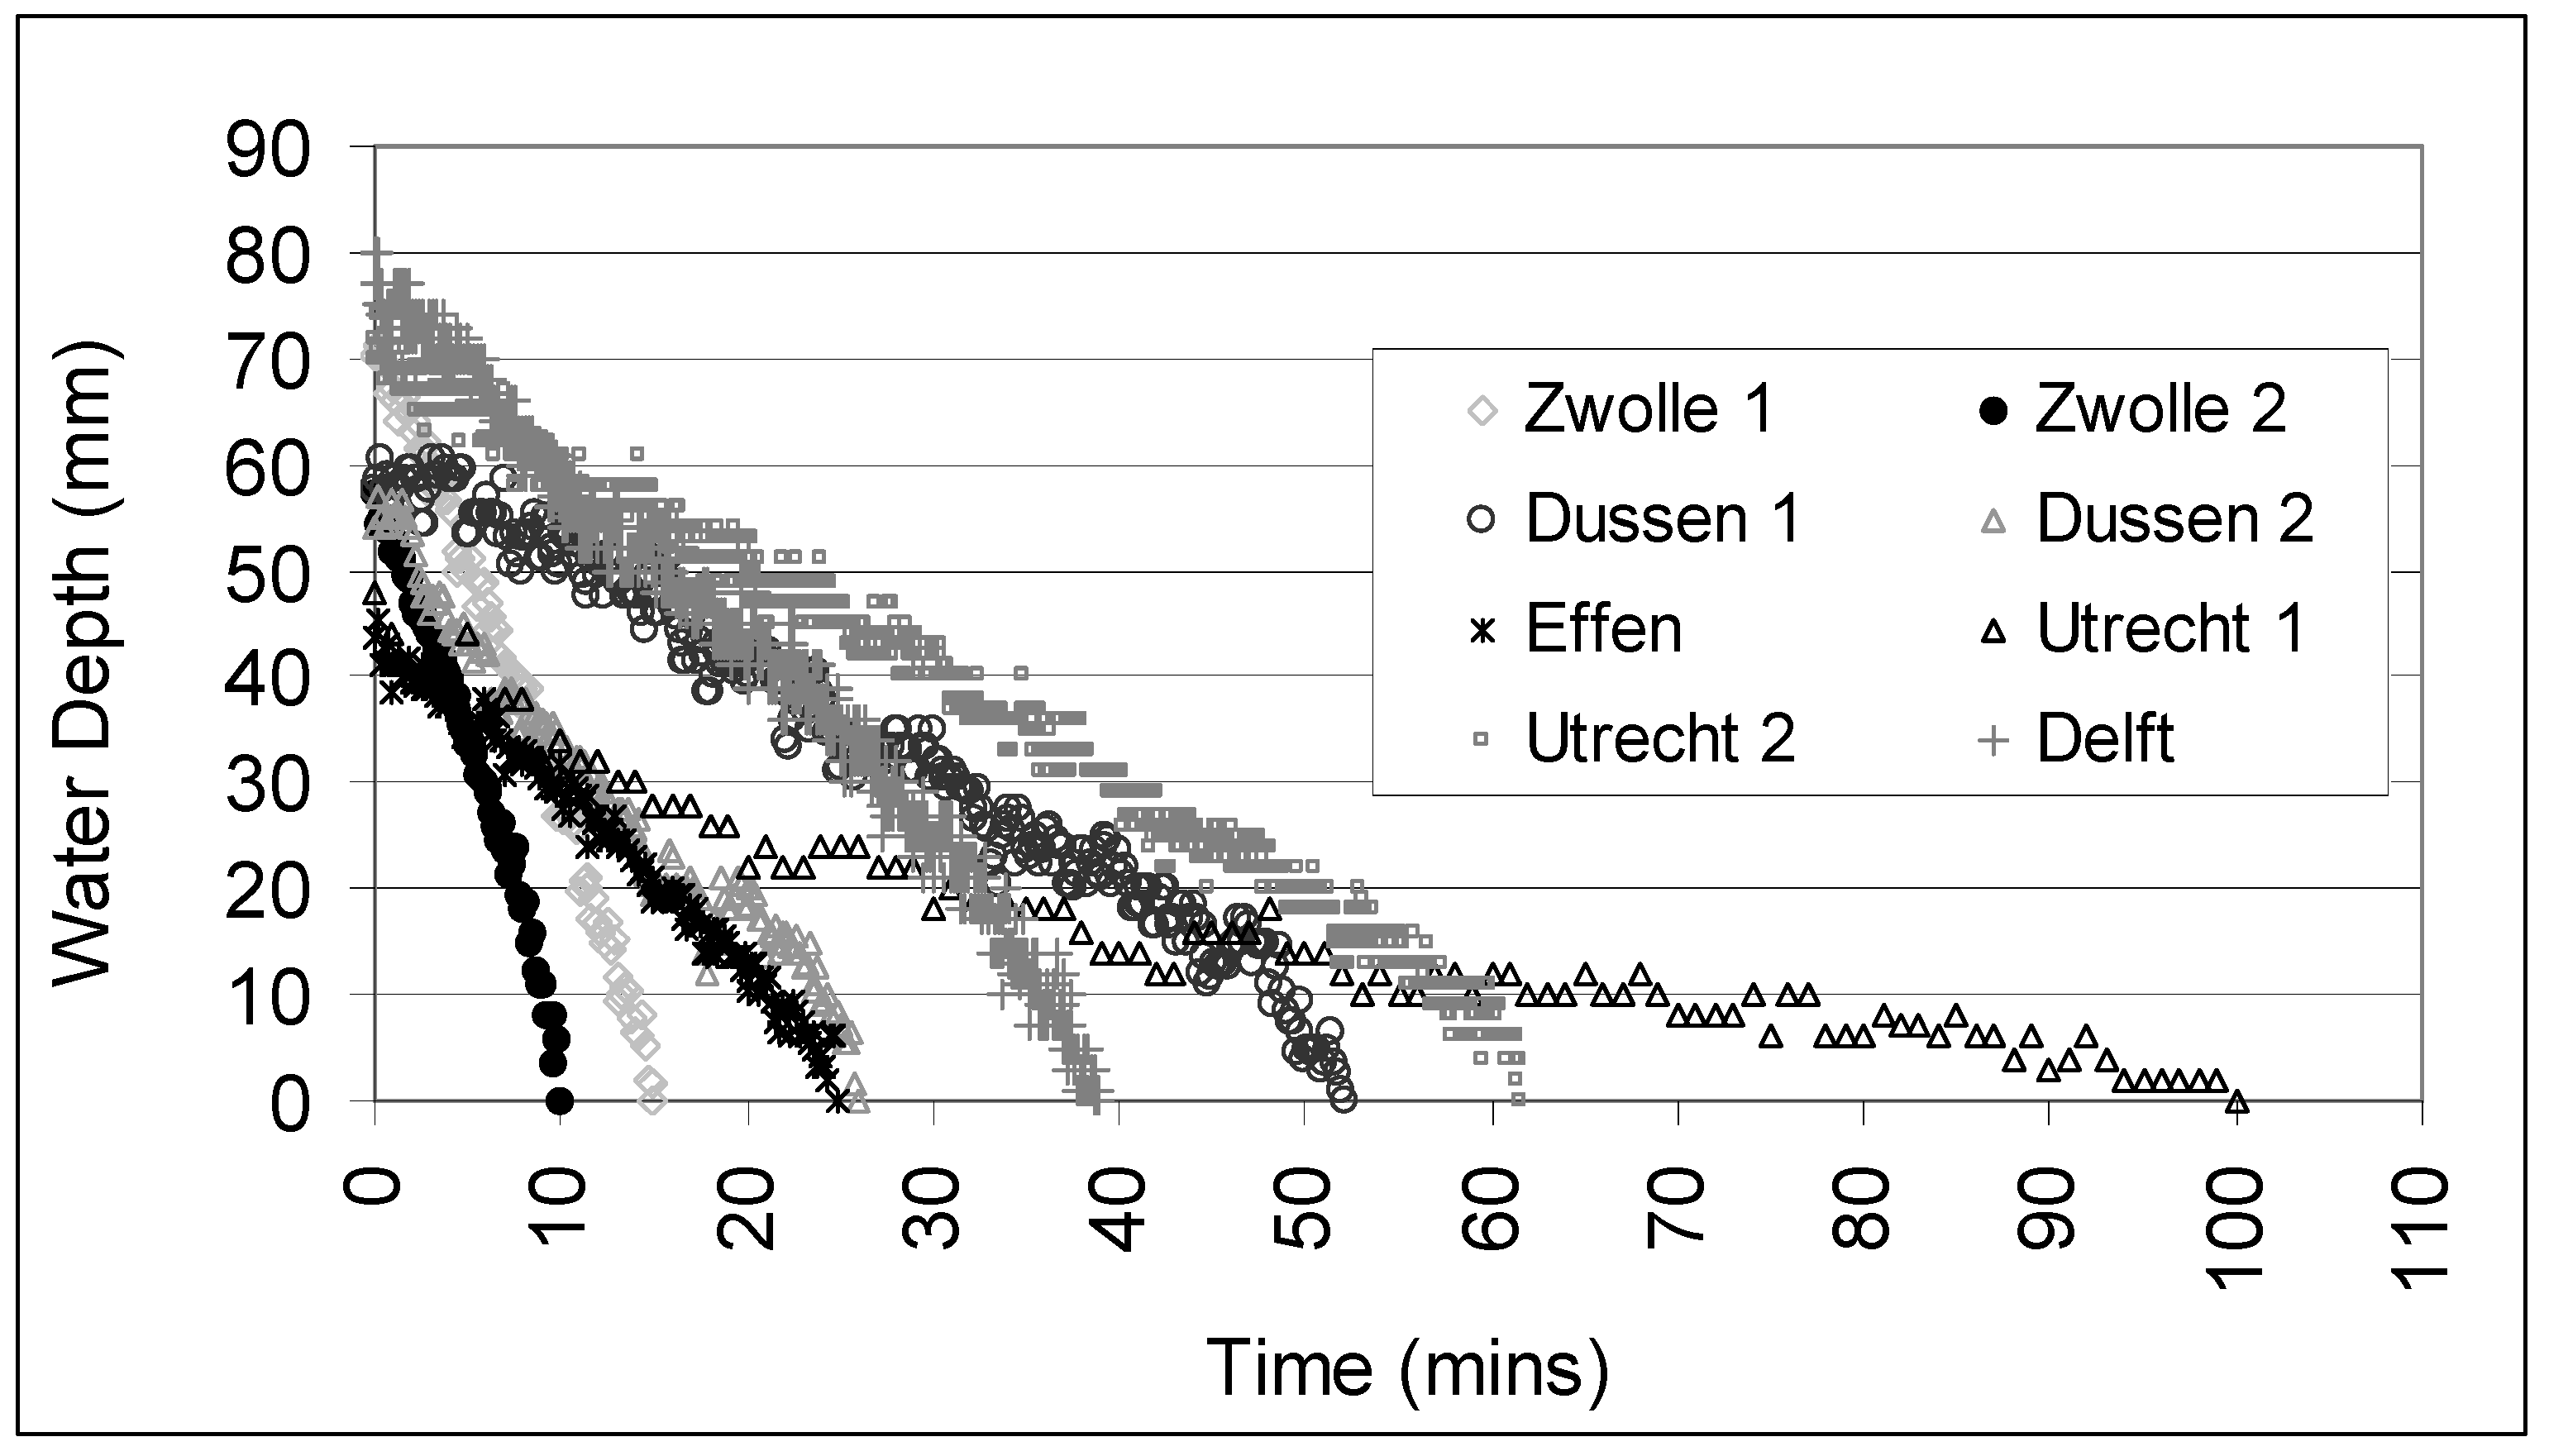
3. Results
| Test location | R2 | Equation | Max water level (mm) | Total time (mins) | Calculated infiltration (mm/h) | Percentage of recommended EU value (194 mm/h) |
|---|---|---|---|---|---|---|
| Zwolle 3 | 0.9844 | y = −5.211x + 58.935 | 57 | 10 | 342 | 176% |
| Zwolle 1 | 0.9928 | y = −4.634x + 73.373 | 71 | 15 | 284 | 146% |
| Dussen 2 | 0.9624 | y = −1.8498x + 52.742 | 57 | 26 | 132 | 68% |
| Delft 1 | 0.9821 | y = −1.8195x + 77.848 | 80 | 39 | 124 | 64% |
| Effen 1 | 0.9837 | y = −1.6099x + 44.451 | 45 | 25 | 109 | 56% |
| Utrecht 2 | 0.9792 | y = −1,031x + 70.576 | 72 | 61 | 71 | 36% |
| Dussen 1 | 0.979 | y = −1.0572x + 61.858 | 60 | 52 | 69 | 35% |
| Utrecht 1 | 0.8826 | y = −0.3577x + 34.154 | 48 | 100 | 29 | 15% |
4. Discussion
- Age: although most of the pavements were generally of a similar age range, it would be reasonable to expect small variations in surface infiltration capacity in the older pavements.
- Construction: While the construction of the test pavements were generally similar to that shown in Figure 1, there were slight differences between the sites. These included the size of the paving joints, different types of bedding aggregates and different pavement laying processes.
- Maintenance: There were distinct variations in the pavement maintenance procedures between the different municipalities. Some municipalities conducted occasional street sweeping of their permeable pavements. However, as this was done to all pavements, this is generally not considered as targeted maintenance to improve the permeable pavement performance and to reduce clogging.
- Variations in hydraulic ground conditions: The water table was higher at some pavement test locations (particularly in the western areas of the Netherlands), while the permeability of soils in the eastern test locations were generally higher.
- Environmental site conditions: The type and amount of trees surrounding the pavements were not the same. Trees are known to affect the infiltration rate of permeable pavements [15]. Other test pavement locations may have been affected by the close proximity of industrial areas.
- Pavement usage: There were distinct variations observed between the type and number of vehicles using the different pavements on a daily basis.
4.1. Dutch Permeable Pavement Infiltration Guidelines
“A minimum of three infiltration tests shall be performed. If all three tests demonstrate an average infiltration rate of equal to or greater than 194 mm/h (540 L/s/ha), the pavement is deemed to comply.”
5. Conclusions
Acknowledgments
Author Contributions
Conflicts of Interest
References
- Pratt, C.J.; Mantle, J.D.; Schofield, P.A. UK research into the performance of permeable pavement, reservoir structures in controlling stormwater discharge quantity and quality. Water Sci. Technol. 1995, 32, 63–69. [Google Scholar]
- Hunt, B.; Stevens, S.; Mayes, D. Permeable pavement use and research at two sites in Eastern North Carolina. In Proceedings of the 9th International Conference on Urban Drainage, Portland, OR, USA, 28 January 2002.
- Fletcher, T.D.; Duncan, H.P.; Poelsma, P.; Lloyd, S.D. Storm Water Flow and Quality, and the Effectiveness of Non-proprietary Storm Water Treatment Measures-a Review and Gap Analysis (Technical Report 04/8); Cooperative Research Centre for Catchment Hydrology: Melbourne, Australia, 2005. [Google Scholar]
- Bean, E.Z.; Hunt, W.F.; Bidelspach, D.A.; Burak, R.J. Study on the surface infiltration rate of permeable pavements. In Proceedings of the 1st Water and Environment Specialty Conference of the Canadian Society for Civil Engineering, Saskatoon, Canada, 2–5 June 2004.
- Collins, K.A.; Hunt, W.F.; Hathaway, J.M. Hydrologic comparison of four types of permeable pavement and standard asphalt in eastern North Carolina. J. Hydrol. Eng. 2008, 13, 1146–1157. [Google Scholar] [CrossRef]
- Dierkes, C.; Kuhlmann, L.; Kandasamy, J.; Angelis, G. Pollution retention capability and maintenance of permeable pavements. In Proceedings of the 9th ICUD, Portland, OR, USA, 8–13 September 2002.
- Brattebo, B.; Booth, D. Long-term stormwater quantity and quality performance of permeable pavement systems. J. Water Res. 2003, 37, 4369–4376. [Google Scholar] [CrossRef]
- Siriwardene, N.; Deletic, A.; Fletcher, T. Modelling of sediment transport through stormwater gravel filters over their lifespan. J. Environ. Sci. Technol. 2007, 41, 8099–8103. [Google Scholar] [CrossRef]
- Borgwardt, S. Long-term in-situ infiltration performance of permeable concrete block pavement. In Proceedings of the 8th International Conference on Concrete Block Paving, San Francisco, CA, USA, 6–8 November 2006.
- Gerrits, C.; James, W. Restoration of infiltration capacity of permeable pavers. In Proceedings of the 9th International Conference on Urban Storm Drainage, Portland, OR, USA, 8–13 September 2002.
- Yong, C.; Deletic, A. Factors that predict clogging through porous pavements. In Proceedings of the 7th International Conference on Water Sensitive Urban Design, Melbourne, Australia, 21–23 February 2012.
- Pezzaniti, D.; Beecham, S.; Kandasamy, J. Influence of clogging on the effective life of permeable pavements. J. Water Manag. 2009, 162, 76–87. [Google Scholar]
- Lucke, T.; Beecham, S. Field investigation of clogging in a permeable pavement system. J. Build. Res. Inf. 2011, 39, 603–615. [Google Scholar] [CrossRef]
- Beeldens, A.; Herrier, G. Water pervious pavement blocks: The Belgian experience. In Proceedings of the 8th International Conference on Concrete Block Paving, San Francisco, CA, USA, 6–8 November 2006.
- Fassman, E.; Blackbourn, S. Urban runoff mitigation by a permeable pavement system over impermeable soils. J. Hydrol. Eng. 2010, 15, 475–485. [Google Scholar] [CrossRef]
- Li, H.; Kayhanian, M.; Harvey, J.T. Comparative field permeability measurement of permeable pavements using ASTM C1701 and NCAT permeameter methods. J. Environ. Manag. 2013, 118, 144–152. [Google Scholar] [CrossRef]
- American Society for Testing and Materials ASTM D3385–09, Standard Test Method for Infiltration Rate of Soils in Field Using Double-Ring Infiltrometer; ASTM: West Conshohocken, PA, USA, 2009.
- American Society for Testing and Materials ATSM C1781M-13, Standard Test Method for Surface Infiltration Rate of Permeable Unit Pavement Systems; ASTM: West Conshohocken, PA, USA, 2013.
- Waterdoorlatende Bestratingselementen van Beton—Bindendverklaarde Versie (Assessment of Permeable Paving Concrete Elements), Report Number 2317. Kiwa Nederland, B.V. (Ed.) Rijswijk, The Netherlands, 21 March 2014.
- Van Dam, C.H.; Van de Ven, F.H.M. Infiltration in pavement. In Proceedings of the Third International Conference on Urban Storm Drainage, Chalmers University, Göteborg, Sweden, 4–8 June 1984; Balmer, P., Ed.;
- Lucke, T.; Boogaard, F.; van de Ven, F. Evaluation of a new experimental test procedure to more accurately determine the surface infiltration rate of permeable pavement systems. Urban Plan. Transp. Res. 2014. [Google Scholar] [CrossRef]
- Kayhanian, M.; Anderson, D.; Harvey, J.; Jones, D.; Muhunthan, B. Permeability measurement and scan imaging to assess clogging of pervious concrete pavements in parking lots. J. Environ. Manag. 2012, 95, 114–123. [Google Scholar] [CrossRef]
- Boogaard, F.; Lucke, T.; Beecham, S. Effect of age of permeable pavements on their infiltration function. Clean Soil Air Water 2014, 42, 146–152. [Google Scholar] [CrossRef]
- Technische Voorschriften PTV 122, Waterdoorlatende Betonstraatstenen En-Tegels (Technical Requirements for Permeable concrete paving blocks and tiles). Probeton VZW: Brussels, Belgium, 8 September 2009. Available online: http://www.probeton.be/media/doc_pdf/PTV/TV%20122_Uitgave%203.pdf (accessed on 13 May 2014).
- Opzoekingscentrum voor de Wegenbouw (OCW). Waterdoorlatende Verhardingen met Betonstraatstenen [Report on Permeable pavements with concrete paving on pervious pavements). Brussels, Belgium, 2008. Available online: http://www.brrc.be/pdf/mededelingen/med77t.pdf (accessed on 13 May 2014).
- Merkblatt für die Wasserdurchlässige Befestigung von Verkehrsflächen (Guidelines for the Laying of Trafficable Permeable Paving Systems); Forschungsgesellschaft für Strassen und Verkehrswesen (FGSV): Köln, Germany, 1998.
- Beheer van Infiltratievoorzieningen—Report No: C3200, (Management of Infiltration), Stichting RIONED: Ede, The Netherlands, December 2006.
- Beecham, S.; Pezzaniti, D.; Myers, B.; Shackel, B.; Pearson, A. Experience in the application of permeable interlocking concrete paving in Australia. In Proceedings of the 9th International Conference on Concrete Block Paving, Buenos Aires, Argentina, 18–21 October 2009.
© 2014 by the authors; licensee MDPI, Basel, Switzerland. This article is an open access article distributed under the terms and conditions of the Creative Commons Attribution license (http://creativecommons.org/licenses/by/3.0/).
Share and Cite
Boogaard, F.; Lucke, T.; Van de Giesen, N.; Van de Ven, F. Evaluating the Infiltration Performance of Eight Dutch Permeable Pavements Using a New Full-Scale Infiltration Testing Method. Water 2014, 6, 2070-2083. https://doi.org/10.3390/w6072070
Boogaard F, Lucke T, Van de Giesen N, Van de Ven F. Evaluating the Infiltration Performance of Eight Dutch Permeable Pavements Using a New Full-Scale Infiltration Testing Method. Water. 2014; 6(7):2070-2083. https://doi.org/10.3390/w6072070
Chicago/Turabian StyleBoogaard, Floris, Terry Lucke, Nick Van de Giesen, and Frans Van de Ven. 2014. "Evaluating the Infiltration Performance of Eight Dutch Permeable Pavements Using a New Full-Scale Infiltration Testing Method" Water 6, no. 7: 2070-2083. https://doi.org/10.3390/w6072070
APA StyleBoogaard, F., Lucke, T., Van de Giesen, N., & Van de Ven, F. (2014). Evaluating the Infiltration Performance of Eight Dutch Permeable Pavements Using a New Full-Scale Infiltration Testing Method. Water, 6(7), 2070-2083. https://doi.org/10.3390/w6072070