1. Introduction
Algal blooms occur naturally and may occur with regularity depending on weather and water conditions [
1,
2]. The likelihood of occurrence of an algal bloom depends on local conditions and the hydraulic characteristics of the water [
3]. Algal blooms generally occur in places where high levels of nutrients are present, in warm, sunny, and calm conditions [
4,
5]. At shallow depths in a canal or a lake, during summer and fall, sunlight penetrates the entire depth of the water column at that point and the water temperature increases greatly. Sunlight has a direct effect on the growth rates of phytoplankton. Phytoplankton uses sunlight to create their new cells. In addition, the growth rates of microorganisms increase in proportion to the increase in water temperature. Under sufficient sunlight and nutrient conditions, algal blooms have an increased probability of development. In Korea, these conditions occur during summer and early fall. Natural sources of nutrients, such as phosphorus or nitrogen compounds, can be supplemented by a variety of human activities. For example, in rural areas, agricultural runoff from fields can wash fertilizers into the water. In addition, animal wastes, atmospheric deposition, groundwater inflow, and sedimentation can be the nutrient sources [
6,
7]. In urban areas, nutrient sources can include treated wastewater from septic systems and sewage treatment plants, as well as urban storm water runoff that carries nonpoint-source pollutants such as lawn fertilizers and septic tank [
8,
9]. A healthy ecosystem needs to maintain a balance of nutrients that can sustain each organism’s life cycle. However, in an unhealthy ecosystem, this balance is destroyed by added nutrients and the associated blooms. Added nutrients are the main cause of organism growth. In the first stage, micro-algae grow rapidly to a critical point (algal blooms). They use the additional materials for the growth of macro-algae or laver. Next, the primary consumers grow by eating the algae.
Natural estuaries maintain a biological balance through buffer reactions and naturally controlled biodiversity. However, this balance could be disturbed by the inflow of additional nutrients, namely total phosphorus (T-P) and total nitrogen (T-N), due to heavy rainfall or human activities [
10,
11]. One of the results is a bloom identified by pond scums, a bad smell, and micro- and macro-algal bloom. In a natural ecosystem, organics (carbon) and nutrients (nitrogen and phosphorus) are recycled through biochemical reactions. Laver often appears in an adjacent coastal area in the West Sea during the summer season [
12]. Generally, laver is found floating or attached onto the surface of rocks. Under the conditions of high nutrient levels and high temperature with strong sunlight, the growth rates of laver increase rapidly and the seaweed covers large areas of the water surface [
13,
14]. The green laver’s bloom directly affects the photosynthesis of other phytoplankton. After the nutrients have been consumed and the temperature has decreased, the growth rate declines and the green laver forms spores for the next generation.
There have been many studies on the control of algal growth, and in particular, on the control of algal growth using hydraulic characteristics [
15,
16]. Chung
et al. [
17] and Lee
et al. [
12] simulated the effect of a weir on the control of algal blooms using a laterally averaged two-dimensional hydrodynamic and eutrophic model that could accommodate the vertical displacement of the weir following water level fluctuations in the Daecheong reservoir. Morillo
et al. [
18] determined the tracer dilution ratio (the ratio of inflow to outflow concentration) and two residence time scales (arrival time and cleansing time) as a function of lake geometry to verify the effect of impermeable curtains on the Silvan reservoir in Australia. Asaeda
et al. [
19] investigated the effect of impermeable curtains on algal growth to control algal growth in the Terauchi reservoir. Also, Dai
et al. [
20] evaluated the effect of the longitudinal hydrodynamic characteristics on the algal blooms for tributary embayments of a man-made lake in China. These methods are very effective for controlling algal growth by blocking the surface inflow. In this regard, it is necessary to investigate the impact of hydraulic characteristics and the algal blooms. Accordingly, the objectives of this study are to (1) analyze the ecological change in an artificial seawater channel through measurement; and (2) identify the effect of hydraulic characteristics on an algal bloom using a three-dimensional numerical model (FLOW-3D). Due to the temporary emergence of the scums and algal blooms in summer, it is difficult through statistical analysis to find direct correlations between the hydraulic characteristics and algal bloom. For this development, after detecting the spots of scum and algal blooms in summer, 3-D numerical simulations were conducted for the same domain.
2. Materials and Methods
2.1. Study Site Description
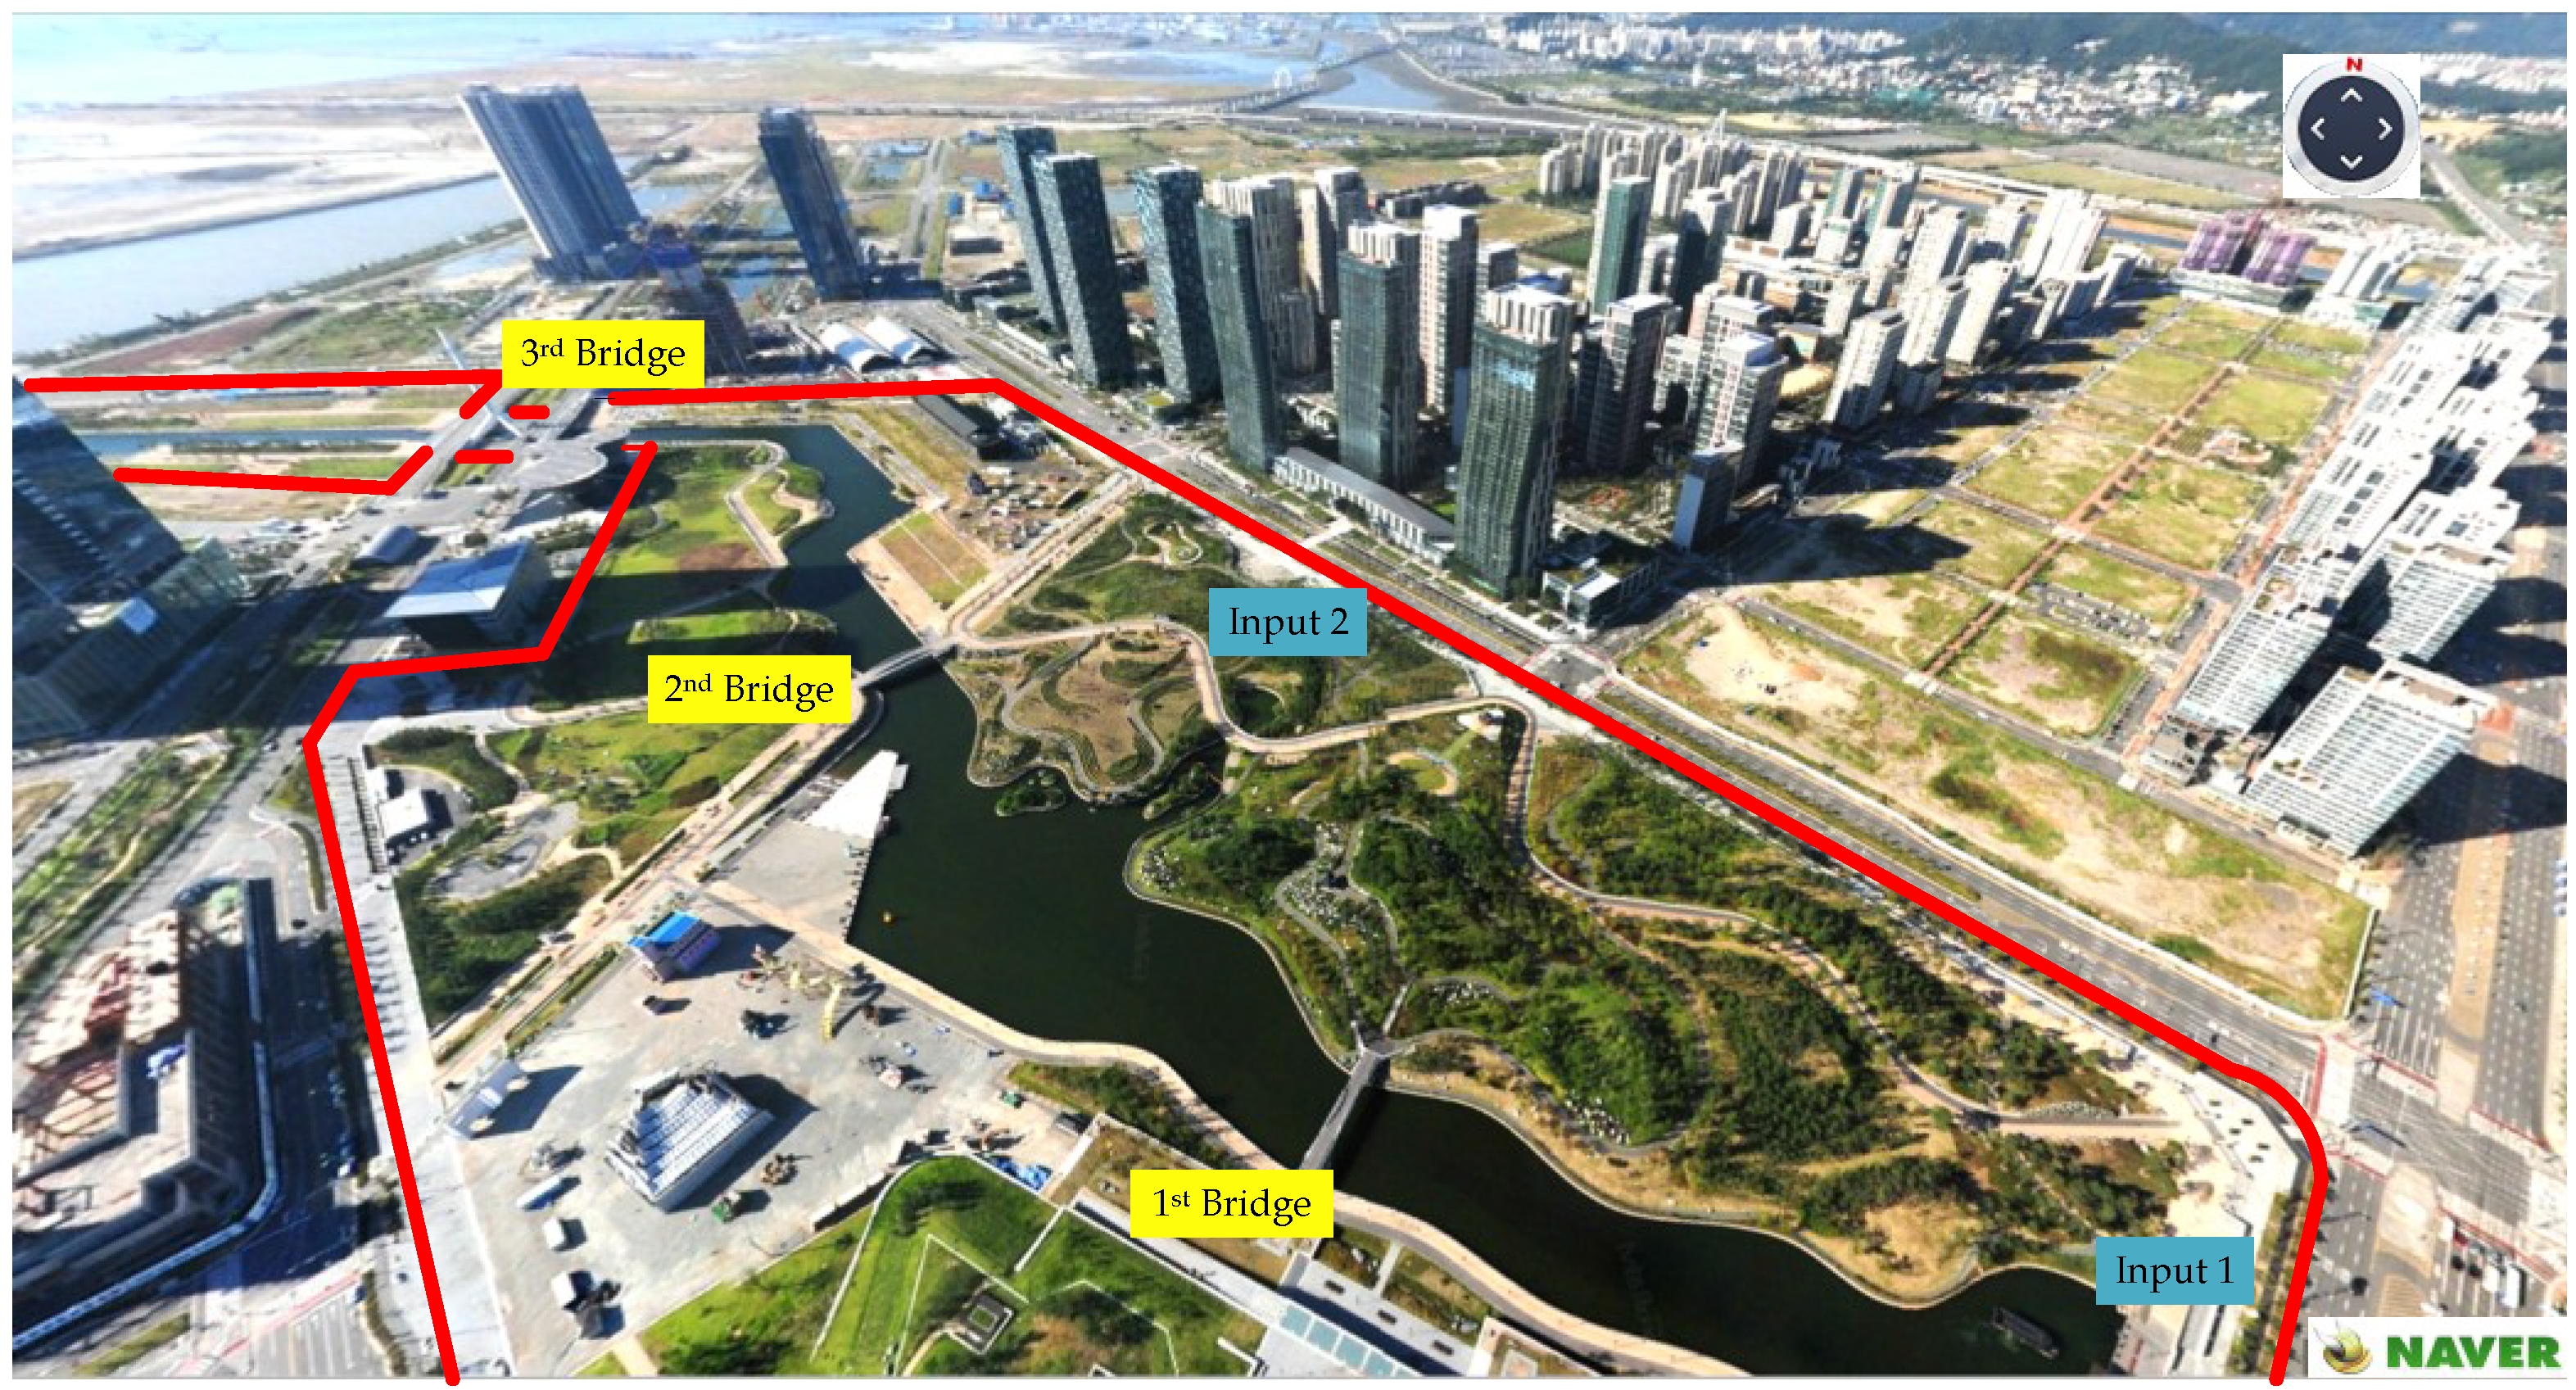
An artificial canal using seawater as its primary water source was constructed in Central Park, New Songdo City, South Korea (
Figure 1). The Central Park has the area of 411,324 m
2, and was constructed at a cost of 190 billion KRW in 2009. As a waterfront area to Incheon citizens, the Central Park was constructed to provide recreation and aesthetic pleasure in an urban region. The canal is a semi-closed water system, and its length is 1.8 km. Water depth is shallow (1.5 m) with variable width (maximum width of 110 m). Filtered seawater by STF (seawater treatment facility) is supplied by two inlets to the canal. Here, discharge conditions are 116 L/s at Inlet #1 and 15 L/s at Inlet #2. For the inflow of seawater from two inlets, the water depth of 1.5 m is regulated by the weir of the outlet. The man-made canal has two major conditions for maintenance: (1) the water source is seawater, filtered by a seawater treatment facility (STF); and (2) the canal has a semi-enclosed flow of very low velocity, equal shallow depth throughout, and a varying width. Seawater taken from an adjacent coastal area in the West Sea is supplied to the canal after filtering with a 5 μm pore size filter from two supply points. The filtered water from the STF flows into two inflow points (the Boat House and Anapji) in the canal and is discharged into the West Sea. It was reported that various species of phytoplankton communities are living in the coastal water of the West Sea [
21]. Since the seawater is collected from an adjacent coastal area in the West Sea, invading phytoplankton communities cause the growth of algal blooms when excess nutrients (eutrophication) are introduced into the canal. It is clear that nutrient-related eutrophication is a significant problem with respect to water quality worldwide [
22,
23,
24,
25,
26,
27].
The unique conditions of the canal in Central Park, New Songdo City directly affect the water quality, nutrient loading, and flushing rates. There are several water quality issues including the deterioration of water quality due to the geometric layout of the canal and hydraulic causes of flow, and red tide algal growth caused by nutrients in the artificial seawater canal. Total 54 phytoplankton including Bacillariophyceae, Dinophyceae, Ebryophyceae, and Euglenophyceae were found in the canal. Green laver spores from West Sea might come into canal through a testing booster pump because fully matured Green lavers were unexpectedly found in the canal during summer. Therefore, a proper nutrient balance in the canal is very important for prohibiting and controlling algal blooms, especially for the formation of scum, bad smell, and red tides. Filtration with 5 μm pore size and fewer than 10 days of hydraulic retention time may prevent algal blooms and the deterioration of the water quality.
Figure 1.
Study site: Central Park, New Songdo City, South Korea, reprinted with permission from [
28]. Copyright 2013 NAVER.
Figure 1.
Study site: Central Park, New Songdo City, South Korea, reprinted with permission from [
28]. Copyright 2013 NAVER.
2.2. Background
2.2.1. Monitoring of Nutrients
There are two main sources of pollution, i.e., point sources and non-point sources. The main point source in the canal is seawater, especially non-filtered seawater, because the water quality of such water changes dynamically, depending on the regional daily weather, seasonal climate, and sea currents. Although the seawater quality changes, the filtered water quality could be kept in a steady state. However, it may change because the minimum filter pore size of the STF was 5 μm and the average removal efficiency was 59.7% in this study. The other main sources of pollution are non-point sources such as soils washed by heavy rainfall, sand winds, and so on. There are several characteristics of non-point source pollution. One is the high pollution rate within a short time, while another is the high fluctuation of the pollutant concentrations. To establish a good and balanced ecosystem in the canal, organics (Chemical Oxygen Demand (COD), Total Organic Carbon (TOC), or Dissolved Organic Carbon (DOC)) and nutrient (T-N and T-P) conditions are very important. Nutrient conditions, in particular, are the most important for algal blooms. Microorganisms grow using organics and nutrients, and hence, under conditions of surplus nutrients, algal blooms could develop in the canal, changing the water color.
2.2.2. Numerical Model Theory (The FLOW-3D Model)
The numerical model employed in this study, Flow-3D, is a commercially available numerical analysis model developed by Flow Science Co. (New Mexico, NM, USA) [
29]. The governing equations of FLOW-3D were validated for surface water flow [
30,
31]. The model uses the continuity and momentum equations as governing differential equations. The general continuity equation (Equation (1)) is as follows:
where,
VF is the fluid elementary volume; ρ is the fluid density;
u,
v, and
w are the velocities of the moving fluid in the
x,
y, and
z directions, respectively; and
Ax,
Ay, and
Az are the elementary areas in each corresponding direction. The general momentum equation following the Navier-Stokes equation (Equation (2)) is as follows:
where,
Gx,
Gy, and
Gz denote the body force and
fx,
fy, and
fz denote the viscous force. For the interpretation of the free surface, the fluid volume per unit volume within a grid is expressed as the volume of fluid (VOF) function,
F(
x,
y,
z,
t). Equation (3) represents the general VOF function.
where,
Fdif is the diffusion of fluid fraction and
Fsour is the fluid source and sink.
2.3. Monitoring and Measurement in the Canal
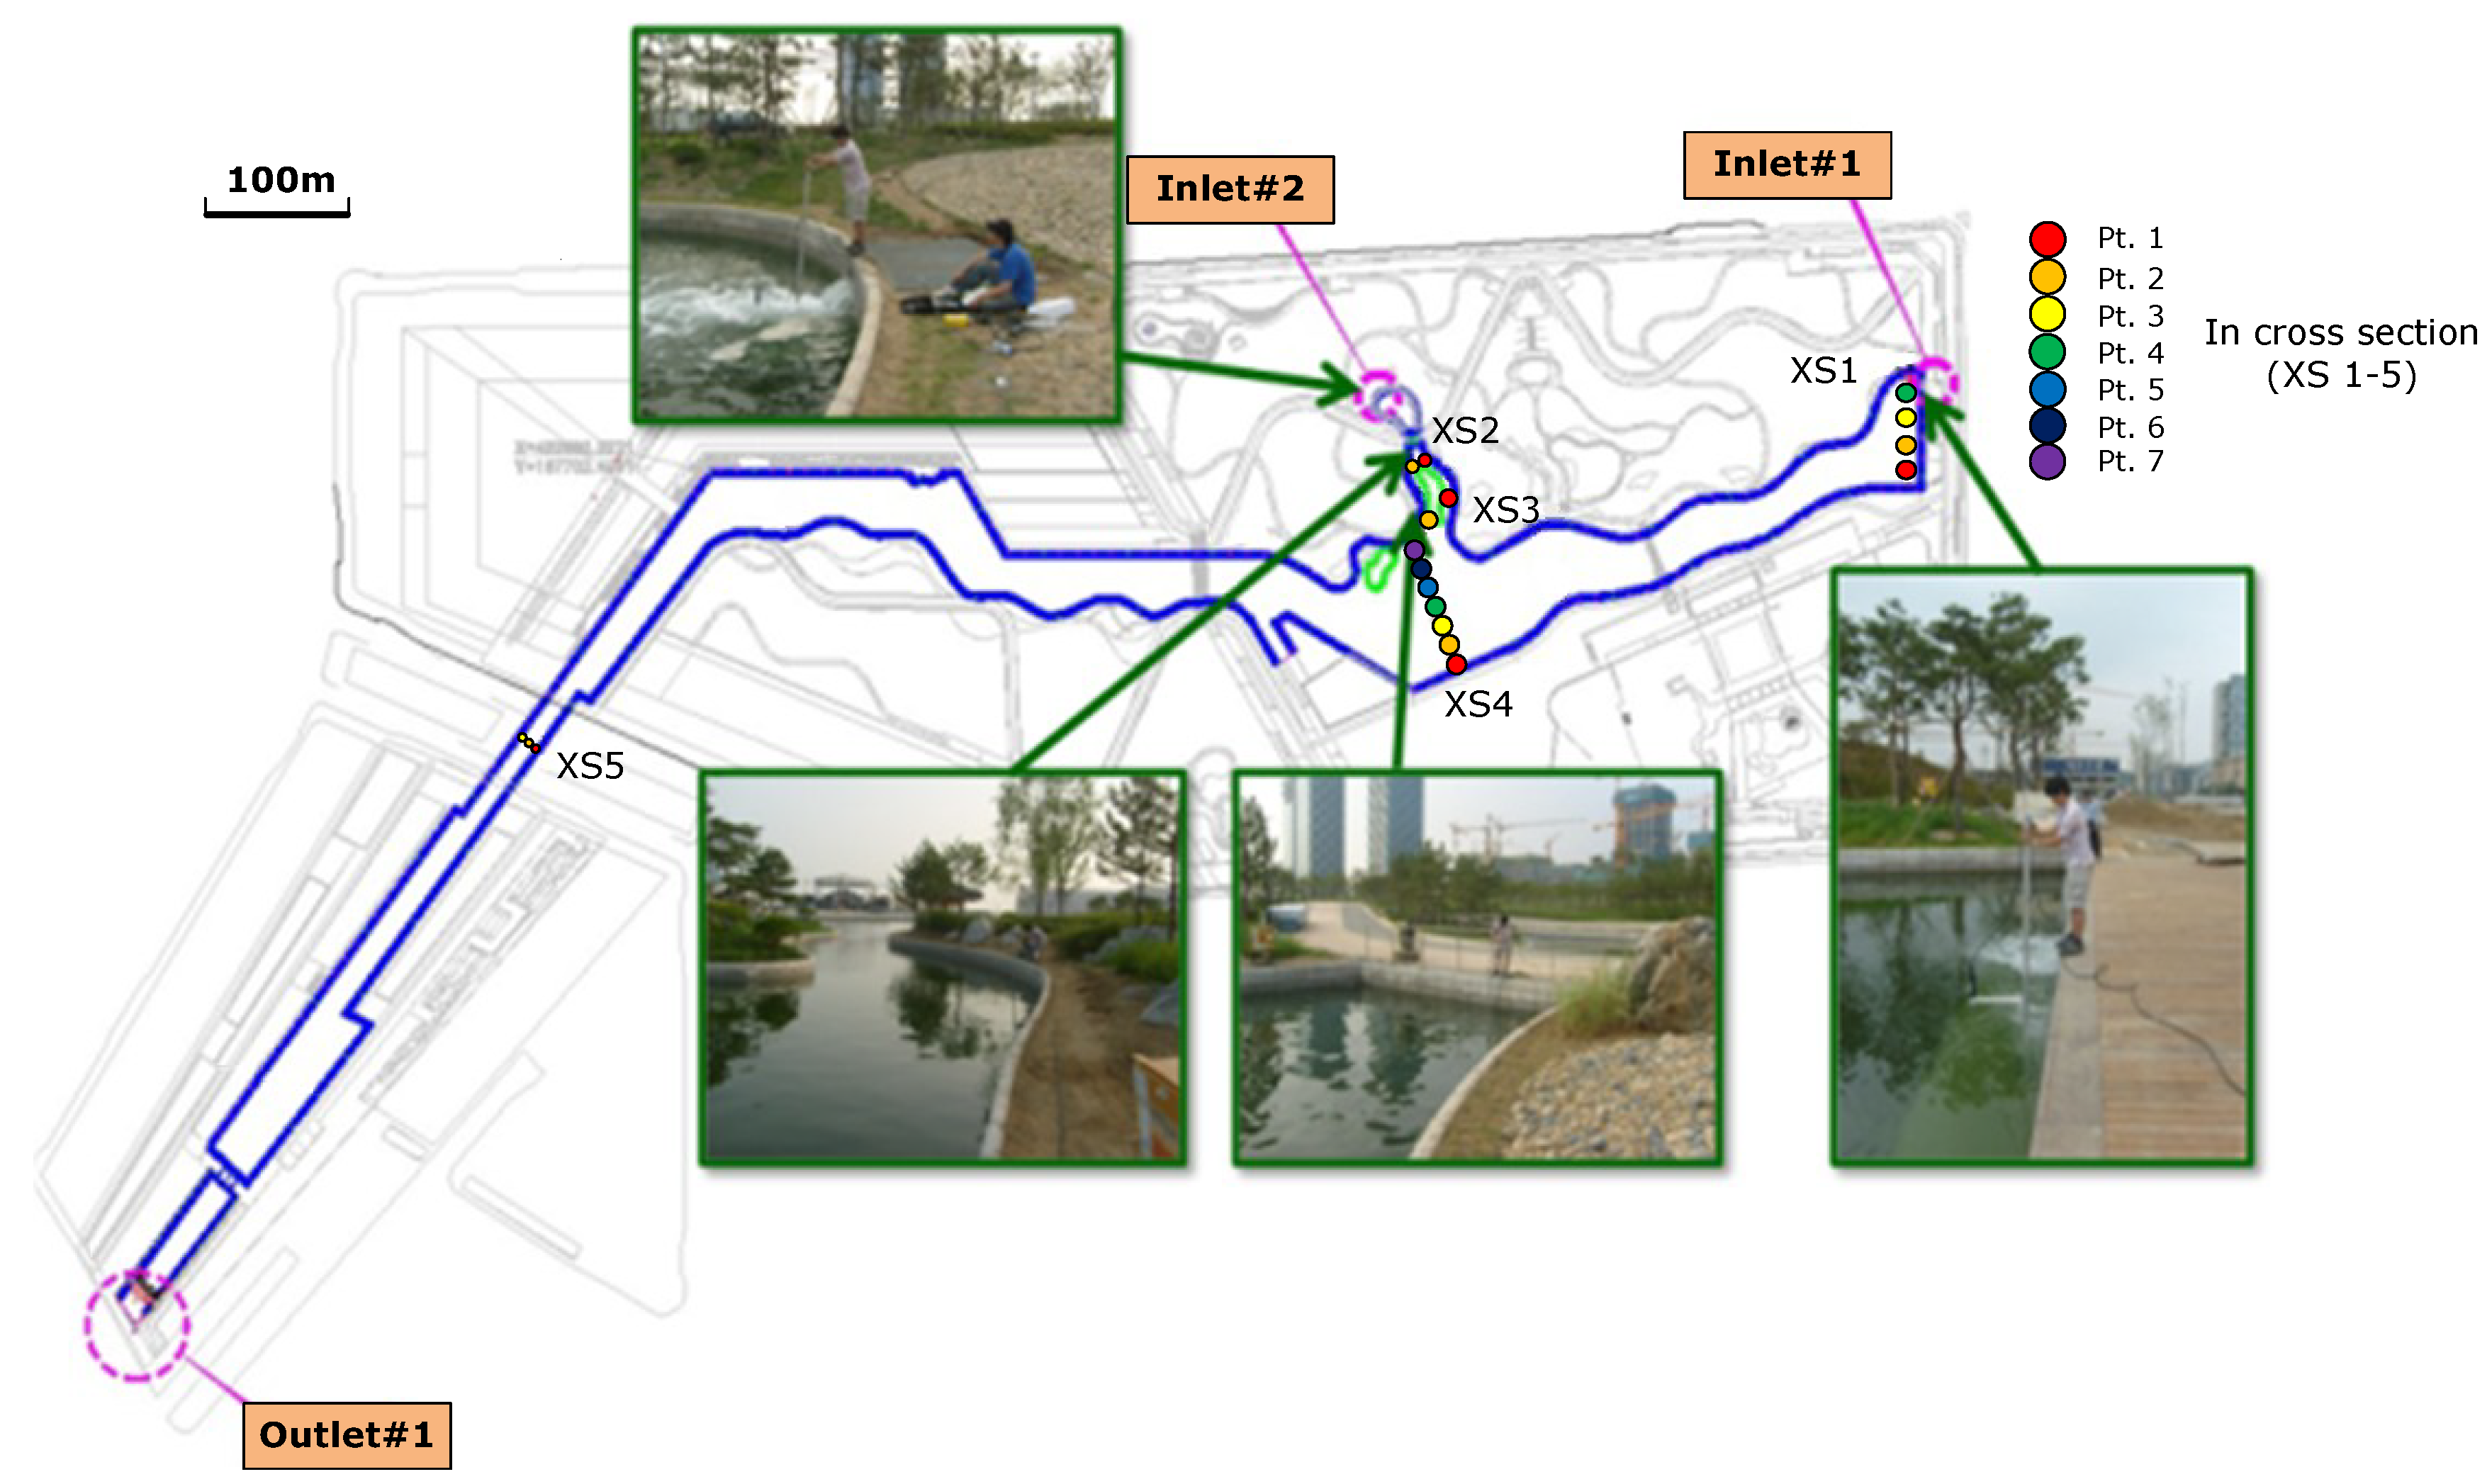
Two types of monitoring activities were performed in the Songdo canal. One was the monitoring of nutrients (T-N and T-P), and the other was the monitoring of hydraulic characteristics.
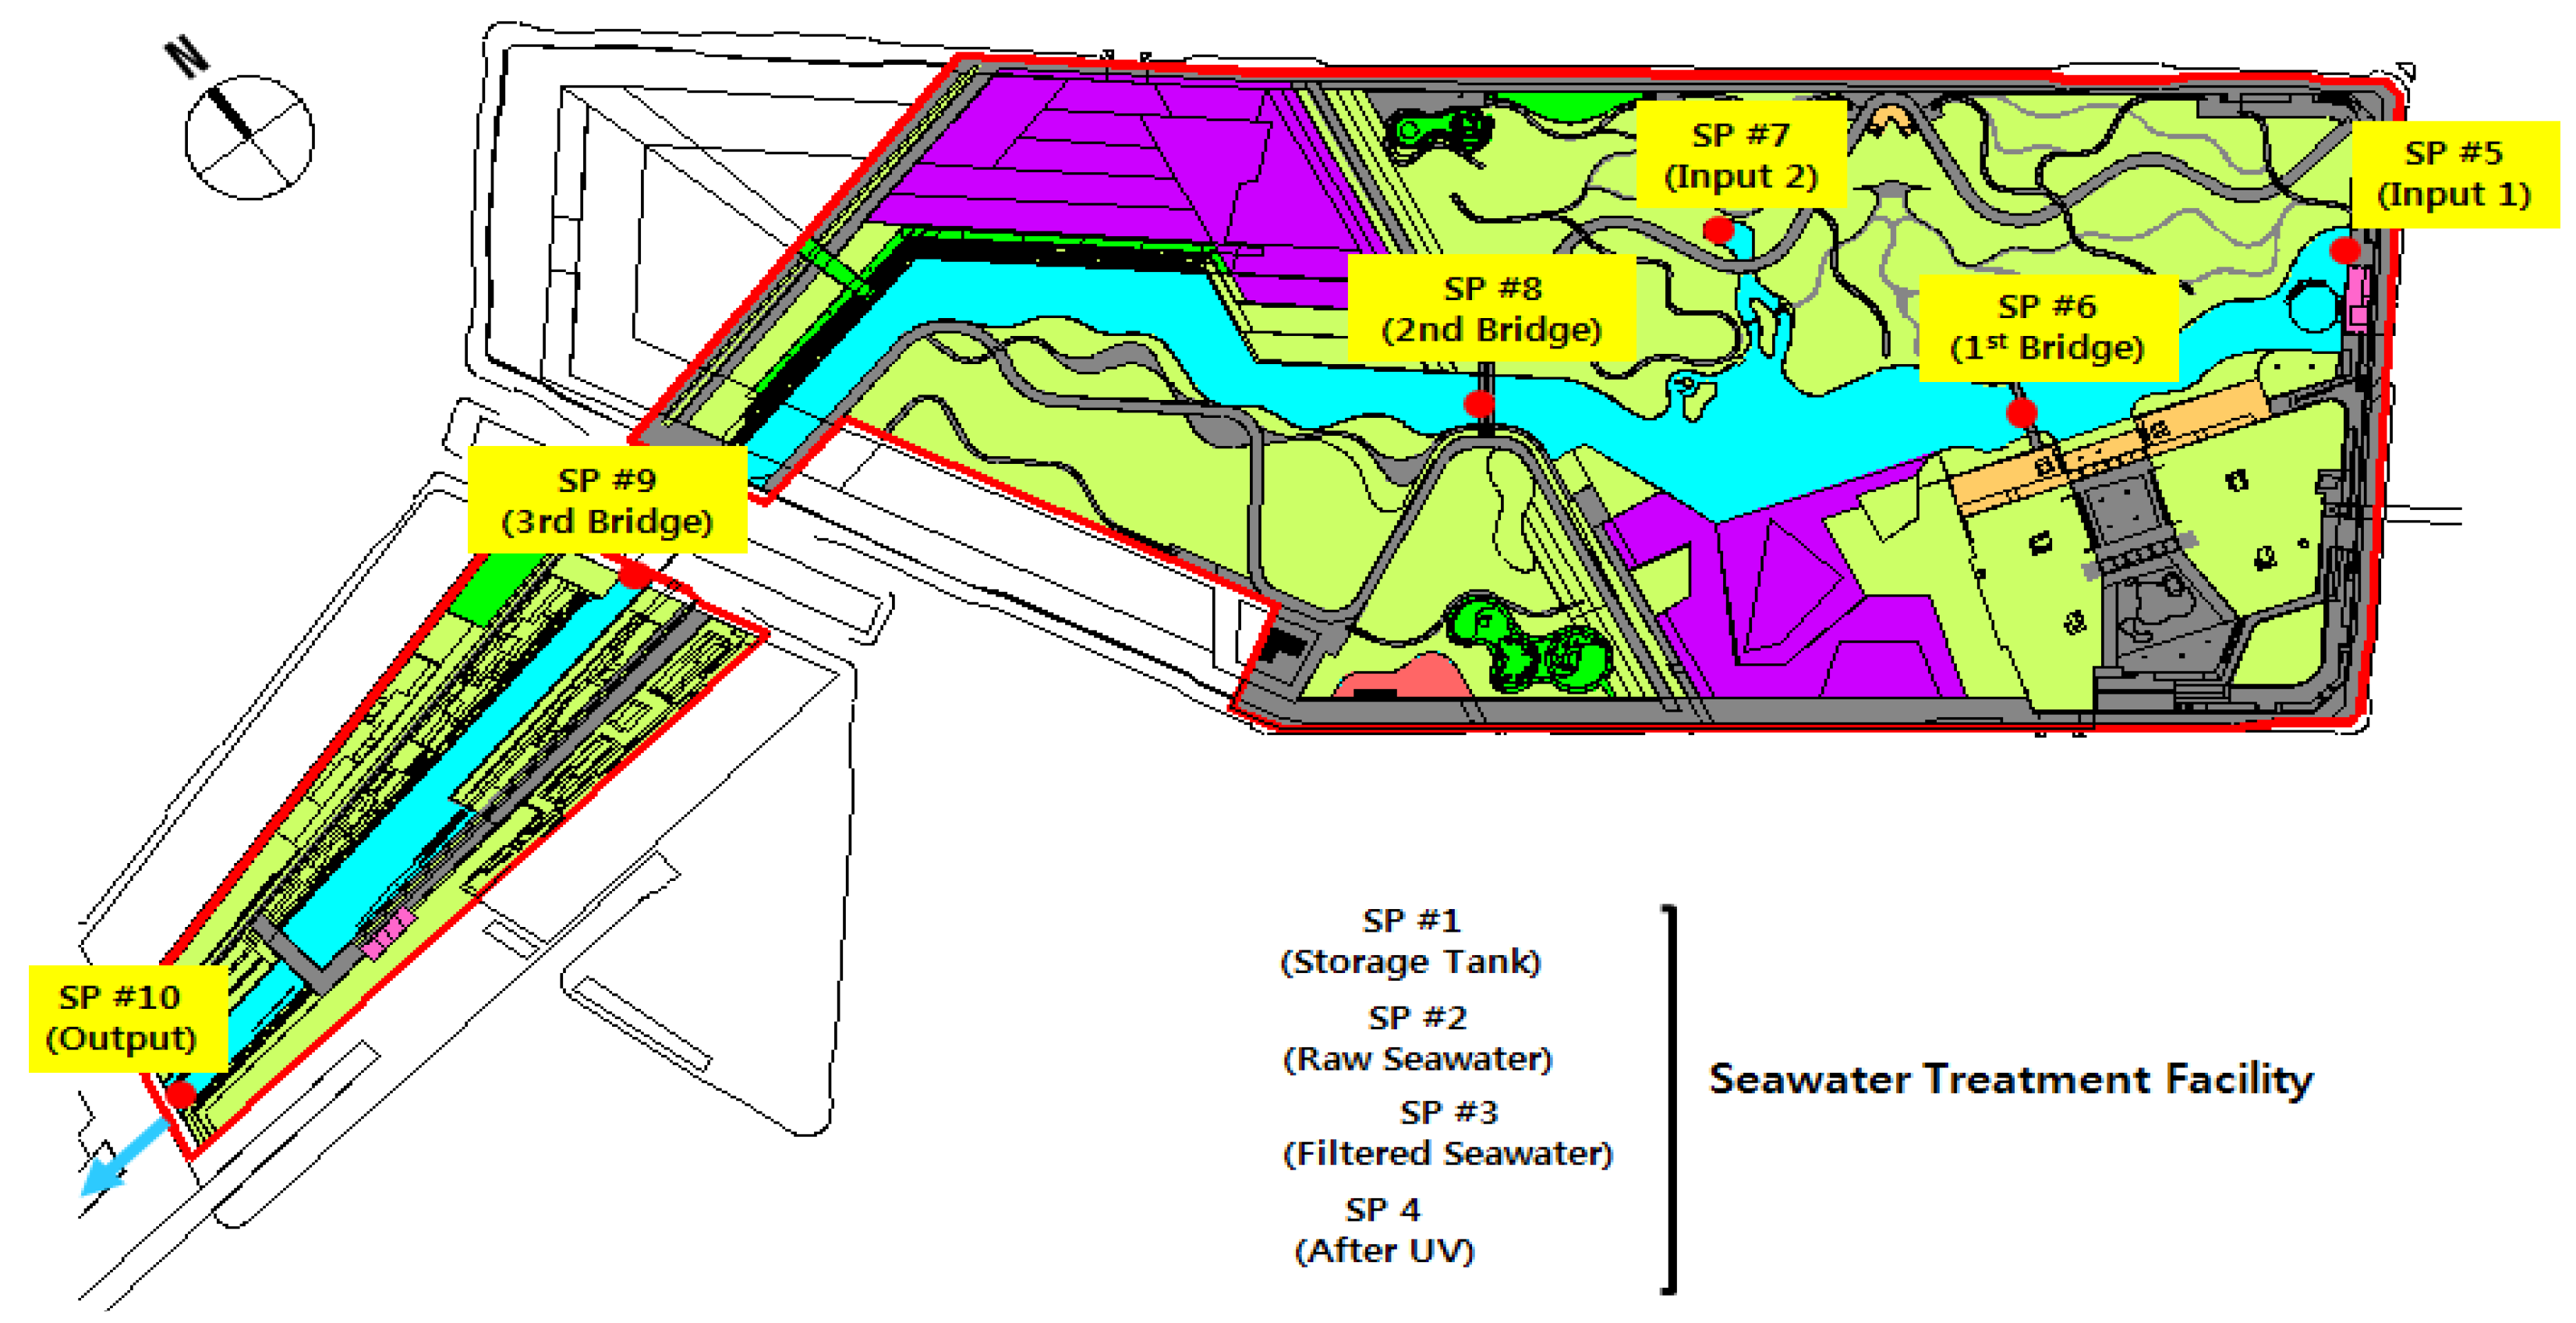
To monitor nutrients (T-N and T-P), 10 representative sampling points were selected, as shown in
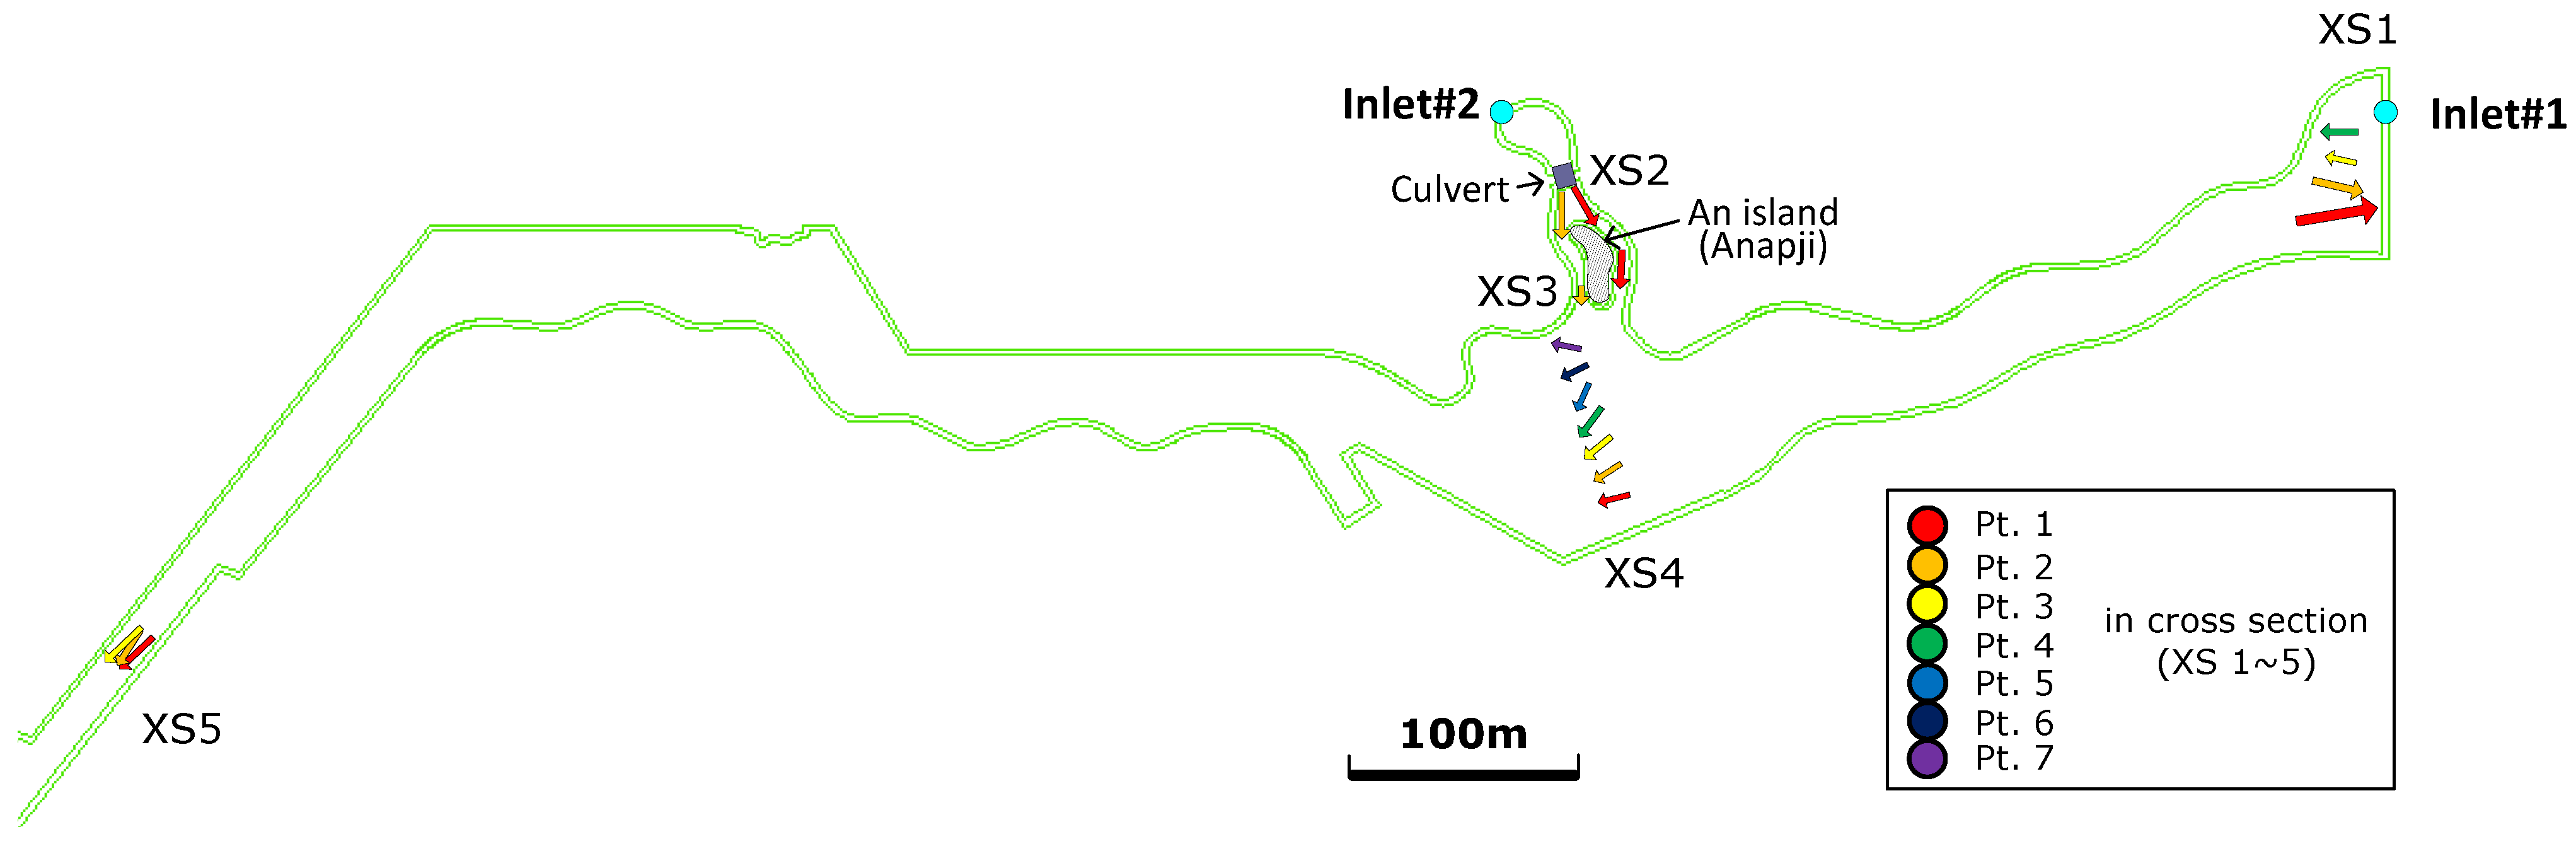
Figure 2. The first sampling point was the raw seawater in the storage tank of the STF. In the second sampling point, seawater that had been filtered by the multimedia filter of the STF was collected. The last six sampling points were located inside the canal and included the two inflow areas of the filtered seawater. They are the traffic bridge (SP#9), the two walking bridges across the canal (SP#6 and SP#8), the two input points (SP#5 and SP#7), and an output point of seawater (SP#10). To monitor hydraulic characteristics, five cross sections were selected, as shown in
Figure 3. The cross-sectional lines were determined by considering the characteristics, location, and purpose of canal management. In each cross section, three to five measuring points were selected, depending on the width of the cross section, where the maximum number of measurement points in one cross section was seven while the minimum was two.
Figure 2.
Sampling points (SP) for nutrients monitoring (T-N and T-P).
Figure 2.
Sampling points (SP) for nutrients monitoring (T-N and T-P).
Figure 3.
Sampling points (Pt.) for hydraulic characteristics monitoring in the cross section (XS).
Figure 3.
Sampling points (Pt.) for hydraulic characteristics monitoring in the cross section (XS).
2.3.1. Monitoring of Nutrients (T-N and T-P)
In this study, the plastic containers were used to collect water for analysis of the T-N and T-P. Sampling was conducted for each sampling point in the canal and STF (
Figure 2). The T-N and T-P determination tests were performed according to Ultraviolet Spectrophotometric Screening Method and Ascorbic Acid Method [
32]. For each sampling, the nutrients (T-N and T-P) were estimated three times, and the averaged values were used as representative values of nutrients at each point.
2.3.2. Monitoring of Flow Velocity
Two methods were selected to calculate the mean velocity of the measured data. One is the six-tenths depth method and the other is the three-point method. A velocimeter was used to measure the velocity at normal and low water levels, while a float rod was used to measure velocity at high water levels during flooding. The canal flow velocity measurements were performed under normal conditions (10 days turnover) using the two-dimensional and three-dimensional velocimeters.
The six-tenths depth method (employing the representative mean velocity measured at 0.6 of the total depth measured down from the water surface) uses the observed velocity at this depth. The three-point method (0.2, 0.6, and 0.8 of the total depth measured down from the water surface) uses the observed velocity for the three-dimensional velocity meter.
Velocity measurements at cross sections XS1 to XS5 were carried out using the two-dimensional velocity meter deployed from a boat, and the time series data from the velocity meter were recorded using a laptop computer. Measurements of each of the cross-sectional velocities were carried out onboard the boat for points in the canal, and standing on the canal wall for points near the edge of the canal.
The range of possible velocity measurements was 0.0001–0.001 m/s with an accuracy of ±0.000025 and ±0.005 m/s when using the three-dimensional Acoustic Doppler Velocimeter (3D ADV) and the two-dimensional Electromagnetic Current Meter (2D ECM), respectively. The measuring frequency was 25 Hz for the 3D ADV and 5 Hz for the 2D ECM, correspondingly. The recording time at each point was set to at least 2 min to obtain statistically measureable values.
2.4. Numerical Simulation
To conduct a three-dimensional numerical analysis to evaluate the hydraulic characteristics of the canal, a three-dimensional hydraulic numerical model, FLOW-3D, was employed to predict cross-sectional velocities, areas of the ‘dead zones’, and changes of vorticities inside the canal. The numerical results for the hydraulic characteristics were used to predict the locations of algal blooms based on the monitoring results. The calibrations of the FLOW-3D model for the meandering stream were shown in a previous study [
33]. FLOW-3D showed the high agreement between the field data and the simulations in the analysis of the velocity distribution of the open channel flow and the secondary flow. From these reasons, the FLOW-3D model is applied to the canal including an artificial island and a culvert.
In this study, a total of 285,000 meshes were used for the numerical experiment, divided into six blocks to improve calculation efficiency. The large eddy simulation (LES) model, designed for complex geometries, was employed as the turbulence closure model. The retention time of the filtered seawater in the canal was designed with the aim of reducing sedimentation and harmful algal blooms. Furthermore, considering the regional climate and weather changes, the canal operation could be modified. To satisfy the changes, the total water volume in the canal could be changed based on a retention time of 10 days (11,320 m3/day). When a 10-day retention time was maintained, the flow rate in the canal was 131 L/s. In this study, the simulations were conducted by incompressible flow condition with water density of 1030 kg/m3, and two boundary conditions were applied to the FOW-3D model. Upstream boundary condition is to supply constant discharge of 131 L/s from two inlets to the canal and downstream condition is to keep the water depth of 1.5 m. From these boundary conditions, the transient flow conditions were set for the numerical simulation, but as time passes the flow status can be steady because inflow and outflow were constantly regulated. The boundary conditions used for the numerical simulation in the canal are 1800 m for canal length, 110 m for maximum width, 1.5 m for initial water depth, and 11,320 m3/day for flow rate.
3. Results
3.1. Results from Monitoring of Nutrients (T-N and T-P)
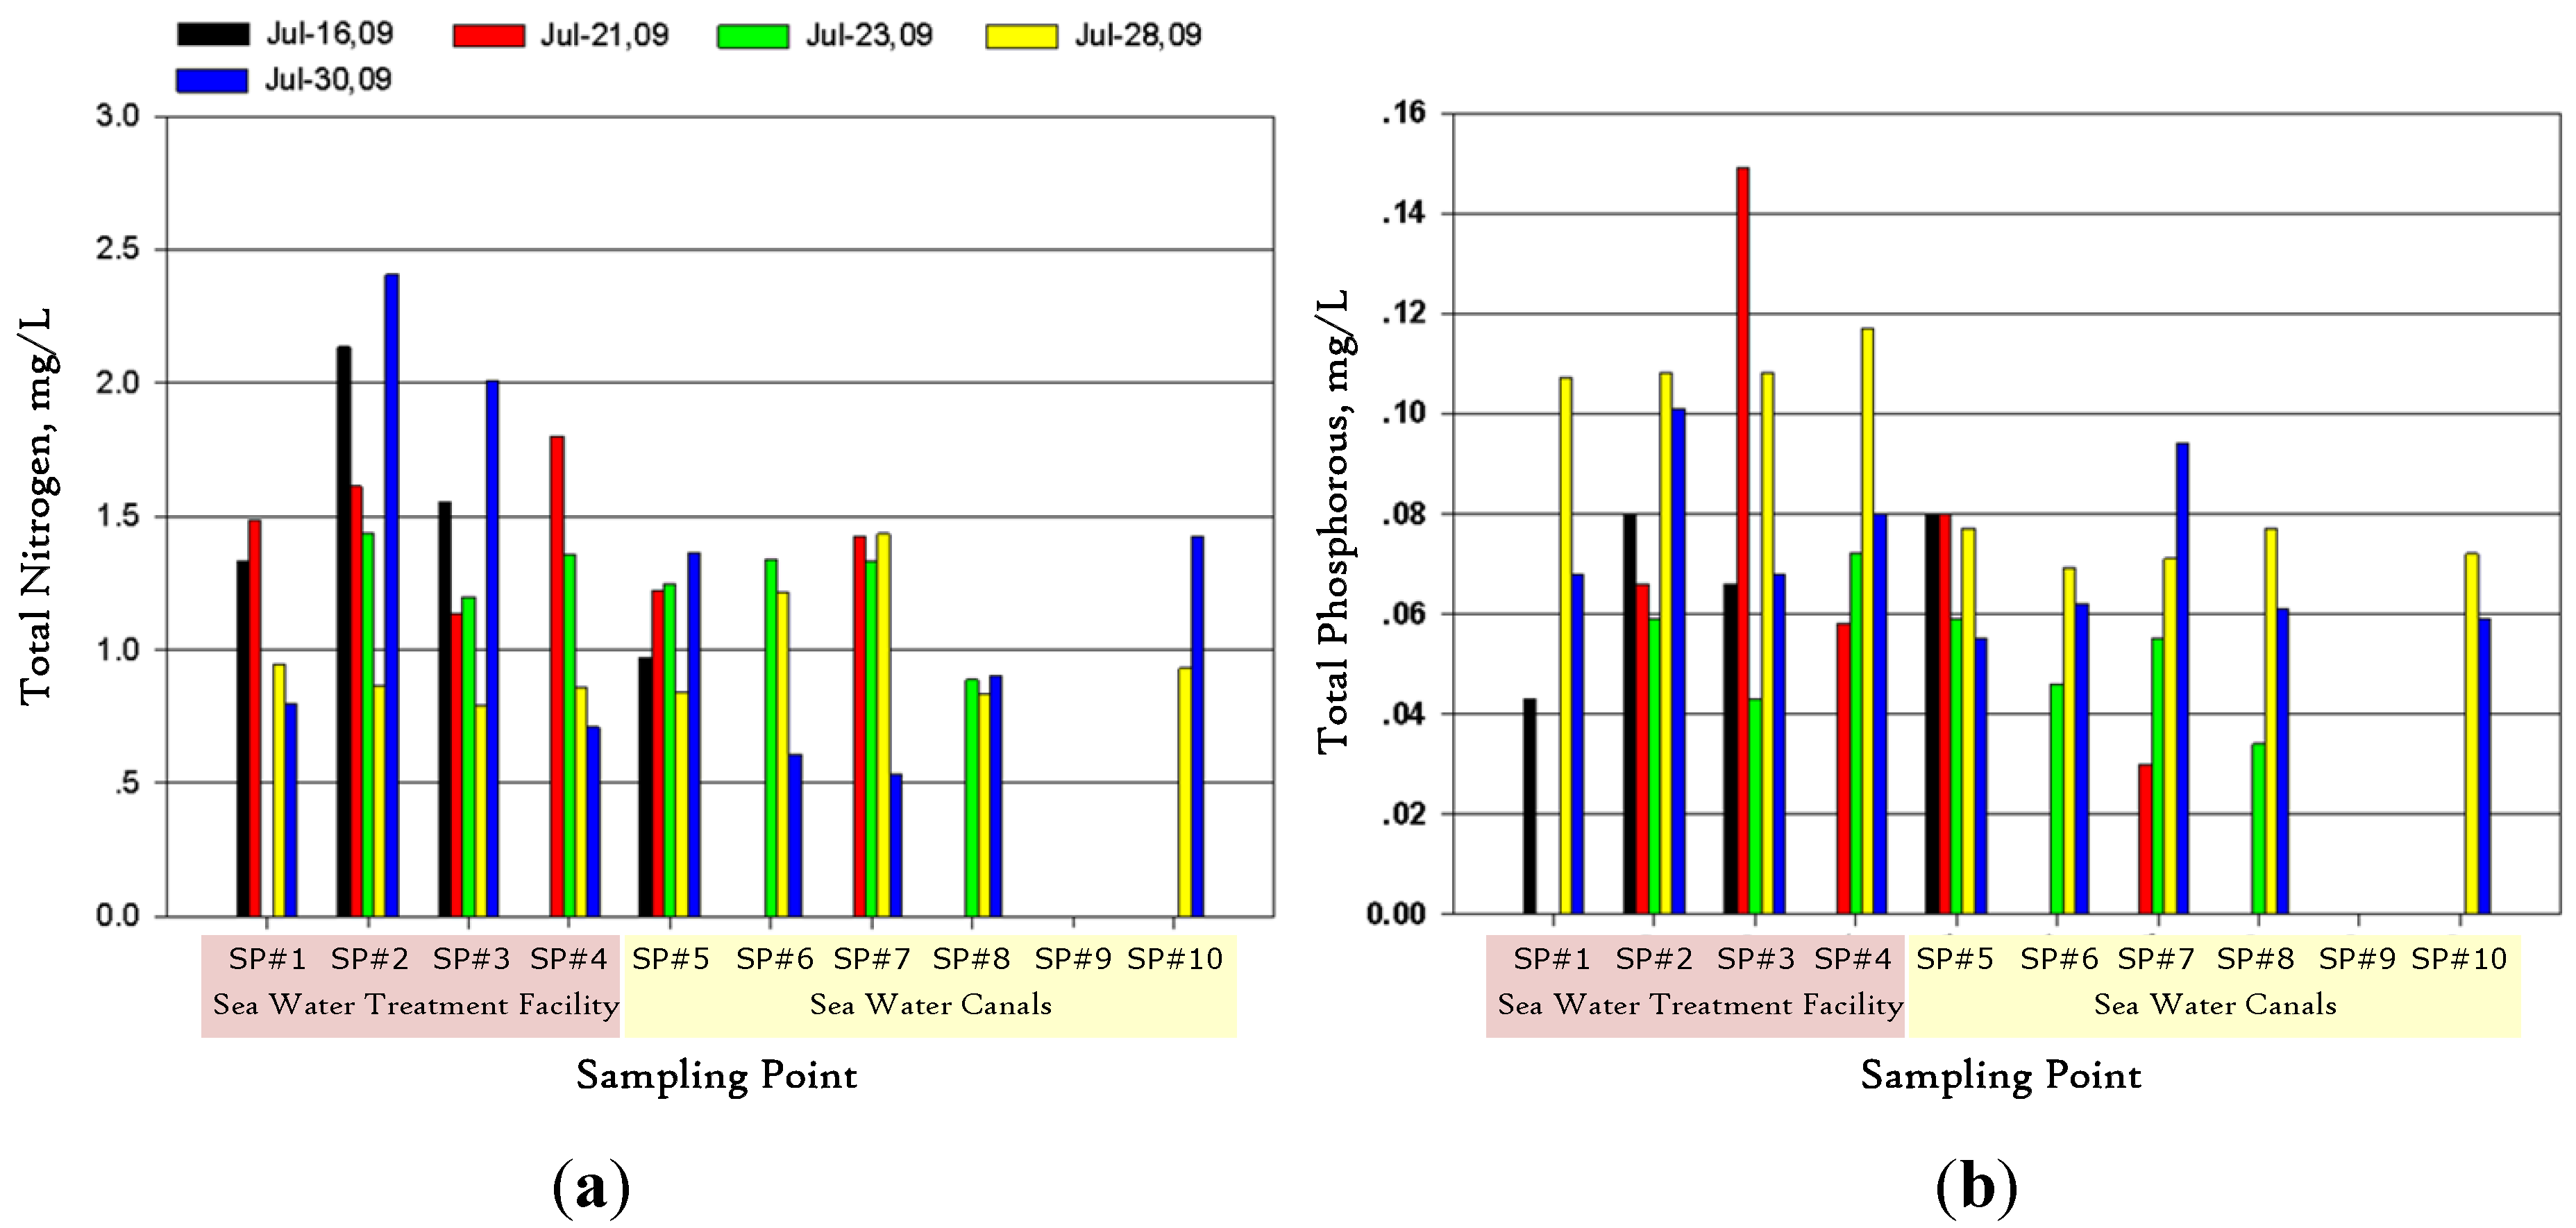
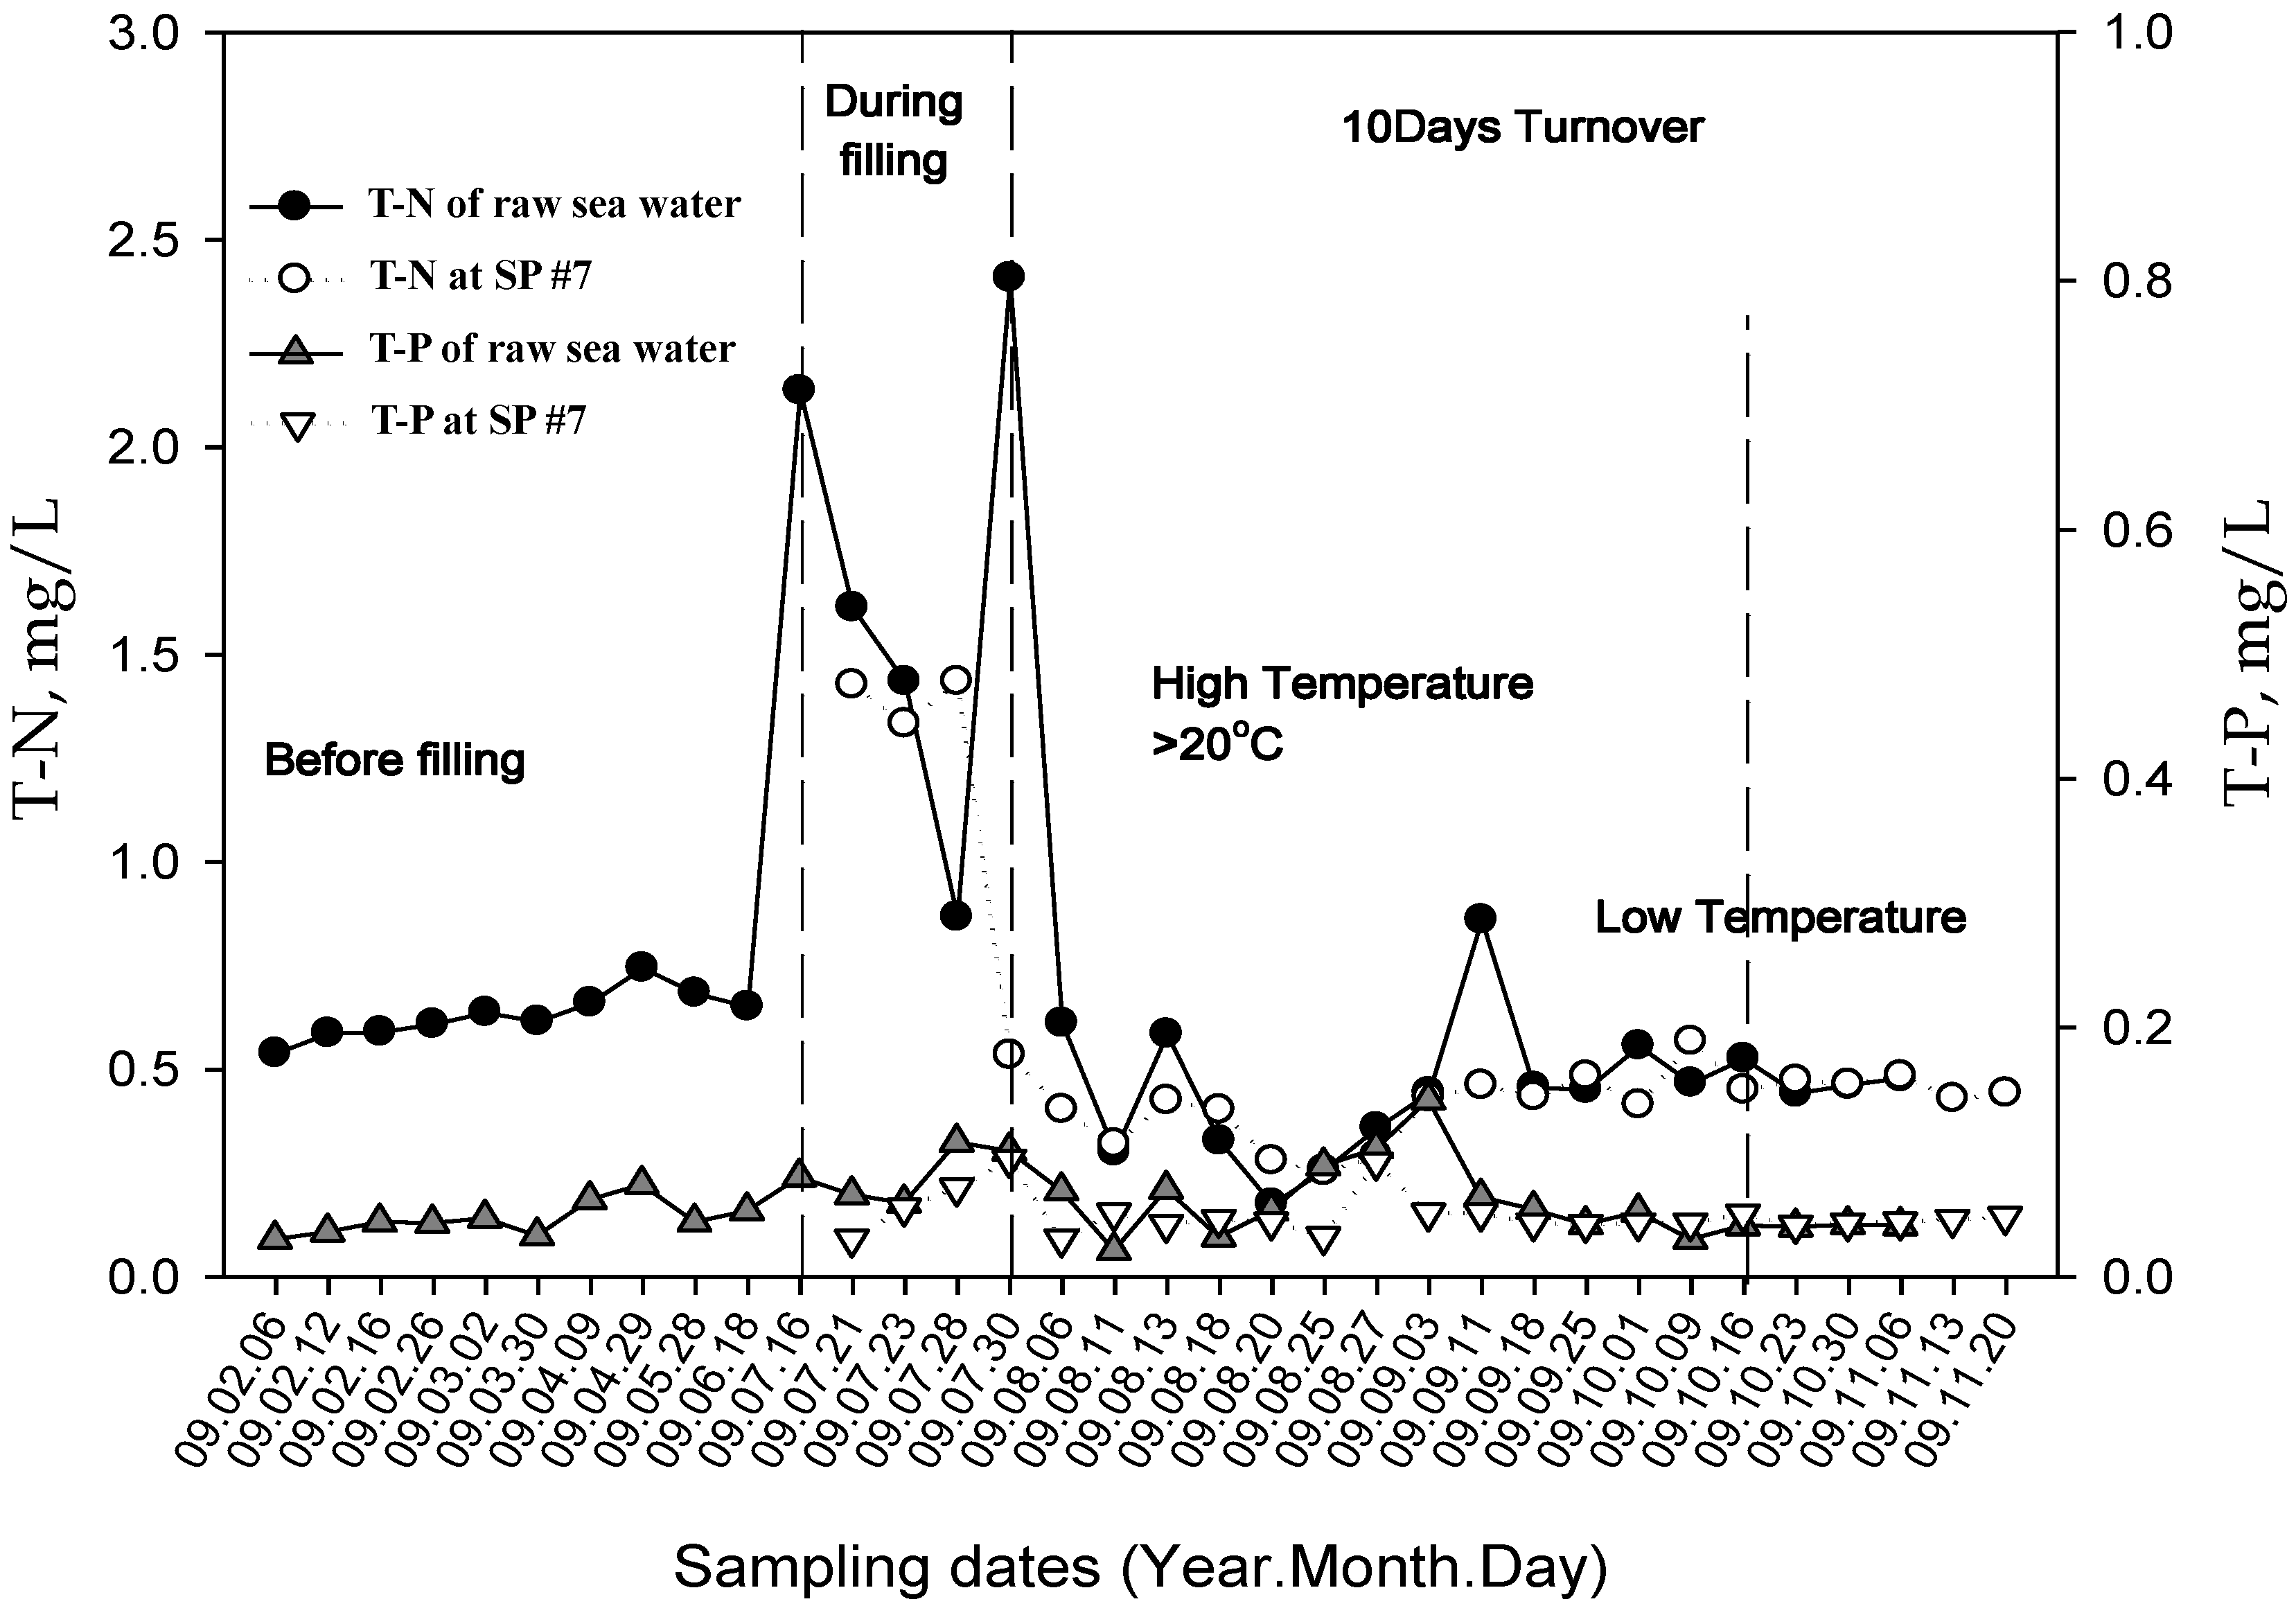
Figure 4 shows the monitoring results of the nutrients (T-N and T-P) before, during, and after the canal filling periods with 10 days turnover at Central Park, New Songdo City. During relatively low temperatures (February to May 2009), the level of nutrients in the raw seawater was kept below 0.8 mg/L. However, the T-N concentration increased up to 2.45 mg/L and T-P levels doubled when the temperature increased. On 21 and 23 July 2009, the T-N concentration at sampling point 7 (Anapji) was very high and was around 1.5 mg/L (
Figure 5). By comparing the T-P concentration at the same point and time, it was determined that T-N contributes more to the growth of algal blooms and scum in the canal. With increasing temperature, nutrient concentrations in the West Sea increased. On 30 July 2009, the T-N and T-P concentrations were 2.407 and 0.101 mg/L, respectively, and the concentration was over Level III of the guidelines for seawater quality (Korean Environmental Standards). Level III means that the seawater is of bad quality and can be used only as industrial cooling water.
Figure 4.
Nutrient variations in the canal within a 10-day turnover.
Figure 4.
Nutrient variations in the canal within a 10-day turnover.
On the other hand, the T-N concentration decreased to 0.534 mg/L at Anapji (Input 2, SP#7) on 16 and 30 July 2009. It was estimated that phytoplankton and algae in the canal might consume the nutrients because there was no nutrient removal process in the STF. Furthermore, this was supported by the fact that the nutrient levels had decreased in the canal two to three days after the appearance of the periodic scum. During heavy rainfall, the T-N concentrations in Anapji (Input 2, SP#7) were higher than those of the raw seawater (SP#2). However, the T-N concentration decreased to the same level as the raw seawater on 25 August. Another high T-N concentration in the raw seawater was observed on 11 September, but the concentration at Anapji (SP#6, Input 2) was half that of the raw seawater.
The growth rates of all living things are directly affected by temperature. The temperature variation is correlated with the seasonal changes in Korea; therefore, the phytoplankton growth pattern in the canal of Central Park in New Songdo City is mitigated by seasonal changes. Micro- and macro-algal blooms and scum are expected to be produced from July to October 2009. To control and manage algal blooms and scum development, the growth rate must be kept at the same levels as in May and June 2009.
Figure 5.
Monitoring results of (a) T-N; and (b) T-P.
Figure 5.
Monitoring results of (a) T-N; and (b) T-P.
3.2. Measurement Results of Flow Velocity
The velocities for each cross-section measurement for this period are presented in
Table 1. The overall approximated mean flow velocity was under 0.02 m/s in the canal, and the maximum velocity was 0.0162 m/s at cross section XS1 near the inflow inlet. The cross section XS1 has four measuring points near the inlet of the canal (
Figure 6). Due to asymmetric structural inflow, circulation occurs near cross section XS1, as is evident by the negative velocity that was detected on the left side of the bank. Flow velocities measured at cross sections XS1 ranges from −0.0368 to 0.0162 m/s.
For XS2, the velocity is 0.0179 m/s at right side and 0.0181 m/s at left side. Considering geometric effect at XS2 that seawater flowing from the second inlet meets the dramatically narrow cross section, velocity around inlet#2 is expected to be relatively lower than velocity at XS2. After passing XS2, the flow is divided into two directions due to the existence of a small island (Anapji). In this regard, the flows at XS3 are asymmetric velocities at both sides due to the irregular shape of a small island. The velocity on the left side of Anapji with the flow direction was 0.0147 m/s, while it was 0.005 m/s on the right side. The left side flow of Anapji is assumed to be the main flow. The flow from the first and second inlets meets at the central area of the canal (XS4). Although velocities at points of XS1 have big differences in flow direction and magnitude, there is no significant difference in flow velocities at seven measuring points in cross section XS4. Considering the main flow of XS3, the velocity of XS4 decreases to 0.009 m/s again due to the expansion of the canal cross section from XS3 to XS4. The direction and size of the arrow indicate the direction and velocity of flow. In addition, the color of the arrow shows the point number in the cross section.
Table 1.
Two-dimensional velocity at measuring point (Pt.) in each cross section (XS) (m/s).
Table 1.
Two-dimensional velocity at measuring point (Pt.) in each cross section (XS) (m/s).
| XS | Pt. 1 | Pt. 2 | Pt. 3 | Pt. 4 | Pt. 5 | Pt. 6 | Pt. 7 |
|---|
| XS1 | −0.0368 | −0.0195 | 0.0091 | 0.0162 | – |
| XS2 | 0.0179 | 0.0181 | – |
| XS3 | 0.0147 | 0.0150 | – |
| XS4 | 0.0092 | 0.0104 | 0.0105 | 0.0092 | 0.0088 | 0.0087 | 0.0093 |
| XS5 | 0.0175 | 0.0143 | 0.0184 | – |
Figure 6.
Measured velocity of each cross section (m/s).
Figure 6.
Measured velocity of each cross section (m/s).
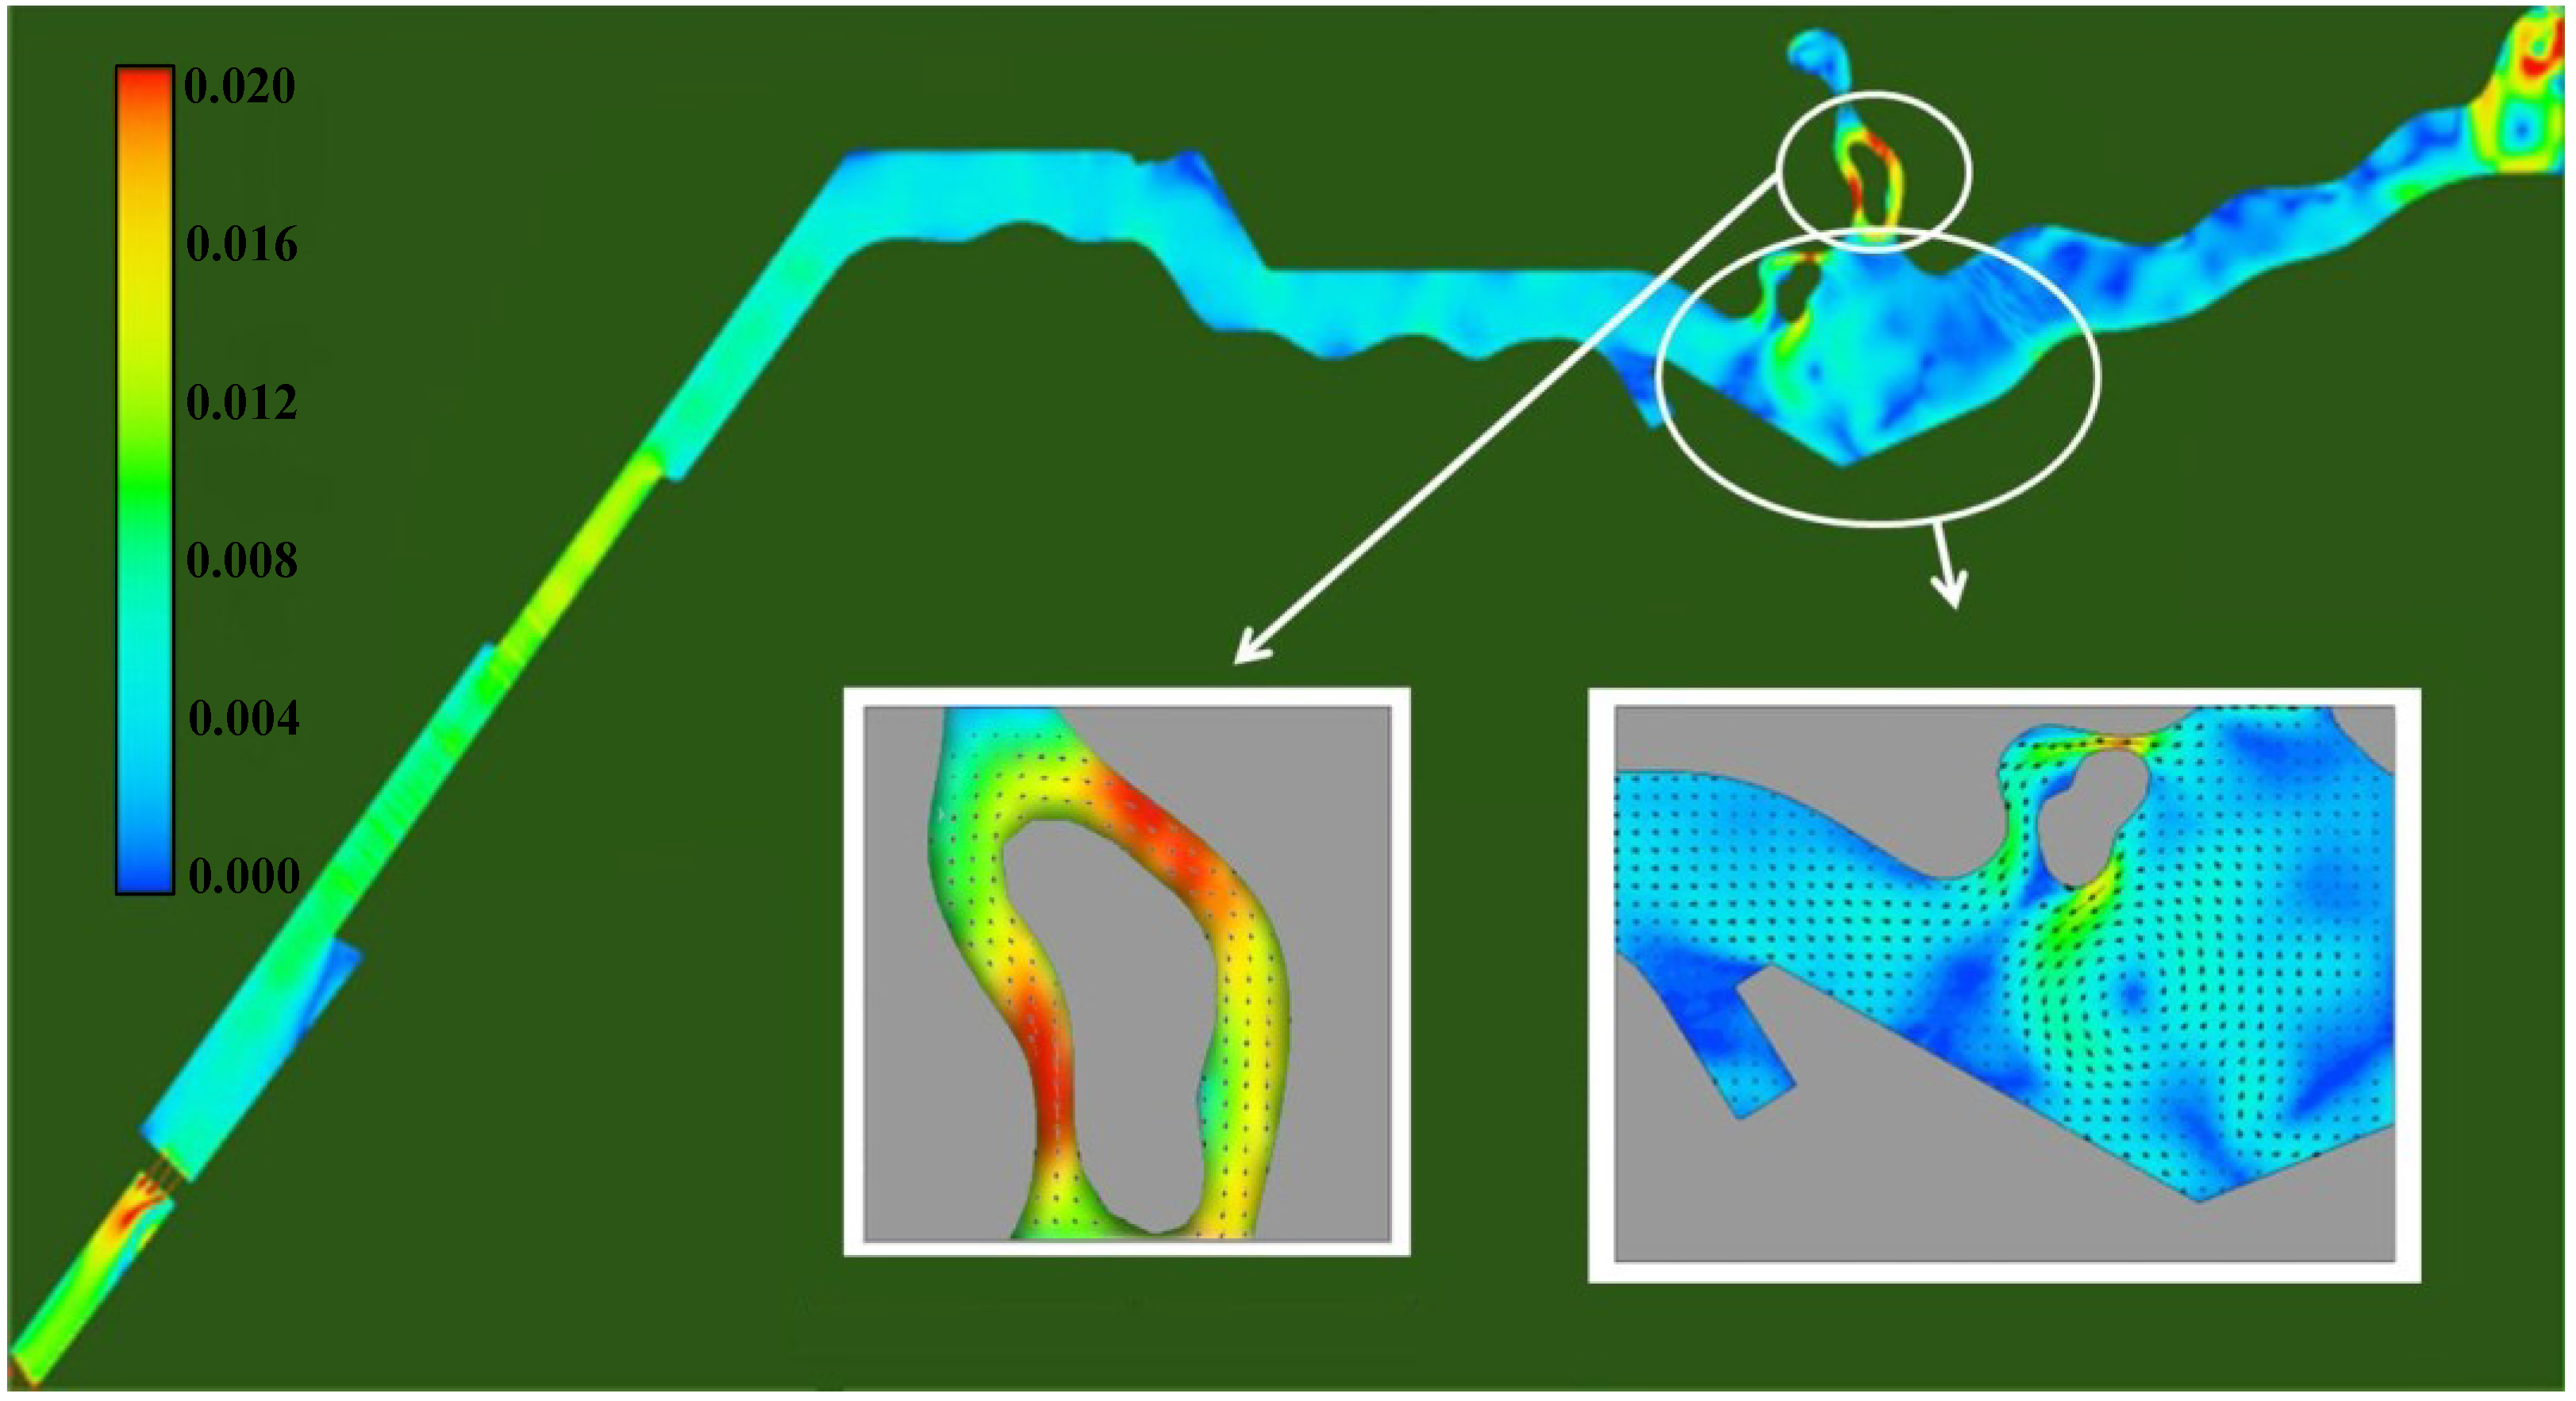
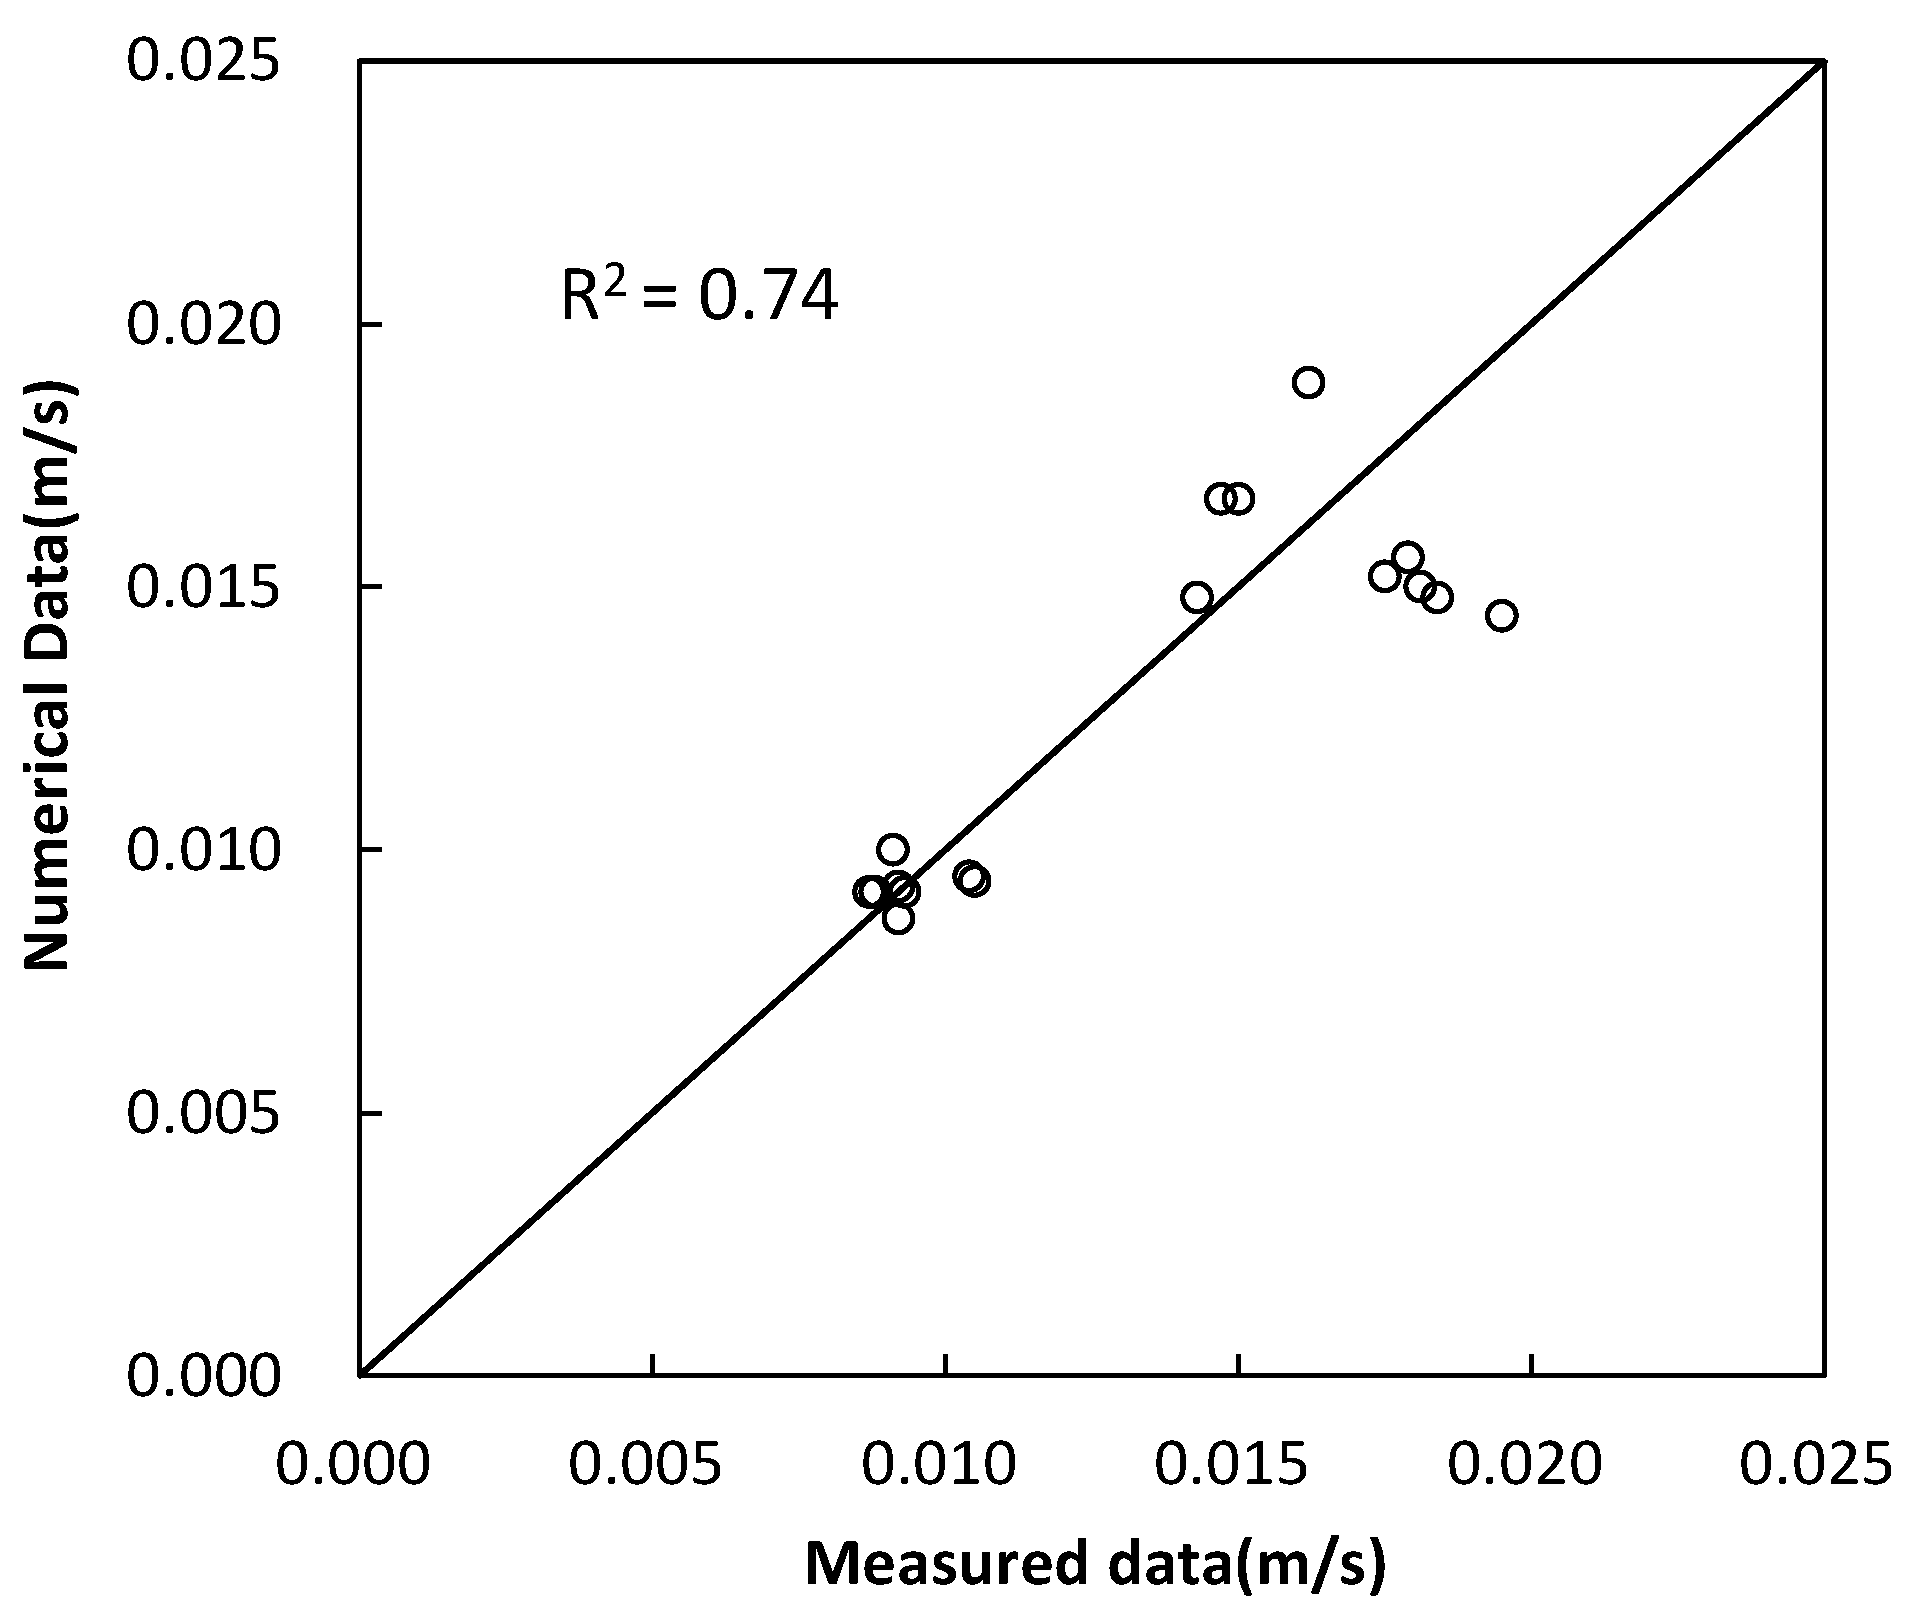
3.3. Results from Numerical Simulation
The overall approximated mean flow velocity was 0.01 m/s in the canal. This low flow velocity was maintained throughout most of the canal area except around the inflow inlets and outlets because the inflow discharges from the inlet were relatively small with respect to the overall canal volume. Therefore, the influence of the inflow discharge is evident only near the inlet weir. The maximum velocity occurred in front of the inflow weir (Inlet#1). As the seawater flowed through the canal, its velocities gradually decrease due to the widening of the cross section in the pond. With the narrowing of the canal, velocities increase as water passes through the culverts (
Figure 7). This velocity distribution is similar to distribution of the measured velocity (
Figure 6). The results show a good agreement between the observations and the simulations with a coefficient of determination (
R2) of 0.74 (
Figure 8). However, note that the velocity at Pt. 1 of XS1 was excluded to estimate a coefficient of determination because the circulation of the flow near the inlets can produce errors in measuring water velocity. The effect of geometry on the simulated velocity is also shown in the measured velocity around a small island (Anapji), but the velocities near inlets were dissimilar. The flow measured alongside the island gradually slowed down before reaching the Central Park Lake area. Velocity vectors in the middle of the lake area were close to zero due to the widening of the area. The existence of a ‘dead zone’ (stagnation of flow) should be considered in most of the canal area, which may evoke biological issues including water containing suspended nutrients. Such ‘dead zones’ can cause serious problems related to the water quality, such as the growth of algal blooms and periphyton communities. It is therefore important to suggest a solution for the reduction of the ‘dead zone’ in the canal and for maintaining optimum ecological conditions.
Figure 7.
Results of the numerical simulation (velocity distribution (m/s)).
Figure 7.
Results of the numerical simulation (velocity distribution (m/s)).
Figure 8.
Comparison of the simulations and the observation for velocity.
Figure 8.
Comparison of the simulations and the observation for velocity.
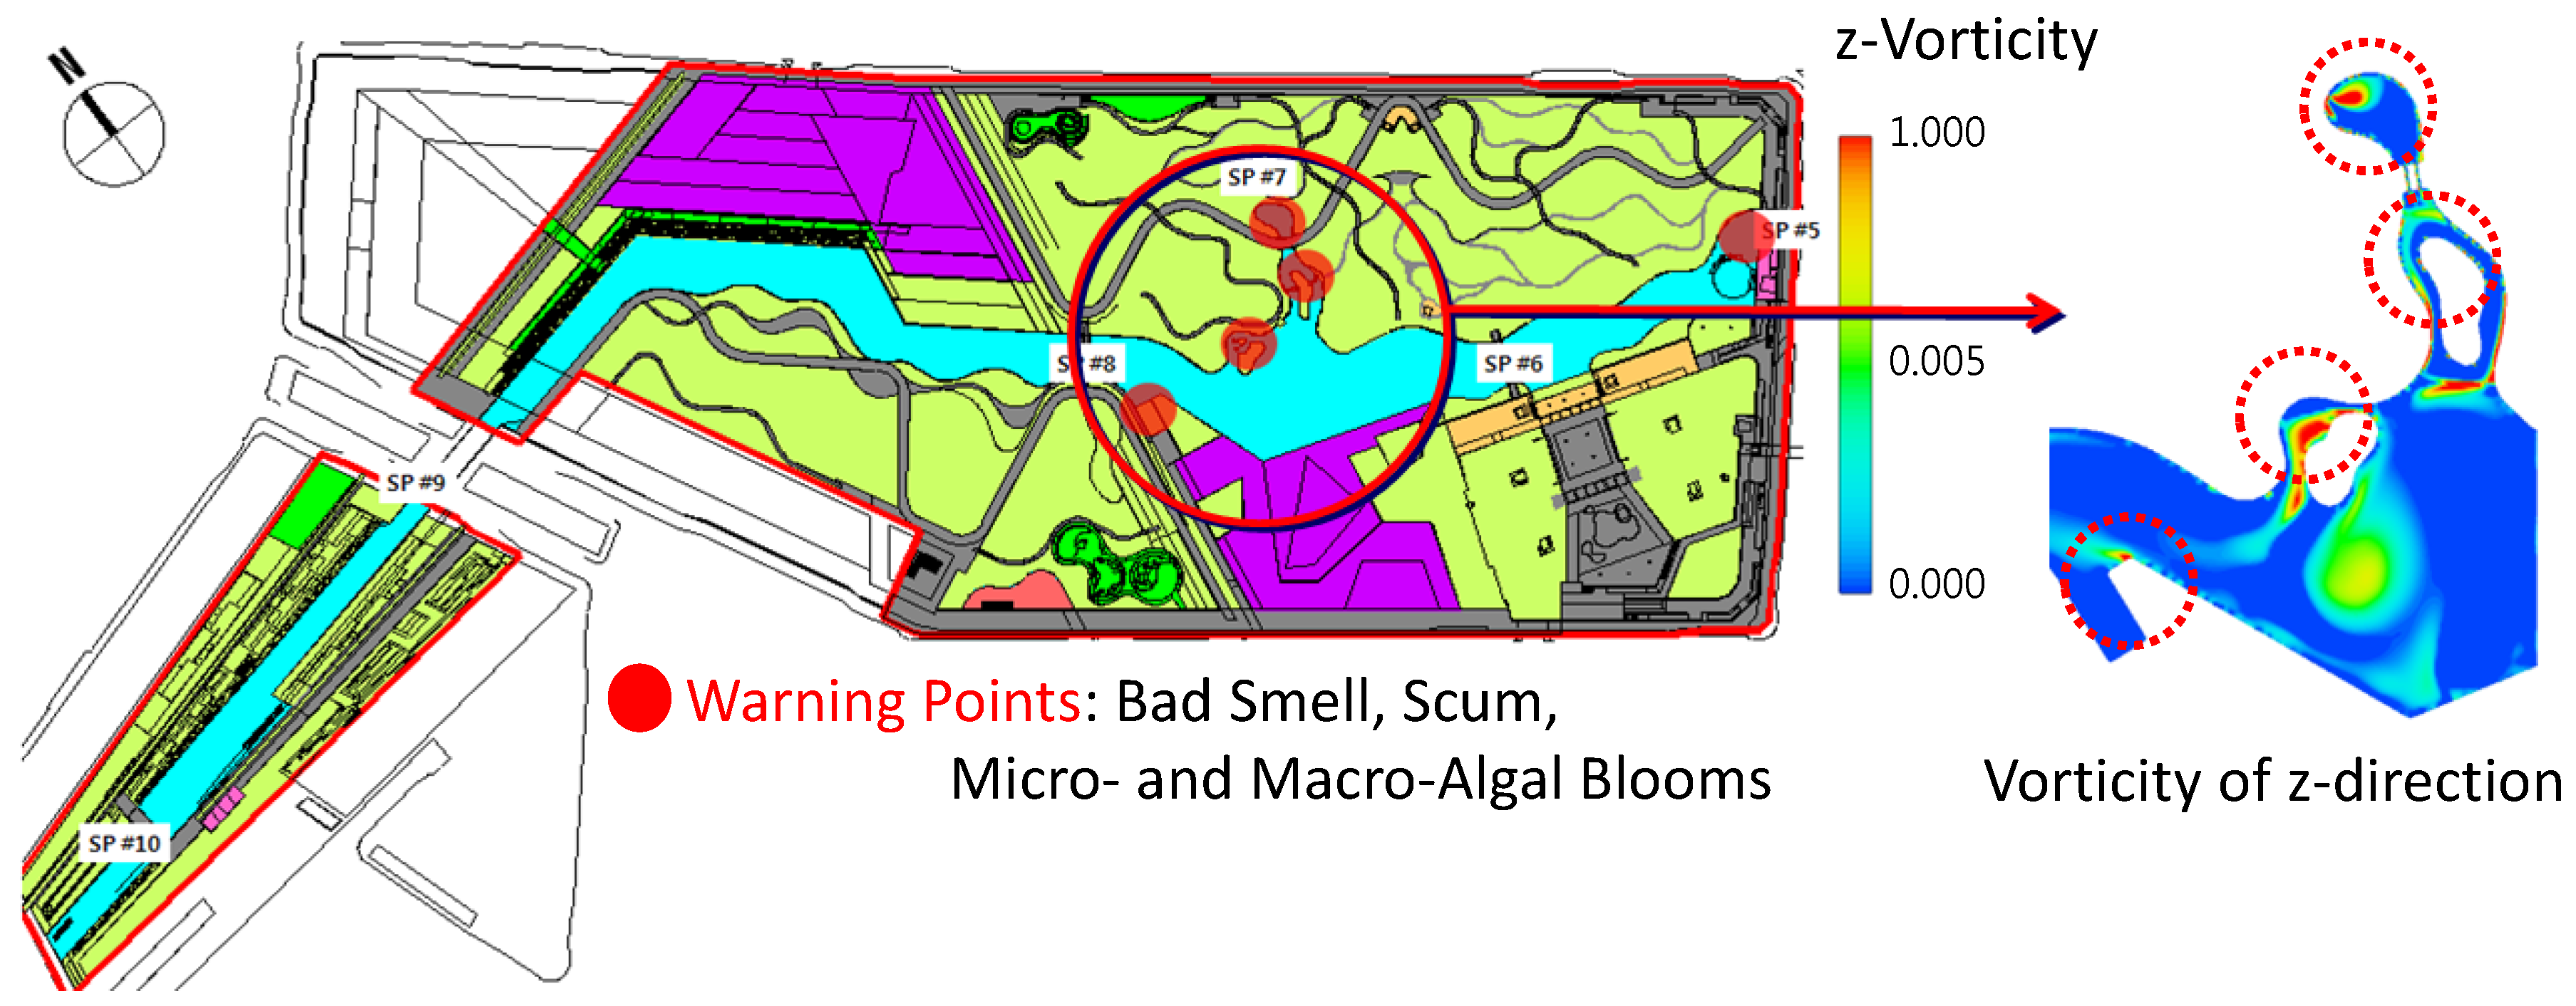
3.4. The Effect of Hydraulic Characteristics (Vorticity) on Algal Blooms
According to the results of the monitoring of nutrients and hydraulic characteristics, high nutrient points and stagnation of flow areas were determined in the canal. Five locations of expected algal blooms were estimated from the monitoring results, as shown
Figure 8. However, although the monitored algal blooms were not found in all stagnant zones (blue colors in
Figure 7), we could find a cause of algal blooms from the
z-direction vorticity analysis. The occurrence of the algal blooms was shown in stagnant places with high values of
z-direction vorticities as shown in
Figure 9. From this result, in addition to the effect of velocity of
x and
y direction on algal blooms, this study shows that
z-direction vorticity give a significant contribution to algal blooms. An area with partially high vorticity cannot transfer large volumes of water outside the area when the canal water is in a stagnant condition. High values of
z-direction vorticities disturb the sinking of nutrients (T-N and T-P), increasing the probability of algal blooms. Agricultural soils that contain high levels of nutrients (organic nitrogen and phosphorus) from around the Central Park area are continuously washed into the canal, accumulating at the bottom of the canal. This increases the amount of nutrients in the water and the probability of growth of algal blooms.
Figure 9.
Warning points of algal blooms in the canal and vorticity of the z-direction using FLOW-3D.
Figure 9.
Warning points of algal blooms in the canal and vorticity of the z-direction using FLOW-3D.
4. Discussion and Conclusions
Unlike natural streams, water quality in the artificial canal is typically maintained by the related facilities such as waste water treatment and seawater desalination. Nevertheless, there often happen scum and algal blooms in the artificial canal. While hydraulic characteristics are mainly affected by discharge, roughness, and topography, scum and algal blooms occurred by more sources such as climatic and chemical factors with hydraulic characteristics. Therefore, this study attempts to evaluate three dimensional turbulent flow velocities (x, y, and z) under the assumption that hydraulic characteristics are related to occurrence of scam and algal blooms. Also, since the pond scum and algal blooms temporally emerge in summer it is difficult to statistically analyze correlation between the hydraulic characteristics and algal blooms. From these reasons, we first investigated the place where the pond scum and algal blooms easily emerged in summer, and then conducted 3-D numerical simulations in the same domain.
This study was conducted to identify the relevance of the hydraulic characteristics in an artificial seawater channel using FLOW-3D for algal boom. Also, the monitoring results of algal blooms were used to compare with the specific hydraulic characteristic. The meaning of this study could be found in that (1) scum and algal blooms have a high chance to occur in the location with high vertical vorticities; and (2) thus, vorticity among hydraulic characteristics can efficiently be used as an indicator of algal blooms occurrence in artificial seawater channel. In this regard, the algal bloom area in an artificial canal could be predicted throughout 3-D hydrodynamic simulation because the locations of partially high vorticity cannot transfer water flow to the outer area when the canal water is in a stagnant condition. In addition, z-direction vorticities with high values disturb the sinking of nutrients which can be feeding sources to harmful planktons, and thus, increase the probability of algal blooms.
When algal blooms occur in a canal, some techniques such as red clay input and the use of equipment such as submersible aerating or mixing systems can be used to control it. The algal blooms are affected by various factors such as climate and nutrient. Also, hydraulic characteristics are another factor dependent on the design of the canal. In this context, analysis of hydraulic characteristics including the z-direction vorticity in the canal can help to predict the zone where algae occurs, and prepare precautionary actions for algal blooms. Accordingly, this study will contribute to an economic and reliable design of the artificial seawater canal which will enhance the environmental functions of the waterfront area as well as algal bloom prevention.


