Spatial Model Assessment of P Transport from Soils to Waterways in an Eastern Mediterranean Watershed

Abstract
:1. Introduction
The Concept of P Index
2. Methods
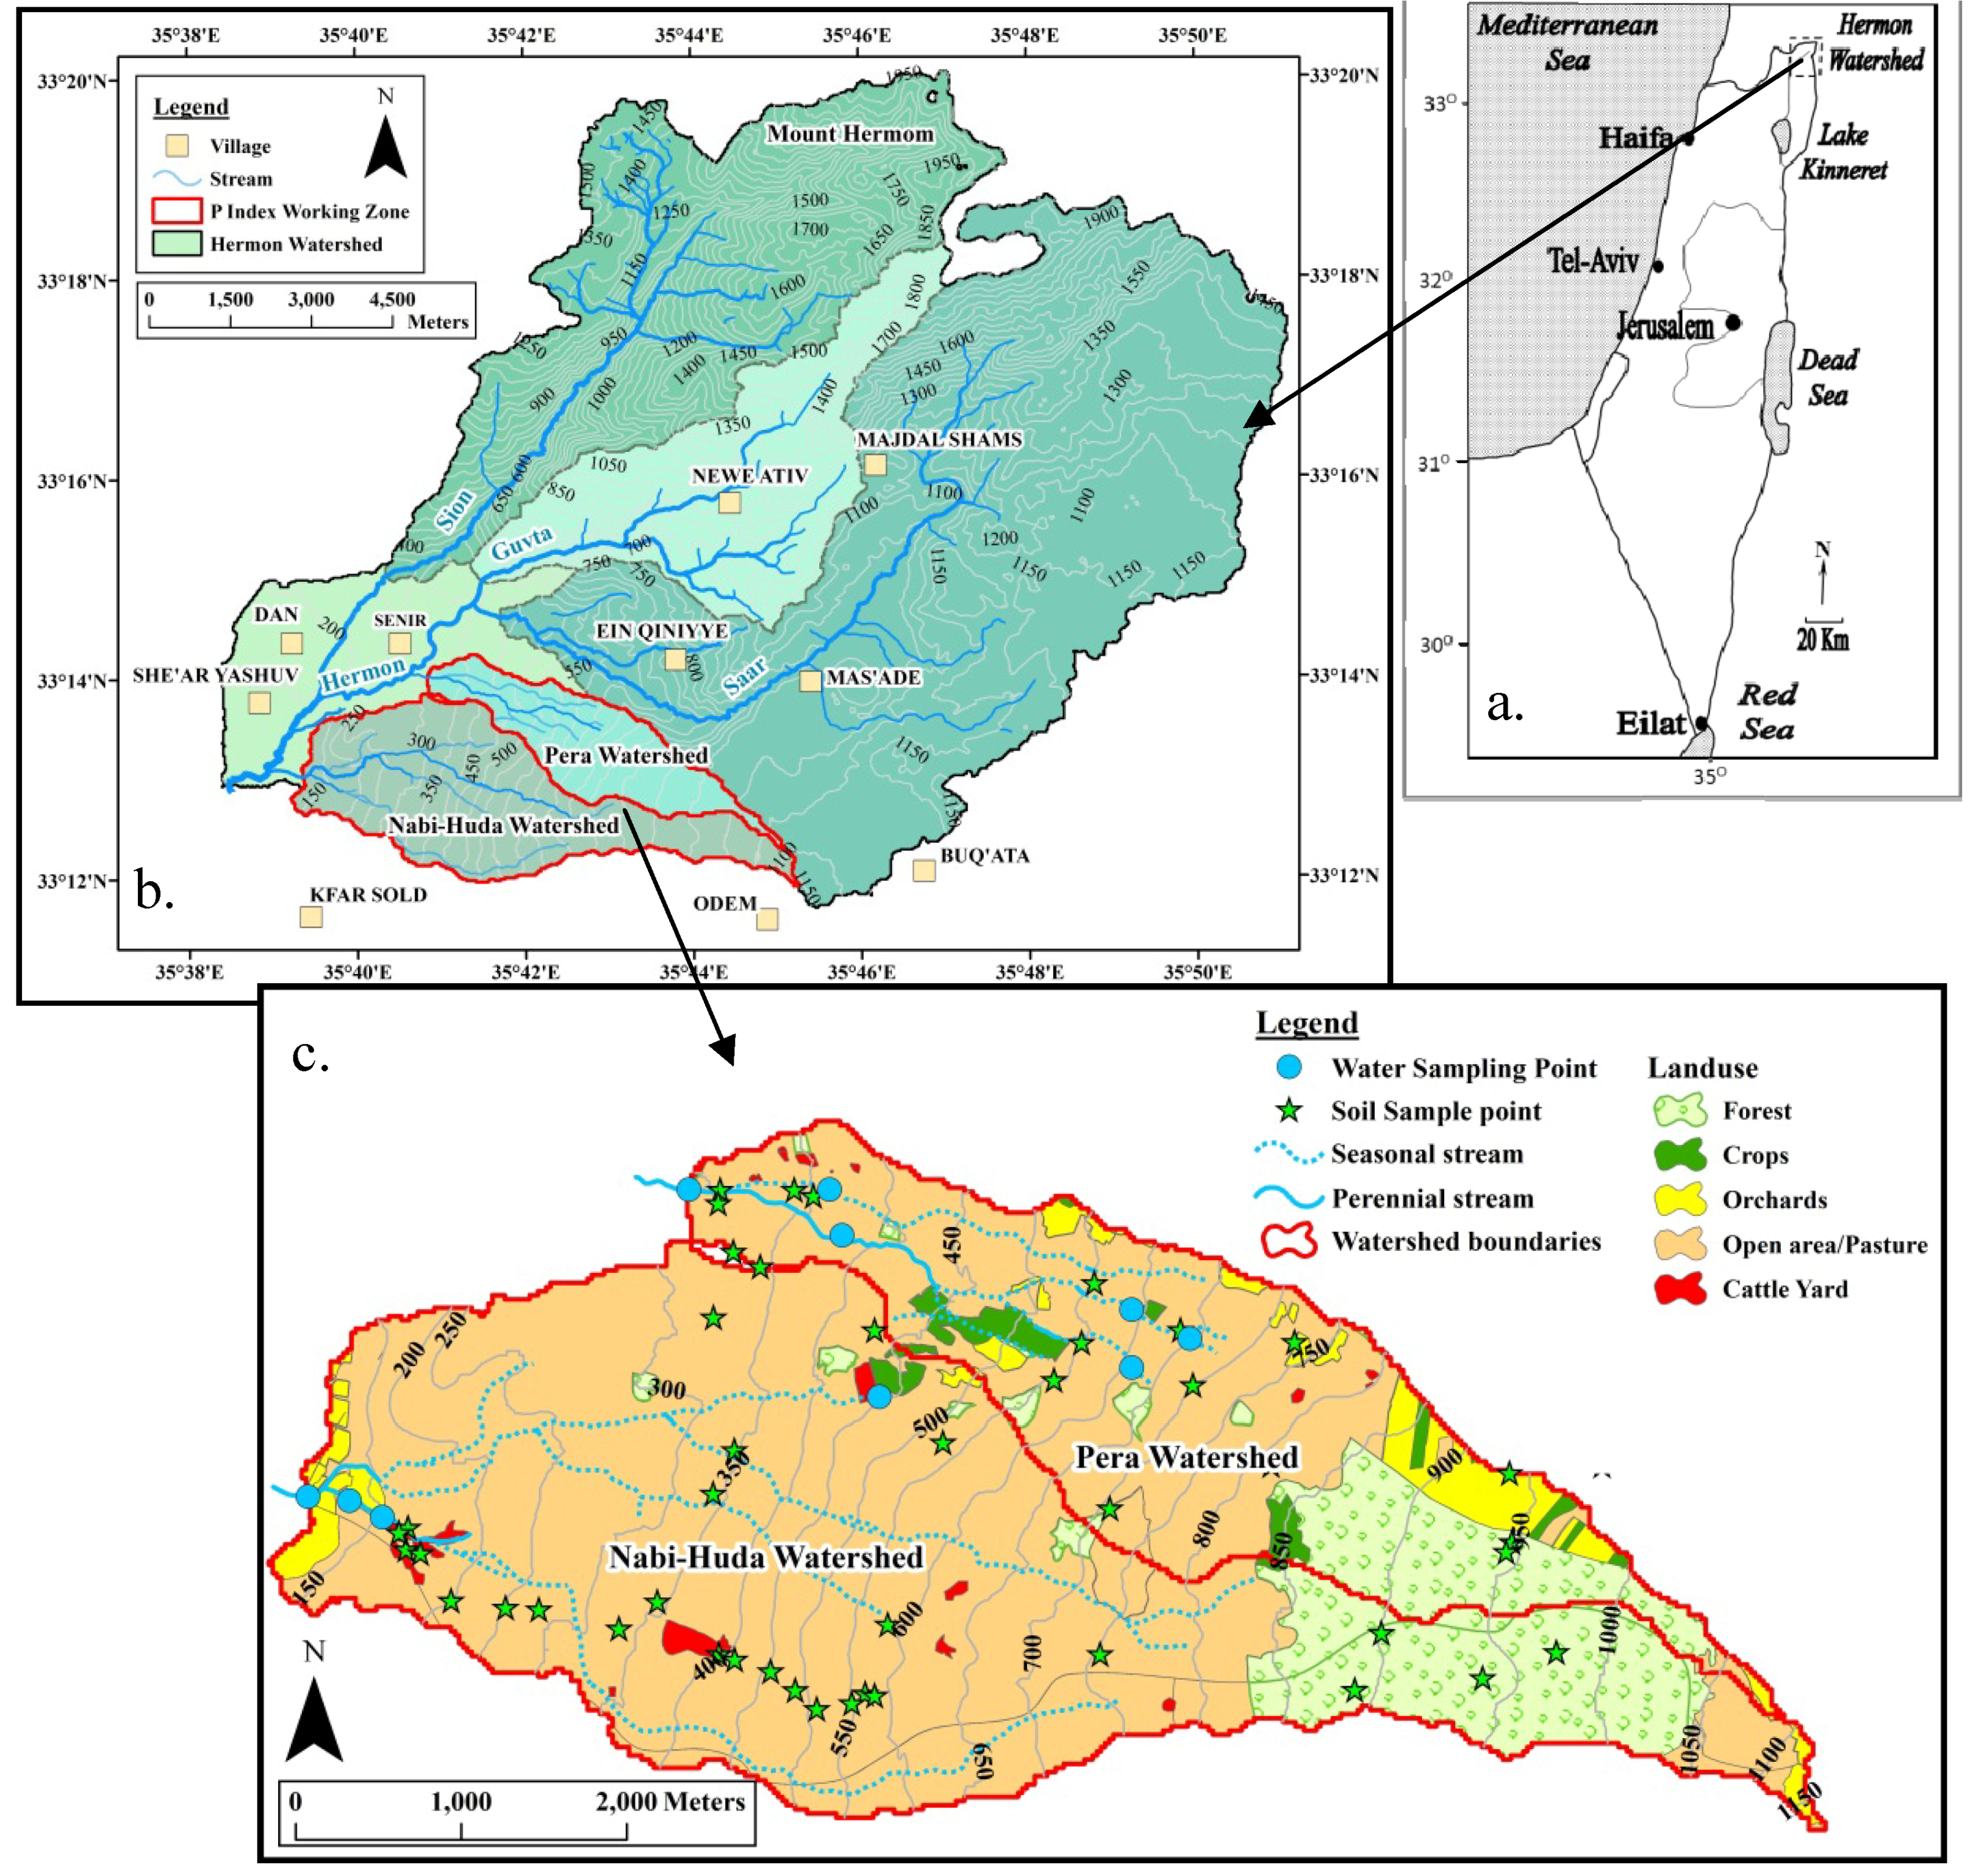
2.1. Study Area

2.2. Soil Sampling
2.3. Stream Water Analyses

| Station | Subcatchment area (ha) | Event date | |||
|---|---|---|---|---|---|
| 01/2007 | 02/2009 | 03/2009 | 01/2010 | ||
| m3·hr−1 | |||||
| H1 | 1524 | 85 | 96 | 3984 | 5252 |
| H11 | 484 | 25 | 51 | 69 | 900 |
| H12 | 477 | 9 | 53 | 82 | 888 |
| P1 | 399 | 56 | 854 | 1950 | 5616 |
| P2 | 710 | 86 | 1177 | 3056 | 8099 |
| P31 | 73 | ND | ND | 361 | 1373 |
| P10 | 238 | ND | 121 | 293 | 1584 |
| P16 | 58 | ND | 38 | 154 | 404 |
| P17 | 26 | ND | 38 | 112 | 546 |
| P9 | 99 | ND | 193 | 182 | 986 |
2.4. Statistical Analyses
2.5. Computation of Selected P Models
2.5.1. Arkansas Model
| Factor | Parameter | Value | Level |
|---|---|---|---|
| Source | Soil test P | 0.000224 × WSPI (kg/625 m2) | - |
| Cattle Grazing Intensity (dungs) | 0–20 | 1 | |
| 21–100 | 2 | ||
| 101–200 | 3 | ||
| >200 | 5 | ||
| corral | 10 | ||
| Transport | Soil erosion (ton/year) | 0 | 0 |
| 0–7 | 0.1 | ||
| 7–20 | 0.2 | ||
| 20–56 | 0.4 | ||
| >56 | 1 | ||
| Soil runoff class | negligible | 0.1 | |
| low | 0.2 | ||
| moderate | 0.3 | ||
| high | 0.5 | ||
| very high | 1 | ||
| Flooding frequency | no Data | - | |
| Harvest management | grazed only | 0.3 | |
| Other Site Characteristics | Event precipitation (mm) | <65 | 0.2 |
| 65–76 | 0.4 | ||
| 76–87 | 0.6 | ||
| 87–98 | 0.8 | ||
| 98–109 | 1 | ||
| 109–120 | 1.2 | ||
| 120–131 | 1.4 | ||
| 131–142 | 1.6 | ||
| 142–153 | 1.8 |
2.5.2. Revised Universal Soil Loss Equation (RUSLE)
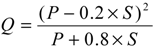
2.5.3. The Runoff Curve Number (RCN) Model
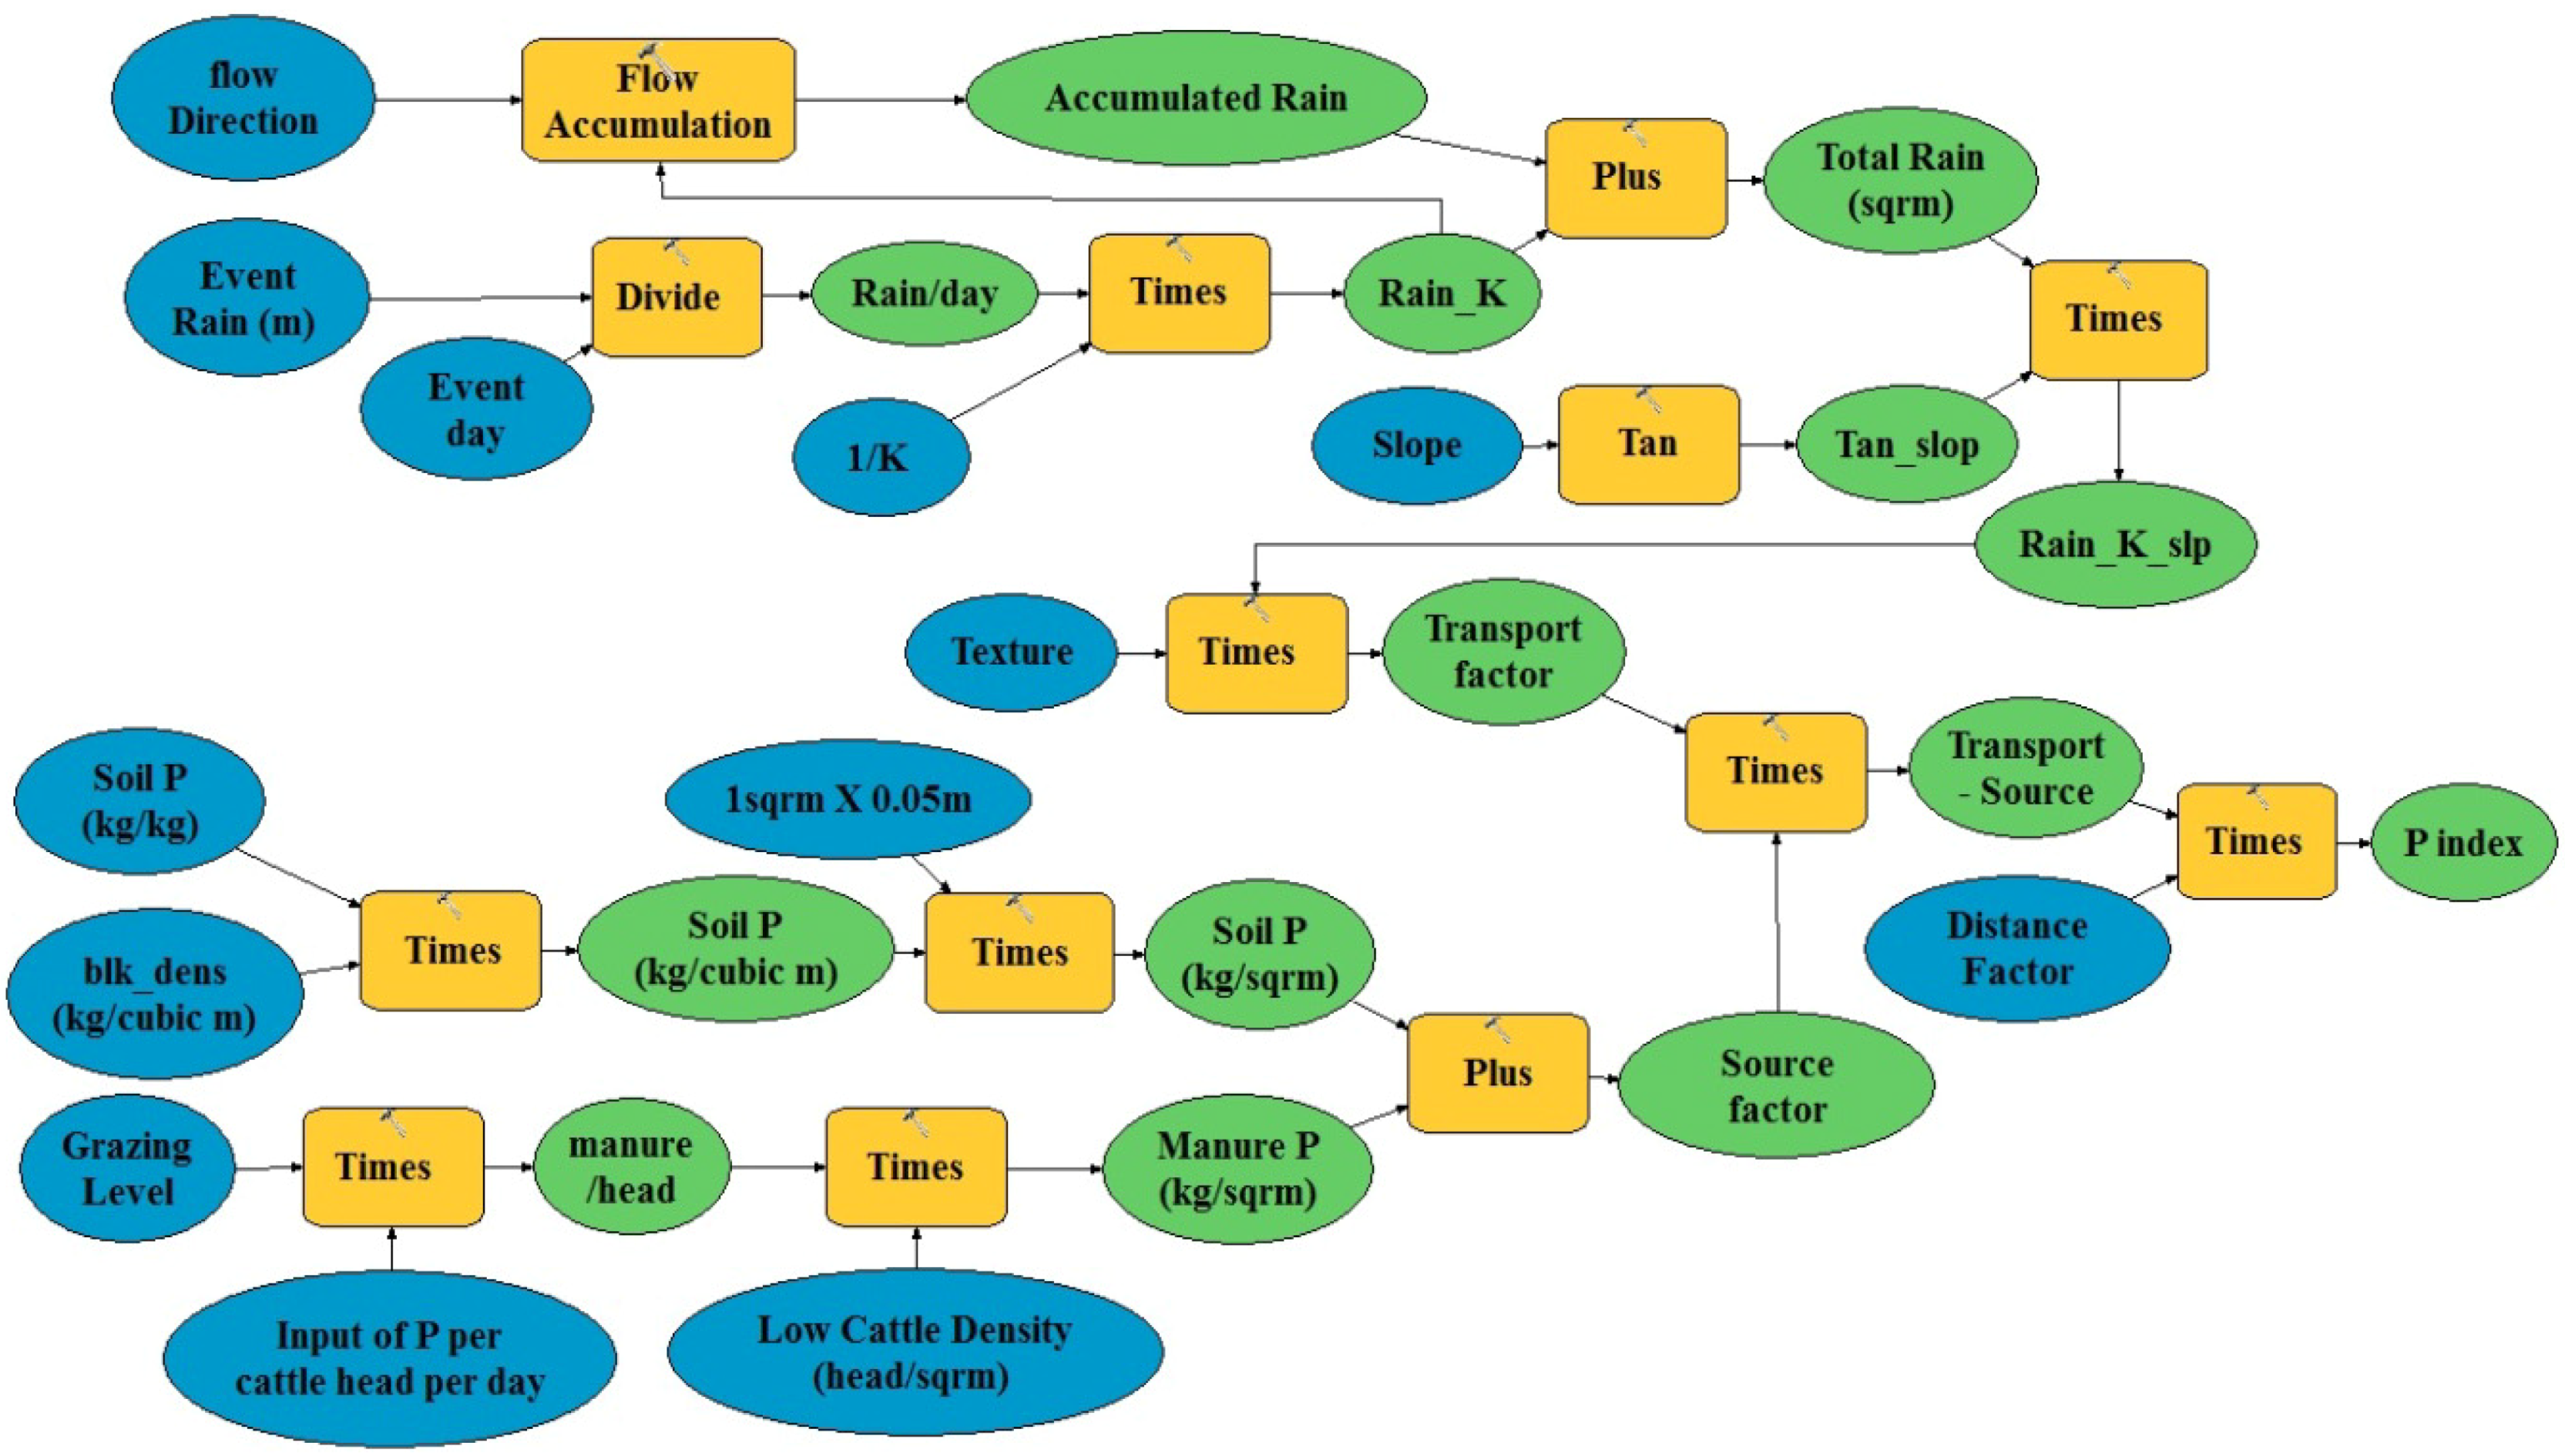
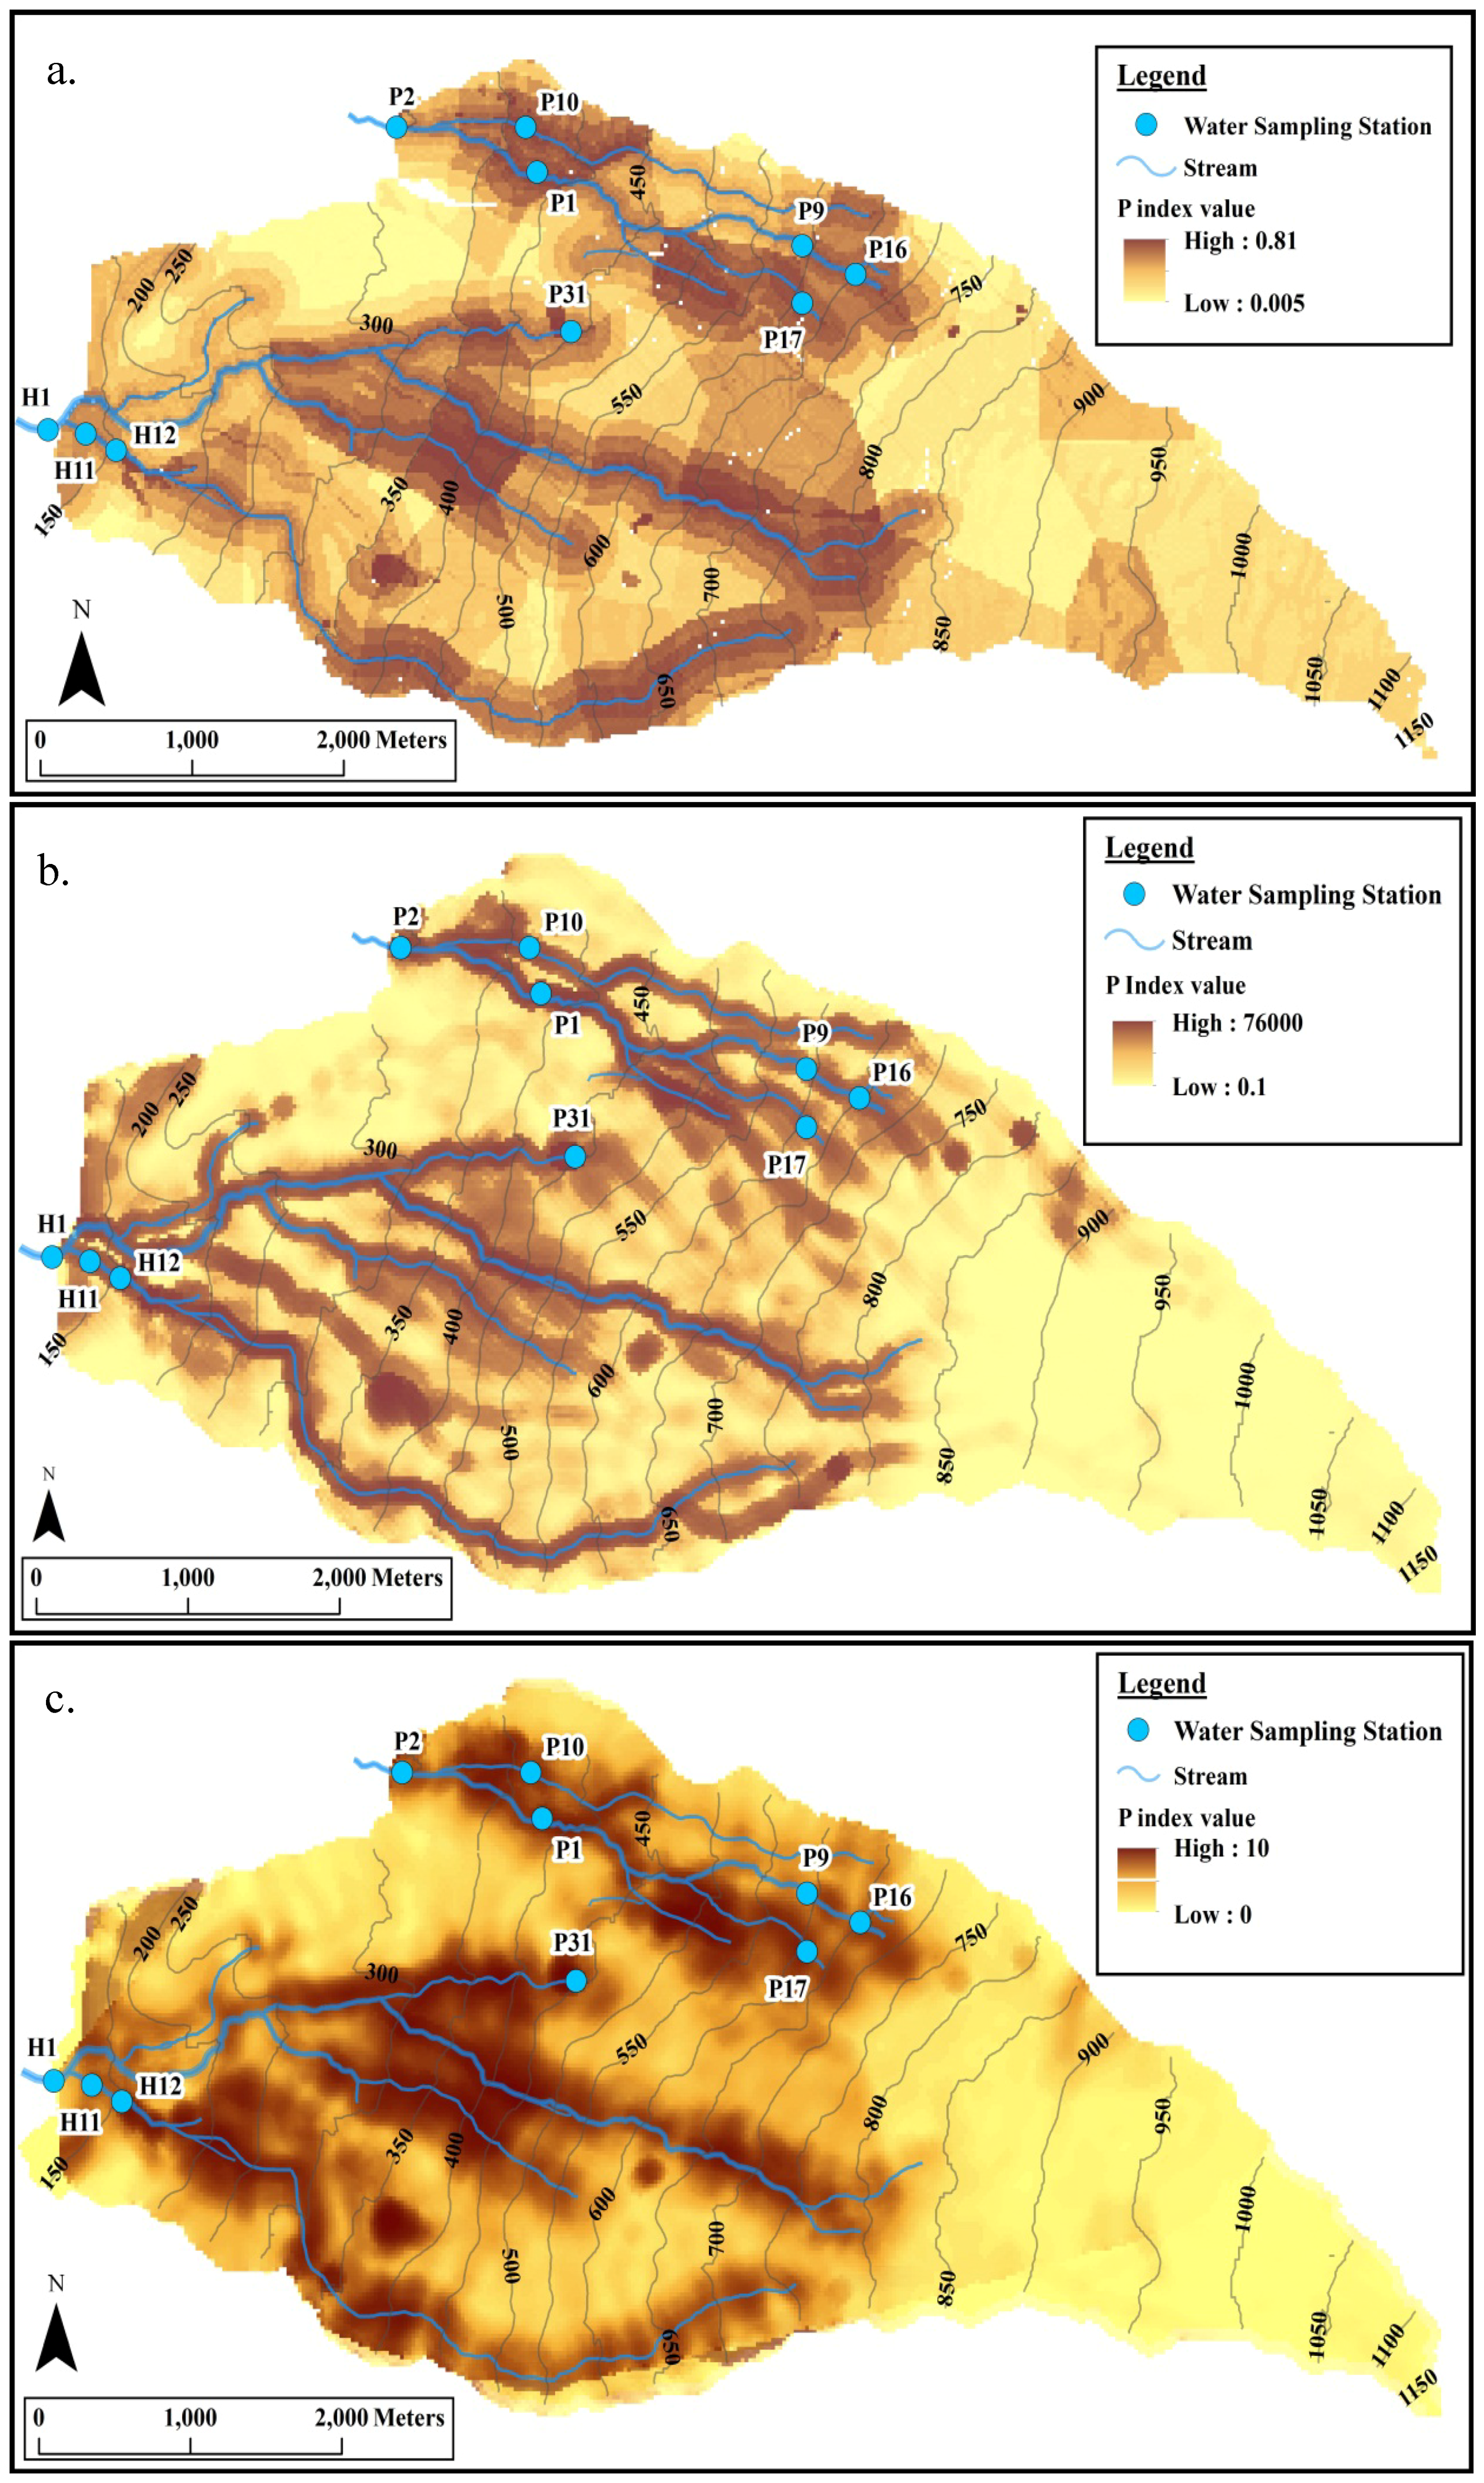
2.5.4. The Hermon Model
| Factor | Parameter | Category | Value | |
|---|---|---|---|---|
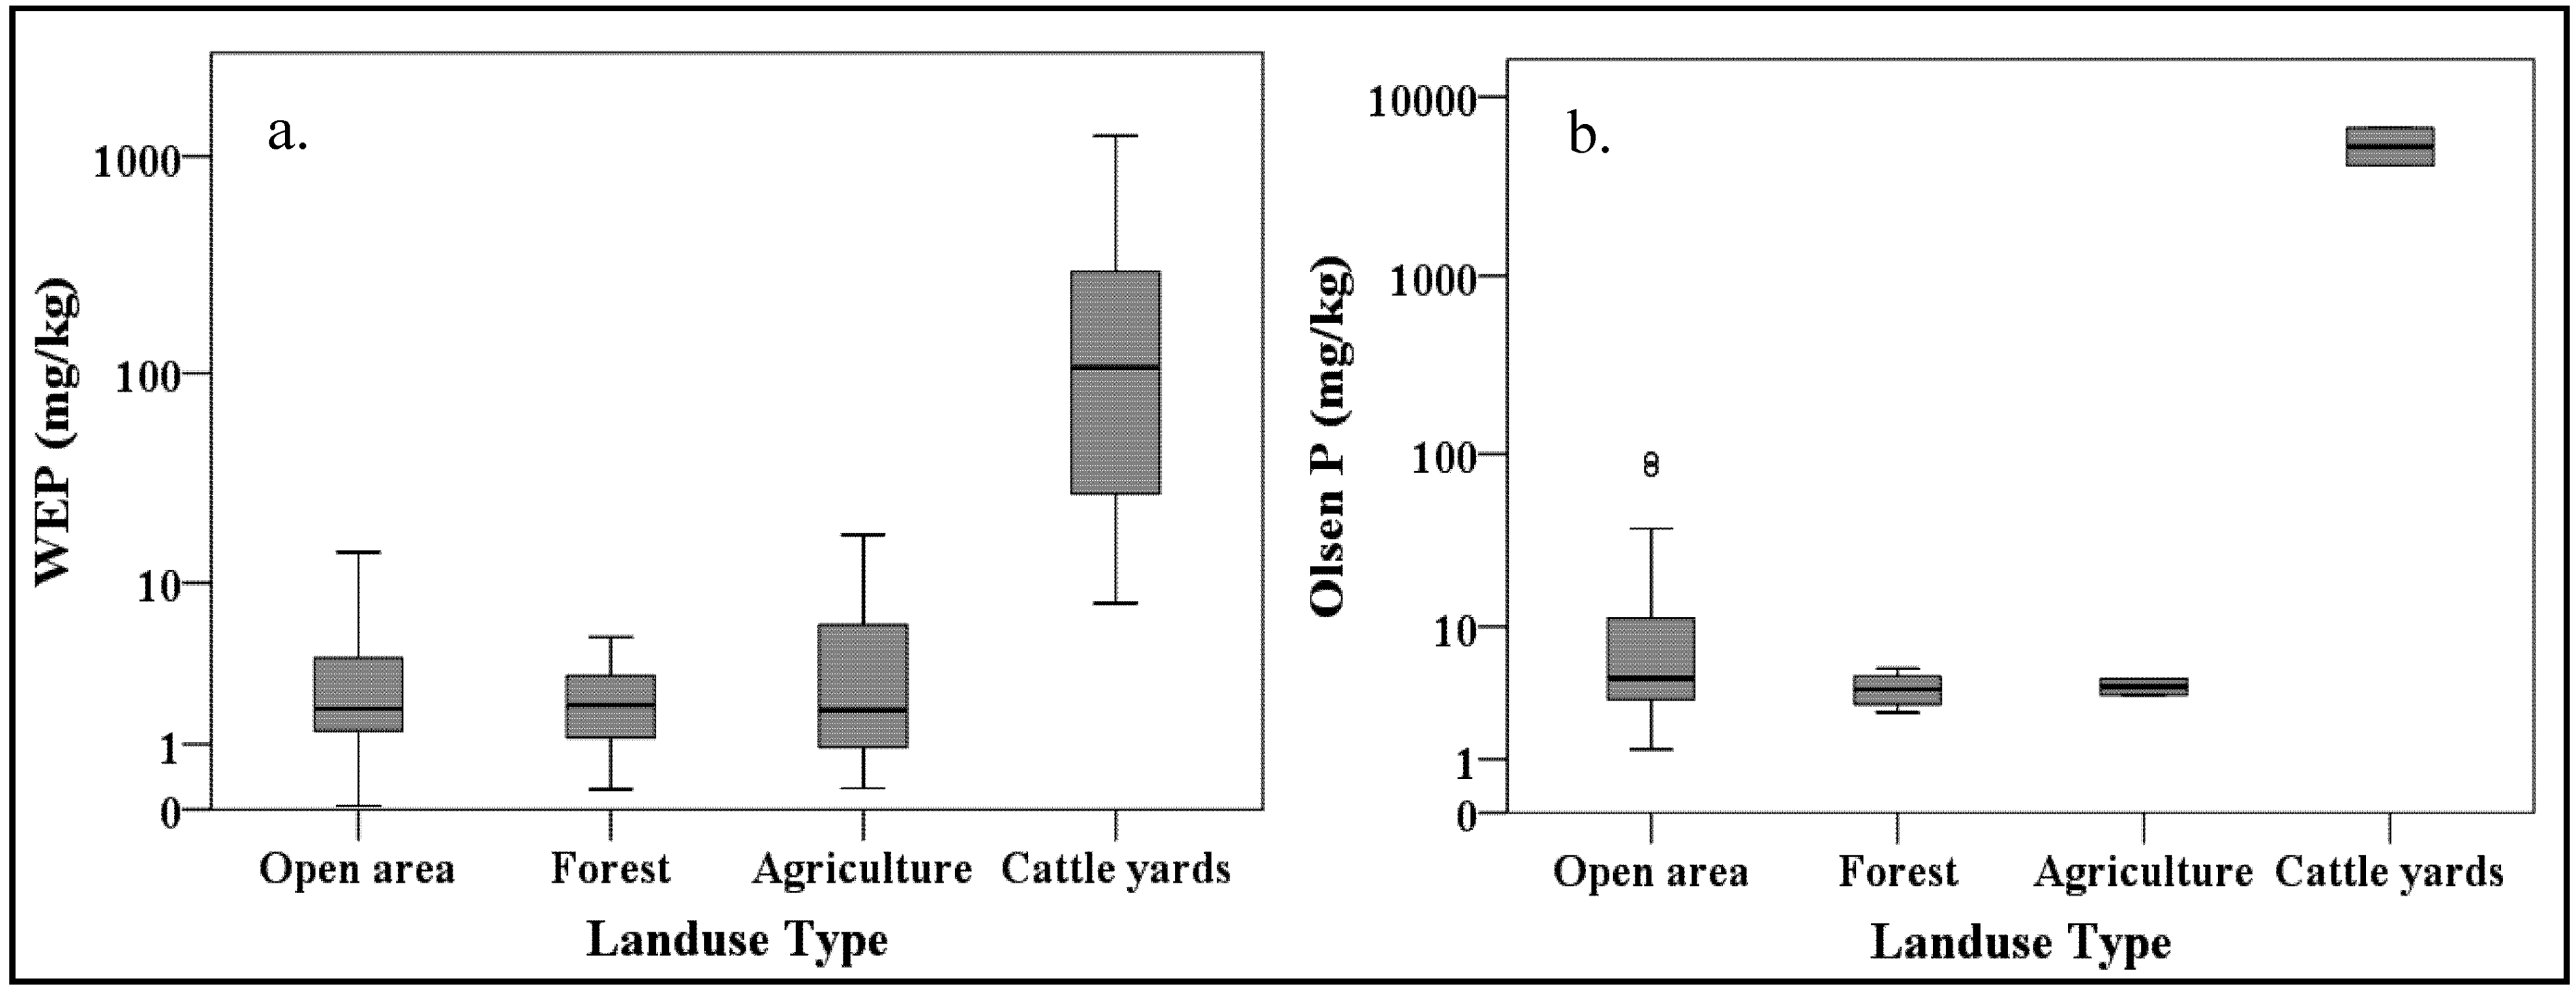
| Source | Soil P (mg/kg) | - | Water | Olsen |
| Crops | 1.4 | 6.3 | ||
| Cattle Yard | 148 | 786 | ||
| Forest | 2.1 | 3.9 | ||
| Orchards | 3.7 | 8.7 | ||
| Open area | 2.7 | 16.1 | ||
| Grazing Level | 0-20 | 1 | - | |
| 21–100 | 2 | - | ||
| 101–200 | 3 | - | ||
| >200 | 5 | - | ||
| Feeding center & yard | 10 | - | ||
| Transport | Vertical hydraulic conductivity (k) (m/d) | |||
| Slope (degrees) | ||||
| Rainfall event depth (mm) | ||||
| Cumulative rainfall across the catchment (Acc Rain) (m3) | ||||
| Soil Factor | Silt | 6 | - | |
| Silt-loam | 5 | - | ||
| Transfer | Stream Distance (m) | 0–50 | 1 | - |
| 50–100 | 0.75 | - | ||
| 100–200 | 0.5 | - | ||
| 200–300 | 0.25 | - | ||
| >300 | 0.125 | - | ||

3. Results and Discussion
3.1. Results

| P form | Date | Equation | r2 | p value |
|---|---|---|---|---|
| Dissolved P | 07/01/2007 | Y = 0.050X − 0.061 | 0.88 | 0.019 |
| 22/02/2009 | Y = 0.048X − 0.074 | 0.91 | 0.000 | |
| 01/03/2009 | Y = 0.031X + 0.117 | 0.77 | 0.001 | |
| 20/01/2010 | Y = 0.021X + 0.152 | 0.82 | 0.000 | |
| Total P (TP) | 07/01/2007 | Y = 0.056X + 0.188 | 0.83 | 0.030 |
| 22/02/2009 | Y = 0.058X + 0.010 | 0.77 | 0.002 | |
| 01/03/2009 | Y = 0.037X + 0.175 | 0.80 | 0.000 | |
| 20/01/2010 | Y = 0.012X + 0.939 | 0.14 | 0.281 |

3.2. Discussion
4. Conclusions
Acknowledgments
References
- Abell, J.M.; Özkundakci, D.; Hamilton, D.P.; Miller, S.D. Relationships between land use and nitrogen and phosphorus in New Zealand lakes. Mar. Freshw. Res. 2011, 62, 162–175. [Google Scholar]
- Smith, V.H. Eutrophication of freshwater and coastal marine ecosystems: A global problem. Environ. Sci. Pollut. Res. Int. 2003, 10, 126–139. [Google Scholar] [CrossRef]
- Paerl, H. Nutrient and other environmental controls of harmful cyanobacterial blooms along the freshwater-marine continuum. In Cyanobacterial Harmful Algal Blooms: State of the Science and Research Needs; Hudnell, K.H., Ed.; Springer: New York, NY, USA, 2008; Volume 619, pp. 217–237. [Google Scholar]
- Paerl, H.W.; Huisman, J. Blooms like it hot. Science 2008, 320, 57–58. [Google Scholar]
- Elser, J.J.; Bracken, M.E.S.; Cleland, E.E.; Gruner, D.S.; Harpole, W.S.; Hillebrand, H.; Ngai, J.T.; Seabloom, E.W.; Shurin, J.B.; Smith, J.E. Global analysis of nitrogen and phosphorus limitation of primary producers in freshwater, marine and terrestrial ecosystems. Ecol. Lett. 2007, 10, 1135–1142. [Google Scholar] [CrossRef]
- McDowell, R.W.; Larned, S.T.; Houlbrooke, D.J. Nitrogen and phosphorus in New Zealand streams and rivers: Control and impact of eutrophication and the influence of land management. N. Z. J. Mar. Freshw. Res. 2009, 43, 985–995. [Google Scholar] [CrossRef]
- Sharpley, A.N.; Rekolainen, S. Phosphorus in agriculture and its environmental implications. In Phosphorus Loss from Soil to Water; Tunney, H., Carton, O.T., Brookes, P.C., Johnston, A.E., Eds.; CAB International Press: Cambridge, UK, 1997; pp. 1–54. [Google Scholar]
- Howarth, R.; Anderson, D.; Cloern, J.; Elfring, C.; Hopkinson, C.; Lapointe, B.; Malone, T.; Marcus, N.; McGlathery, K.; Sharpley, A.; et al. Nutrient pollution of coastal rivers, bays, and seas. Issues Ecol. 2000, 7, 1–15. [Google Scholar]
- Gburek, W.J.; Sharpley, A.N. Hydrologic controls on phosphorus loss from upland agricultural watersheds. J. Environ. Qual. 1998, 27, 267–277. [Google Scholar] [CrossRef]
- Gburek, W.J.; Sharpley, A.N.; Heathwaite, L.; Folmar, G.J. Phosphorus management at the watershed scale: A modification of the phosphorus index. J. Environ. Qual. 2000, 29, 130–144. [Google Scholar]
- McDowell, R.W. Phosphorus and sediment loss in a catchment with winter forage grazing of cropland by dairy cattle. J. Environ. Qual. 2006, 35, 575–583. [Google Scholar] [CrossRef]
- James, E.; Kleinman, P.; Veith, T.; Stedman, R.; Sharpley, A. Phosphorus contributions from pastured dairy cattle to streams of the Cannonsville watershed, New York. J. Soil Water Conserv. 2007, 62, 40–47. [Google Scholar]
- Johnes, P.J.; Heathwaite, A.L. Modelling the impact of land use change on water quality in agricultural catchments. Hydrol. Proc. 1997, 11, 269–286. [Google Scholar] [CrossRef]
- Udawatta, R.P.; Motavalli, P.P.; Garrett, H.E. Phosphorus loss and runoff characteristics in three adjacent agricultural watersheds with claypan soils. J. Environ. Qual. 2004, 33, 1709–1719. [Google Scholar] [CrossRef]
- Heathwaite, A.L.; Fraser, A.I.; Johnes, P.J.; Hutchins, M.; Lord, E.; Butterfield, D. The phosphorus indicators tool: A simple model of diffuse P loss from agricultural land to water. Soil Use Manag. 2003, 19, 1–11. [Google Scholar]
- McDowell, R.W.; Drewry, J.J.; Muirhead, R.W.; Paton, R.J. Cattle treading and phosphorus and sediment loss in overland flow from grazed cropland. Aust. J. Soil Res. 2003, 41, 1521–1532. [Google Scholar] [CrossRef]
- Buczko, U.; Kuchenbuch, R.O. Phosphorus indices as risk-assessment tools in the USA and Europe—A review. J. Plant Nutr. Soil Sci. 2007, 170, 445–460. [Google Scholar] [CrossRef]
- Good, L.W.; Panuska, J.C.; Vadas, P. Current calculations in the Wisconsin P Index. Available online: http://wpindex.soils.wisc.edu (accessed on 12 December 2012).
- Bechmann, M.; Krogstad, T.; Sharpley, A. A phosphorus index for norway. Acta Agric. Scand. Sect. B Soil Plant Sci. 2005, 55, 205–213. [Google Scholar]
- Lemunyon, J.L.; Gilbert, R.G. The concept and need for a phosphorus assessment-tool. J. Prod. Agric. 1993, 6, 483–486. [Google Scholar]
- McDowell, R.W.; Srinivasan, M.S. Identifying critical source areas for water quality: 2. Validating the approach for phosphorus and sediment losses in grazed headwater catchments. J. Hydrol. 2009, 379, 68–80. [Google Scholar] [CrossRef]
- DeLaune, P.B.; Moore, P.A.; Carman, D.K.; Sharpley, A.N.; Haggard, B.E.; Daniel, T.C. Evaluation of the phosphorus source component in the phosphorus index for pastures. J. Environ. Qual. 2004, 33, 2192–2200. [Google Scholar] [CrossRef]
- Natural Resources Conservation Service, The Phosphorus Index: A Phosphorus Assessment Tool; Technical Note, Series No 1901. USDA Natural Resources Conservation Service: Washington, DC, USA, 1994.
- Yosef, Y.; Saaroni, Y.; Alpert, P. Trends in daily rainfall intensity over Israel 1950/1-2003/4. Open Atmos. Sci. J. 2009, 3, 196–203. [Google Scholar] [CrossRef]
- Berman, T.; Pollingher, U.; Zohary, T. A short history of stability and change in phytoplankton populations in Lake Kinneret. Isr. J. Plant Sci. 1998, 46, 73–80. [Google Scholar]
- Hadas, O.; Pinkas, R.; Malinsky-Rushansky, N.; Shalev-Alon, G.; Delphine, E.; Berner, T.; Sukenik, A.; Kaplan, A. Physiological variables determined under laboratory conditions may explain the bloom of Aphanizomenon ovalisporum in Lake Kinneret. Eur. J. Phycol. 2002, 37, 259–267. [Google Scholar] [CrossRef]
- Dan, J.; Singer, A. Soil evolution on basalt and basic pyroclastic materials in Golan Heights. Geoderma 1973, 9, 165–192. [Google Scholar] [CrossRef]
- Carter, M.R. Soil Sampling and Methods of Analysis. Canadian Society of Soil Science; Lewis Publishers: Boca Raton, FL, USA, 1993; p. 823. [Google Scholar]
- Zhang, R.D. Determination of soil sorptivity and hydraulic conductivity from the disk infiltrometer. Soil Sci. Soc. Am. J. 1997, 61, 1024–1030. [Google Scholar] [CrossRef]
- Tiessen, H.; Moir, J.O. Charactrization of available P by sequential extraction. In Soil Sampling and Methods of Analysis, Canadian Society of Soil Science; Carter, M.R., Ed.; Lewis Publishers: Boca Raton, FL, USA, 1993; pp. 75–84. [Google Scholar]
- Wood, D.H. Estimating rabbit density by counting dung pellets. Wildlife Res. 1988, 15, 665–671. [Google Scholar] [CrossRef]
- Madhusudan, M.D. Recovery of wild large herbivores following livestock decline in a tropical Indian wildlife reserve. J. Appl. Ecol. 2004, 41, 858–869. [Google Scholar] [CrossRef]
- Clesceri, L.S. Standard Methods for the Examination of Water and Wastewater, 20th ed; American Public Health Association: Washington, DC, USA, 1998. [Google Scholar]
- Natural Resources Conservation Service, Soil Survey Manual; USDA Handbook 18; USDA Natural Resources Conservation Service: Washington, DC, USA, 1993.
- Renard, K.G.; Foster, G.R.; Weesies, G.A.; McCool, D.K.; Yoder, D.C. Predicting Soil Erosion by Water: A Guide to Conservation Planning with the Revised Universal Soil Loss Equation (RUSLE); USDA Agricultural Handbook; USDA: Washington, DC, USA, 1997; Volume 703, p. 404. [Google Scholar]
- Mallarino, A.P.; Stewart, B.M.; Baker, J.L.; Downing, J.D.; Sawyer, J.E. Phosphorus indexing for cropland: Overview and basic concepts of the Iowa phosphorus index. J. Soil Water Conserv. 2002, 57, 440–447. [Google Scholar]
- Weld, J.; Beegle, D.B.; Bryant, R.; Gburek, W.J.; Kleinman, P.; Sharpley, A.N. The Pennsylvania Phosphorus Index; Version 2, UC180; The College of Agricultural Sciences, Pennsylvania State University: University Park, PA, USA, 2007. [Google Scholar]
- Morin, J.; Michaeli, A.; Agassi, M.; Atzmon, B.; Rozentzveig, D. Rainfall–Runoff–Erosion Relations in the Lake Kinneret Watershed (in Hebrew); Soil Erosion Research Station, Agricultural Research Organization, The Ministry of Agricultural and Rural Development: Bet-Dagan, Israel, 1979. [Google Scholar]
- Simms, A.D.; Woodroffe, C.D.; Jones, B.G. Application of RUSLE for erosion management in a coastal catchment, southern NSW. In Proceedings of the MODSIM 2003: International Congress Modelling and SimulationIntegrative Modelling of BiophysicalSocial and Economic Systems for Resource Managment Solutions, Townsville, Australia, 14–17 July 2003; Volume 2, pp. 678–683.
- Mitasova, H.; Mitas, L. Modeling Soil Detachment with RUSLE 3D Using GIS; Geographic Modeling Systems Lab, University of Illinois at Urbana-Champaign, 1999. Available online: http://skagit.meas.ncsu.edu/~helena/gmslab/erosion/usle.html (accessed on 12 December 2012).
- Stone, R.P.; Hilborn, D. Factsheet, Universal Soil Loss Equation (USLE); Ministry of Agriculture, Food and Rural Affairs, Ontario, Canada, 2000. Available online: http://www.omafra.gov.on.ca/english/engineer/facts/00-001.pdf (accessed on 12 December 2012).
- Trahan, N. Modeling Sediment and Contaminant Pathways to the Cedar River; ESRI User Conference, 2002. Available online: http://proceedings.esri.com/library/userconf/proc02/pap0785/p0785.htm (accessed on 12 December 2012).
- Bakker, M.M.; Govers, G.; Doom, A.V.; Quetier, F.; Chouvardas, D.; Rounsevell, M. The response of soil erosion and sediment export to land-use change in four areas of Europe: The importance of landscape pattern. Geomorphology 2008, 98, 213–226. [Google Scholar] [CrossRef]
- Van Bochove, E.; Thériault, G.; Denault, J.T. Indicator of Risk of Water Contamination by Phosphorus (IROWC_P): A Handbook for Presenting the IROWC_P Algorithms; Contribution No. AAFC/AAC; Agriculture and Agri-Food Canada: Quebec, Canada, 2009. [Google Scholar]
- Zhan, X.; Huang, M.-L. ARCCN-runoff: An ARCGIS tool for generating curve number and runoff maps. Environ. Model. Softw. 2004, 19, 875–879. [Google Scholar] [CrossRef]
- Kurz, I.; O’Reilly, C.D.; Tunney, H. Impact of cattle on soil physical properties and nutrient concentrations in overland flow from pasture in Ireland. Agric. Ecosyst. Environ. 2006, 113, 378–390. [Google Scholar] [CrossRef]
- Herbin, T.; Hennessy, D.; Richards, K.G.; Piwowarczyk, A.; Murphy, J.J.; Holden, N.M. The effects of dairy cow weight on selected soil physical properties indicative of compaction. Soil Use Manag. 2011, 27, 36–44. [Google Scholar] [CrossRef]
- US EPA (United States Environmental Protection Agency). Ecoregional Nutrient Criteria Documents: Rivers and Streams; U.S. Environmental Protection Agency: Washington, DC, USA, 2000. Available online: http://www.epa.gov/waterscience/criteria/nutrient/ecoregions/rivers/index.html (accessed on 12 December 2012).
- Bundy, L.G.; Mallarino, A.P.; Good, L.W. Field-scale tools for reducing nutrient losses to water resources. In Final Report: Gulf Hypoxia and Local Water Quality Concerns Workshop, Ames, Iowa; American Society of Agricultural and Biological Engineers: St. Joseph, MI, USA, 2008; pp. 159–170. [Google Scholar]
- Weld, J.; Beegle, D.B.; Bryant, R.; Gburek, W.J.; Kleinman, P.; Sharpley, A.N. The Pennsylvania Phosphorus Index, Version 1; Pub. Code: US 180 5M3/03PS4591; The College of Agricultural Sciences, Pennsylvania State University: University Park, PA, USA, 2003. [Google Scholar]
- Harmel, R.D.; Torbert, H.A.; DeLaune, P.B.; Haggard, B.E.; Haney, R.L. Field evaluation of three phosphorus indices on new application sites in Texas. J. Soil Water Conserv. 2005, 60, 29–42. [Google Scholar]
- Huisman, N.L.H.; Karthikeyan, K.G. Using radiometric tools to track sediment and phosphorus movement in an agricultural watershed. J. Hydrol. 2012, 450–451, 219–229. [Google Scholar] [CrossRef]
- Vadas, P.A.; Gburek, W.J.; Sharpley, A.N.; Kleinman, P.J.A.; Moore, P.A.; Cabrera, M.L.; Harmel, R.D. A model for phosphorus transformation and runoff loss for surface-applied manures. J. Environ. Qual. 2007, 36, 324–332. [Google Scholar] [CrossRef]
- Haygarth, P.M.; Condron, L.M.; Heathwaite, A.L.; Turner, B.L.; Harris, G.P. The phosphorus transfer continuum: Linking source to impact with an interdisciplinary and multi-scaled approach. Sci. Tot. Environ. 2005, 344, 5–14. [Google Scholar] [CrossRef]
© 2013 by the authors; licensee MDPI, Basel, Switzerland. This article is an open access article distributed under the terms and conditions of the Creative Commons Attribution license (http://creativecommons.org/licenses/by/3.0/).
Share and Cite
Reichmann, O.; Chen, Y.; Iggy, L.M. Spatial Model Assessment of P Transport from Soils to Waterways in an Eastern Mediterranean Watershed. Water 2013, 5, 262-279. https://doi.org/10.3390/w5010262
Reichmann O, Chen Y, Iggy LM. Spatial Model Assessment of P Transport from Soils to Waterways in an Eastern Mediterranean Watershed. Water. 2013; 5(1):262-279. https://doi.org/10.3390/w5010262
Chicago/Turabian StyleReichmann, Oren, Yona Chen, and Litaor M. Iggy. 2013. "Spatial Model Assessment of P Transport from Soils to Waterways in an Eastern Mediterranean Watershed" Water 5, no. 1: 262-279. https://doi.org/10.3390/w5010262
APA StyleReichmann, O., Chen, Y., & Iggy, L. M. (2013). Spatial Model Assessment of P Transport from Soils to Waterways in an Eastern Mediterranean Watershed. Water, 5(1), 262-279. https://doi.org/10.3390/w5010262