Article

Fecal Coliform and E. coli Concentrations in Effluent-Dominated Streams of the Upper Santa Cruz Watershed

Landscape Ecology Branch, Environmental Sciences Division, National Exposure Research Laboratory, United States Environmental Protection Agency Office of Research and Development, 944 East Harmon Avenue, Las Vegas, NV 89119, USA
*
Author to whom correspondence should be addressed.
Water 2013, 5(1), 243-261; https://doi.org/10.3390/w5010243
Submission received: 4 January 2013 / Revised: 26 February 2013 / Accepted: 26 February 2013 / Published: 11 March 2013
(This article belongs to the Special Issue Sustainable Wastewater Treatment and Pollution Control)

Abstract

:
This study assesses the water quality of the Upper Santa Cruz Watershed in southern Arizona in terms of fecal coliform and Escherichia coli (E. coli) bacteria concentrations discharged as treated effluent and from nonpoint sources into the Santa Cruz River and surrounding tributaries. The objectives were to (1) assess the water quality in the Upper Santa Cruz Watershed in terms of fecal coliform and E. coli by comparing the available data to the water quality criteria established by Arizona, (2) to provide insights into fecal indicator bacteria (FIB) response to the hydrology of the watershed and (3) to identify if point sources or nonpoint sources are the major contributors of FIB in the stream. Assessment of the available wastewater treatment plant treated effluent data and in-stream sampling data indicate that water quality criteria for E. coli and fecal coliform in recreational waters are exceeded at all locations of the Santa Cruz River. For the wastewater discharge, 13%–15% of sample concentrations exceeded the 800 colony forming units (cfu) per 100 mL sample maximum for fecal coliform and 29% of samples exceeded the full body contact standard of 235 cfu/100 mL established for E. coli; while for the in-stream grab samples, 16%–34% of sample concentrations exceeded the 800 cfu/100 mL sample maximum for fecal coliforms and 34%–75% of samples exceeded the full body contact standard of 235 cfu/100 mL established for E. coli. Elevated fecal coliform and E. coli concentrations were positively correlated with periods of increased streamflow from rainfall. FIB concentrations observed in-stream are significantly greater (p-value < 0.0002) than wastewater treatment plants effluent concentrations; therefore, water quality managers should focus on nonpoint sources to reduce overall fecal indicator loads. Findings indicate that fecal coliform and E. coli concentrations are highly variable, especially along urban streams and generally increase with streamflow and precipitation events. Occurrences of peaks in FIB concentrations during baseflow conditions indicate that further assessment of ecological factors such as interaction with sediment, regrowth, and source tracking are important to watershed management.

1. Introduction

In the semi-arid southwest, rapid urbanization and population growth have led to increased use of treated effluent to augment and maintain hydrologic conditions in the watershed resulting in both positive and negative consequences in terms of overall watershed quality [1,2]. Planned water reuse is a common occurrence globally and began as early as 1918 in California and Arizona in order to provide irrigation water for crops [3]. Discharge of treated effluent into stream channels recharges the groundwater aquifers, supports riparian habitation, enhances ecosystem services, and is commonly implemented by state agencies for these reasons [4,5]. For example, natural perennial and ephemeral flows in the Upper Santa Cruz River are artificially augmented by treated effluent from the cities of Nogales and Tucson where, historically, portions of the Santa Cruz River near the city of Tucson were pumped dry as early as 1910 [6].
However, reliance on treated effluent for perennial streamflow potentially endangers human health due to recreational exposure and possible contamination of domestic water supplies by increased microbial pathogen concentrations in surface and ground waters [4,7,8,9]. Common sources of potential pathogenic contamination in surface waters include storm runoff from urban and agricultural landscapes, wild animal wastes, wastewater treatment plant discharges, and failing septic system drainage [8,10,11]. Monitoring river networks for all potential pathogenic agents is expensive and not feasible; therefore, methodologies for monitoring fecal indicator bacteria (FIB) and determining acceptable risk have been established [12,13,14,15]. Current ambient water quality criteria for FIB in fresh waters are aimed to protect human health from gastroenteritis due to pathogenic exposure based on the estimated relative risk of 8 cases of gastroenteritis per 1000 swimmers [12]. The appropriateness of the methods used and FIB capability for correlating and identifying human health risk from pathogens has been debated in the literature [16,17,18,19]. Despite the ongoing debate, most states monitor for total coliforms, fecal coliforms, Escherichia coli (E. coli), fecal streptococci, or enterococci as indicators of potential pathogens in water resources. In Arizona, E. coli has replaced fecal coliform as the preferred FIB in stream networks [20,21].
To minimize the potential risk of wastewater to public health and the environment, state agencies regulate and permit planned wastewater reclamation and reuse facilities [3]. In many cases, these facilities, regardless if the intended reuse is for recharge or irrigation, achieve a high degree of consistent water quality, and the removal of microbial and other contaminants associated with human waste are of paramount concern [22,23]. As this case study will show, additional research and assessment of the fate and transport of pollutants released indirectly into effluent-dominated and/or effluent dependent stream networks are critical to controlling overall FIB loading in the watershed. The objectives of this study are (1) to assess the water quality in the Upper Santa Cruz Watershed in terms of FIB by comparing the available data to the water quality criteria established by Arizona, (2) to provide insights into FIB response to the hydrology of a semi-arid watershed and (3) to identify major FIB contributors (point sources versus nonpoint sources) to the stream.

2. Study Location: Santa Cruz Watershed

The entire Santa Cruz Watershed is composed of approximately 28,749 km2, roughly 10% of the state of Arizona; land ownership is approximately 40% tribal, 25% federal, 20% private and 15% state [20]. The Santa Cruz River has its headwaters in Arizona’s San Rafael Valley, which is in the southeast/central part of the state. The river flows south and makes a 40 km loop through Mexico before returning to the United States (U.S.) about eight kilometers east of Nogales, Arizona. The river then flows north from the U.S.-Mexico border and converges with the Gila River, just southwest of Phoenix. According to the Arizona Department of Environmental Quality (ADEQ), grazing is the dominant land use while irrigated crop production is limited to areas near streams, but restricted land uses have been established near several wilderness areas, national forests, and national monuments. In addition, mining operations, both active and abandoned, are located throughout the watershed [20]. Annual precipitation ranges from 280 to 860 mm (valley to mountain, respectively). This study focuses on the sub watersheds containing the Santa Cruz River south of Tucson, Arizona.
Most of the population in the Upper Santa Cruz Watershed is found in the city of Tucson (population 530,000), the state’s second largest city after Phoenix [24]. There is also a population of 370,000 located on the U.S.-Mexico border in the sister border cities of Heroica Nogales, Sonora, Mexico and Nogales, Arizona, U.S. According to the U.S. Census Bureau (2005), the population in the state of Arizona is projected to increase by approximately 52% over 30 years from 2000 to 2030 which is expected to increase the urban water demand by approximately 45% despite sustainable development efforts [25,26]. The growth in Sonora, Mexico is expected to increase at an even higher rate which is anticipated to increase the urban water demand by 18% by 2030 [25]. As more demand from urban growth and land use is placed on the system, understanding the fate and transport of pollutants released and how treated effluent impacts the overall water quality, especially water supplies designated for human consumption, is necessary.
Water quantity and quality issues in the Upper Santa Cruz watershed are confounded by the quality of waters flowing from areas of Mexico which have less regulated infrastructure to handle wastewater treatment [27]. Continuous efforts are being made by both countries to provide wastewater service in rural areas and to enhance wastewater treatment and reclamation infrastructure to meet future needs [28]. The Groundwater Storage, Savings, and Replenishment Program managed by the Arizona Department of Water Resources (ADWR) permits groundwater and surface water recharge facilities to discharge reclaimed waters into infiltration basins and, in some cases, directly into the Santa Cruz River [5]. The ADEQ permits 22 facilities, each issued an Arizona Pollution Discharge Elimination System (AZPDES) permit, to discharge treated effluent into the Santa Cruz River and its tributaries [29]. These facilities, not all of which are actively discharging, include wastewater treatment plants (WWTP), wastewater reclamation facilities, and water pollution control facilities. The Central Arizona Project (CAP) canal allocates 563,947,056 m3 of Colorado River water per year to Pima, Pinal, and Maricopa counties to supplement domestic water supplies and also to maintain aquifer levels [30]. In 2010, Pima County, Arizona produced approximately 84,860,000 m3 of treated effluent of which about 76,720,000 m3 was discharged from facilities located in Tuscon, Arizona [31]. In Santa Cruz County, Arizona, the newly expanded Nogales International Wastewater Treatment Plant (NIWTP) (see Figure 1 Map ID C) treats more than 56,781 m3/day, approximately 20,720,000 m3 annually, of wastewater from both Nogales, Arizona and Heroica Nogales, Sonora and discharges it to the Santa Cruz River after advanced biological treatment [32].
Figure 1. The Santa Cruz Watershed, fecal coliform and E. coli sampling locations, weather stations, and United States Geological Survey (USGS) streamflow stations.
Water 05 00243 g001

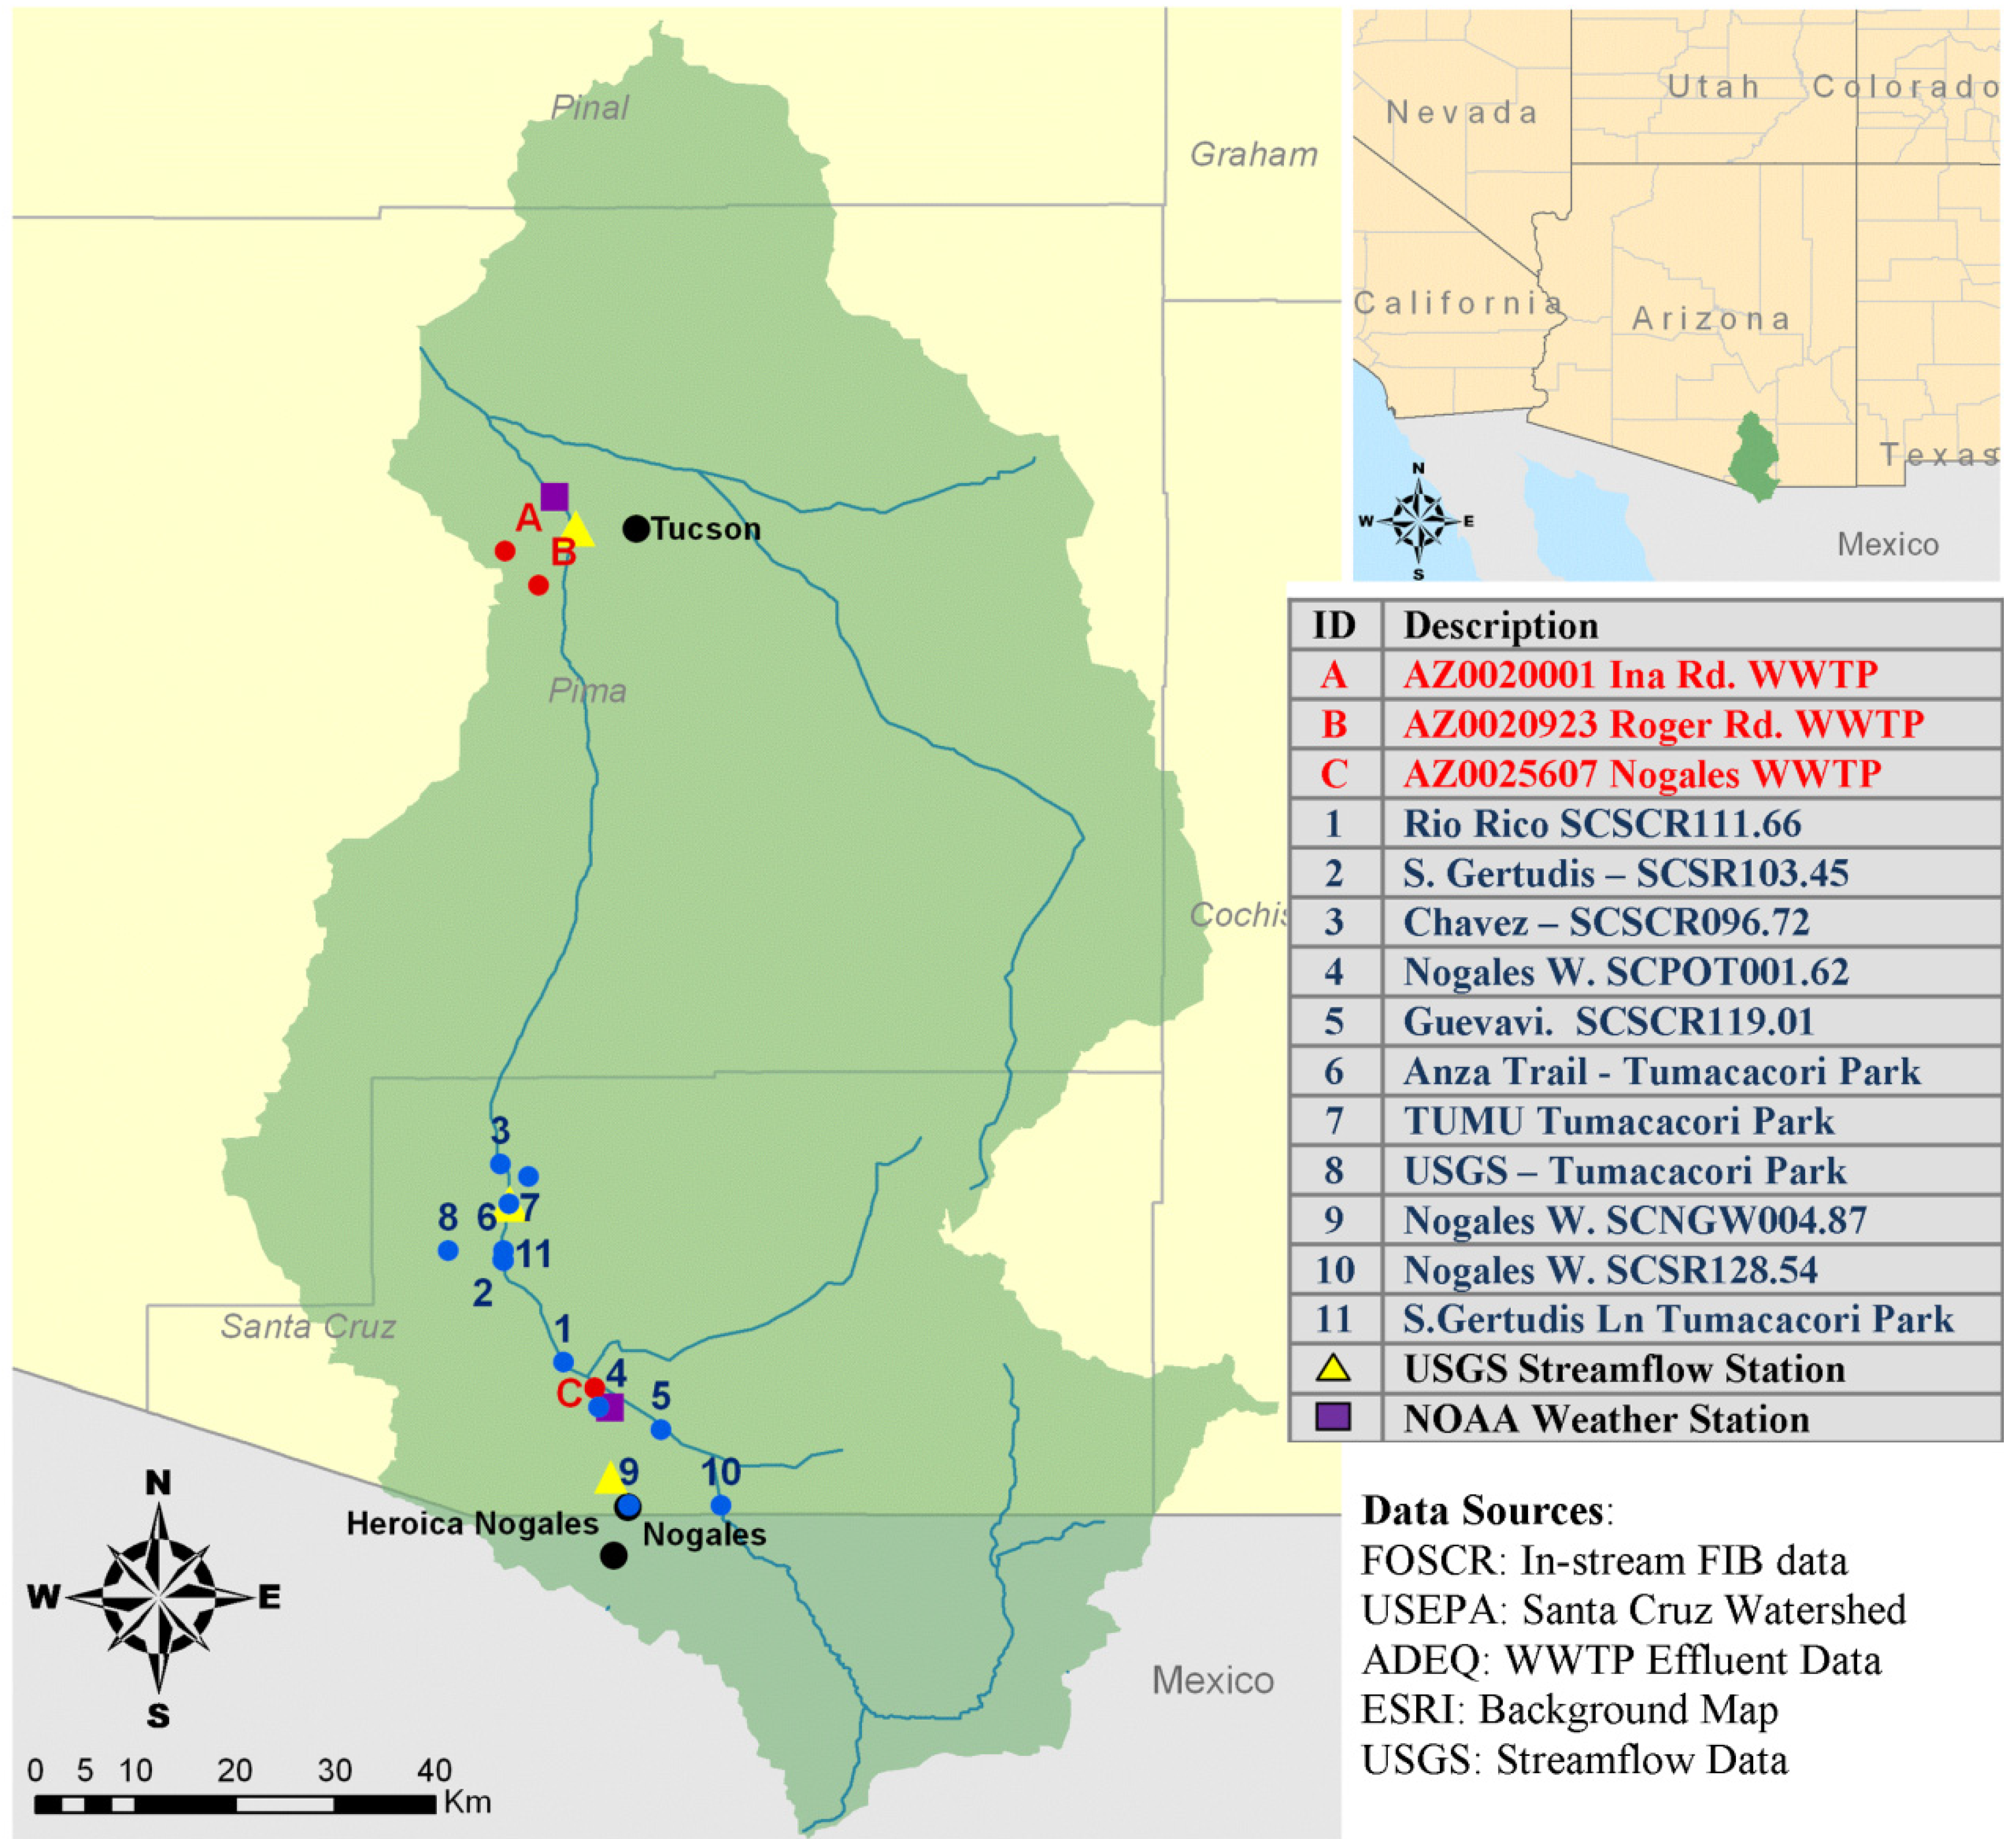
3. Data Collection and Analysis

Monthly E. coli and fecal coliform monitoring data from both point sources such as WWTP discharge pipes and nonpoint sources from numerous stream segments throughout the Upper Santa Cruz Watershed as shown in Figure 1 were used in this study. The E. coli and fecal coliform data used in this study are from numerous sampling records including ADEQ in conjunction with Friends of the Santa Cruz River (FOSCR), National Park Service at Tumacacori National Historical Park and Sonoran Desert Network, Sonoran Institute, United States Geological Survey (USGS), and U.S. Environmental Protection Agency (EPA) Envirofacts permit compliance system (PCS) database. For the point sources data, a custom search on the Envirofacts PCS database was preformed to assess indicator bacteria concentrations from WWTP monthly discharge monitoring reports (DMR) prepared by AZPDES permitted facilities which discharge treated effluent into the Santa Cruz River and surrounding washes and tributaries (Figure 1, Map ID A and B) [29]. These grab samples show a snap shot in time and space of the FIB activity for a given location and were collected to either fulfill the AZPDES monitoring requirements or for water quality assessment purposes. The available data for the watershed are organized by location and vary in regard to sample frequency, period of record, sampling method, and FIB assessed (fecal coliforms or E. coli). The WWTP DMRs data collected were summarized into a monthly report. For nonpoint source data, in-stream samples were collected primarily on a quarterly or monthly basis unless no sample could be obtained due to low or no streamflow conditions; several gaps in the sampling record exist at each location. The geometric mean and sample maximum for each WWTP DMR and each in-stream sampling location available are summarized in the results section below. Variations in the targeted FIB disallow direct comparison of each sampling location for the entirety of the sampling record and the reported concentrations have differences in terms of method quantification limits and the lab methods used. The lab method reported for E. coli samples is listed as SM9223B and fecal coliform concentrations were determined using direct plating methods (SM9222E) or the Most Probable Number (MPN) method [13,15]. For the raw in-stream sampling data, a geometric mean and maximum concentration are calculated for the FIB reported at each location. The results are presented in the Table 2, Table 3, Table 4, Table 5 below.
The available data at each sampling location are compared to regulatory water quality criteria for FIB established in Arizona as summarized in Table 1. According to the regulatory standards listed in Table 1, wastewater dischargers report bacteria concentrations as a geometric mean of all the test results obtained during a reporting period, which is helpful when analyzing bacteria concentrations that may vary anywhere from 10 to 10,000 fold over a given period. The single sample maximum value is also needed to ensure that public health is protected from unusually high microbial loads.
Average daily baseflow conditions were determined using the Web Based Hydrograph Analysis Tool (WHAT) and the local minimum method for daily streamflow from 1 March 1996 to 30 April 2008 at two USGS stations (09481740 and 09480500) within close proximity of the sampling locations [33]. Since the local minimum method generally overestimates baseflow during storm events, the WHAT results were compared to precipitation data for a better estimation of actual baseflow conditions. Then, the correlation between streamflow/precipitation and in-stream fecal coliform/E. coli concentrations was analyzed to identify potential factors impacting the in-stream fecal coliform/E. coli concentrations. Precipitation data was obtained from weather stations maintained by the National Oceanic and Atmospheric Administration (NOAA). Streamflow data was collected from gage stations maintained by the USGS. Finally, data collected from point source WWTPs were compared with nonpoint in-stream grab samples and statistical tests were performed to see if fecal coliform/E. coli concentrations were significantly different between WWTPs and nonpoint sources. In instances where the sample value was reported as greater than the upper method detection limit or less than the lower method detection limit, the detection limit was used in the statistical comparison.
Table 1. Water quality standards for E. coli and fecal coliforms. Units are colony forming units (cfu)/100 mL.
E. coli a
Water Quality CriteriaFBC dPBC e
Geometric Mean c126126
Single sample maximum235575
Fecal Coliform b
Water Quality CriteriaFBC dOther Designated Uses f
Geometric Mean c2001000
10% of samples over 30 days4002000
Single Sample Maximum8004000
Notes: a Source: Bacterial Water Quality Standards for Recreational Waters: Status Report (EPA-823-R-03-008) [14]; b Source: Pathogen TMDL in Slide Rock State Park, Oak Creek Canyon, Arizona [34]; c Minimum of four samples in 30 days [35]; d “Full-body contact (FBC)” means the use of a surface water for swimming or other recreational activity that causes the human body to come into direct contact with the water to the point of complete submergence [35]; e “Partial-body contact (PBC)” means the recreational use of a surface water that may cause the human body to come into direct contact with the water, but normally not to the point of complete submergence (for example, wading or boating) [35]; f “other designated uses” may include fish consumption, aquatic and wildlife, agricultural irrigation or livestock watering [35].

4. Results

4.1. Fecal Coliform and E. coli Concentrations from Point Source WWTP Effluent

Consistent concentration data was found for three permitted locations (Map ID A–C in Figure 1) in the Upper Santa Cruz watershed from approximately 1988 to 2008 for fecal coliform and approximately 2008 to 2011 for E. coli. The values represented in Table 2, Table 3 were obtained from the DMRs filed with the USEPA as required by the AZPDES permit for each facility. It is important to note that the following tables reflect the number of reported average and maximum values for all reported monitoring periods for each facility and not the actual number of grab samples collected at each facility location. Table 2 summarizes the maximum grab sample value reported in each DMR period and represents the “worst case” fecal coliform concentrations released from these facilities into the Santa Cruz River and its tributaries. Table 3 summarizes the averaged values reported for each DMR period for each facility. The values were then compared to the current water quality standards shown in Table 1 for fecal coliform and E. coli.
Table 2 shows instances in which maximum DMR values exceed the maximum allowable concentration of 800 colony forming units (cfu) per 100 mL for fecal coliform for the facilities with available data from about 1988 to 2008. 13% of the DMR periods at Pima County Rd WWTP and 15% of the DMR periods at Roger Road WWTP contained fecal coliform concentrations which exceeded the 800 cfu/100 mL single sample maximum standard. These facilities are located near Tucson where surface water withdrawals are used for municipal water supplies. At the Nogales International WWTP, E. coli levels in the treated effluent exceed the maximum concentration of 235 cfu/100 mL for FBC associated with recreational use in 29% of the DMR periods. The single sample maximum of 575 cfu/100 mL for PBC was exceeded in 18% of the maximum concentrations reported for each DMR period. Table 3 indicates that the mean concentration values for the monitoring periods are below the WQ standards for fecal coliforms. The geometric mean of 126 cfu/100 mL for E. coli is exceeded in 11% of the monitoring periods available for assessment from the Nogales International WWTP. The treated effluent from WWTP facilities appears to have a minor contribution to the fecal coliform and E. coli concentrations found within the watershed.
Table 2. Summary of the maximum concentrations reported for discharge monitoring reports (DMRs) period compared to the fecal coliform maximum standard of 800 cfu/100 mL for a single sample value or to the E. coli full body contact (FBC) maximum standard of 235 cfu/100 mL and to the 575 cfu/100 mL for partial body contact (PBC) for a single sample value.
Facility Name Permit ID# of Reporting Periods aThe highest value of Maximum concentrations reported by the facility during DMRs periodMean of the Maximum Concentrations reported during DMRs periodReporting Periods >800 cfu/100 mL (Fecal)Reporting Periods >235 cfu/100 mL (FBC E. coli)Reporting Periods >575 cfu/100 mL (PBC E. coli)
Pima County Ina Road WWTP AZ002000194160023113%--------
Roger Road WWTP AZ002092398160026915%--------
Nogales International WWTP AZ0025607272400330----29%18%
Notes: a # of reporting periods represent the number of DMRs submitted and not the actual number of raw sample data collected at the facility. DMRs represent monthly data.
Table 3. Summary of the averaged concentrations reported during each DMRs period compared to the fecal coliform geometric mean standard of 200 cfu/100 mL or the E. coli geometric mean standard of 126 cfu/100 mL for FBC and PBC.
Facility Name Permit ID# of Reporting Periods aThe highest value of Average Concentrations b reported by the facility during DMRs periodMean of the Average Concentrations b reported by the facility during DMRs periodReporting Periods >200 cfu/100 mL (Fecal)Reporting Periods >126 cfu/100 mL (E. coli)
Pima County Ina Road WWTP AZ0020001947916.20---
Roger Road WWTP AZ00209239810417.40---
Nogales International WWTP AZ00256072722941.6----11%
Notes: a # of reporting periods represent the number of DMRs submitted and not the actual number of raw sample data collected at the facility. DMRs represent monthly data; b Average concentration represents the value reported on the Discharge Monitoring Report (DMR) as the geometric mean grab sample value for the given monitoring period.

4.2. In-Stream Fecal Coliform and E. coli Data Analysis

4.2.1. Fecal Coliform and E. coli Concentrations from Nonpoint In-Stream Sources

Data used in this study from in-stream monitoring locations (Map ID 1–11 in Figure 1) for the Upper Santa Cruz River was obtained primarily via coordination between ADEQ and nonprofit organizations such as the FOSCR. Fecal coliform grab sampling results were organized by location; the geometric mean and sample maximum for each location for the entire period of record available was summarized in Table 4. An extremely large range of individual sample values exists for all locations; however, the geometric mean standard of 200 cfu/100 mL for fecal coliform was not exceeded at any location. The single sample maximum of 800 cfu/100 mL for fecal coliform is exceeded during several sampling events at each location as shown in the last column of Table 4.
Table 4. Fecal coliform concentration (cfu/100 mL) summary from in-stream sampling locations in the Upper Santa Cruz Watershed.
Reach ID ADEQ ID# of samplesStart DateEnd DateSingle Sample MaxGeometric Mean% > 800 (Fecal)
Rio Rico SCSCR111.66 ADEQ 1002381123/198812/2008139,00016119%
S. Gertudis SCSCR103.45 ADEQ 100247982/199312/200827,10014921%
Chavez SCSCR096.72 ADEQ 1002448911/199212/200849,2009915%
Nogales W. (Portero Creek) SCPOT001.62ADEQ 100571703/199612/200824,00014624%
Nogales Guevavi SCSCR119.01 ADEQ 1002463211/19927/200179,0003913%
E. coli grab sampling results were organized by location; the geometric mean and sample maximum for each location for the entire period of record available was summarized into Table 5. E. coli concentrations at all in-stream sampling locations indicate the geometric mean standard of 126 cfu/100 mL is exceeded by more than double at all sampling locations. In addition, the maximum standards for a single sample value (235 cfu/100 mL for partial body contact and 575 cfu/100 mL for full body contact) are also exceeded at every location in at least 33% and up to 75% of the samples evaluated. The E. coli concentrations reported consistently exceed those concentration reported for fecal coliforms, which is likely due to differences in the methods of analysis for the specific indicator species targeted [17,18].
Table 4, Table 5 show that in-stream concentrations of E. coli and fecal coliform are much higher than that observed in the point source effluent discharges. The in-stream data available for assessment was limited to stream segments along the Santa Cruz River except in two locations at Nogales W. Portero Creek and USGS Tumacacori Park (Map ID 4 and 8 in Figure 1, respectively). Samples collected from these tributary washes at Portero Creek and Tumacacori Park exceeded the FBC water quality standards for E. coli in approximately 61% and 75% of samples collected, respectively (see Table 5). Additional sampling from contributing effluent-dominated washes and tributaries would allow better estimates of the true fecal coliform and E. coli indicator concentrations in the Santa Cruz River from point and nonpoint sources.
Table 5. E. coli concentration (cfu/100 mL) summary from in-stream sampling locations in the Upper Santa Cruz Watershed.
Reaches ID ADEQ ID# of samplesStart DateEnd DateMAXGeometric Mean% > 235 (FBC E. coli)% > 575 (PBC E. coli)
Santa Gertudis Lane Tubac Basin Tumacacori Park (NPS)1596/20079/2010547,50066861%45%
Anza Trail River Crossing Tubac Basin Tumacacori Park (NPS)646/20079/2010173,29031653%33%
TUMA Educational Site Tubac Basin Tumacacori Park (NPS)887/20079/2010241,96060957%42%
Rio Rico SCSCR111.66 ADEQ 100238292/20085/2011241,920 a30634%24%
S. Gertudis SCSCR103.45 ADEQ 100247222/20085/2011241,920 a36741%18%
Chavez SCSCR096.72 ADEQ 100244192/20084/2011141,30049152%26%
Nogales W. (Portero Creek) SCPOT001.62 ADEQ 100571212/20085/2011241,920 a79261%38%
USGS Tumacacori Tubac166/2/20109/8/2010210,000226575%56%
Note: a Laboratory reported value is greater than the method quantification level (Method SM9223B).

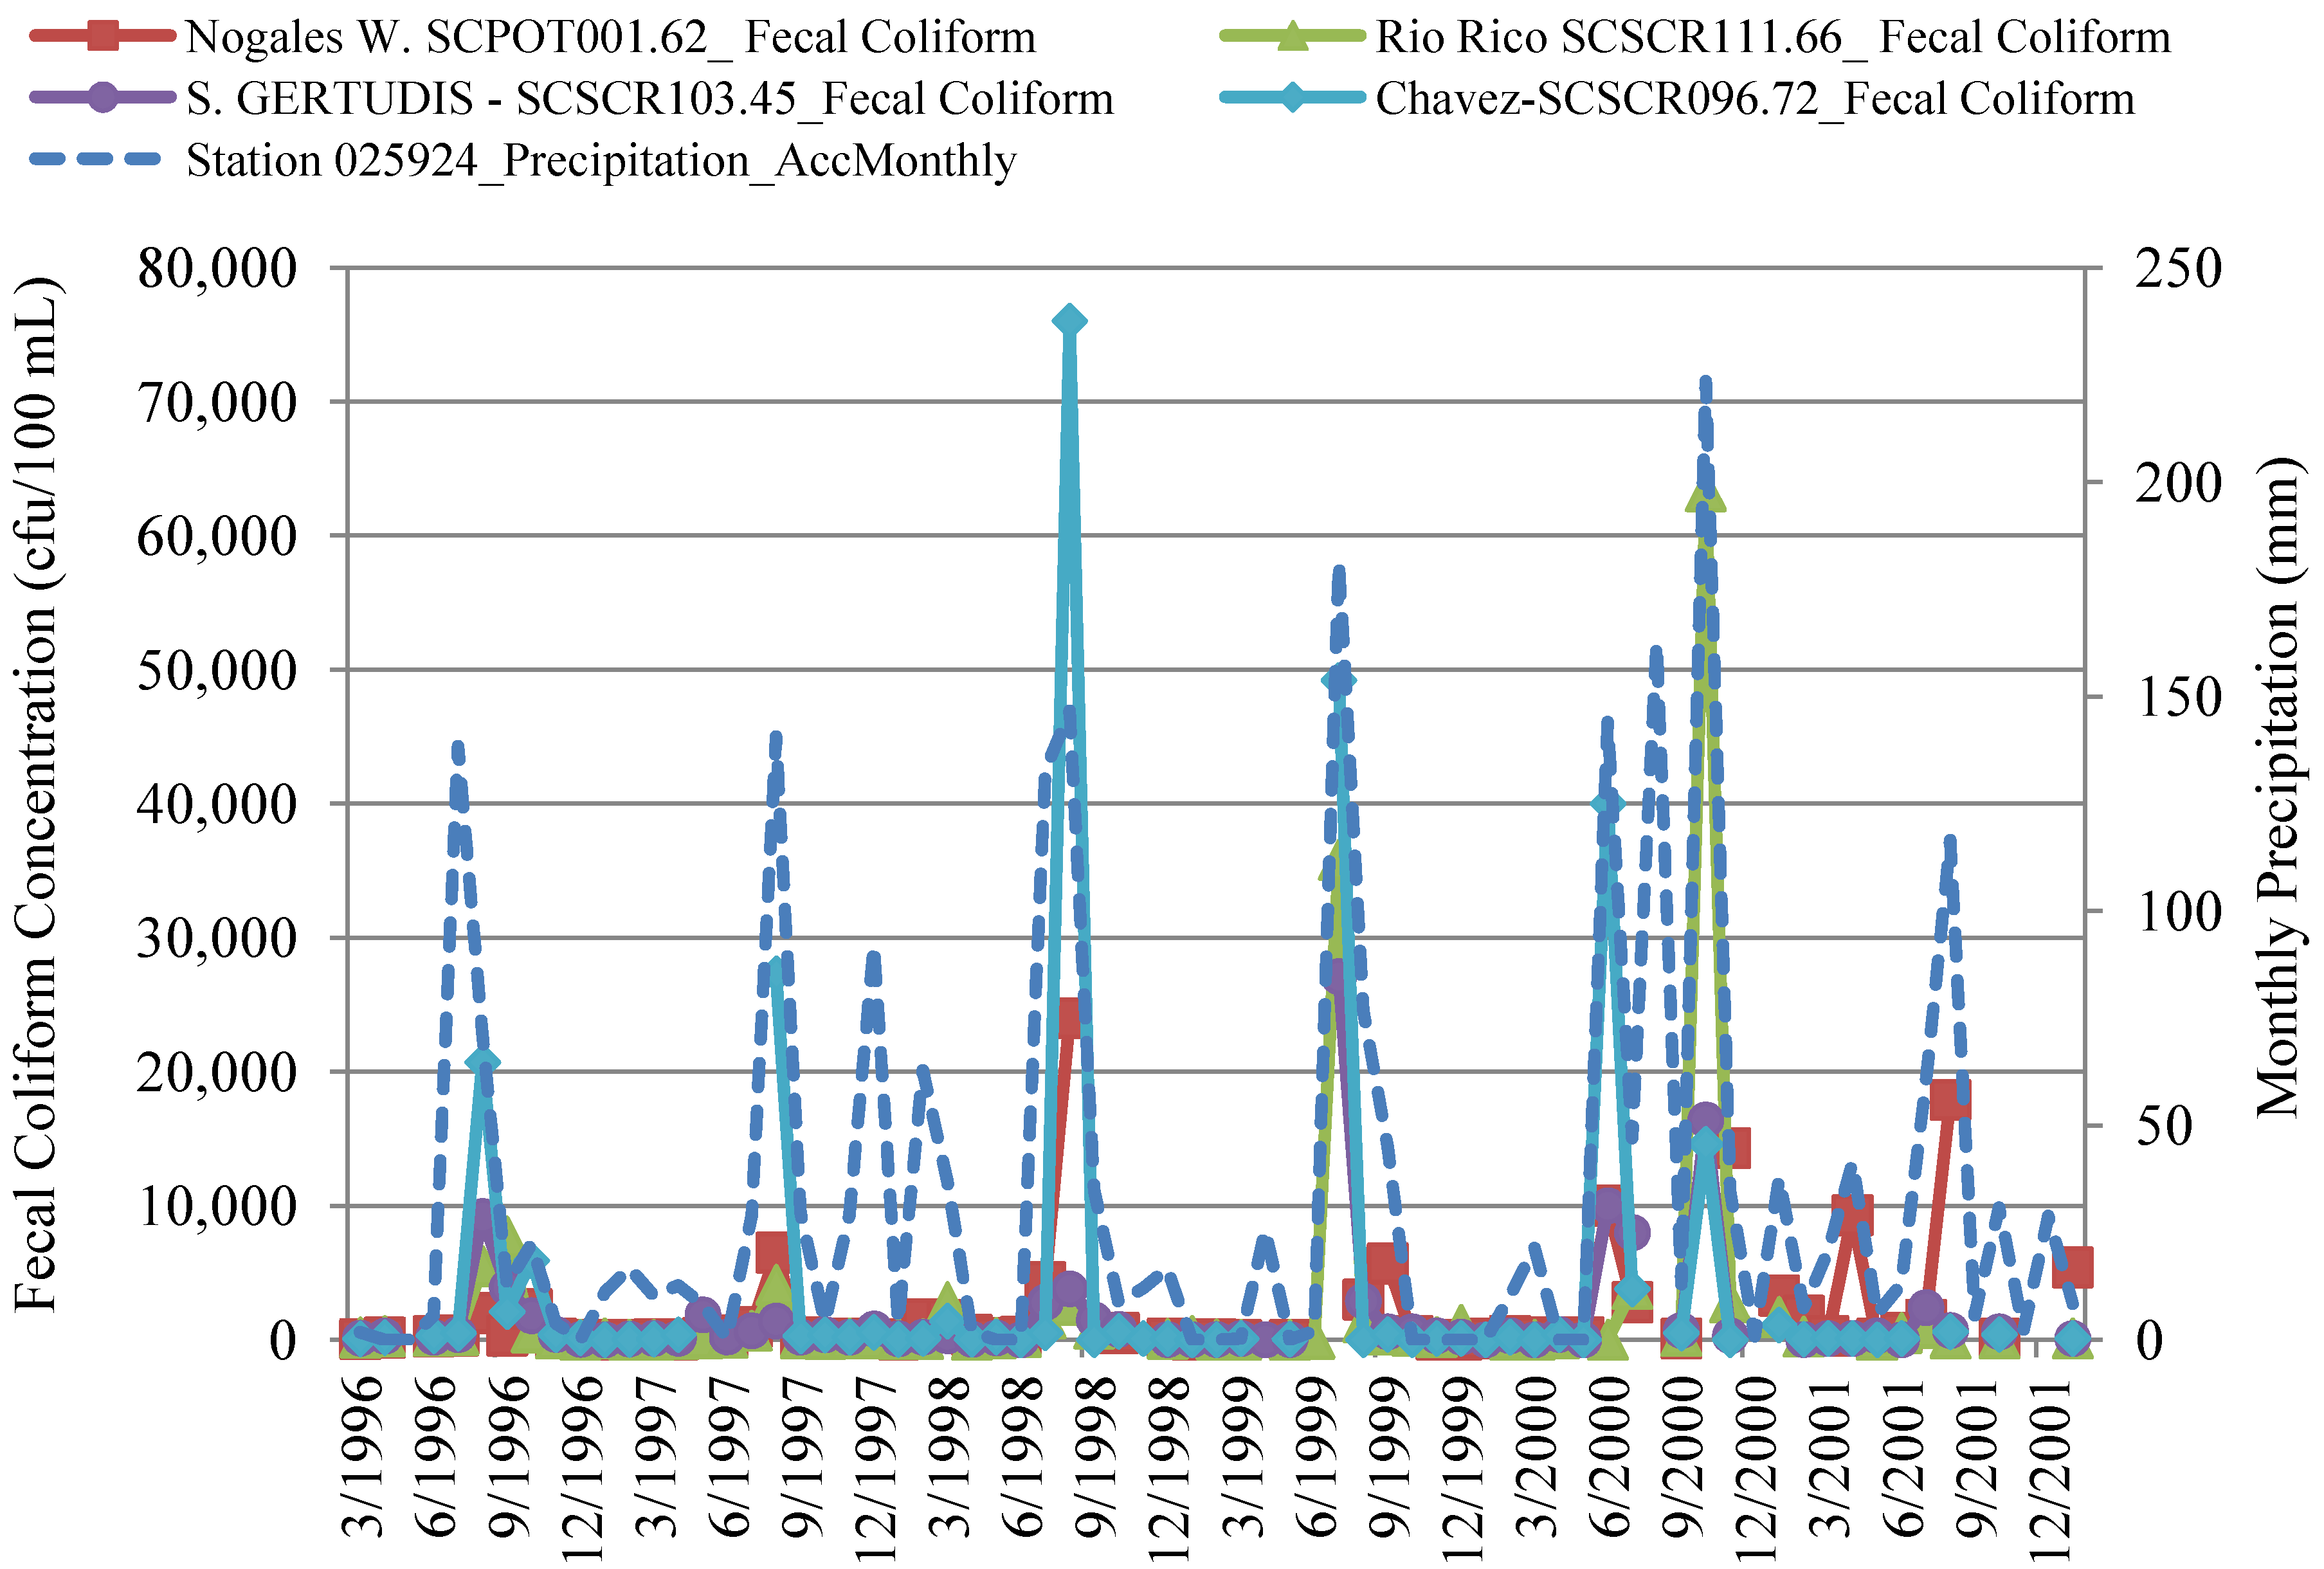
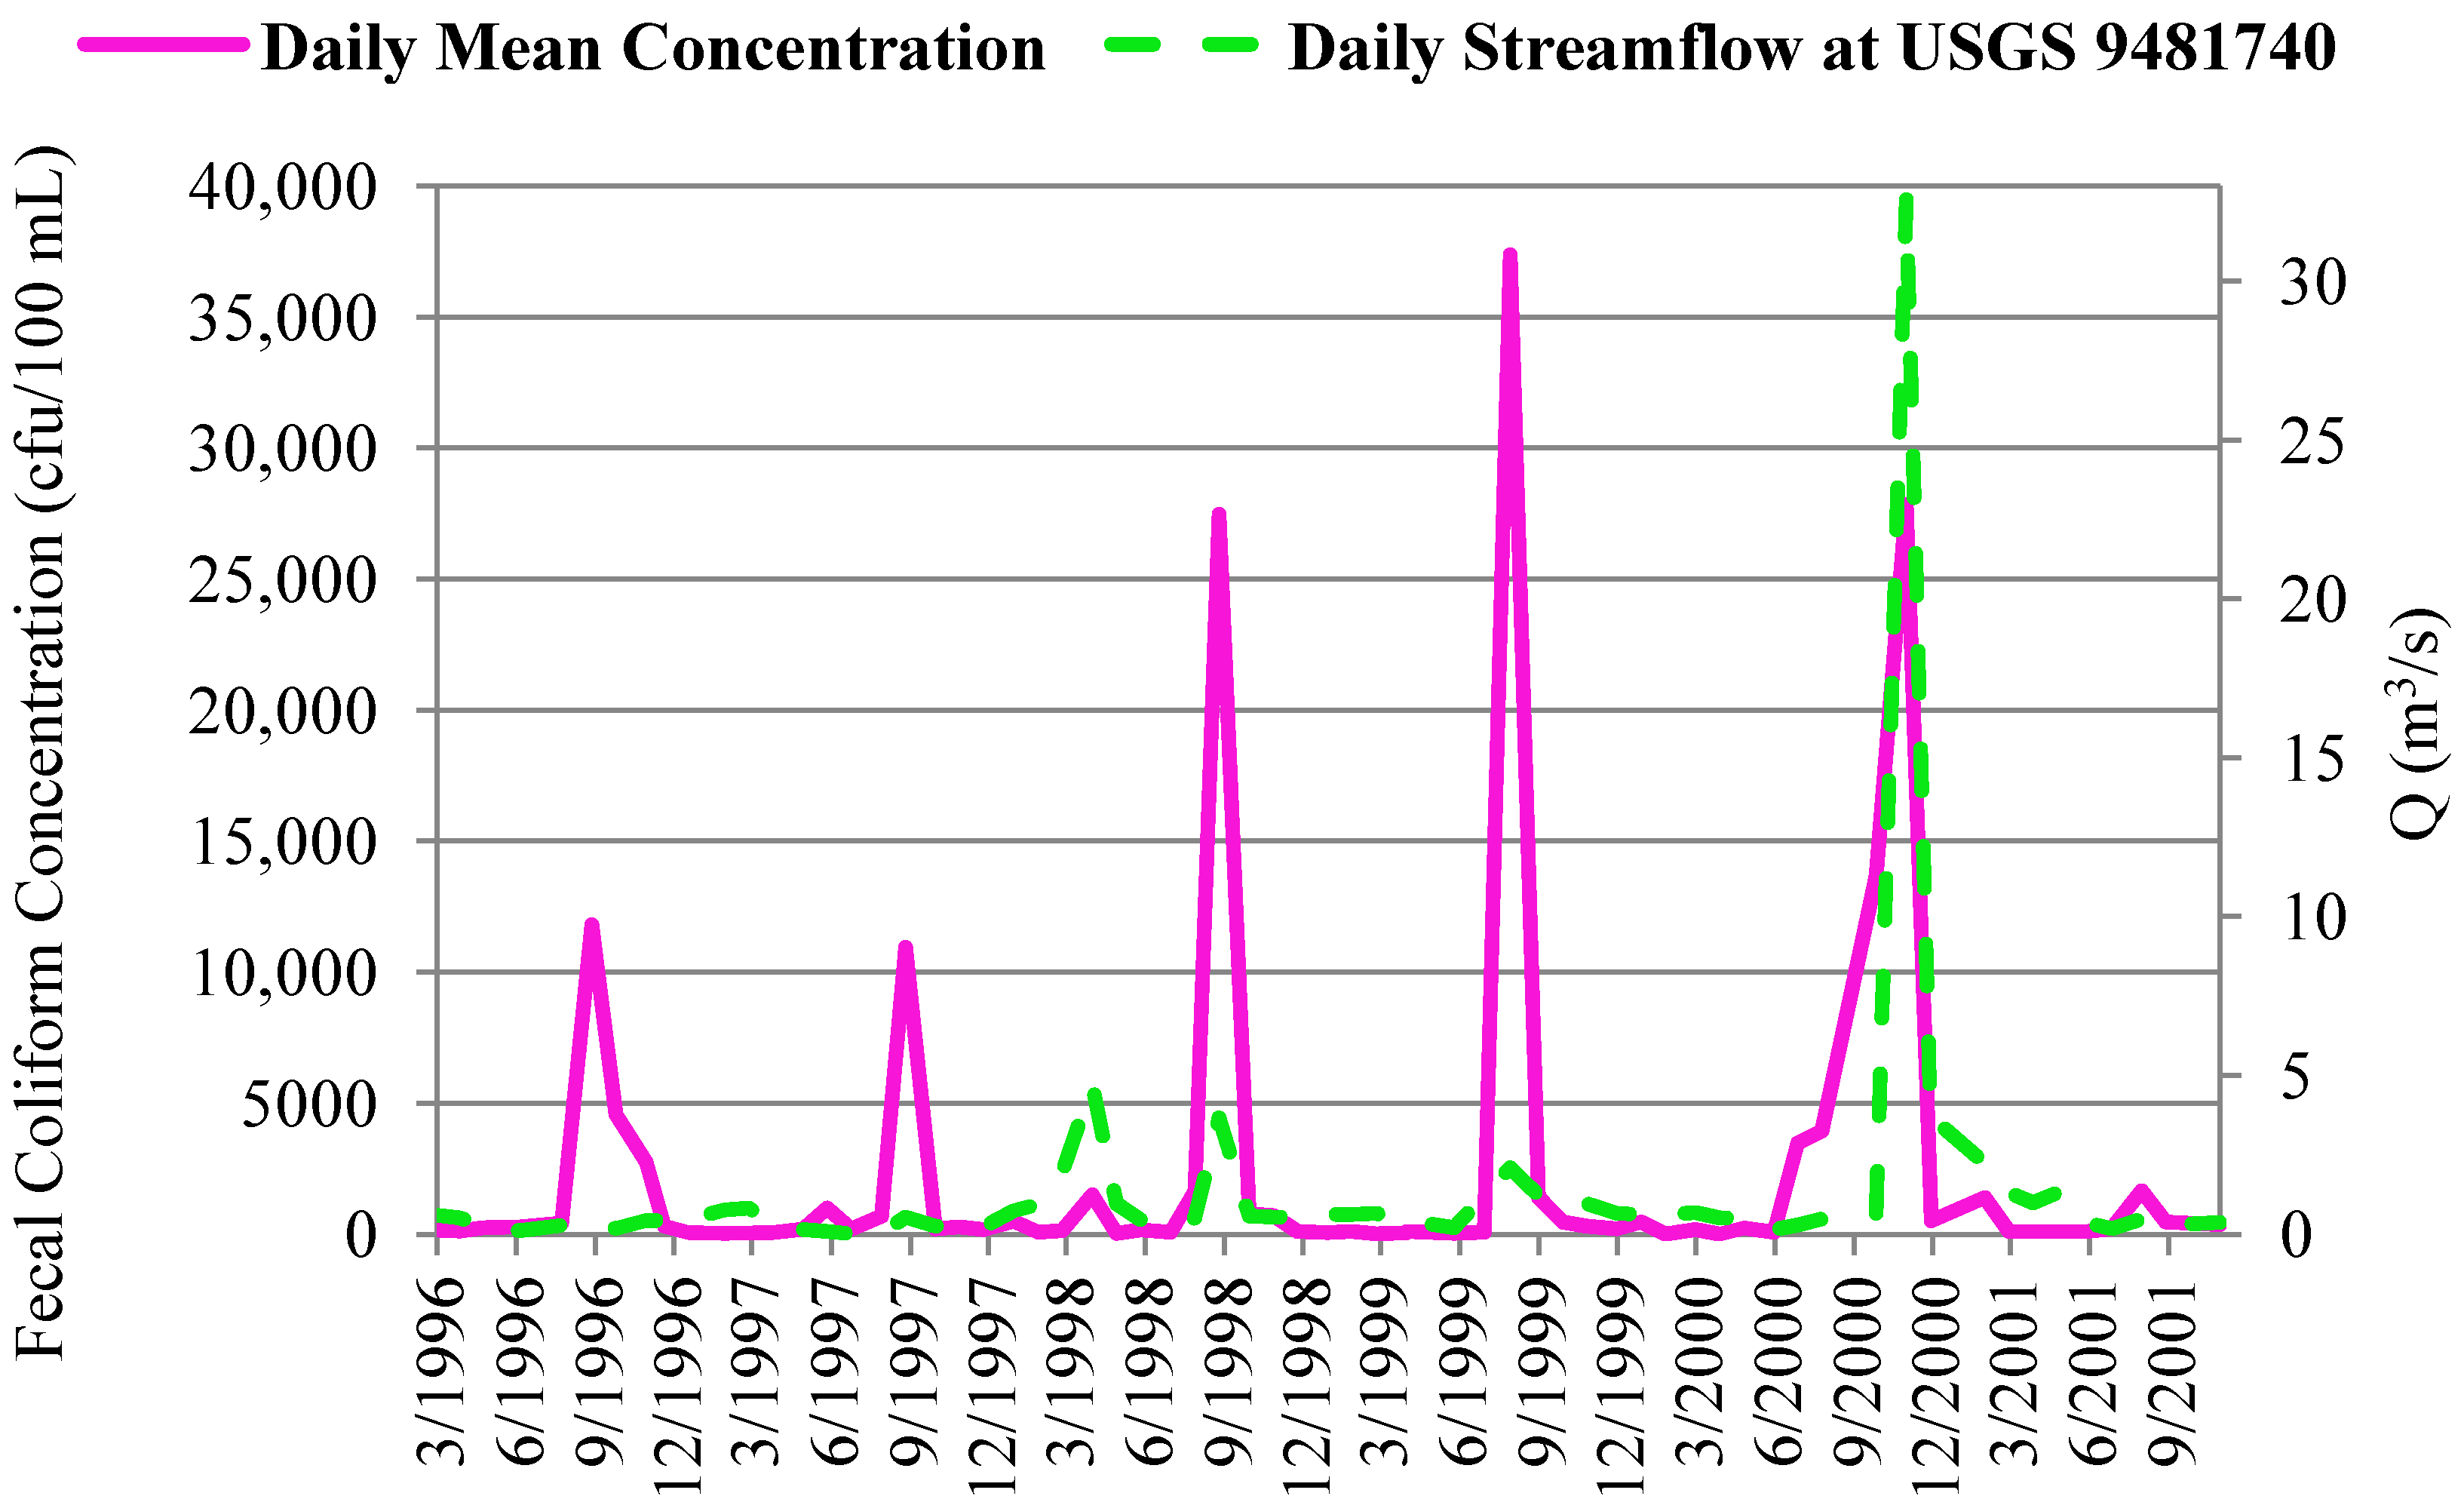
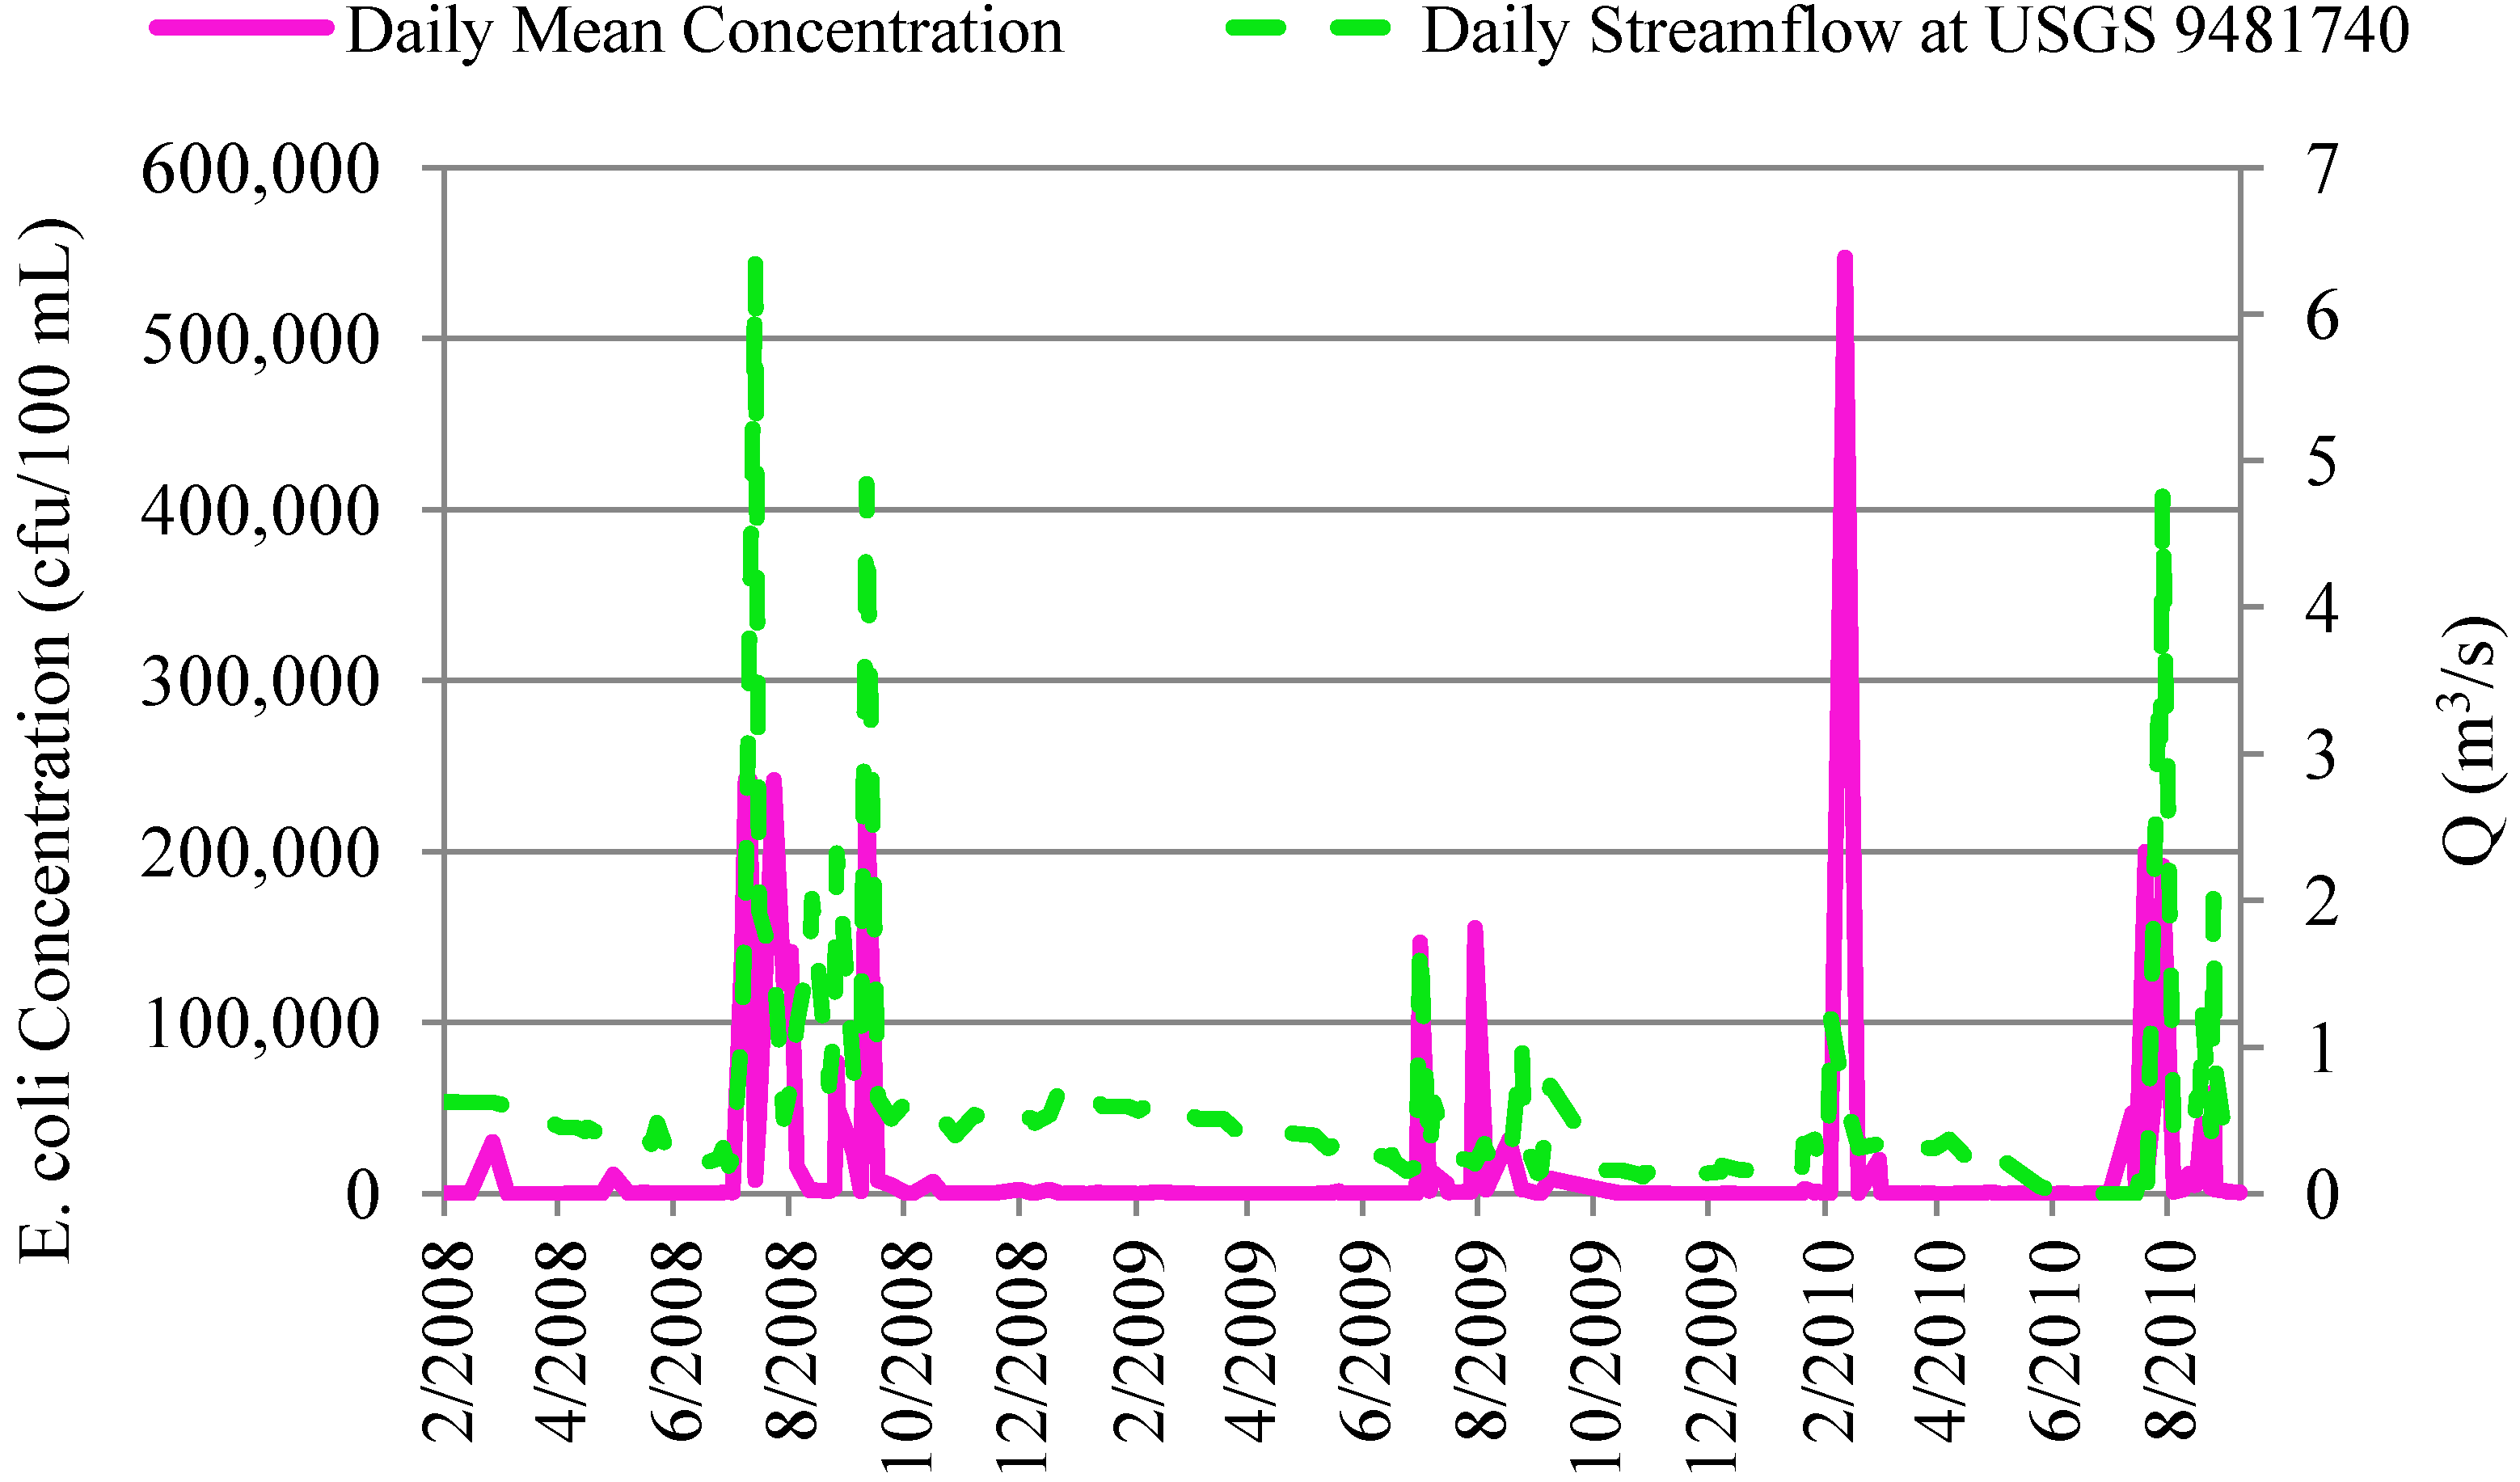
4.2.2. Correlation of In-Stream Fecal Coliform and E. coli Concentrations to Streamflow and Precipitation

Daily streamflow and baseflow vary significantly in this watershed and are often near zero during low flow periods. For USGS station 09481740 near Tubac, Arizona, average baseflow is approximately 0.40 m3/s and between September 1995 to 2012, a zero average daily flow was recorded on 152 days predominantly in the months of June and July. Further upstream at USGS station 09480500 near Nogales, Arizona average baseflow is approximately 0.02 m3/s and experienced zero average daily flow on 4052 days and in all months of the year. Based on the sampling location and baseflow estimates, 25% to 60% of the fecal coliform samples which exceeded the 800 cfu/100 mL standard in Table 4 and zero to 12% of the E. coli samples which exceeded the 235 cfu/100 mL standard in Table 5 were collected during periods of above average baseflow. From this comparison, exceedances typically occur during average baseflow or lower than average streamflow; however, approximately 85% of all in-stream samples were collected during less than average streamflow conditions.
In-stream fecal coliform and E. coli concentrations fluctuate based on seasonal streamflow and precipitation trends with the greatest concentrations experienced predominantly during the summer months. In-stream fecal coliform and E. coli concentrations generally increase in response to increased streamflow as shown in Figure 2, Figure 3, respectively. The range of the raw data set is 0 to 76,000 cfu/100 mL for fecal coliform sampled between March 1996 and August 2001 and 0 to 241,920 cfu/100 mL for E. coli sampled between February 2008 and September 2010. The daily mean in-stream fecal coliform concentrations for all locations collected on the same day was compared to the average daily streamflow from USGS gage station 9481740 corresponding to that sample date, as shown graphically in Figure 2. The range of the mean data included in Figure 2 is 0 to 37,366 cfu/100 mL and includes the same locations listed in Table 4. In Figure 3, the daily mean in-stream E. coli concentration for all E. coli sampling locations was compared to the average daily streamflow recorded on that date from USGS gage station 9481740, which is located in the mid to southern portion of the watershed near Tubac, Arizona. The range of the mean data included in Figure 3 is 28 to 118,470 cfu/100 mL, and no month had zero E. coli concentration simultaneously at all locations. The sampling location data included in Figure 3 are those listed in Table 5 and additional E. coli data from Nogales Wash SCNGW004.87 and Nogales Wash at Johnsons Ranch SCSCR128.54 (these locations were not included in Table 5 due to limited sample availability). No samples were collected on days of zero streamflow thus daily streamflow shown in the below figures does not reflect the periods of no flow conditions.
In Figure 4, the in-stream fecal coliform concentrations from multiple locations are graphically compared to monthly accumulated rainfall for the years 1996 to 2001. Weather Station 025924 (Nogales 6N) had the most complete record of precipitation data for comparison to the fecal coliform data. In-stream fecal coliform loads fluctuate in response to precipitation amount. An overall increase in fecal coliform concentrations occurs during increased periods of precipitation.
Figure 2. In-stream fecal coliform concentrations along the Upper Santa Cruz River compared to average daily streamflow at USGS station 9481740 from March 1996 to August 2001. The Arizona WQ standard for fecal coliforms is 800 cfu/100 mL for a single sample maximum.
Water 05 00243 g002
Figure 3. Mean in-stream E. coli concentrations in the Upper Santa Cruz River compared to daily streamflow at USGS station 9481740 from February 2008 to September 2010. The Arizona WQ standard for E. coli is 235 cfu/100 mL (FBC) and 575 cfu/100 mL (PBC) for a single sample maximum.
Water 05 00243 g003
Figure 4. Impact of monthly accumulated rainfall on in-stream fecal coliform concentrations from March 1996 to December 2001.
Water 05 00243 g004
The strength of the positive correlation observed between the response of in-stream E. coli concentrations and streamflow (Figure 3); and in-stream fecal coliform concentrations and streamflow (Figure 2)/precipitation (Figure 4) was tested using linear regression. The resulting R-square (R2) values were 0.31 and 0.32 for correlation of E. coli to daily streamflow and fecal coliform to daily streamflow, respectively. The R2 value for fecal coliform concentration correlation to monthly accumulated rainfall was 0.43. While a correlation exists between streamflow and FIB concentrations, the relationship is convoluted by other factors. Since many hydrological and ecological processes [36] would affect the relationship, the degree of correlation is dependent on factors such as antecedent soil moisture conditions, seasonal changes, sediment loads, proximity of point and nonpoint runoff sources, microbial life cycles.

4.3. In-Stream Concentrations versus WWTP Effluent Concentrations
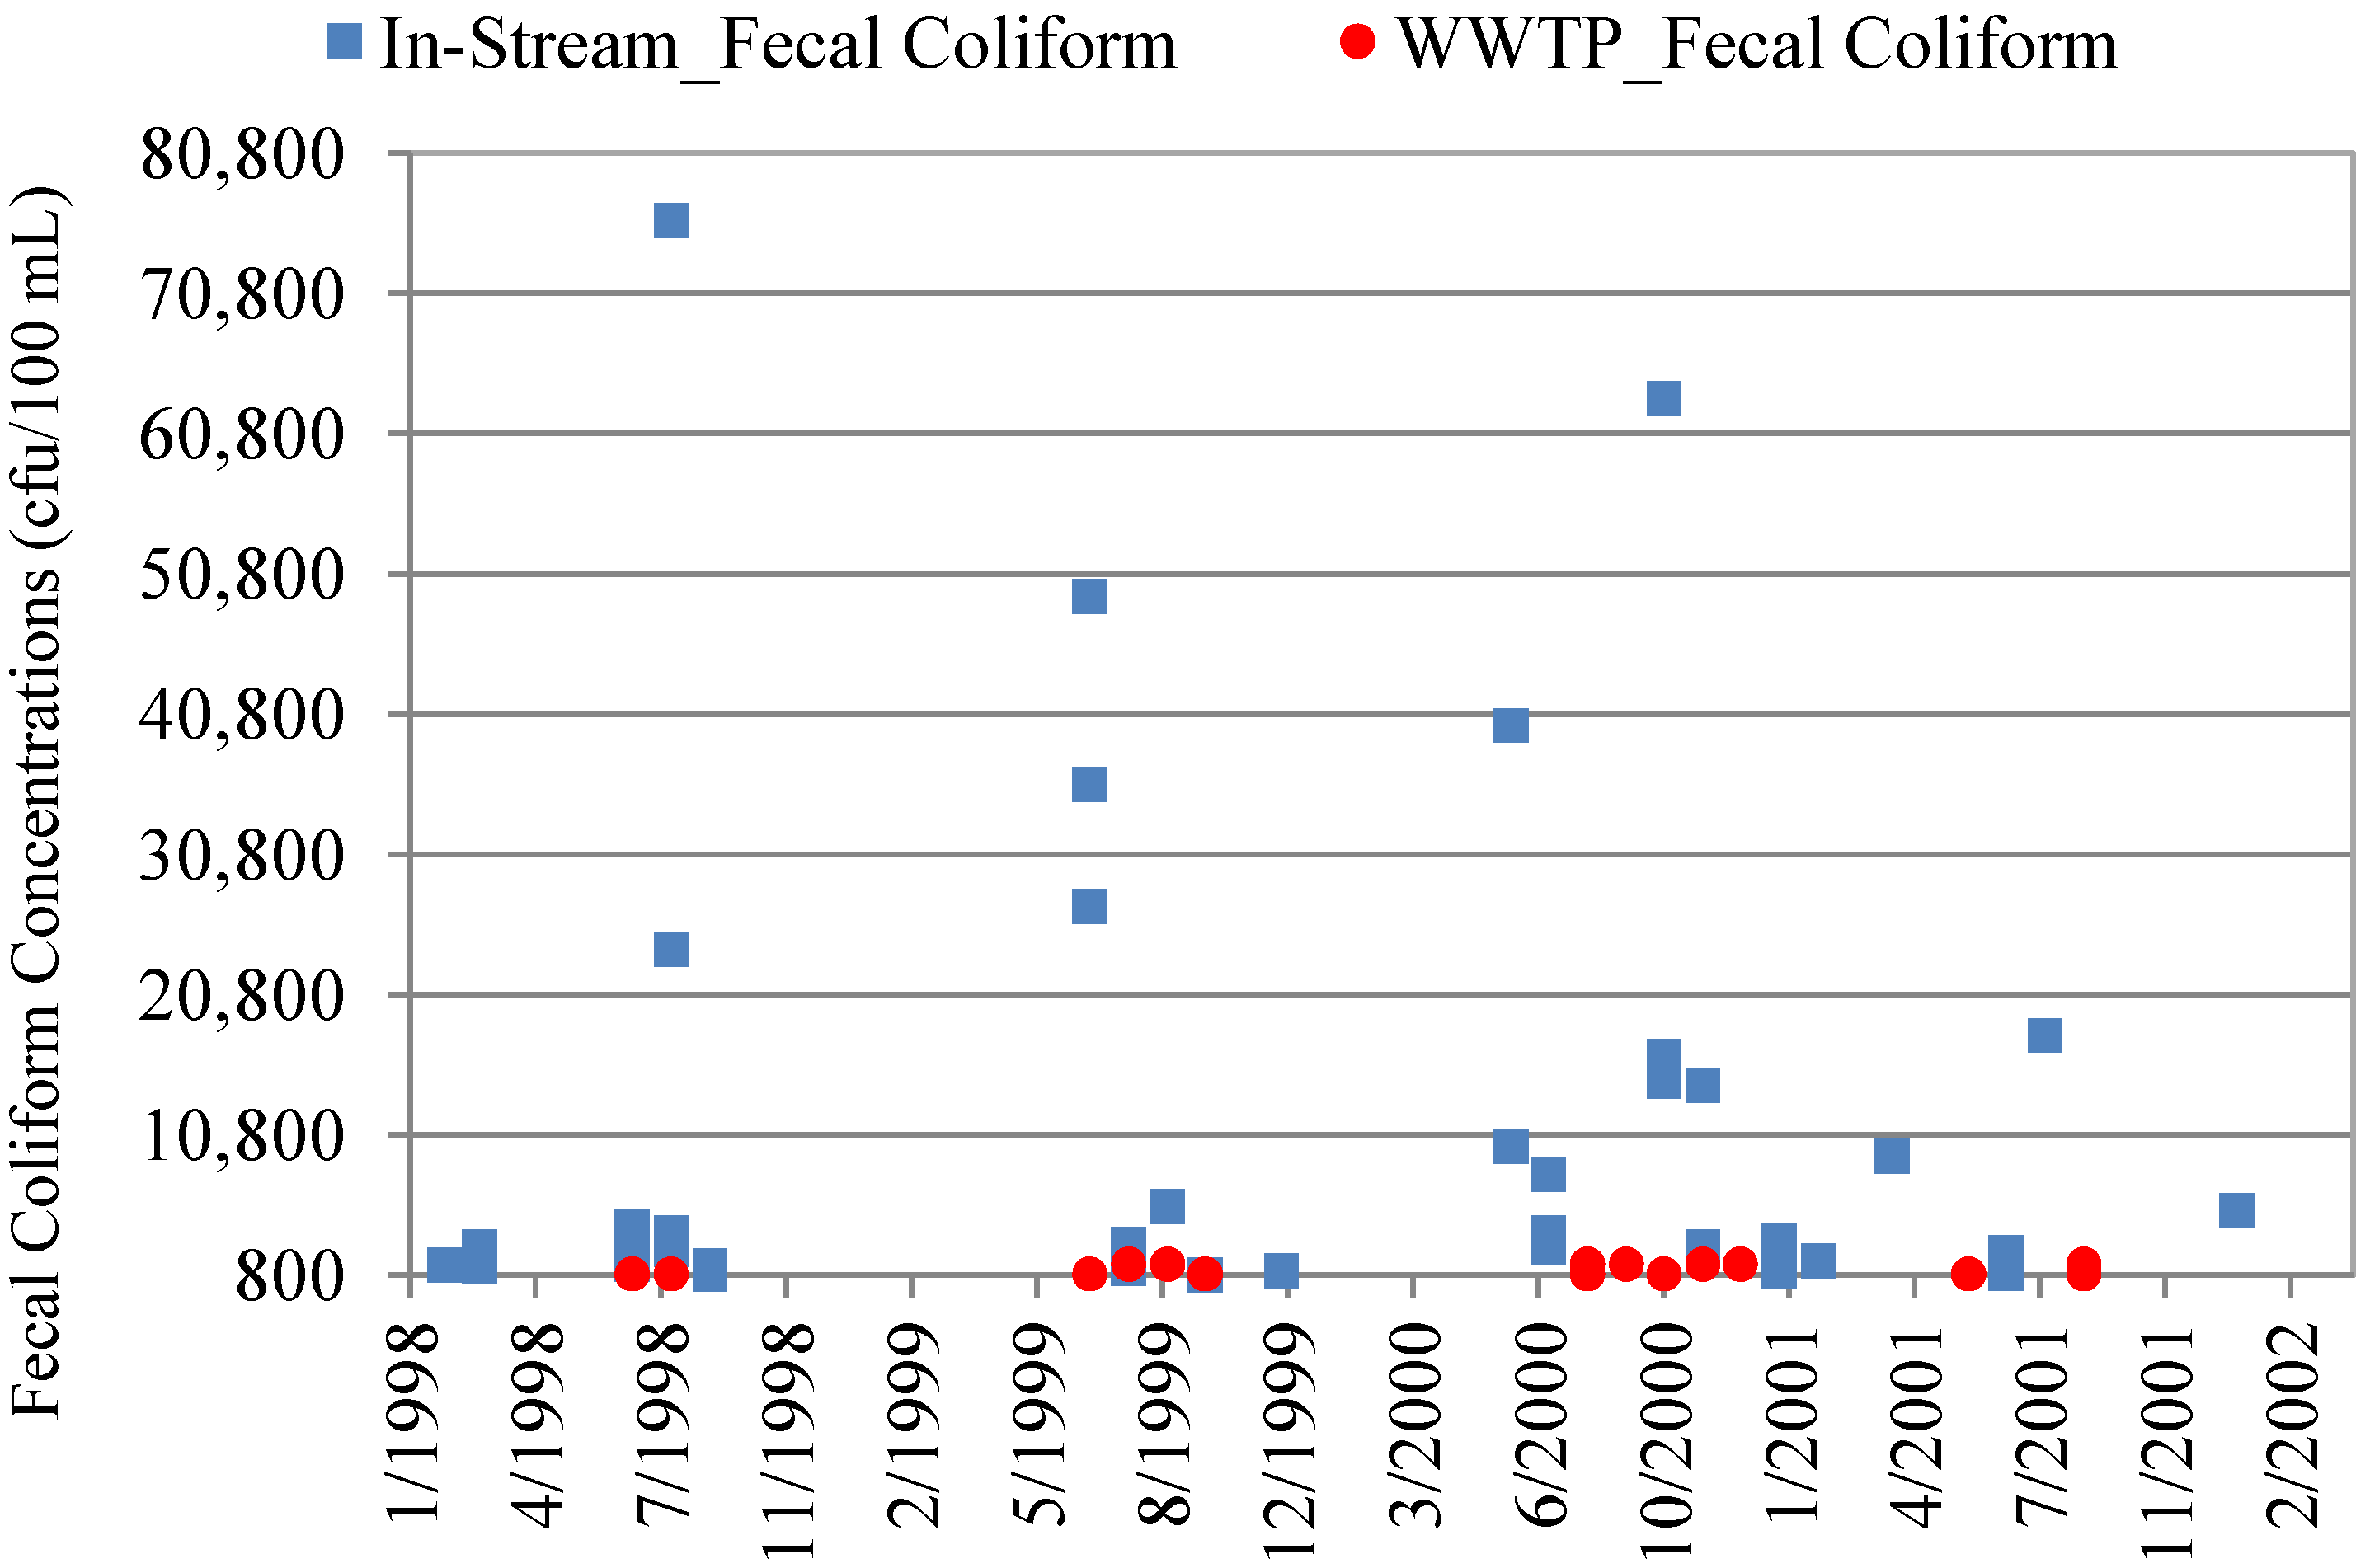
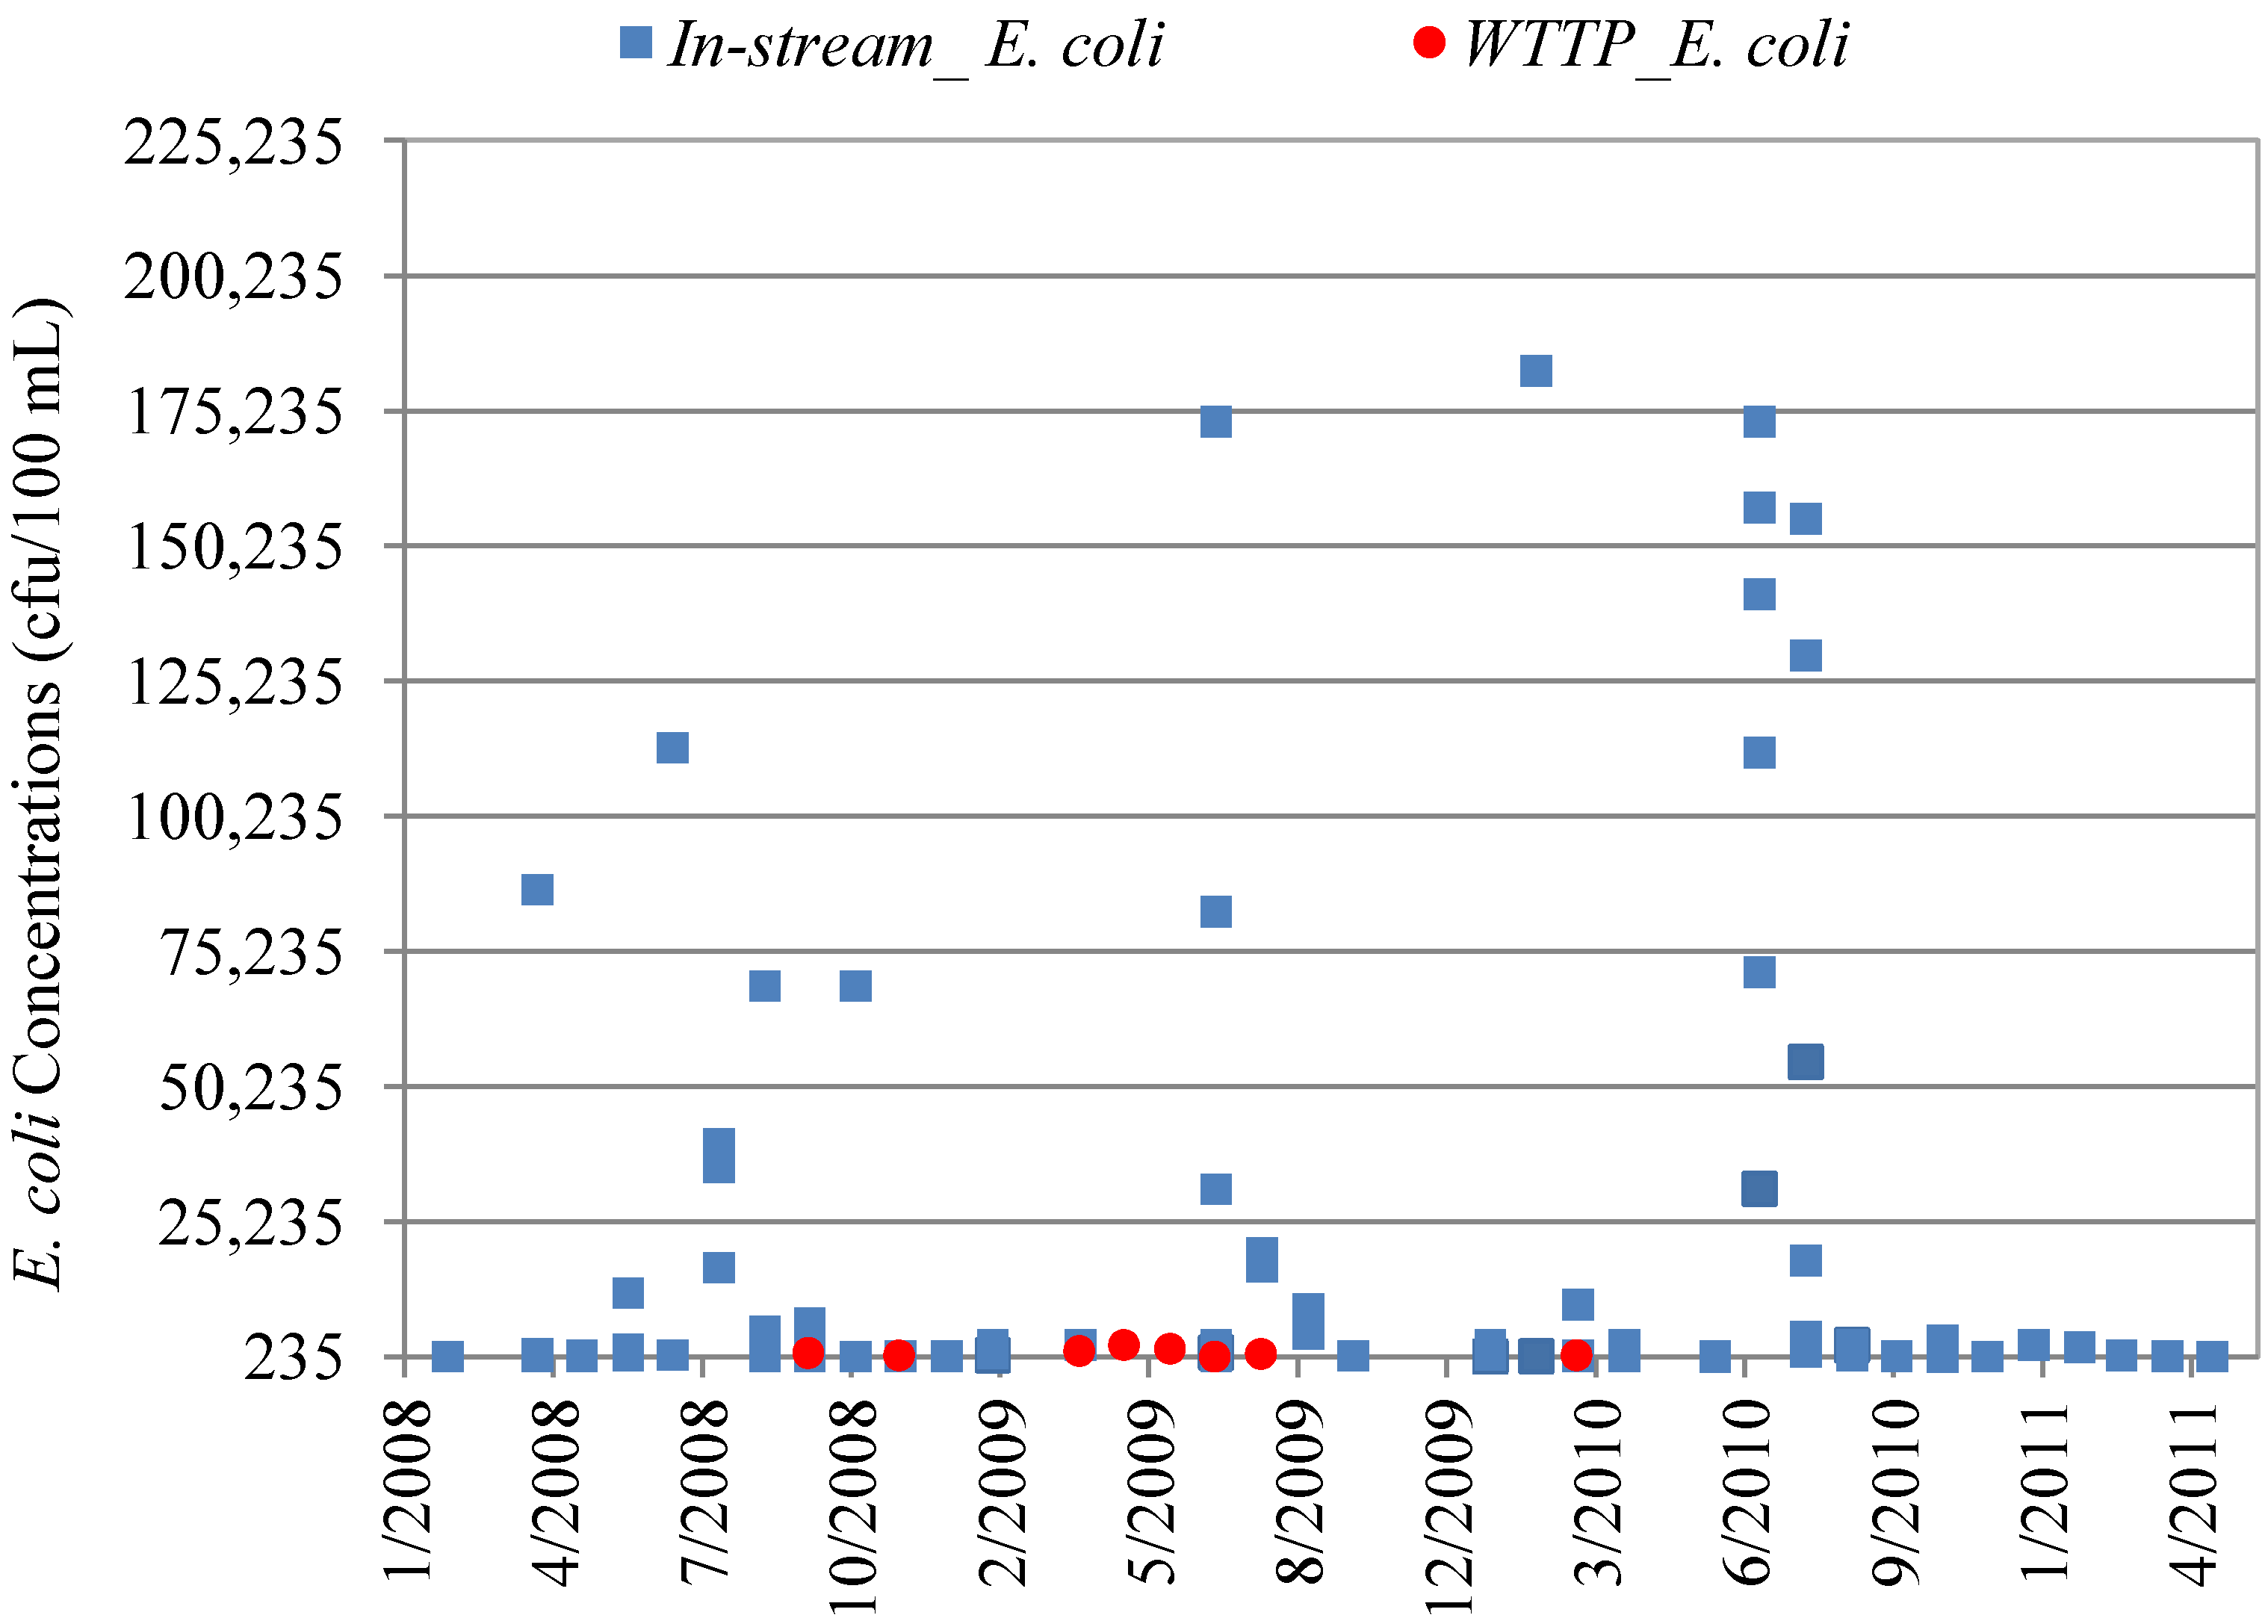
The in-stream fecal coliform concentrations range from <1.0 to 2519 and the WTTP effluent fecal coliform DMR maximums range from 3 to 1600; in-stream E. coli concentrations range from <1.0 to 139,000 and WTTP effluent E. coli concentrations range from < 1.0 to 2400. As shown in Figure 5, Figure 6, the nonpoint source in-stream fecal coliform and E. coli concentrations are compared to the maximum concentration reported in each point source WWTP DMR period. The maximum concentration was used because it represents the “worse case” situation during that period of measure. In-stream sampling locations have mean concentrations that are significantly different than the WWTP effluent maximum DMR grab sample values at the 0.05 alpha level of significance as shown in Table 6. Figure 5, Figure 6 and the statistical summary in Table 6 show that the in-stream fecal coliform and E. coli concentrations are significantly greater than the concentrations found in WTTP effluent. Regardless of sample location or type, a high degree of variability occurs in all data sets. Table 6 also shows the range of the data in each category for the entire period of record.
Figure 5. Comparison of fecal coliform maximum WWTP effluent discharge concentrations to in-stream sampling locations. Only values exceeding the 800 cfu/100 mL standard are shown.
Water 05 00243 g005
Figure 6. Comparison of E. coli from WWTP effluent discharge to in-stream sampling locations. Only values exceeding the 235 cfu/100 mL standard are shown.
Water 05 00243 g006
Table 6. Statistical summary of in-stream and WWTP effluent fecal coliform and E. coli concentrations. All units are cfu/100 mL.
Data SetMean Concentration (cfu/100 mL)Minimum ConcentrationMaximum Concentrationp-value *
WWTP Effluent E. coli330<1.024000.000002
In-stream E. coli1,745<1.0139,000
WWTP Effluent Fecal Coliform (DMR Maximums **)28531,6000.0002
In-stream Fecal Coliform2,519<1.0139,000
Notes: * statistical test used: two tailed T-test, unequal variance; ** Maximum values reported from each DMR period reflect “worse case” concentrations.

5. Discussion

As this study verifies, significant surface water impairment is a result of nonpoint source pollution in Arizona. In-stream concentrations of fecal coliform and E. coli are significantly greater than those concentrations discharged in the treated effluent from WWTPs, as shown in Figure 5, Figure 6. Nonpoint sources such as faulty septic systems, agricultural and urban runoff, unregulated discharges to stream washes, land use practices, and in-stream fate and transport processes contribute a significant portion of the pollution load to the Santa Cruz River; the statistical data reported in Table 6 supports this finding. According to the ADEQ 2006/2008 statewide summary report, point source contributions to stream pollution impacted 46 miles of streams while nonpoint sources contributed to pollution to 3245 miles of the statewide stream network [20]. The data presented in this study indicate all sampling locations assessed in the Upper Santa Cruz watershed, both point and nonpoint, exceed the water quality criteria established by Arizona to protect human and aquatic health. DMRs submitted to regulatory agencies have several occurrences of FIB concentrations in the treated effluent exceeding the established water quality criteria. Depending on the specifics of the facility permit and wastewater class, these exceedances may be acceptable in some cases.
Studies have shown that FIB survival in surface waters varies from hours to days or even months if protected by sediments which make identifying the source of the FIB concentrations difficult [37,38]. The decay rate of FIB in surface water is a function of many ecological influences; therefore, water quality management, best management plan (BMP) development, watershed modeling, and risk assessment practices need to incorporate better methods as to how FIB interact with the environment, and furthermore, how well FIB accurately model true pathogenic concentrations in the watershed [16,17]. Researchers and regulators continuously question which pathogen indicators are appropriate to determine safe exposure levels in recreational waters. USEPA has approved several detection tests for evaluating FIB in water samples, and comparisons of these methods indicate high variability in sample results [17]. Field et al. [19] evaluates the application of fecal source tracking as a better method for human health risk assessments and managing water quality compared to current reliance on FIB criteria. Litton et al. [39] further identifies fecal markers and source tracking tools which could vastly change the approach to FIB monitoring and regulation. These studies and the one presented here provide data on FIB concentrations in selected streams with respect to concentration, relationship to recreational water-quality standards, and influence of environmental factors such as streamflow, rainfall, sediment, and runoff [36]. Findings indicate that FIB concentrations are highly variable, especially along urban streams even in the absence of significant rainfall. Though FIB generally increase with streamflow and precipitation events as shown in Figure 2, Figure 3, Figure 4, there are occurrences of peaks in FIB concentrations during baseflow conditions.
In Figure 2, Figure 3, Figure 4, it is important to provide insight into the data to reach sound conclusions. Overall, trends and correlations show that increased fecal coliform and E. coli concentration generally correspond to increased streamflow from rainfall and concentrations are generally higher in the summer months as shown in other similar studies [36]. However, there were instances of increased fecal coliform or E. coli concentrations observed during months of little precipitation or streamflow. The data also show that in months of little to no streamflow, several locations were noted as “no sample collected due to no-flow conditions” on the day of sampling. Opportunities for consistent sample collection are limited due to the ephemeral nature of the streamflow, especially at tributary locations. It is likely that in-stream sample collection was done during periods of higher streamflow than average during little or zero baseflow conditions; however, most sample collection was done during low flow conditions and not as a result of precipitation events. As shown in Figure 4, peaks in fecal coliform concentrations positively correlate (R2 = 0.43) to months of high rainfall. The data compiled for this study provides insight into the water quality conditions related to pathogen indicators in the watershed; however, the underlying conditions, which could affect the grab sample concentrations—such as the sample collection and analysis method, agricultural activity, grazing activity, seasonal hydrology, and stream ecology—were not always clear in this assessment. The variation of the analysis methods and the FIB of interest disallow direct comparison of each sampling location for the entirety of the sampling record and may over or under estimate the actual value.
Efforts to mitigate nonpoint sources are mostly voluntary yet very active across the nation. Watershed managers encourage stakeholders to participate in watershed management groups, volunteer monitoring programs, BMP development and implementation, and education. Examples of successful BMPs for FIB mitigation in effluent dominated systems include engineered wetlands, bioretention areas, and filter strips [40,41]. In addition, improvements in watershed modeling capabilities allow better fate and transport for remediation studies and TMDL development [42,43]. In Arizona, the ADEQ adopted a suspended sediment concentration (SSC) standard of 80 mg/L in 2002 to replace its turbidity standard [20] which is closely linked to FIB concentrations released into the surface waters. Suspended sediment reduction is a priority in many watersheds in order to enhance water quality and to protect fish and aquatic communities. Hindering this progress is the lack of monitoring data in many watersheds which delays efforts to develop, implement, and assess the effectiveness of watershed control strategies such as the SSC standard.

6. Conclusions and Recommendations

Like much of the southwest, Arizona uses recycled waters for groundwater and surface water recharge to balance the supply and demand of a growing population. However, continuous monitoring of the fate and transport of FIB and their associated pathogens is an area needing further assessment. To fully assess the water quality in the Upper Santa Cruz watershed, a detailed analysis is needed which allows for FIB monitoring, source tracking, and reduction of nonpoint sources of pollution. This study assesses the influence of WWTP discharges and nonpoint sources on the indicator bacteria concentrations in the Santa Cruz River and surrounding tributaries. The results of this assessment find that the Upper Santa Cruz watershed is impaired with fecal coliform and E. coli at levels, which exceed the established water quality criteria in Arizona. This assessment indicates that a risk to human health exists especially during the summer months when concentration trends increase and water contact is most likely to occur. Fecal coliform and E. coli levels from the WWTP effluent assessed in this study are significantly lower than the in-stream samples assessed which indicates that nonpoint sources play a significant role in the water quality conditions. Regardless of the sample type (effluent or in-stream), all sampled locations with available data exceeded the water quality criteria for fecal coliform and E. coli indicators. Water quality issues in the Upper Santa Cruz watershed are confounded by the quality of waters flowing from urbanized areas of Mexico with less regulated infrastructure to handle wastewater treatment.
Using natural vegetation filters, stabilization of stream banks, improvement of riparian zones, and urban runoff reduction in order to reduce erosion and sedimentation, are effective watershed control strategies. Updating septic systems is another method of source reduction of potential pathogens to the aquatic environment. Sediment is linked to pollutants such as pathogens and nutrients, and suspended sediment reduction should be a priority in this watershed. Management practices aimed to reduce urban runoff and thus sediment could markedly reduce nonpoint sources of FIB in the stream network. Though likely a more expensive option, infrastructure improvements that eliminate faulty septic systems and combined sewer overflows would also reduce FIB concentrations released into the stream system. Advanced treatment of wastewater effluent and industrial discharges is another option to consider for reducing FIB concentrations within the watershed; the state of the art wastewater treatment at the Nogales plant is a good example of the current and ongoing efforts to achieve such objectives in Arizona. These recommendations could only be truly beneficial to the managers and regulators once TMDL values are established for impaired waterways and more data has been collected to assess how pathogens cycle through the entire watershed. As urbanization and population growth continues in the Santa Cruz watershed, water regulators, managers, and development planners will have to assess the impact of effluent-dominated stream sections in order to meet not only water quantity objectives, but also to maintain water quality standards.

Acknowledgments

The authors acknowledge and thank Claire Zugmeyer, ecological research specialist with the Sonoran Institute, for compiling and sharing the data and the following groups for collection of the in-stream sampling data used in this assessment: National Park Service at Tumacácori, National Historical Park; Friends of the Santa Cruz River, Riverwatch program; U.S. Geological Survey; National Park Service Sonoran Desert Network; and Arizona Department of Environmental Quality. The authors are also grateful for Juanita Francis-Begay who provided many valuable comments to improve the manuscript. Although this work was reviewed by U.S. EPA and approved for publication, it may not necessarily reflect official Agency policy.

References

  1. Fayer, R.; Speer, C.A.; Dubey, J.P. Cryptosporidium and Cryptosporidiosis, 2nd ed; CRC Press: Boca Raton, FL, USA, 1997; pp. 1–42. [Google Scholar]
  2. Gaffield, S.J.; Goo, R.L.; Richards, L.A.; Jackson, R.J. Public health effects of inadequately managed stormwater runoff. Am. J. Public Health 2003, 93, 1527–1533. [Google Scholar] [CrossRef]
  3. Asano, T.; Levine, A.D. Wastewater reclamation, recycling and reuse: Past, present, and future. Water Sci. Technol. 1996, 33, 1–14. [Google Scholar]
  4. Asano, T.; Cotruvo, J.A. Groundwater recharge with reclaimed municipal wastewater: Health and regulatory considerations. Water Res. 2004, 38, 1941–1951. [Google Scholar] [CrossRef]
  5. Arizona Department of Water Resources (ADWR) Web Page. Recharge. Available online: http://www.azwater.gov/AzDWR/WaterManagement/Recharge/default.htm (accessed on 6 July 2011).
  6. Schladweiler, J. Tracking Down the Roots of Our Sanitary Sewers. Available online: https://www.sewerhistory.org (accessed on 8 August 2011).
  7. Simon, T. Reuse of effluent water—Benefits and risks. Agric. Water Manag. 2006, 80, 147–159. [Google Scholar] [CrossRef]
  8. Brooks, B.; Riley, T.; Taylor, R. Water quality of effluent-dominated ecosystems: Ecotoxicological, hydrological, and management consideration. Hydrobiologia 2006, 556, 365–379. [Google Scholar] [CrossRef]
  9. Gannon, J.; Busse, M. E. coli and enterococci levels in urban stormwater, river water and chlorinated treatment plant effluent. Water Res. 1989, 23, 1167–1176. [Google Scholar] [CrossRef]
  10. U.S. Environmental Protection Agency (USEPA) Web Page. 5.11 Fecal Bacteria. Available online: http://water.epa.gov/type/rsl/monitoring/vms511.cfm (accessed on 26 July 2011).
  11. U.S. Environmental Protection Agency (USEPA), Review of Published Studies to Characterize Relative Risks From Different Sources of Fecal Contamination in Recreational Water; EPA 822-R-09-001; U.S. Environmental Protection Agency: Washington, DC, USA, 2009.
  12. U.S. Environmental Protection Agency (USEPA), Ambient Water Quality Criteria for Bacteria—1986; EPA 440/5-84-002; U.S. Environmental Protection Agency: Washington, DC, USA, 1986.
  13. U.S. Environmental Protection Agency (USEPA), Test Methods for Escherichia coli and enterococci in Water by the Membrane Filter Procedure (Method #1103.1); EPA 600/4-85-076; U.S. Environmental Protection Agency, Environmental Monitoring and Support Laboratory: Cincinatti, OH, USA, 1985.
  14. U.S. Environmental Protection Agency (USEPA), Bacterial Water Quality Standards for Recreational Waters (Freshwater and Marine Waters); EPA-823-R-03-008; U.S. Environmental Protection Agency: Washington, DC, USA, 2003.
  15. American Public Health Association (APHA), Standard Methods for the Examination of Water and Wastewater, 18th edAmerican Public Health Association: Washington, DC, USA, 1992.
  16. Gronewold, A.D.; Borsuk, M.E.; Wolpert, R.L.; Reckhow, K.H. An assessment of fecal indicator bacteria-based water quality standards. Environ. Sci. Technol. 2008, 42, 4676–4682. [Google Scholar] [CrossRef]
  17. Harwood, V.J.; Levine, A.D.; Scott, T.M.; Chivukula, V.; Lukasik, J.; Farrah, S.R.; Rose, J.B. Validity of the indicator organism paradigm for pathogen reduction in reclaimed water and public health protection. Appl. Environ. Microbiol. 2005, 71, 3163–3170. [Google Scholar]
  18. Leclerc, H.; Mossel, D.A.A.; Edberg, S.C.; Struijk, C.B. Advances in the bacteriology of the Coliform Group: Their suitability as markers of microbial water safety. Annu. Rev. Microbiol. 2001, 55, 201–234. [Google Scholar] [CrossRef]
  19. Field, K.G.; Samadpour, M. Fecal source tracking, the indicator paradigm, and managing water qualit. Water Res. 2007, 41, 3517–3538. [Google Scholar]
  20. Arizona Department of Environmental Quality (ADEQ). 2006/2008 Status of Ambient Surface Water Quality in Arizona: Arizona’s Integrated 305(b) Assessment and 303(d) Listing Report. Available online: http://www.azdeq.gov/environ/water/assessment/assess.html (accessed on 26 July 2011).
  21. U.S. Environmental Protection Agency (USEPA), Bacteriological criteria for those states not complying with Clean Water Act section 303(i)(1)(A)Title 40: Part 131.41 Arizona; U.S. Environmental Protection Agency: Washington, DC, USA, 2010.
  22. Marino, R.; Gannon, J. Survival of fecal coliforms and fecal streptococci in storm drain sediment. Water Res. 1991, 25, 1089–1098. [Google Scholar] [CrossRef]
  23. National Research Council, Issues in Potable Reuse—The Viabilty of Augmenting Drinking Water Supplies with Reclaimed Water; National Academy Press: Washington, DC, USA, 1998.
  24. U.S. Environmental Protection Agency (USEPA) Web Page. Watershed Priorities: Santa Cruz River Watershed, AZ. Available online: http://www.epa.gov/region9/water/watershed/santacruz.html (accessed on 15 September 2011).
  25. Scott, C.; Pasqualetti, M.; Hoover, J.; Garfin, G.; Varady, R.; Guhathakurta, S. Water and Energy Sustainability with Rapid Growth and Climate Change in the Airzona-Sonora Border Region; A Report to the Arizona Water Institute: Temple, AZ, USA, 2009. [Google Scholar]
  26. U.S. Census Bureau. Table A1: Interim Projections of the Total Population for the United States and States: April 1, 2000 to July 1, 2030. Available online: http://wonder.cdc.gov/wonder/help/populations/population-projections/SummaryTabA1.pdf (accessed on 14 September 2011).
  27. Sprouse, T.W. Water Issues on the Arizona–Mexico Border: The Santa Cruz, San Pedro, and Colorado Rivers; Water Resources Research Center, The University of Arizona: Tucson, AZ, USA, 2005. [Google Scholar]
  28. U.S. Environmental Protection Agency (USEPA) Web Page. US-Mexico Border 2012. Available online: http://www.epa.gov/usmexicoborder/index.html (accessed on 30 September 2011).
  29. U.S. Environmental Protection Agency (USEPA) Web Page. Envirofacts Database. Available online: http://www.epa.gov/enviro/ (accessed on 7 September 2011).
  30. Arizona Department of Water Resources (ADWR) Web Page. Active Management Area Water Supply—Central Arizona Project Water. Available online: http://www.azwater.gov/azdwr/StatewidePlanning/WaterAtlas/ActiveManagementAreas/PlanningAreaOverview/WaterSupply.htm (accessed on 30 September 2011).
  31. Pima County Regional Wastewater Reclamation Department (RWRD), RWRD’s 2010 Effluent Generation and Utilization Report; Pima County Regional Wastewater Reclamation Department: Tucson, AZ, USA, 2011.
  32. CH2MHILL, Nogales International Wastewater Treatment Plant Maximum Allowable Headworks Loading Development; CH2MHILL: El Paso, TX, USA, 2009.
  33. Lim, K.J.; Engel, B.A.; Tang, Z.; Choi, J.; Kim, K.-S.; Muthukrishnan, S.; Tripathy, D. Automated web GIS based hydrograph analysis tool (WHAT). JAWRA J. Am. Water Resour. Assoc. 2005, 41, 1407–1416. [Google Scholar]
  34. Arizona Department of Environmental Quality (ADEQ), Total Maximum Daily Load For: Oak Creek- Slide Rock State Park Parameters: Escherichia coliform; Open File Report 09-08; Arizona Department of Environmental Quality: Phoenix, AZ, USA, 1999.
  35. U.S. Environmental Protection Agency (USEPA), Water Quality Standards Handbook: Second Edition; EPA-823-B-12-002; United States Environmental Protection Agency: Washington, DC, USA, 2012.
  36. Lipp, E.; Kurz, R.; Vincent, R.; Rodriguez-Palacios, C.; Farrah, S.; Rose, J. The effects of seasonal variability and weather on microbial fecal pollution and enteric pathogens in a subtropical estuary. Estuaries Coasts 2001, 24, 266–276. [Google Scholar] [CrossRef]
  37. Kinnaman, A.; Surbeck, C.Q.; Usner, D. Coliform bacteria: The effect of sediments on decay rates and on required detention times in stormwater BMPs. J. Environ. Prot. 2012, 3, 787–797. [Google Scholar] [CrossRef]
  38. Easton, J.H.; Gauthier, J.J.; Lalor, M.M.; Pitt, R.E. Die-off of pathogenic E. coli O157:H7 in sewage contaminated waters. JAWRA J. Am. Water Resour. Assoc. 2005, 41, 1187–1193. [Google Scholar] [CrossRef]
  39. Litton, R.M.; Ahn, J.H.; Sercu, B.; Holden, P.A.; Sedlak, D.L.; Grant, S.B. Evaluation of chemical, molecular, and traditional markers of fecal contamination in an effluent dominated urban stream. Environ. Sci. Technol. 2010, 44, 7369–7375. [Google Scholar]
  40. Hunt, W.; Smith, J.; Jadlocki, S.; Hathaway, J.; Eubanks, P. Pollutant removal and peak flow mitigation by a bioretention cell in urban Charlotte, N.C. J. Environ. Eng. 2008, 134, 403–408. [Google Scholar] [CrossRef]
  41. Van der Valk, A.G.; Jolly, R.W. Recommendations for research to develop guidelines for the use of wetlands to control rural nonpoint source pollution. Ecolog. Eng. 1992, 1, 115–134. [Google Scholar] [CrossRef]
  42. Baffaut, C.; Sadeghi, A. Bacteria modeling with SWAT for assessment and remediation studies: A review. 2010, 53, 1585–1594. [Google Scholar]
  43. Benham, B.L.; Baffaut, C.; Zeckoski, R.W.; Mankin, K.R.; Pachepsky, Y.A.; Sadeghi, A.M.; Brannan, K.M.; Soupir, M.L.; Habersack, M.J. Modeling bacteria fate and transport in watersheds to support TMDLs. Transact. ASABE 2006, 49, 987–1002. [Google Scholar]

