Article

Framework for Enhancing the Supply-Demand Balance of a Tri-Supply Urban Water Scheme in Australia

Griffith University, Gold Coast Campus, Parklands Dr, Southport, QLD 4215, Australia
*
Author to whom correspondence should be addressed.
Water 2011, 3(4), 976-987; https://doi.org/10.3390/w3040976
Submission received: 4 July 2011 / Revised: 16 September 2011 / Accepted: 2 October 2011 / Published: 13 October 2011
(This article belongs to the Special Issue Water Recycling and Reuse)

Abstract

:
Fit-for-purpose potable source substitution of appropriate water end uses with rainwater or recycled water is often essential to maintain water security in growing urban regions. This paper provides the results of a detailed supply-demand forecasting review of a unique tri-supply (i.e., potable, A+ recycled and rain water sources reticulated to household) urban water scheme located in Queensland, Australia. Despite the numerous benefits of this scheme, system efficiency (e.g., reduced demand levels, water treatment, low chemical and energy use) and economic viability (i.e., capital and operating costs per kL of supply) aspects need to be considered against derived potable water savings. The review underpinned the design of a framework to enhance the schemes supply-demand balance and reduce the unit cost of alternative source supplies. Detailed scenario and sensitivity analysis identified the possibility of a refined scheme design, whereby the A+ recycled water supply would be reticulated to the cold water input tap to the washing machine, and the rain tank that originally supplied this end use be removed from future constructed households. The refined scheme design enhances the present recycled plant utilisation rate and reduces the cost to home owners when building their dwelling due to the removed requirement to install a rain tank to indoor end uses; such actions reduce the overall unit cost of the scheme.

1. Introduction

Water is an essential need for every form of life. Although 70% of the Earth’s surface is covered by water, only a small percentage of this water is potable and directly accessible from lakes, rivers or streams. Further, the Intergovernmental Panel on Climate Change has stated that observational records and climate projections provide abundant evidence that freshwater resources are vulnerable, and have the potential to be strongly impacted by climate change, with wide-ranging consequences for human societies and ecosystems [1].
As an example, in recent years the South-East region of Queensland, Australia has experienced extended drought periods, unpredictable climate change, and a fast growing population [2], which has also brought a rapidly increasing potable water demand.
As a consequence, greater attention has been given to water sustainability in the region [3,4,5], especially with the introduction of restrictions in the use of potable water and the triggering of the potential use of alternative sources of water, such as recycled water or rain water [6], with the outcome being great savings in potable water [7].
Accordingly, many innovative water supply systems have been implemented; in the dual water supply scheme analysed in this study, the water is provided to the customer through a dual reticulation system, which furnishes both potable and recycled water used for non-drinking end uses. Moreover, since 2007, every new house to be connected to this water scheme is built with an internally plumbed rain water tank, which provides additional water for non-drinking purposes [8].
Despite these changes, and their associated indisputable benefits, few studies have assessed the current and future water demands; as a result, the recycled water treatment plant is only partially exploited. Further, future planned incremental capacity for the infrastructure is to be implemented without the evidence, or support, of a demand study. Moreover, there is no evidence that the use of both a dual reticulation system and rain water tanks is more economically viable than only using a dual water supply.
The current research aims to fill this lack of information. The study uses a detailed current and future water demand analysis of the existing scheme, as well as for a proposed refined scheme. It is considered that the recycled water treatment plant will provide more water to customers through a new use for the recycled water (namely, a cold water tap for the washing machines), while reducing the need for further installations of internally plumbed rain water tanks, which has the potential for reduced construction costs for new residential dwellings in this region.

2. Research Method

The study began by reviewing the pertinent literature; the review provided a comprehensive background for the current research topic, and assisted with identifying the gaps and deficiencies in previous studies. These issues formed the basis for the current research questions and proposals. The literature review also demonstrated the feasibility of the research outcomes, namely, evidence of the acceptance of using recycled water for washing clothes by customers using other dual water supply systems [9,10]. Next, the study focused on the prediction of the future population and the number of customer connections in the tri-supply region till 2056. For the various variables influencing recycled water demand, a number of scenarios were considered, including, population, the percentage of cold water used for washing clothes, the percentage of recycled water used for washing clothes, the peak factor related to the day of the year with maximum demand, and the increment of recycled water used for irrigation purposes. Three hundred and sixty scenarios were considered to give more reliability to the study and allowed the most conservatives scenarios to be determined. The scenarios incorporated combinations of the following variable ranges:
(1)
Population at 2056: 120,000 to 150,000 (3 values used): the three values were taken from Australian Government Statistical population forecasts for the region under examination.
(2)
Peak day factor: 1.8 to 2.3 (2 values used). The typical design value applied in network design in the region is 2.3 (e.g., Gold Coast Planning Scheme Policies, 2008), but this is considered conservative based on current peaking levels thus a lower 1.8 factor was considered as well.
(3)
Increment of recycled water used for irrigation: 0% to 100% (5 values used). There are a number of reasons for the large range for increasing irrigation demand. Firstly, the end use values underpinning the base case recycled water irrigation value was lower than that recorded historically (i.e., pre-2005). Moreover, there is potential for a rebound in irrigation due unpredictable future climate change causing dryer seasons and behavioural changes.
(4)
Percentage of cold water used by washing machines: 70% to 90% (3 values used). This range of values was based on a market survey on the current cold water consumption of washing machines of different brands.
(5)
Percentage of recycled water used for washing clothes: 50% to 100% (4 values used). This value was difficult to accurately quantify due to the lack of existing available evidence on potential uptake of recycled water for clothes washing. Therefore, a relatively large interval range was considered appropriate.
The fourth activity was to calculate the water demand, which was the main focus of the study. The calculation of the current demand was able to be precisely calculated, unlike the future water demand. Detailed end use consumption data, as well as bulk water data, were readily available in order to reliably determine current household demand for each supply source.
The fifth activity involved assessing the future water demand, taking into account any uncertainties for both the current scheme and for the new proposed scheme. Specifically, the research sought to identify whether applying some changes (e.g., new end-use for recycled water) to the current scheme would create a new and more cost effective scheme.
Obviously, the consideration of several variables that influence recycled and rain tank water demand, along with their specific ranges of variance, created an interval of demand results. Some variables had fixed to small interval ranges, where there was greater certainty in demand, however for other variables where there was greater uncertainty a larger interval range was applied. Most likely and least likely upper and lower limits of demand were achieved through this modelling process enabling greater understanding on the range of recycled and rain tank water demand requirements and associated plant and trunk main staging. Such an approach is essential for the planning of contemporary water supply schemes as there is great uncertainty in their likely uptake, particularly for discretionary end uses like outdoor irrigation.
This research area has received little attention in the past. The current study, therefore, seeks to improve the knowledge and understanding in this area.

3. Results

The evaluation of water demand, especially for alternative water supply sources, is crucial in understanding the performance these schemes as each stage of their life cycle, and to make any necessary refinements to improve their unit cost viability. Below represents the estimates of current and then future water demand of the contemporary scheme, for both the existing and the proposed refined scheme.

3.1. Current Demand

As already mentioned, previous studies [11,12] provided both end use consumption and bulk data related to the water supply system analysed. The current water demand was calculated using information about the percentages of residential/non residential use, the percentages of indoor/outdoor use, the number of dwellings with/without the internally plumbed 5000L rain water tank, and the percentage of non-revenue water, taken from the same studies. The values, summarised in Table 1, were obtained through an elaboration of the data coming from both studies. To explain the calculation process: the end use study [12] was used to get the total amount of potable, recycled and rain water for both the current and the proposed scheme; population estimates for the current and future population was taken from the Australian Bureau of Statistics; total demand of water was determined using available bulk water data available from the water business, stripping out leakages and non-residential components [11]. Both the top-down and bottom-up estimates of water demand matched thereby providing evidence that the data is credible and reliable.
Table 1. Current water demand [ML/d] (2011).
FactorDual supplyTri-supplyTotal
Inhabitants15,94223,81039752
Residential: potable1.862.083.93
Residential: recycled0.761.131.88
Residential: rainwater0.000.800.80
Non-Residential: potable 0.66
Non-Residential: recycled 0.08
Total potable 4.60
Total recycled 1.96
Total rain water 0.80
The current capacity of the recycled water treatment plant is 9 ML/d. The bulk data revealed that the total amount of recycled water treated was around 4 ML/d. At present, only half of the treated recycled water (1.96 ML/d) was used by the customers, with the remaining being released to outfall. Within the next 45 years, it is presently planned to increase the capacity of the recycled water treatment plant from 9 to 45 ML/d, through six stages.

3.2. Future Demand

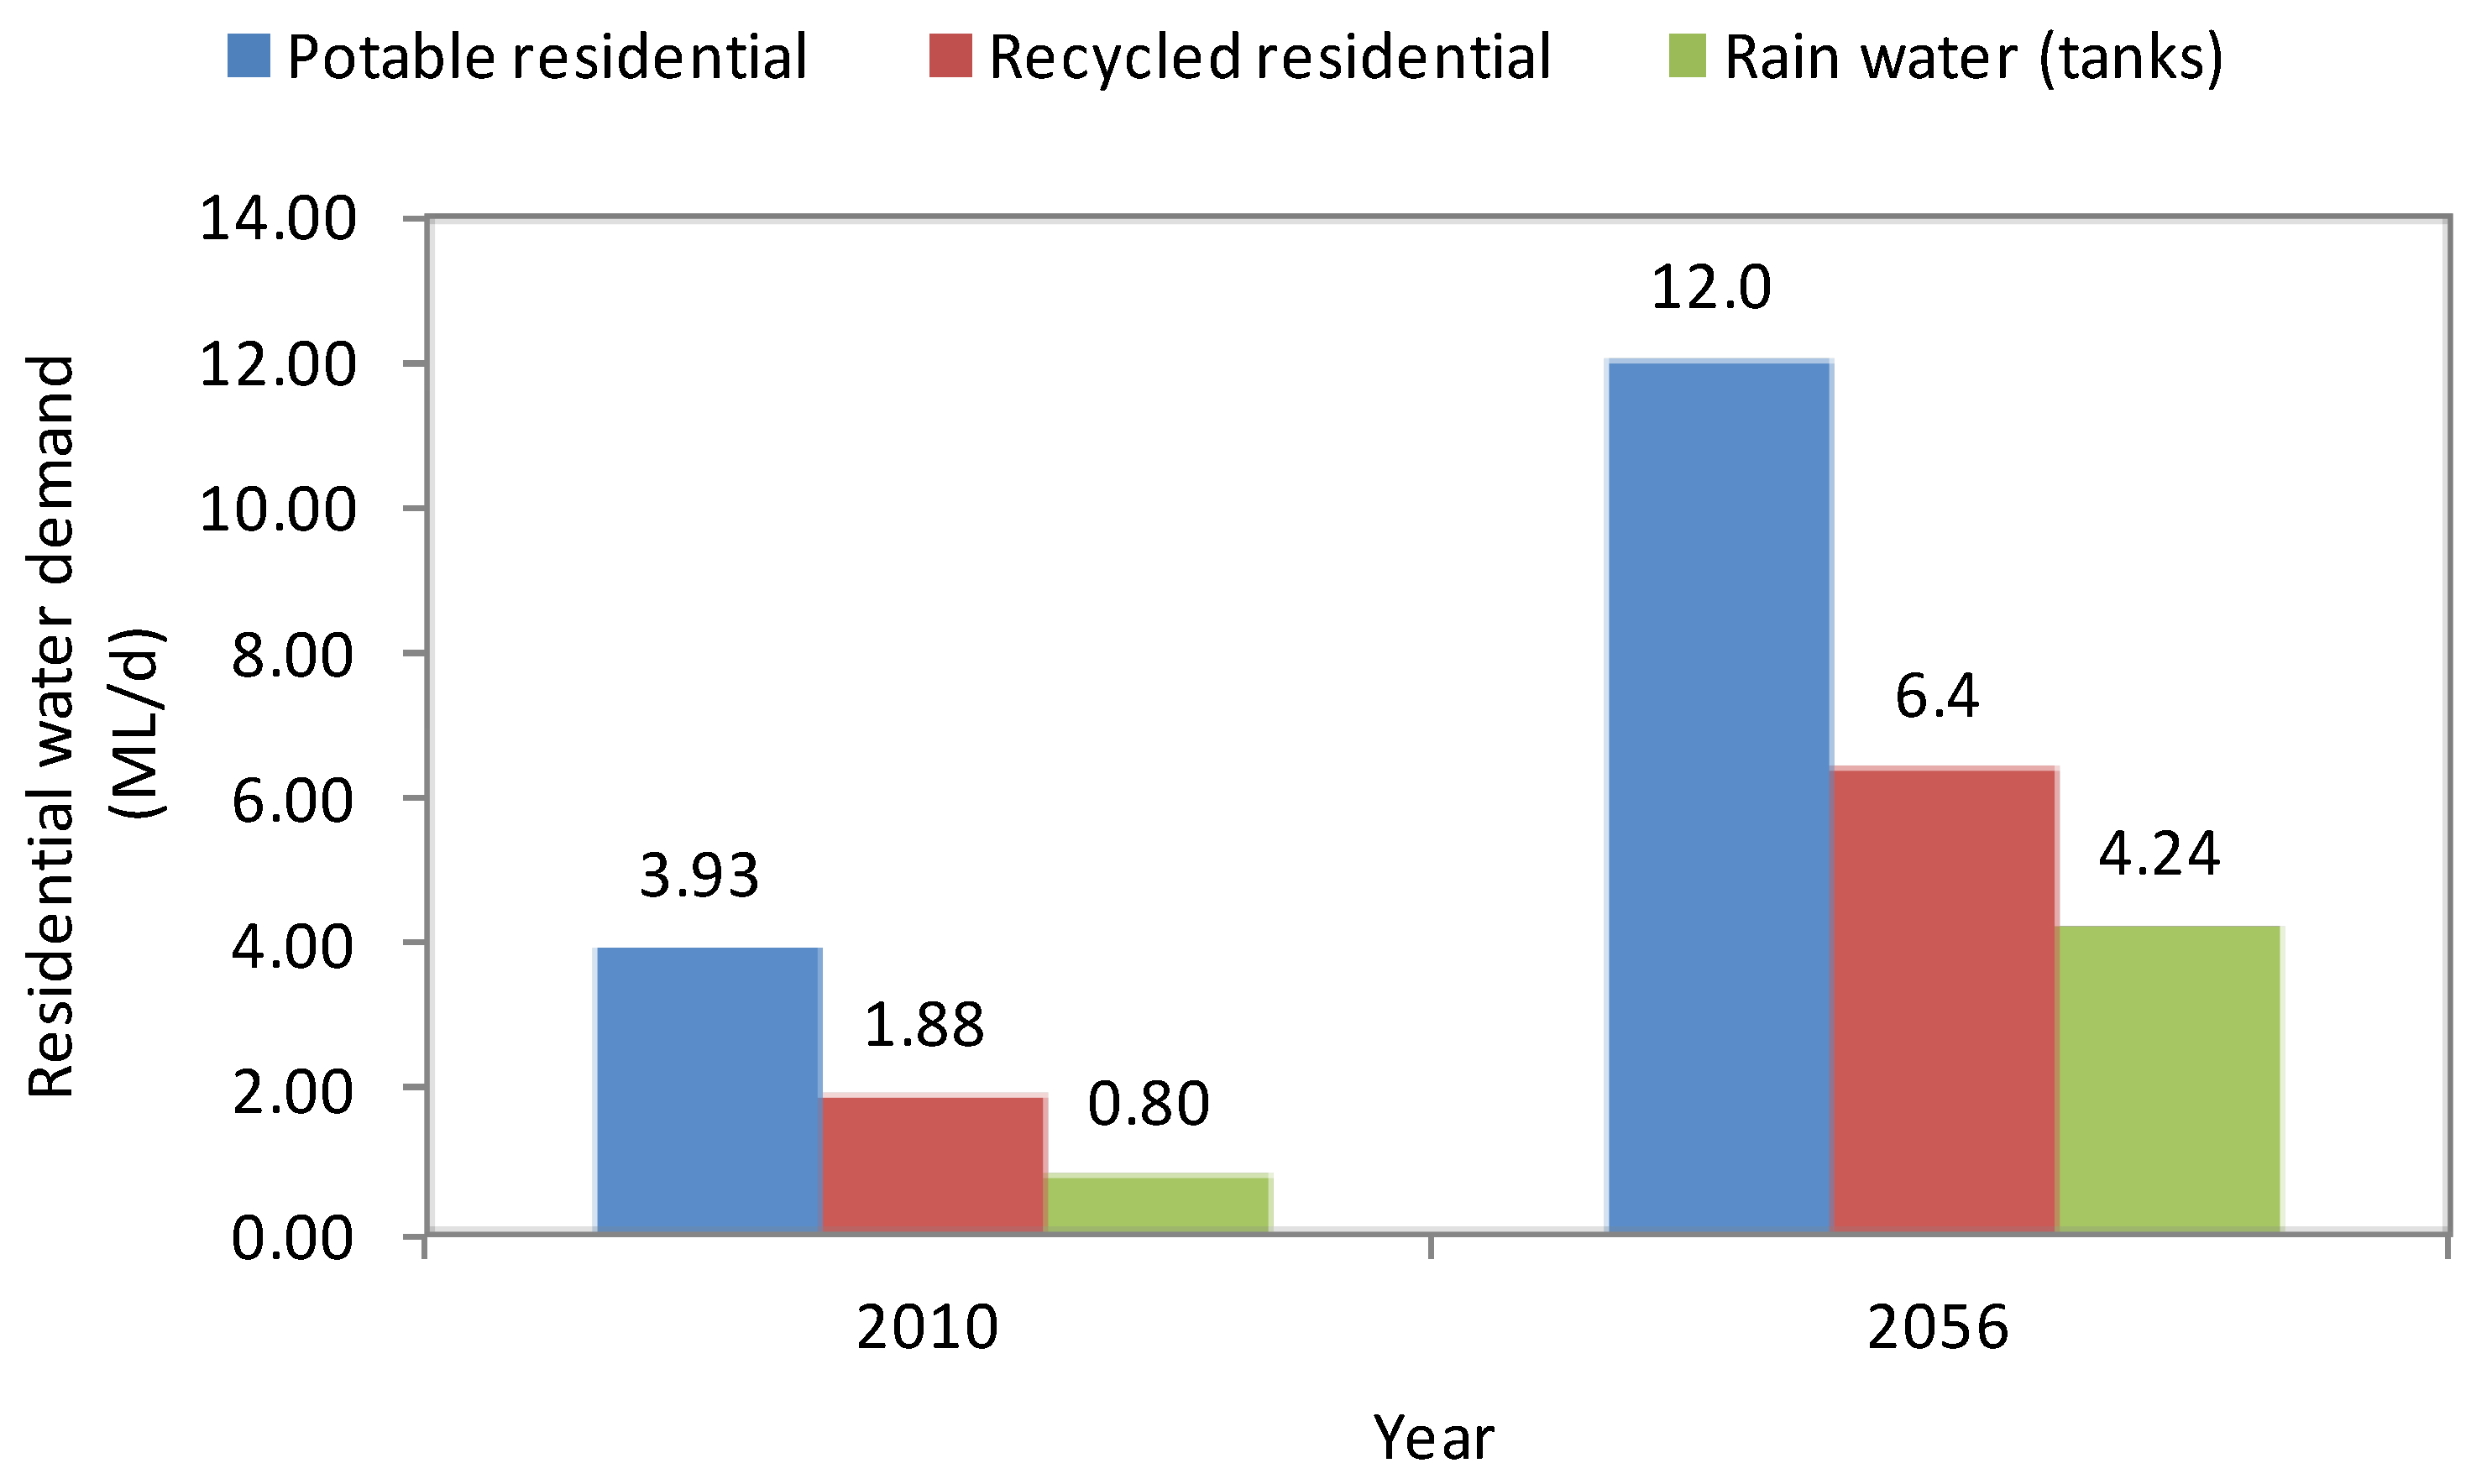
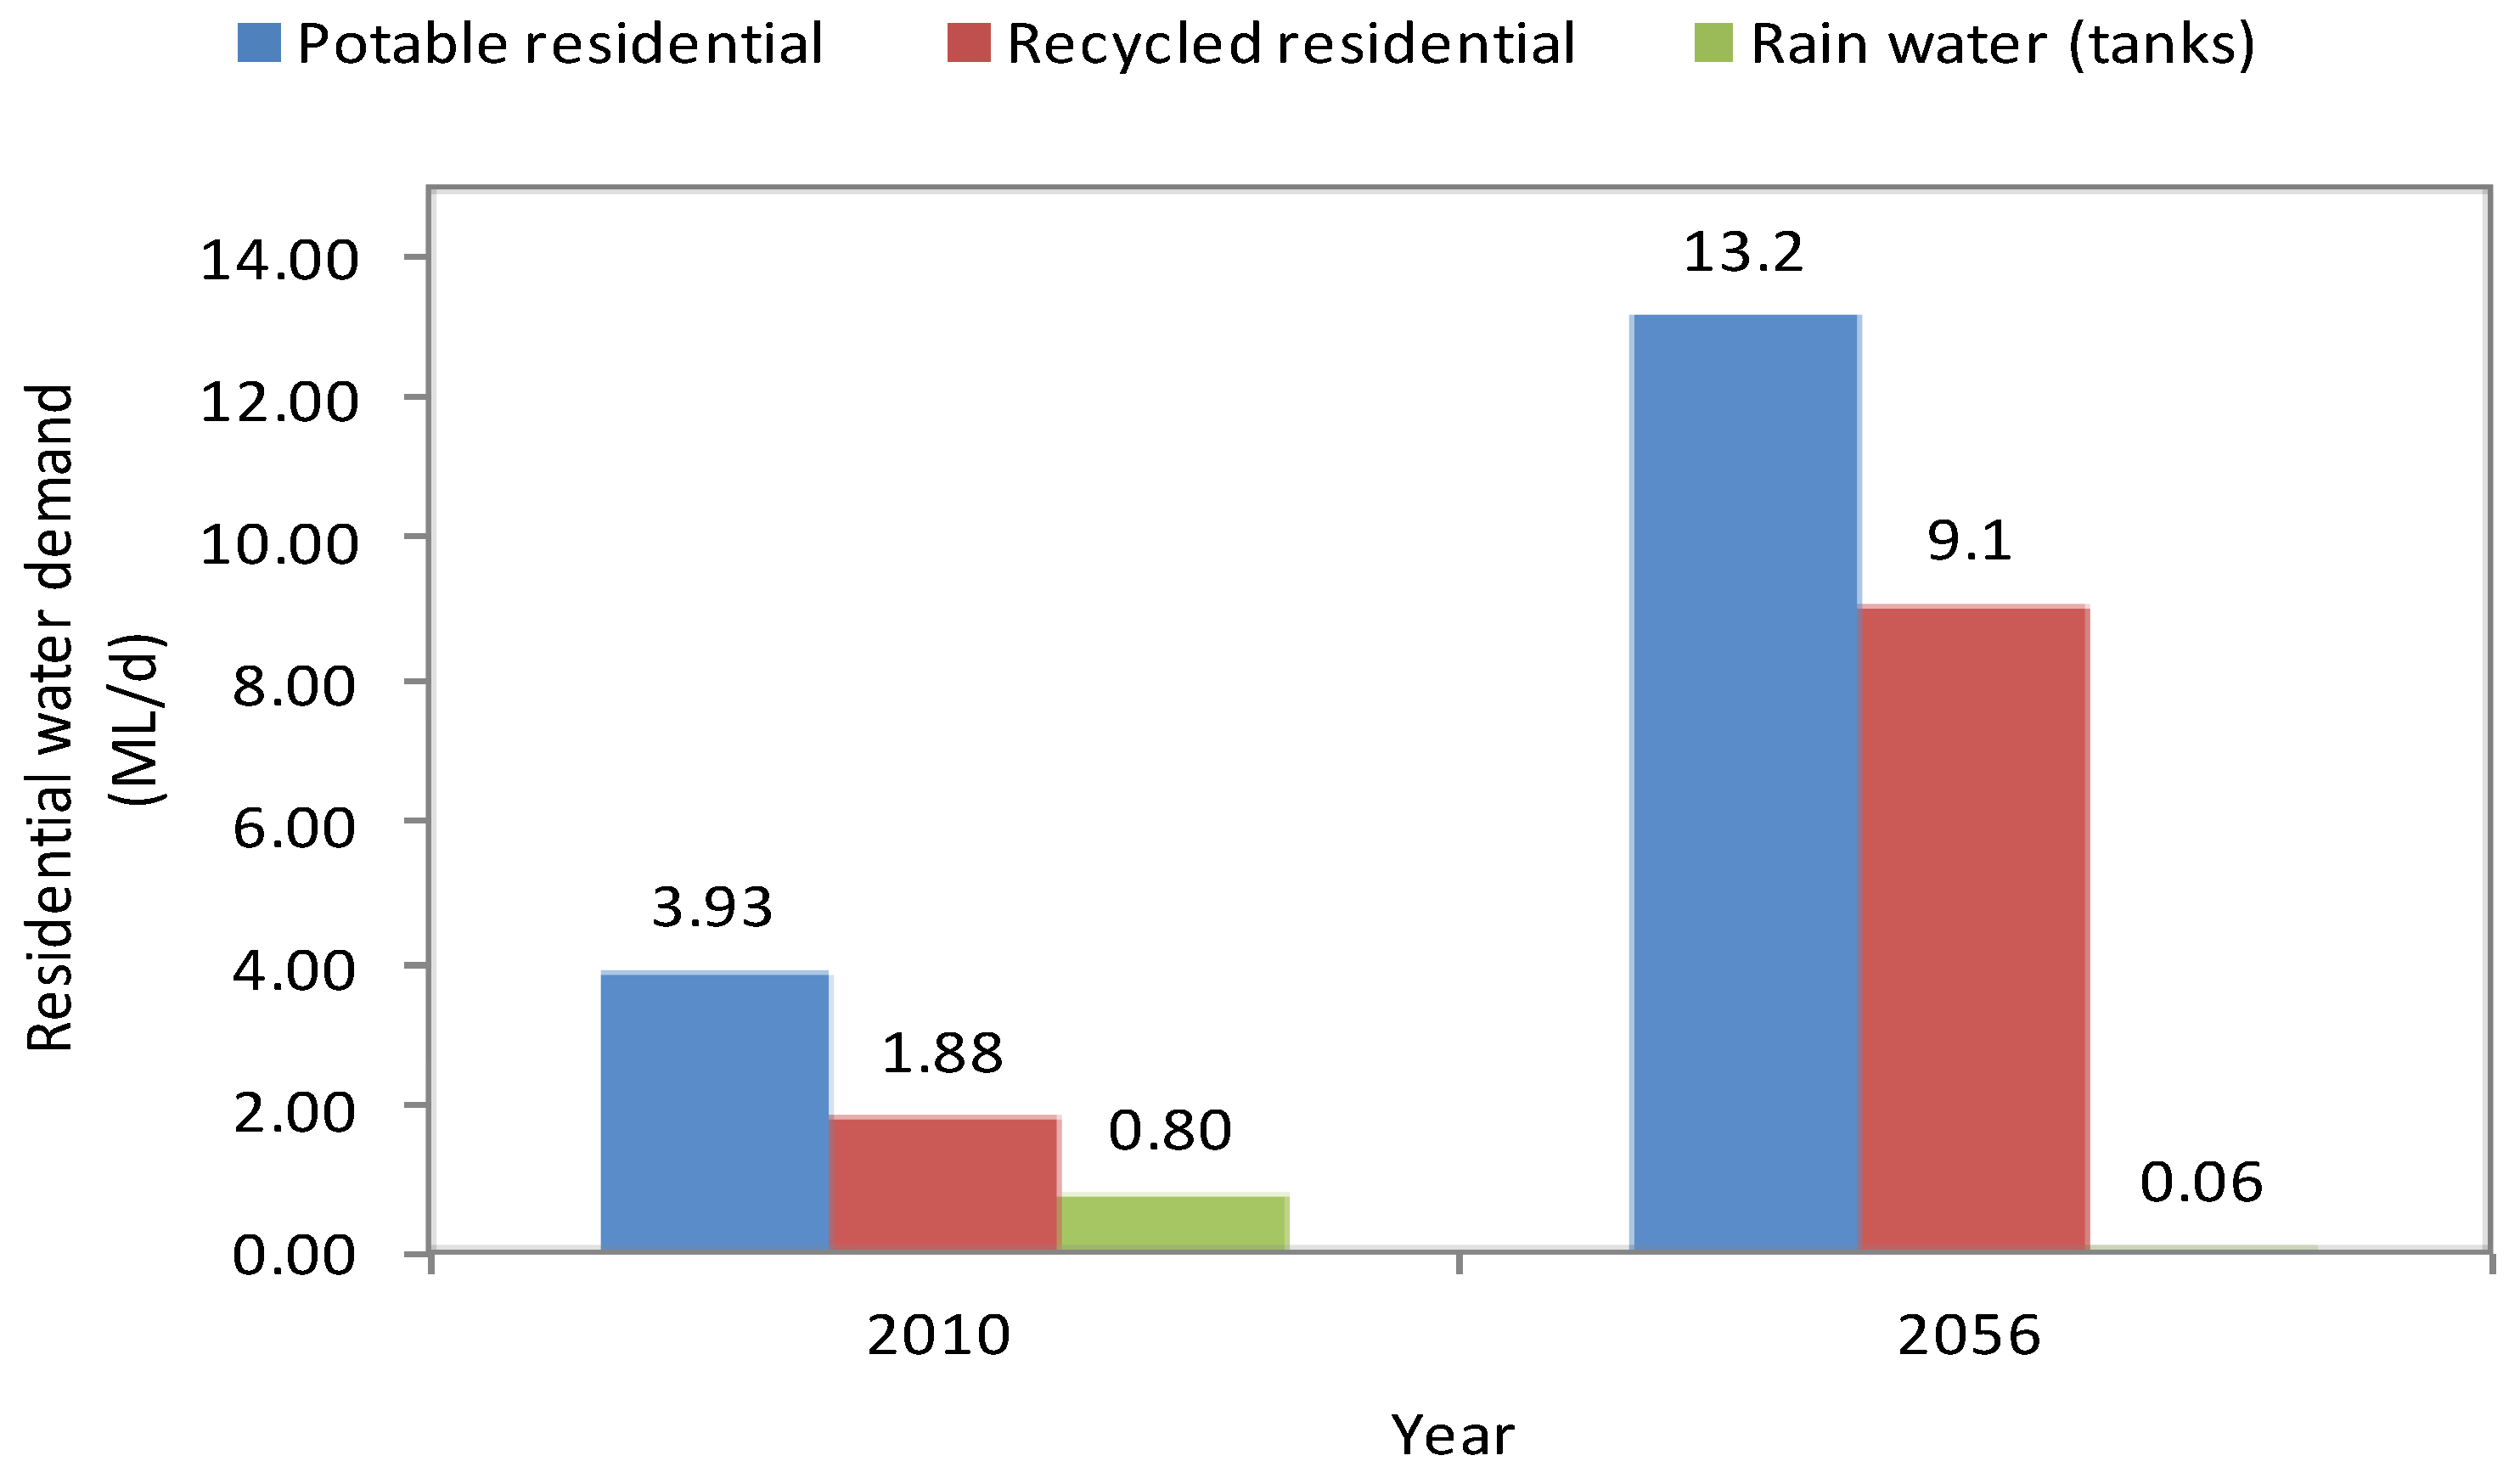
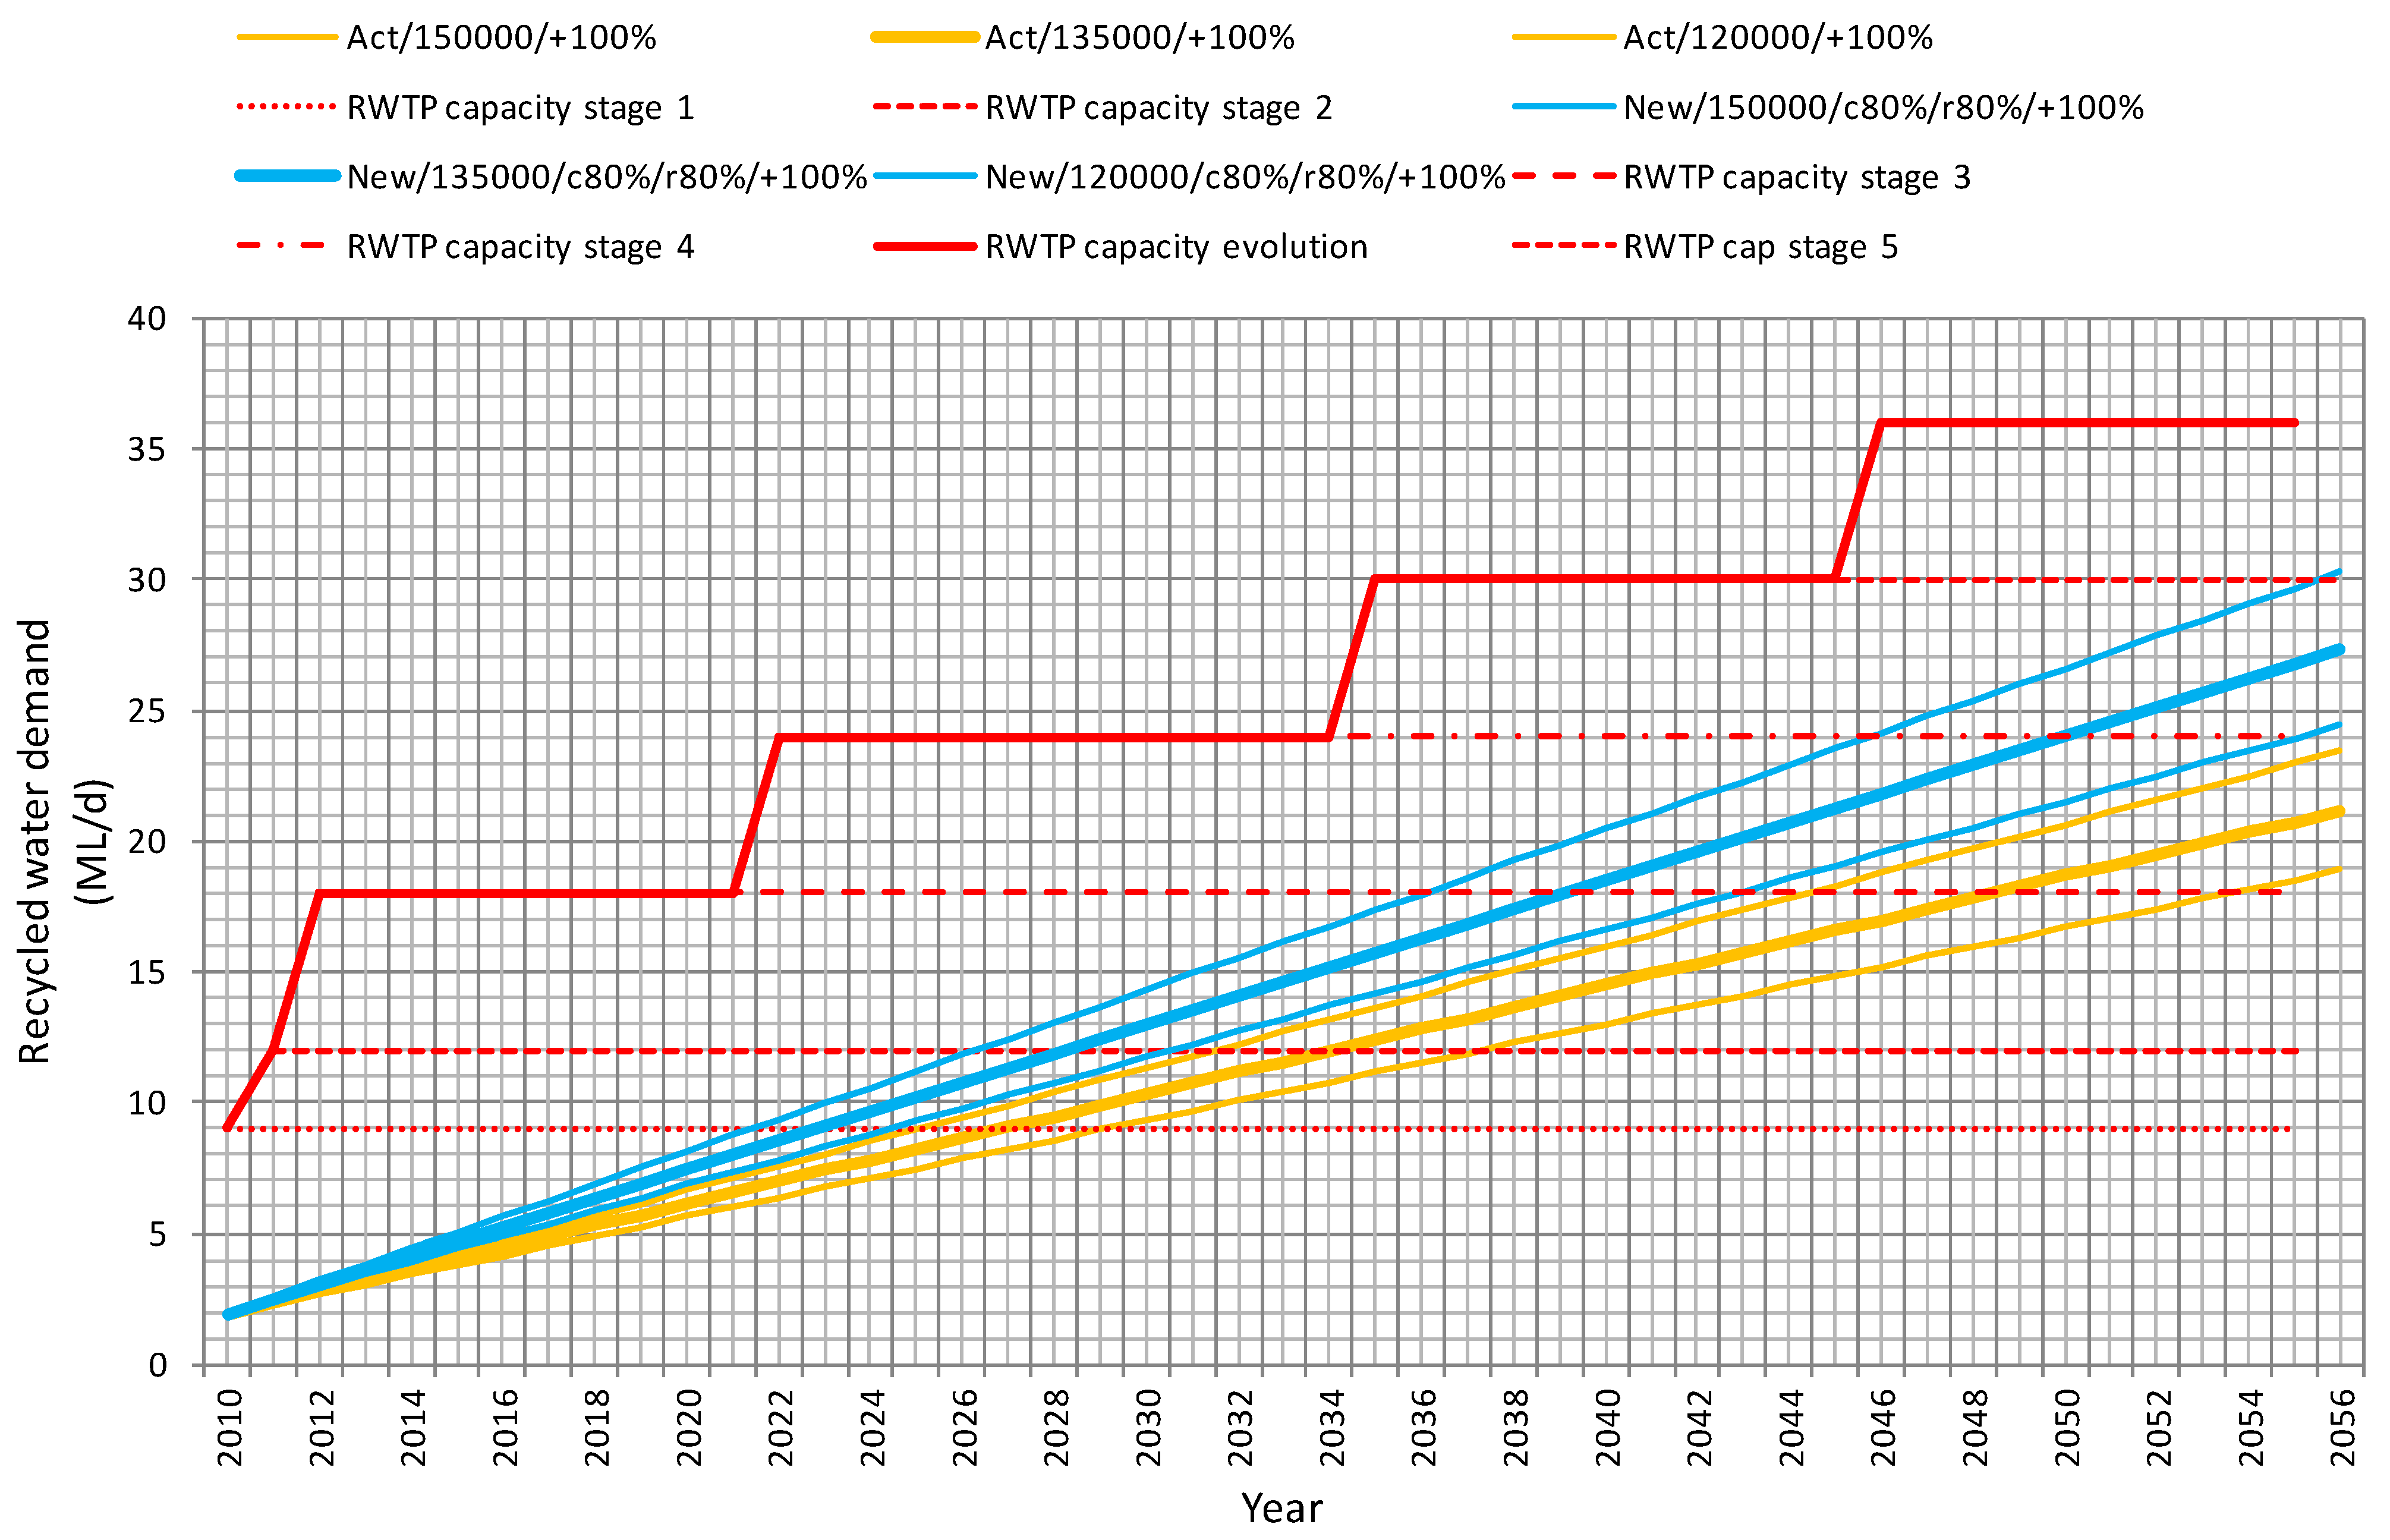
Future recycled water demand (year 2056) was forecasted for the current scheme design (Figure 1) and the proposed scheme refinement (Figure 2) (i.e., recycled water to cold water laundry tap and removal of rain tank). Figure 3 incorporates a doubling of the present relatively low irrigation demand and the peak day factor of 1.8. The three lines for each scheme represent the three different future population scenarios. The values of demand are considerably higher that for Figure 1 and Figure 2, as the extra variables increased the need for recycled water. From the results, the present scheme design requires stages 2 (12 ML/d) to 3 (18 ML/d) to be implemented, while for the proposed scheme the demand will be just below the limit of stage 4 (24 ML/d).
Figure 1. Residential base case water demand forecast for current scheme.
Water 03 00976 g001
Figure 2. Residential base case water demand forecast for proposed scheme.
Water 03 00976 g002
Figure 3. Recycled water demand prediction for base case scenarios (peak factor = 1.8).
Water 03 00976 g003
Increasing the peak factor to 2.3, Figure 4 is obtained. For this higher peak demand factor considered, one more stage would be needed for both schemes: in the worst case scenarios for the proposed scheme, the stage 5 limit (30 ML/d) would be approached, but not exceeded. For the present scheme design, stage 4 RWTP capacity (24 ML/d) would be adequate even for the worst case.
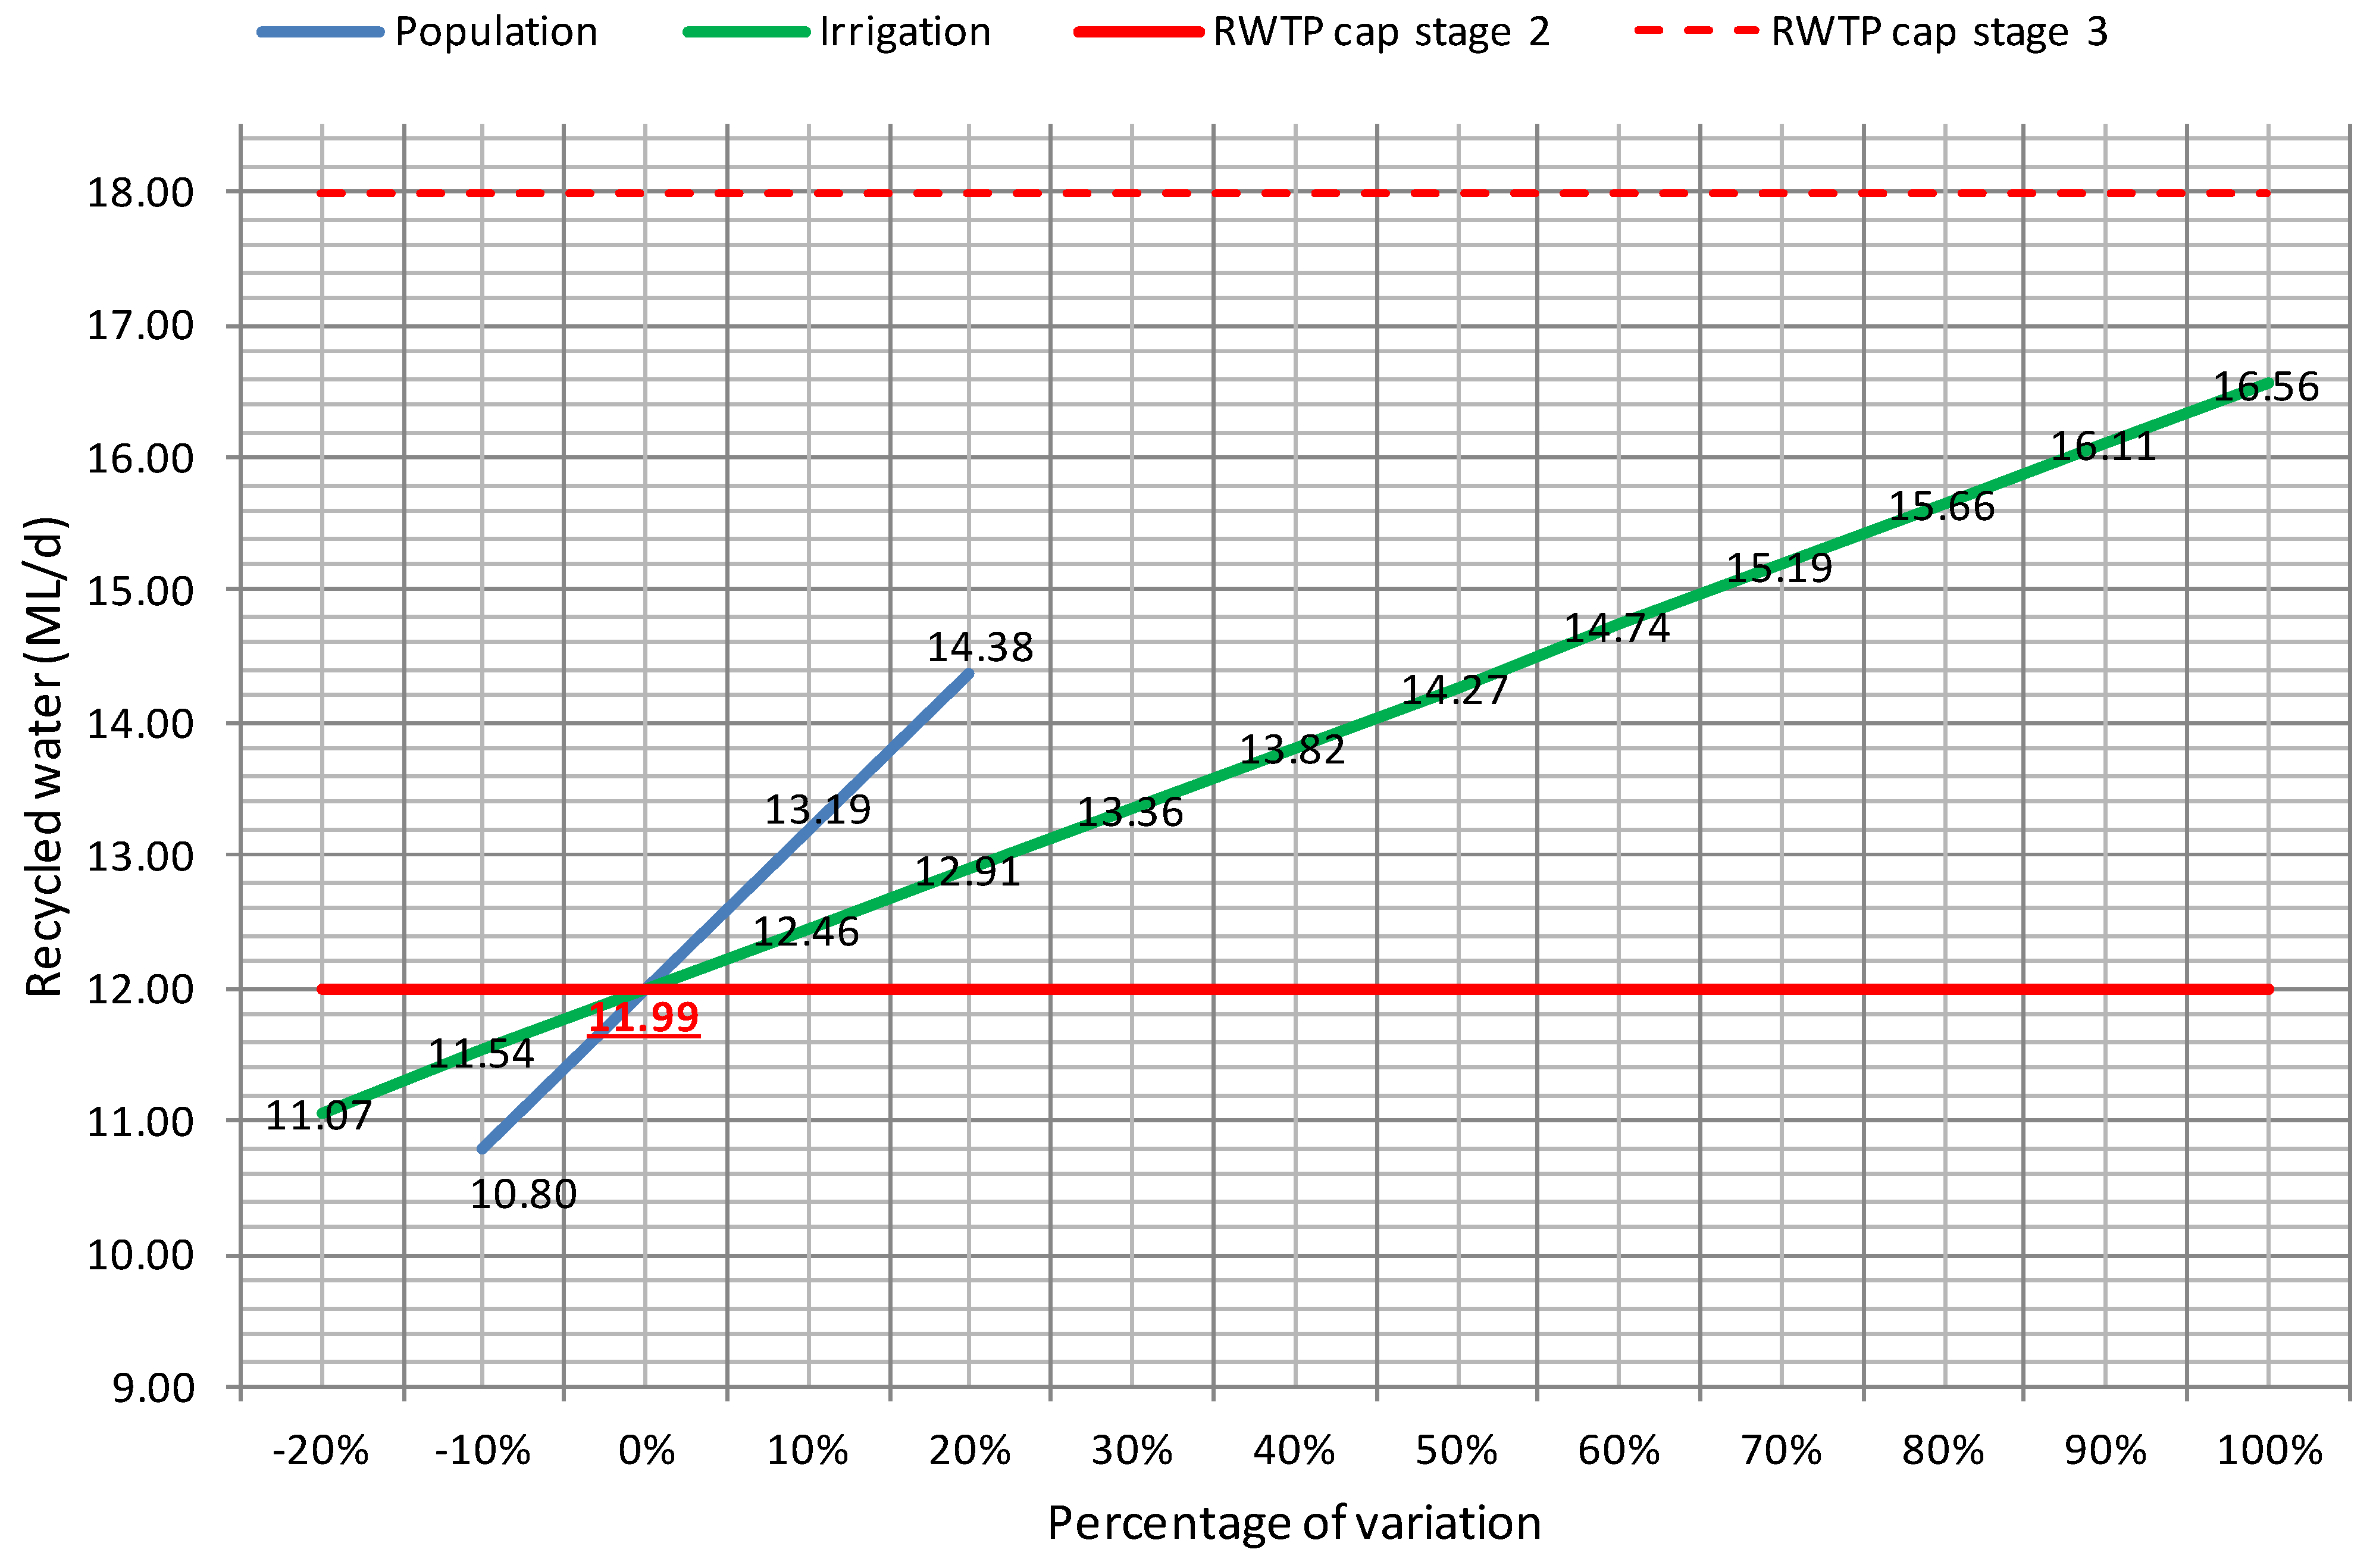
Spider graphs were applied to examine percentage variance of demand estimates around the base case scenario. Thus, each variable brings a different set of behaviours to the model, depending on the importance that the variable has on influencing the scheme demand prediction. Figure 5 shows a spider graph related to the present scheme design, where the demand values relate to the year 2056, with the main influencing factor being the future population. The figure shows that the slope of the line ‘population’ is higher than the line for the irrigation demand increase. Additionally, an increment of 10% in the population would raise the most likely value of recycled A+ water demand (11.99 ML/d, with population 135,000 and increment of irrigation 0%) to 13.19 ML/d, while the same increment of the demand for irrigation would bring a lower increment of the total recycled water needed (12.46 ML/d). Several factors, including climate change, could influence the use of recycled water for irrigation. However, because of the uncertainties involved, it is difficult to forecast an accurate percentage for the increment. Consequently, it could be valid enough to consider a doubling or 100% increase to current demand. The irrigation line, although less inclined than that for population, is longer and can reach higher values than the population line. Its range, considering −20% to +100% of variation, covers a water demand from between 11.07 ML/d and 15.56 ML/d (Figure 5). When assessing the stage of the increment of capacity needed for the plant, and being aware that the main scenario (11.99 ML/d) would stay just under the stage 2 limit (12 ML/d), small additional increments of a single variable would exceed the RWTP capacity limit. Therefore, stage 3 was necessary.
Figure 4. Recycled water demand prediction for base case scenario (peak factor = 2.3).
Water 03 00976 g004
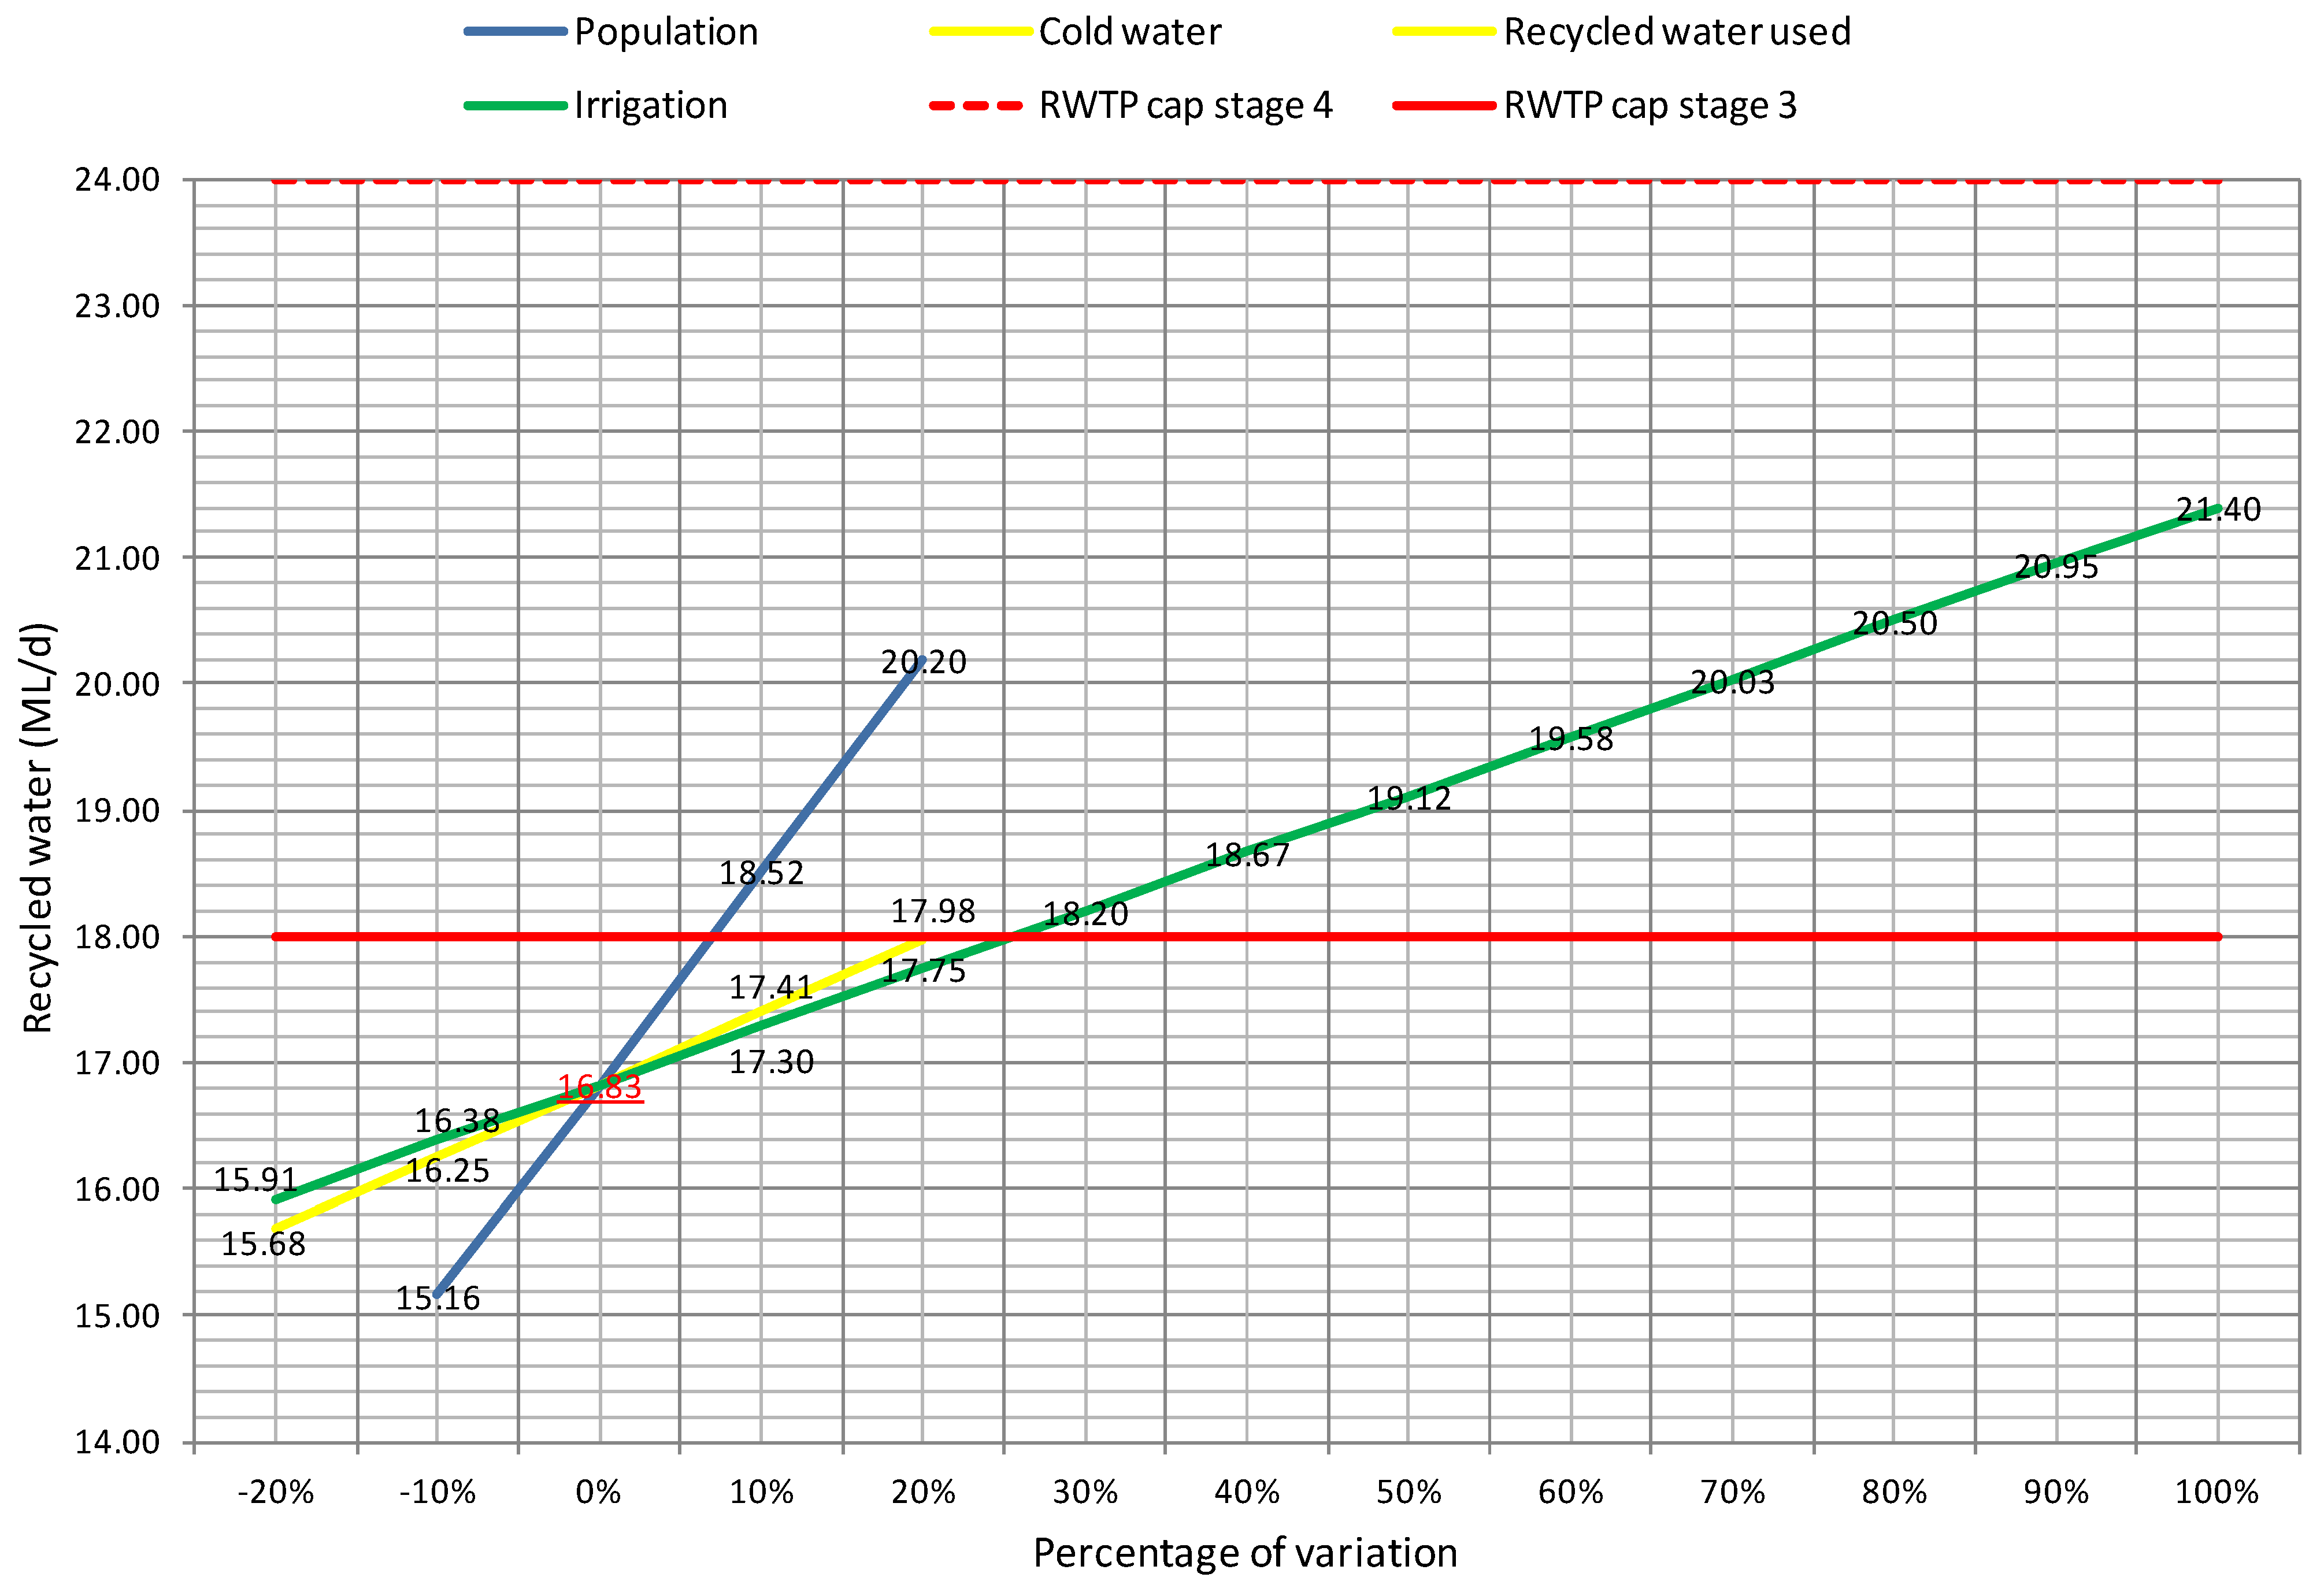
A second spider graph (Figure 6) was formulated for the proposed water supply scheme, with recycled A+ water being reticulated to the cold water tap of washing machines. Interestingly, there were more influencing factors here, than in the current scheme. Indeed, the percentage of cold water used for washing clothes was not important for the current scheme, as both cold and hot water were potable water supplied and, for the same reason, no recycled water was used for this purpose. Therefore, they were not included in the graph (Figure 5). Hence, in the refined scheme spider graphs (Figure 6), there are two additional yellow lines for the cold water utilisation rate and the recycled water demand. These lines overlap because they influence, in the same manner, the amount of recycled water demand. Further, their slope, which fitted between the slope of the irrigation line and the population line, meant that they were more influential than irrigation, but less influential than the population. Their range of variation was limited because, as the main scenario was built with a percentage of 80% of these variables, their percentage could not be increased by more than 20%, as the total would exceed 100%. This particular variable is considered important as there is still limited understanding on householders’ likely uptake of recycled water for clothes washing, particularly where the option of a cold water potable tap near the washer is available. Fortunately, this uncertain variable was one of the lesser influential factors on total recycled water demand.
Figure 5. Spider graph for current scheme demand prediction in 2056 (peak factor = 1.8).
Water 03 00976 g005
An analysis of the chart reveals that the main scenario (16.83 ML/d) was below the limit of stage 3 (18 ML/d). Once again, the most influencing factor was population, that is, with an increment of 10% (a future population around 150,000), the stage 3 limit would be exceeded. The next most influencing factors were the percentages of cold water utilised and recycled A+ water used for washing clothes. It was impossible to predict a reliable percentage at this stage as their values will depend on a range of social factors, information campaigns undertaken, and the evolution of the technology applied to washing machines.
Nevertheless, with a good approximation of 80% for both lines, the most likely range would fall between 60% and 100% (90% for the cold water used, as a small percentage of hot water will be always present). This range also limited the length of the lines and, consequently, these factors also had a limited influence. With the recycled water demand being assessed between 15.68 ML/d and 17.98 ML/d, the limit of stage 3 (12 ML/d) was approached, but it was never exceeded. However, by matching the increment of one of these variables with a small variation in another influencing factor, stage 3 capacity could be exceeded. While the lower influential factor is again irrigation (which can vary from −20% to +100%), with an increment of just 25% of the recycled water used for this purpose, stage 3 could be easily exceeded. Considering the modelled uncertainty, the definitive conclusion, therefore, is that the RWTP stage 4 capacity expansions will be necessary for the proposed refined scheme.
Figure 6. Spider graph for proposed scheme in 2056 (peak factor = 1.8).
Water 03 00976 g006
The analysis considered another part of the infrastructure beyond the RWTP, namely the recycled water trunk main capacity, using the same water demand forecast and considering a usual peak hour factor. The results showed that the current limit (14 ML/d) would be exceeded for both schemes; therefore, it was not considered an important factor when deciding which future scheme to choose.

4. Discussion

The stages needed for the base case scenarios, calculated using the demand analysis, are summarised in Table 2. Thus, it can be seen that, considering a peak factor of 1.8 and the base case variables, a stage 2 RWTP capacity would be adequate. However, in the same situation, for the proposed refined scheme, stage 3 would be necessary. Briefly, then, it can be asserted that, if the peak factor was incremented to 2.3, one more stage would be necessary for both schemes (stage 3 for the current scheme, and stage 4 for the new scheme). Further, with the highest values applied for the most sensitive variables, namely population or significant increase in recycled water demand for irrigation, one additional stage would be required. Indeed, these two variables were the most influential variables (Table 2, underlined numbers).
Interestingly, although this study considered many uncertainties related to future householder water use habits and technologies, the most influential variables, which create the greatest uncertainty, are common to both schemes (Table 2). This common uncertainty means that there is only one additional stage required for the proposed scheme.
Despite this additional RWTP staging cost for the proposed scheme where recycled water is reticulated to the cold water laundry tap of the washing machine, the refinement calls for the removal of the requirement for the installation and maintenance of the rain tanks in the region which are presently supplying this end use. This represents a saving to the home owner of approximately AUD$3,000 to AUD$5,000 capital outlay and AUD$100–300 per year in operating/maintenance costs. The life cycle unit cost of the proposed scheme was determined to be considerably less than the current scheme, when considering the total resource cost perspective. Also, the water business will benefit from the proposed reconfigured design as they will have higher utilisation rates for their advanced treated recycled water, and higher revenue from increased recycled water demand, thereby making the scheme more financially viable than at present.
Table 2. Forecasting results summary for current and proposed scheme configuration.
Scheme VariablesCurrent scheme (RWTP stage needed)Proposed scheme (RWTP stage needed)
Scenario typeLowerBase caseUpperLowerBase caseUpper
Peak factor applied1.82.31.82.31.82.31.82.31.82.31.82.3
% change in population232333343444
% change in cold water utilised for clothes washer232323343434
% change in recycled water utilised for clothes washer232323343434
% change in irrigation232334343445
Notes: Stage needed for the base case scenarios in bold. Lower case values for variables: population 120,000, % cold water 70%, % recycled water 50%, % change in irrigation 0%. Upper case values for variables: population 150,000, % cold water 90%, % recycled water 100%, % change in irrigation 100%.
One key element that has influenced the staging required is the peaking factor selected. Applying lower peak day demand factors (i.e., 1.8) instead of the usual 2.3, can result in lower staging requirements. Design engineers often use 2.3, but recent experience indicates that a 1.8 could be credible. Moreover, a recent study [13] showed that dual reticulated supply schemes can provide significant reductions in potable supply peak demand. Obviously, the selection of lower peaking factors to reduce staging requirements, may mean that alternative strategies may need to be applied to meet those few peak days each year. Such strategies could include using larger storage reservoirs and the supplementing of recycled water with potable water in peak periods. This latter solution is already in place in the Rouse Hill (NSW, Australia) and Mawson Lakes (South Australia) dual supply systems.

5. Conclusions

There is a need for more targeted research into alternative water supply schemes, especially in terms of their demand, social acceptance of recycled water for fit-for-purpose water end uses and the economics of such schemes. While the evaluated tri-supply water supply scheme is award winning and considered internationally as best practice urban water design, there are opportunities for scheme refinement. In this case, the review process identified two main drawbacks with the present system being that the RWTP plant was running much lower than its capacity, and approximately half of all A+ treated water was not sold to customers but released to outflow. Also, there was an internally plumbed rain tank being installed and plumbed to an end use that is fit-for-purpose for the existing A+ recycled water supplied. The proposed design eliminates these drawbacks, by increasing RWTP utilisation and removing the rain tank expense to new home owners. Both the water business and customer will benefit from the refined design and a lower life cycle unit cost ($/kL) for the scheme can be realised.
The current research thus justifies the need for more comprehensive and thorough scheme evaluation studies. Such studies would ensure that the infrastructure development fitted the needs of the community and its purpose, rather than just being well engineered and well built. Indeed, the project falls within the sphere of ‘best practice’ as an educational case study for planners and engineers, highlighting their need to think outside their narrow fields, and include alternative schemes that might save money, time, and in the present case, potable water.

References

  1. Bates, B.; Kundzewicz, Z.W.; Wu, S.; Palutikof, J. Climate Change and Water; Technical Paper of the Intergovernmental Panel on Climate Change; IPCC Secretariat: Geneva, Switzerland, 2008. [Google Scholar]
  2. Australian Bureau of Statistics. Regional Population Growth. Catalogue no. 3218.0; Gold Coast, Australia, 30 March 2010. [Google Scholar]
  3. Willis, R.M.; Stewart, R.A.; Panuwatwanich, K.; Williams, P.R.; Hollingsworth, A.L. Quantifying the influence of environmental and water conservation attitudes on household end use water consumption. J. Environ. Manag. 2011, 92, 1996–2009. [Google Scholar] [CrossRef]
  4. Willis, R.M.; Stewart, R.A.; Emmonds, S. Pimpama-Coomera dual reticulation end use study: Pre-commission baseline, context and post-commission end use prediction. Water Sci. Technol. 2010, 10, 302–314. [Google Scholar]
  5. Willis, R.M.; Stewart, R.A.; Panuwatwanich, K.; Jones, S.; Kyriakides, A. Alarming visual display monitors affecting shower end use water and energy conservation in Australian residential households. Resour. Conserv. Recycl. 2010, 54, 1117–1127. [Google Scholar] [CrossRef]
  6. Gold Coast Water. In Rainwater, an Essential Ingredient in Pimpama-Coomera; Gold Costal City Council: Queensland, Australia, 2007.
  7. Beal, C.; Gardner, T.; Sharma, A. A Preliminary Analysis of Potable Water Savings from Mandated Rainwater Tanks in New Residential Properties in SEQ. In Presented at the Urban Water Security Research Alliance Science Forum, Brisbane, Australia, 24–25 August 2009.
  8. Went, D. The Gold Coast Experience: Pimpama-Coomera Waterfuture Master Plan; Gold Costal City Council: Queensland, Australia, 2008. [Google Scholar]
  9. Hurlimann, A. Community Attitudes to Recycled Water Use: An Urban Australian Case Study; Research Report Number 56; Cooperative Research Centre for Water Quality and Treatment: Mt Barker, SA, Australia, 2008. [Google Scholar]
  10. Pham, T.; Ngo, H.; Guo, W.; Dung Dang, H.P.; Mainali, B.; Johnston, A.; Listowski, A. Responses of community to the possible use of recycled water for washing machines: A case study in Sydney, Australia. Resour. Conserv. Recycl. 2011, 55, 535–540. [Google Scholar] [CrossRef]
  11. Willis, R.M. Residential Water End Use Consumptions Analysis: An Investigation of the Water Savings Attributed to Demand Management Strategies and Dual Reticulated Recycled Water Systems. Ph.D. Dissertation, Griffith University, Gold Coast, Australia, 2010. [Google Scholar]
  12. Stewart, R.A. Verifying the End Use Potable Water Savings From Contemporary Residential Water Supply Schemes; Waterlines Report for the National Water Commission: Gold Coast, Australia, 2011. [Google Scholar]
  13. Willis, R.M.; Stewart, R.A.; Williams, P.; Hacker, C.; Emmonds, S.; Capati, G. Residential potable and recycled water end uses in a dual reticulated supply system. Desalination 2011, 272, 201–211. [Google Scholar] [CrossRef]