Article

Nutrient Content at the Sediment-Water Interface of Tile-Fed Agricultural Drainage Ditches

1
Department of Agricultural and Biological Engineering, Purdue University, 225 South University Street, West Lafayette, IN 47907-2093, USA
2
National Soil Erosion Research Laboratory, USDA-ARS, 275 S. Russell Street, West Lafayette, IN 47907-2093, USA
*
Author to whom correspondence should be addressed.
Water 2010, 2(3), 411-428; https://doi.org/10.3390/w2030411
Submission received: 9 July 2010 / Revised: 3 August 2010 / Accepted: 10 August 2010 / Published: 12 August 2010

Abstract

:
Extensive network of tile drains present in the Midwest USA accelerate losses of nutrients to receiving ditches, rivers and eventually to the Gulf of Mexico. Nutrient inputs from agricultural watersheds and their role in affecting water quality have received increased attention recently; however, benthic sediment-nutrient interactions in tile-fed drainage ditches is still a matter of active research in consideration to nutrient discharge from tile drains. In this study, phosphorus (P) and nitrogen (N) contents and variability of nutrient retention ability of benthic sediments upstream and downstream from tile drain outlets were evaluated in managed agricultural drainage ditches in Indiana. Sediment samples were collected every three months upstream and downstream from selected tile drains in three ditches in northwest Indiana. Sediment equilibrium P concentrations (EPC0) were measured to examine P adsorption-desorption and equilibrium characteristics of benthic sediments in the ditches. P sorption index (PSI), exchangeable P (ExP), and exchangeable NH4+-N (ExN) were measured to evaluate nutrient retention ability and readily available nutrient content of benthic sediments. Results indicated a dynamic interaction between benthic sediment and overlying water column where sediments were acting as a sink or a source of P. There were no differences in nutrient retention ability between sediments collected upstream and sediments collected downstream from the selected tile drains. While the data, except for ExN, was comparable to reported values by previous studies in Indiana’s drainage ditches, there was no particular seasonal pattern in the content of exchangeable nutrient content in sediments at all three sites. This study also suggested that nutrient uptake by benthic sediments in these drainage ditches is not always efficient; therefore watershed management should focus on minimizing the delivery of nutrients into ditches while maintaining their drainage functionality.

1. Introduction

Tile-fed drainage ditches are common water management practices in the Midwestern United States. Tile drains serve as waterways that efficiently transfer water from agricultural fields into the receiving ditches. Recently, nutrient transport from agricultural drainage ditches to receiving water bodies has received greater attention [1,2,3,4]. For example, Alexander [5] reported that agricultural watersheds in the Midwest are principal sources of nitrogen (N) and phosphorus (P) losses to the Gulf of Mexico.
Several agricultural landscapes were reported to have high levels of P due to manure or fertilizer applications that could impact the surrounding water bodies [6,7]. Despite efforts to control the application of fertilizers on at-risk fields of P losses [8], P transport to drainage ditches remain a concern [2,4,9]. The transport and storage of P in drainage ditches involve complex biogeochemical processes [3,10]. Of all the components that affect nutrient dynamics and transport in aquatic ecosystems, benthic sediments are probably the most influential determinant of the ability of the system to process and sustain nutrient loads, especially P [7,11,12]. Sediments play an active role in inorganic P uptake and may potentially control P concentrations in the overlying water column [1,12,13]. When sediments from agricultural ditches were extracted and compared with sediments from forested ditches and combined forest-agricultural ditches, agricultural ditch sediments showed elevated P contents [3,6]. P in benthic sediments constantly interact with the overlying water column in a way that benthic sediments could act as sinks or sources of P in the stream [12,14]. The ability of benthic sediments to adsorb P from the water column has been shown to have a strong correlation with particle size [1,15]. Other processes such as hydrology can also influence P transport and concentration in drainage ditches [3,16]. Drainage ditch ecosystems are highly sensitive to variability in flow conditions [17] and increased P export from uplands has been associated with high flow regimes [2,18,19]. Previous studies have reported little retention of P downstream from P input points, including confined animal feeding operations (CAFO’s) and wastewater treatment plants [20,21,22].
Agricultural ditches receiving tile drainage inputs are also considered to be important pathways to N losses to receiving streams [4]. Although small size streams have reportedly greater N removal potential [23], drainage ditches have been identified as significant contributors of downstream N transport [24,25,26], due primarily to runoff from agricultural soils [27,28]. Sediments in drainage ditches could act as a sink or source of ammonium (NH4+-N) and nitrate (NO3-N); hence affecting assimilation of N in the ditches. For example, NO3-N concentrations in the upper Midwest agricultural drainage watersheds are reportedly among the highest in the nation [29]. Studies showed that the uptake of NO3-N in these N-rich tile drainage systems has seemingly reached saturation [24]. Tiles draining surrounding fields in Indiana agricultural landscapes significantly contribute to N delivery to the receiving ditches [26,30].
Previous studies have reported that high concentrations of nutrients generally associated with tile-fed drainage ditches from the Midwest could easily be transported to downstream surface waters [31,32,33]. Similar results have been reported for the impact of point source discharge on stream nutrient retention, where little sorption capacity is reported for sediment below point sources as compared to those upstream [20,34]. However, the ability of sediments to retain nutrients downstream from tile drain effluent is not well understood and more investigations is still needed to understand interactions between sediments and overlying water in tile-fed drainage ditches.
This study was conducted to evaluate sediment-water interactions upstream and downstream from tile drain outlets in three tile-fed agricultural drainage ditches in northwest Indiana. The specific objectives were to determine (1) if benthic sediments were in equilibrium with water column TDP; (2) if sediment ability to retain P varied upstream and downstream from tile drain outlets; and (3) if seasonal variability existed in easily exchangeable nutrient (P and N) content of the benthic sediments.

2. Experiments

2.1. Study Site

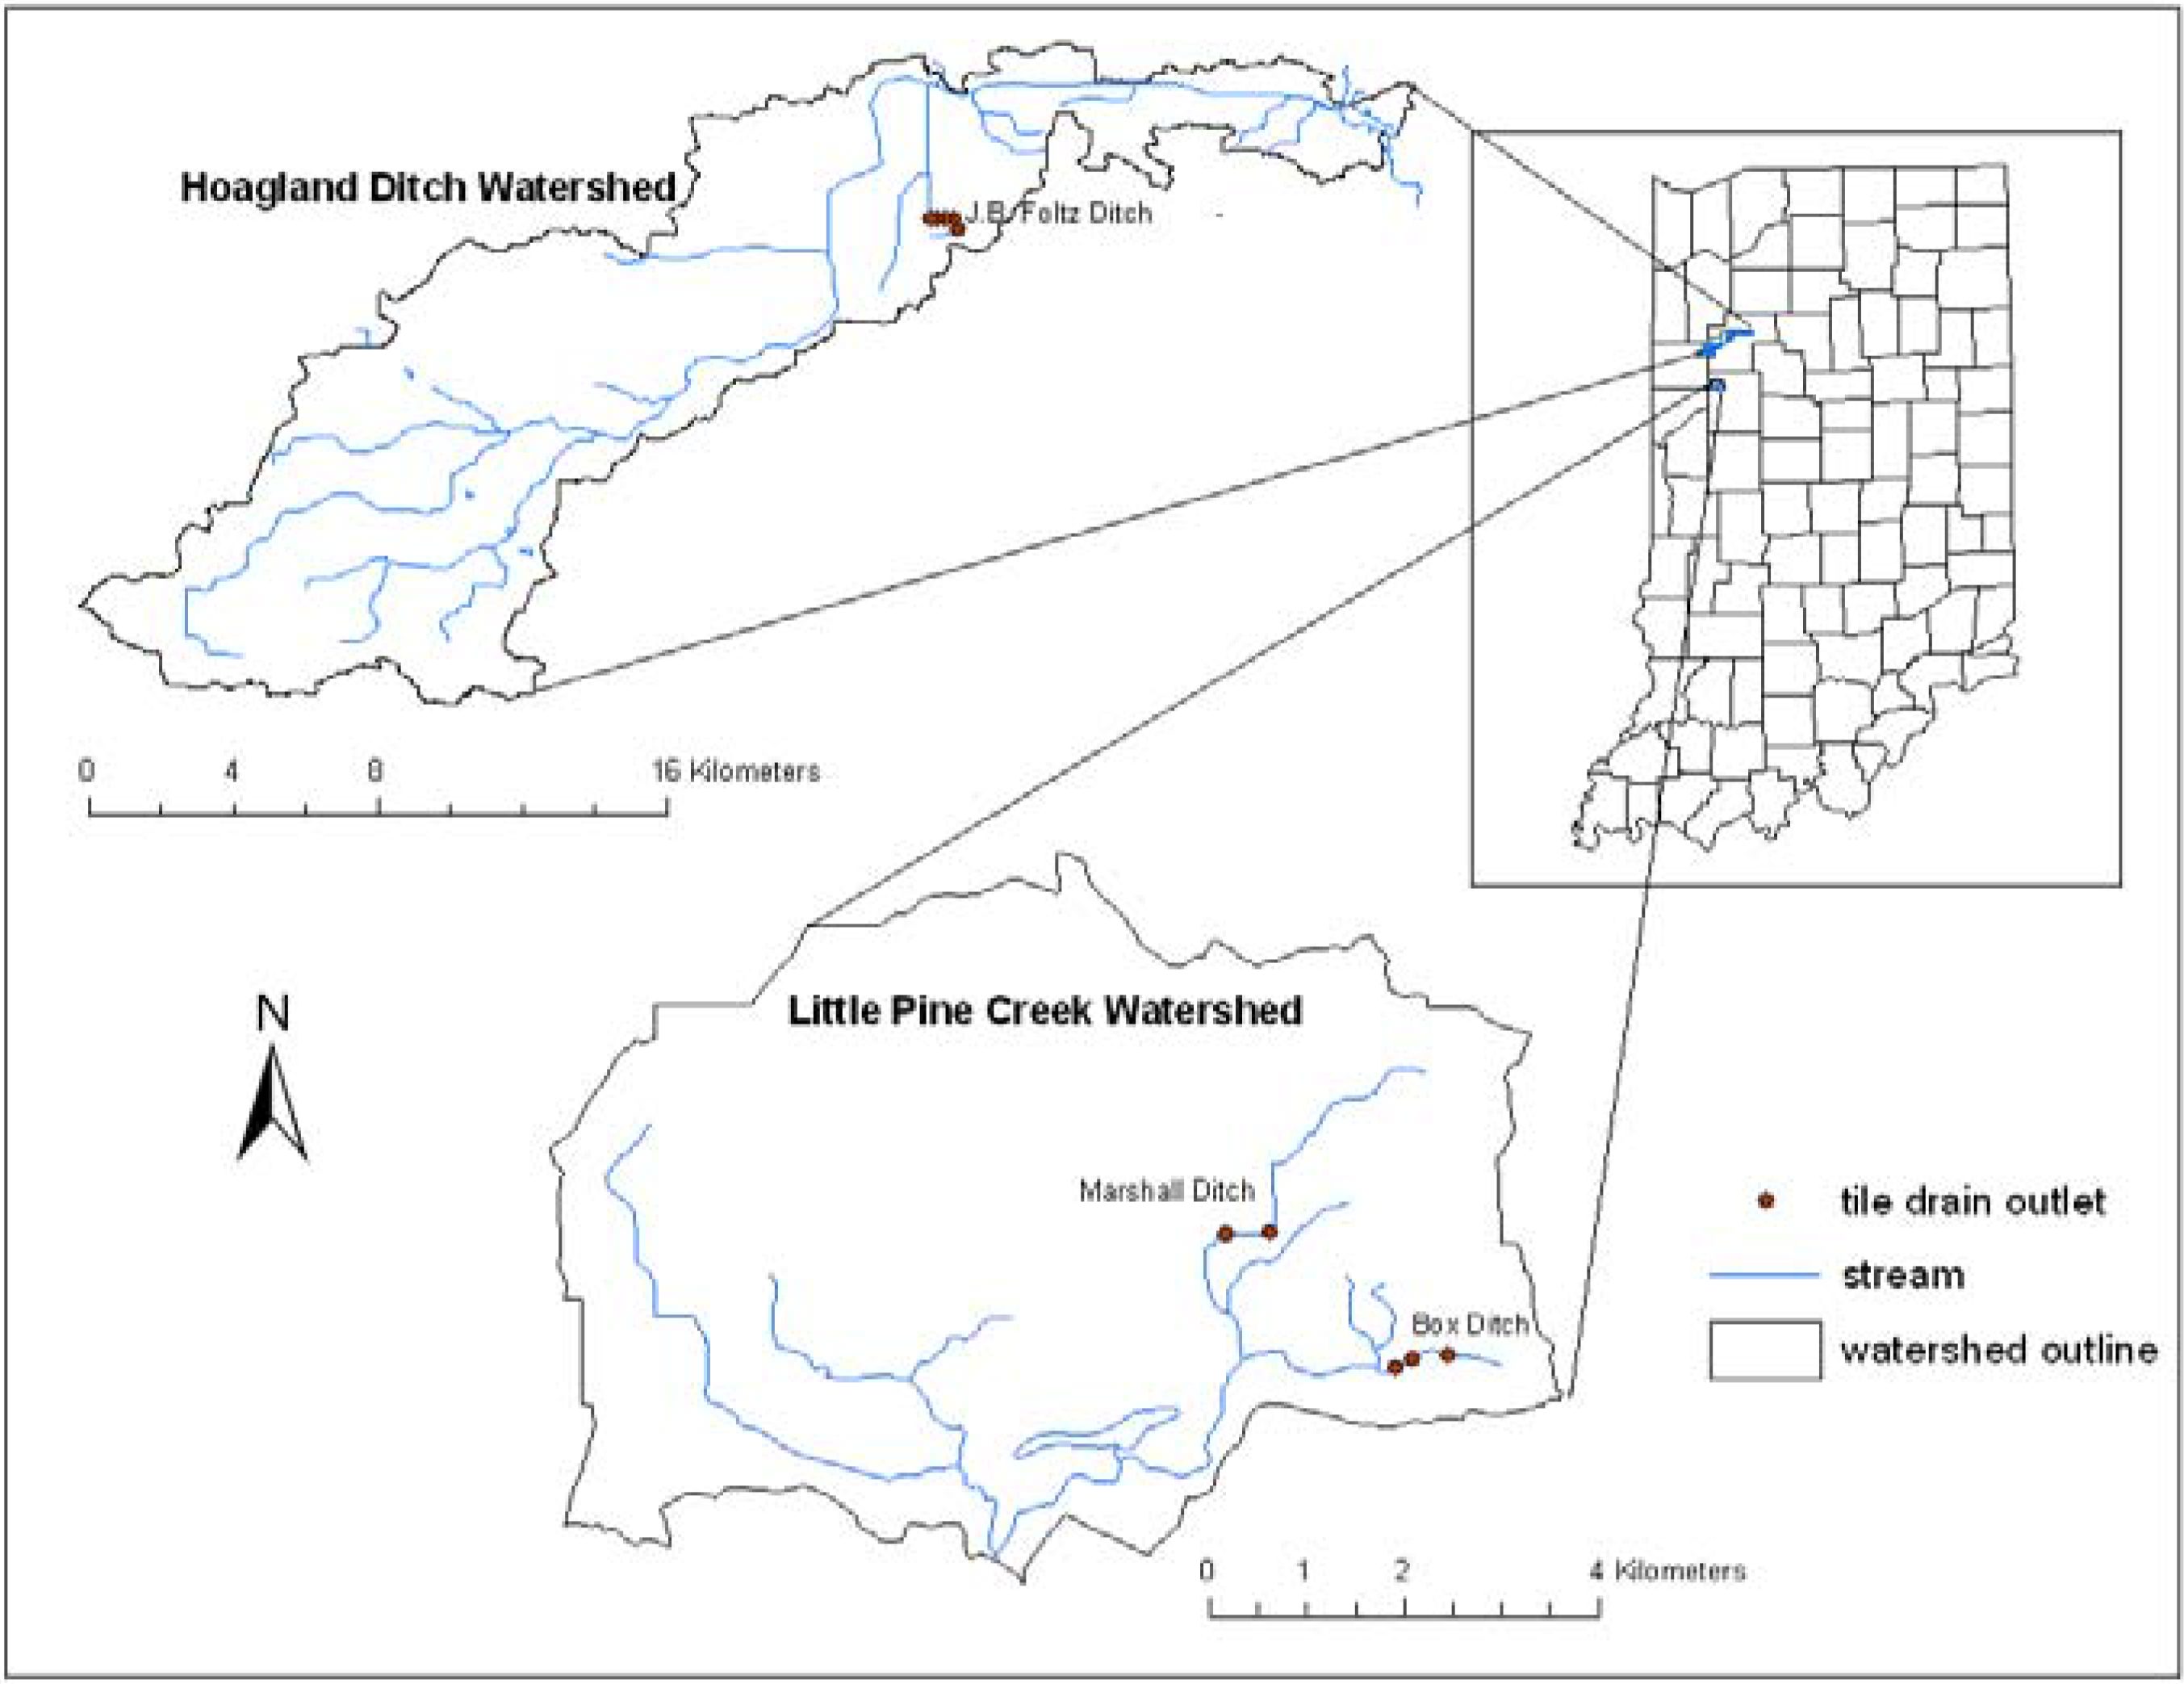
Three drainage ditches in northwest Indiana were selected for this study: J.B. Foltz Ditch near Reynolds, and Box Ditch and Marshall Ditch near West Lafayette, Indiana, USA. The J.B. Foltz Ditch is a headwater stream of Hoagland Ditch watershed which drains parts of Benton, Jasper and White Counties in Indiana (Figure 1). The ditch drains about 8 km2 into Minch ditch and has not been dredged for many years. The study area, which drains about 1.5 km2, is mostly vegetated. In summer the riparian area of the ditch typically gets invaded by tall big bluestem (Andropogon gerardii), indian grass (Sorghastrum), and switchgrass (Panicum virgatum) with a mean height of 1.3 m. The area drained by the ditch is highly agricultural and dominated by very poorly (71%) to poorly drained (18%) soils with an average slope less than 0.6% [35]. Corn-soybean rotation under no-till row crop is mainly practiced in the drained area of the ditch. Primary soils in the contributing area of the study reach are Gilford sandy loam (coarse-loamy, mixed, superactive, mesic Typic Endoaquolls) and Rensselaer loam (fine-loamy, mixed, superactive, mesic Typic Argiaquolls) with an elevation ranging from 233 to 250 m. These two soils are usually dark in color, friable and have moderate fine granular structure and smooth boundary. The land use is primarily corn and soybean (93%) followed by a combination of low density residential areas, pasture and grass (7%).
The Box Ditch and the Marshall Ditch are located in Little Pine Creek watershed located in northwest Tippecanoe County, Indiana (Figure 1). The watershed area for the Little Pine Creek is 53.3 km2. Marshall Ditch and Box Ditch are both headwaters of the Little Pine Creek and drain approximately 8.0 km2 each. Low density residential area (10%), and agricultural and livestock (90%) are the principal land uses in the watershed. Corn and soybean, with 2-year crop rotation, planted primarily under no-till conditions, are the primary cultivated crops in areas of the watershed drained by the ditches. Portions of the agricultural fields located in the Marshall Ditch watershed are periodically irrigated with effluent from a swine lagoon located in the watershed. Major soils in the contributing area are Drummer silty clay loam (fine-silty, mixed, superactive, mesic Typic Endoaquolls) and Toronto silt loam (fine-silty, mixed, superactive, mesic Typic Endoaquolls) with 0–2% slope and an elevation ranging from 218 to 223 m. Drummer soils are dark gray and have fine granular structure. Toronto soils, which are more abundant in the Box Ditch, are friable and have medium granular structure with smooth boundary.
Figure 1. Locations of study sites in Hoagland Ditch and Little Pine Creek watersheds.
Water 02 00411 g001

2.2. Field Techniques

Tile drain outlets discharge into drainage ditches somewhat at regular spatial intervals. However, the accessible portion of some of the studied ditches has limited number of tile outlets. To have a relatively equal number of outlets and a reasonable study reach for the three ditches, a distance of ≥200 m between two outlets was used as criteria to select the tile outlets. There were 4 outlets in Box Ditch, 5 in J.B. Foltz Ditch, and 2 in Marshall Ditch (Table 1). Outlets 1 and 2 in Box Ditch were considered as a single outlet owing to their close proximity (Table 1). Sediments were collected approximately 5 m upstream and 5 m downstream of each selected tile outlet once every three months from July 2007 to July 2008, corresponding to winter (Jan–Mar), spring (Apr–Jun), fall (Oct–Dec), and summer (Jul–Sep).
Three replicates of sediment samples were collected at each sampling point, starting with the most downstream location and moving successively to upstream sampling locations to avoid the impacts of sediment disturbance downstream. Samples were collected once every three months at each sampling station. Sediments were gently removed from the top 2–10 cm of the stream bed with a trowel and placed into plastic ziploc freezer bags. About 2 L of unfiltered ditch water was also collected from the center of the ditch in a nalgene bottle at the sampling point prior to sediment sampling. During each sampling event, pH was measured using Chek-Mite pH-15 Sensor, conductivity, dissolved oxygen, salinity, and temperature were measured using conductivity meter 115A plus (YSI Model 85, Yellow Springs, OH) in the water column at the sampling point. Sediment and water samples were stored on ice in the dark for approximately 45 min until transported to the laboratory.
Immediately after returning to the laboratory, sediment extractions were performed. The 2 L of unfiltered ditch water was filtered using vacuum filtration system with a 0.45 µm nylon membrane filter. 60 mL of the filtered water was used to analyze water column P concentration and the remaining volume was used in the techniques described in the following section.
Table 1. Drainage ditches showing global positioning system coordinates of selected drain tile outlets and respective distances from the most upstream tile outlet within each ditch.
DitchTile outletDiameter (cm)LongitudeLatitudeDistance (m)
Box Ditch, Reynolds, IN1a183W 86º 59.899N 40º 29.6590
223W 86º 59.897N 40º 29.6587
323W 87º 00.114N 40º 29.668336
423W 87º 00.269N 40º 29.593456
J.B. Foltz Ditch, West Lafayette, IN117W 86º 55.215N 40º 46.8680
215W 86º 55.295N 40º 47.020385
320W 86º 55.464N 40º 47.017621
420W 86º 55.608N 40º 47.010826
520W 86º 55.756N 40º 47.0061,036
Marshall Ditch, West Lafayette, IN136W 87º 01.186N 40º 30.3510
2b31W 87º 01.506N 40º 30.336431
1a : small ditch entering the main ditch through a pipe
2b: conventional weir flow control structure with circular spillway

2.3. Laboratory Techniques

Previous studies have quantified sediment-nutrient interactions using P sorption index (PSI), sediment equilibrium phosphorus concentration (EPC0), and easily exchangeable P (ExP), and easily exchangeable N [36,37,38]. Original or modified methods have been used in previous investigations to measure EPC0, PSI, ExP, and ExN in sediments [38,39,40,41,42,43,44,45]. The method adopted in this study is a modified approach of these methods. Sediment EPC0 was determined by spiking 5 separate 100 mL filtered ditch water with 0, 5, 10, 20, 50, 500 and 1,000 mg L-1 of additional P such that if the ambient concentration is 0.15 mg L-1, the initial series of P solutions would contain 0.15, 0.16, 0.17, 0.19, 0.25, 1.15 and 2.15 mg L-1. Each solution was added to approximately 25 g of wet sediment in a 250 mL Erlenmeyer flask. The flasks were shaken at 120 oscillations min-1 for 1 hour with an automatic shaker. At 15 min interval the flasks were vigorously shaken manually and replaced back on the shaker to assure thorough mixing of sediments with the solution. At the end of the hour, the flasks were removed from the shaker and the contents were allowed to settle for at least 45 min. The supernatant of each flask was filtered manually using a 30 mL HDPE syringe and a 0.45µm nylon filter membrane into a pre-labeled 60 mL nalgene bottle. These extracts were preserved at pH < 2 with sulfuric acid and stored at 4 °C until analyzed for Total Dissolved P (TDP) using inductively coupled plasma-optical emission spectrometry (ICP-OES, Optima 2000 DV, Norwalk, CT). The limitation of this matrix is that TDP is comprised of other forms of P that can interfere, such as polyphosphates, colloidal P, and dissolved hydrolysable P filterable through 0.45 µm membrane [46,47]. The remaining sediment slurry was transferred to tared and pre-labeled aluminum pans and dried at 80 °C for 48 h in an oven (VWR Model 1370 GM) to determine sediment dry mass. The amount of P sorbed was plotted against the initial concentration of P in each soil solution and the sediment EPC0 was estimated as the x-intercept of the regression line [38,39,40]. Sediment EPC0 is an equilibrium concentration at which the net exchange rate of P between benthic sediments and the water column is negligible [12,37,40]. Comparisons between sediment EPC0 and dissolved P in the water column helps describe if sediments act as sinks, and theoretically remove P from the water column, or as sources, and theoretically release P into the water column [15,48]. Dynamic equilibrium between sediments and the ditch water was defined by sediment EPC0 within ±20% of TDP concentrations in the water column [36].
The PSI indicates the ability of benthic sediments to adsorb P. Phosphorus sorption index is a unitless measure of the ability of benthic sediments to adsorb water column P [40,41,49]. High PSI value indicates a high ability of sediments to remove P from the water column [18]. The PSI was estimated by spiking 100 mL of filtered ditch water with additional 2 mg L-1 of P. This solution was added to approximately 25 g of wet sediment in a 250 mL Erlenmeyer flask. An extraction procedure similar to the sediment EPC0 determination was performed and the extracts were analyzed by ICP-OES. The PSI was calculated using the following equation [15,40,41]:
P S I = X P log C P
where XP was the amount of P sorbed (mg kg-1 of dry sediments) from the initial concentration of 2 mg L-1, and CP was the final P concentration (mg L-1) in the solution after one hour.
Moreover, the readily available P in the benthic sediment could be assessed by the measure of ExP content in sediments. The ExP content in sediments is the amount of P loosely bound to benthic sediments and readily available for release from sediments into the water column [12,37]. The ExP was determined by adding 100 mL of 1M of MgCl2 to approximately 25 g of wet sediment in a 250 mL Erlenmeyer flask followed by an extraction similar to the sediment EPC0 and PSI described above. The extracts were analyzed by ICP-OES and the exchangeable P content was calculated as mg kg-1 of P dry sediments [38,43]:
E x P = ( P   ( μ g   L - 1 ) ) × 0.1 L dry   sediment   mass
Similar to ExP, ExN provides information on the amount of N that is loosely sorbed to benthic sediments with the potential to influence N concentrations in the water column. The ExN was estimated by adding 100 mL of 2M of KCl to approximately 25 g of wet sediment in a 250 mL Erlenmeyer flask [42,44,45]. The samples were prepared in triplicate following similar extraction steps. The extracts were analyzed for ammonium (NH4+-N) by the reaction of alkaline phenate with hypochlorite and sodium nitroprusside (indophenol blue) method (EPA-103-A; Analyzer AQ2+, Milwaukee, WI). The exchangeable N content was calculated as mg kg-1 of NH4+-N dry sediments [50]:
E x N = ( N H 4 + - N   (   μ g   L - 1 ) ) × 0.1 L dry   sediment   mass
To avoid any interference in the analysis of the extracts for these 4 parameters discussed above, the same matrix was used to make standards for analysis on ICP-OES or AQ2+ analyzer.

2.4. Statistics

Three-way ANOVA was used to compare mean differences between sediment EPC0 and TDP concentrations across study sites and seasons in the ditches, and to evaluate P uptake by sediments collected upstream and downstream from tile outlets. Seasonal variation in sediment contents of easily exchangeable nutrient was assessed using two-way ANOVA. The statistical package, SAS (2003) [51] was used for the analysis. All variables were log-transformed and a significance level of 0.10 was used for all tests.

3. Results and Discussion

3.1. Chemical Characteristics of the Ditch Water Column

Average physico-chemical characteristics of ditch water measured during sampling events for the three ditches are shown in Table 2. The average pH varied between 7.7 and 8.2, but did not fluctuate drastically across sampling events and sites. This was comparable to the range of 6.5–9.0 published by Indiana Administrative Code [52]. Salinity was also consistent across sampling events and sites, ranging from 0.2–0.4 g kg-1. Dissolved oxygen (DO) and temperature were inversely correlated in these ditches (p = 0.0136). Measured DO concentration was lower in summer months, compared to DO in cold months. The depletion of oxygen level during summer could possibly be the influence of biological activities and reduced oxygen gas solubility supported by the warmer temperature. Moreover, the total amount of oxygen present in the ditch water may be limited by the warmer temperature. As water becomes warmer DO holding capacity of water decreases due to rapid saturation. Water temperature at the three study sites followed the general trend of seasonal temperature fluctuations in natural waters and did not show any abnormal temperature changes. Even though conductivity recorded across sites and sampling events was highly variable, the lowest conductivity values were measured during the winter months and the highest conductivity values were measured in summer months. Increased discharge from tile drains during cold months due to snow melt and rainfall-runoff could cause dilution in the ditches and lower the conductivity.
Table 2. Average chemical characteristics of the ditch water column recorded prior to sediment sampling for extraction.
SeasonDitchpHSalinityDOCondTemp
(g kg-1)(mg L-1)(µS)(°C)
Jan-Mar
(Winter)Box7.90.36.73291.10
J.B. Foltz7.80.35.53433.03
Marshall7.30.36.53241.57
Apr-Jun
(Spring)Box8.20.33.842311.1
J.B. Foltz7.70.22.146220.2
Marshall8.00.34.44268.37
Jul-Sep
(Summer)Box7.70.33.650919.0
J.B. Foltz8.10.35.953723.8
Marshall8.00.44.666414.8
Oct-Dec
(Fall)Box8.00.38.53253.82
J.B. Foltz7.90.38.93466.69
Marshall7.90.25.63853.71

3.2. Sediment Equilibrium Characteristics

Overall, average sediment EPC0 varied between 0.05 and 0.11 mg L-1 in Box Ditch, 0.03 and 6.2 mg L-1 in J.B. Foltz Ditch, and 0.05 and 0.08 mg L-1 in Marshall Ditch, respectively (Table 3). While the values in the Box and the Marshall ditches were consistent with data published for other Indiana drainage ditches, sediment EPC0 in J.B. Foltz Ditch were much higher than the reported range of 0.02 to 0.11 mg L-1 for the Midwest drainage ditches [1,14]. However, Vaughan [53] has reported sediment EPC0 to range from 0.01 to 0.5 mg L-1 in Maryland. Previous research reported a strong correlation between EPC0 and ExP in effluent dominated natural streams [54]; however, EPC0 and ExP contents within seasons in J.B. Foltz Ditch did not show any correlation. It is possible that the high value of EPC0 may have contributed to the lack of correlation. When the data from individual ditches were pooled together, the lack of correlation between EPC0 and ExP could also be the influence of high EPC0 values in J.B. Foltz Ditch. It is also unknown why EPC0 values in J.B. Foltz Ditch were high. If not due to outliers (r2 = 0.30, Table 3), these high values could possibly be the results of greater P loadings to this particular ditch during summer. Two additional tile outlets were installed within 10 cm from the original outlet for experimental purposes by another group of researchers and the presence of these three tile outlets at the same location could likely increase P loading to the ditch. Increased P loading has been linked to elevated sediment EPC0 in natural streams [54].
Table 3. Mean and standard deviation of EPC0 and TDP concentrations, and significance of EPC0 estimation in the three ditches during the study period. An Asterisk (*) indicates that there is a significant difference between EPC0 and TDP concentrations.
EPC0TDP
(mg L–1)(mg L–1 )
MeanSDr2 rangep–valueMeanSD
Jan–Mar
Box0.130.020.24–0.940.090.100.02
J.B. Foltz0.030.010.50–0.990.0050.030.02
Marshall0.050.010.41–0.99<0.080.060.02
Apr–Jun
Box0.11*0.030.50–0.99<0.060.03*0.01
J.B. Foltz0.06*0.030.60–0.98<0.050.12*0.08
Marshall0.05*0.010.89–0.99<0.020.03*0.00
Jul–Sep
Box0.05*0.010.90–0.990.010.11*0.05
J.B. Foltz6.20*9.330.08–0.990.75*0.80
Marshall0.080.010.96–0.99<0.0030.080.02
Oct–Dec
Box0.210.110.41–0.990.090.170.09
J.B. Foltz0.04*0.010.87–0.990.020.09*0.05
Marshall0.06*0.000.45–0.99<0.040.16*0.03
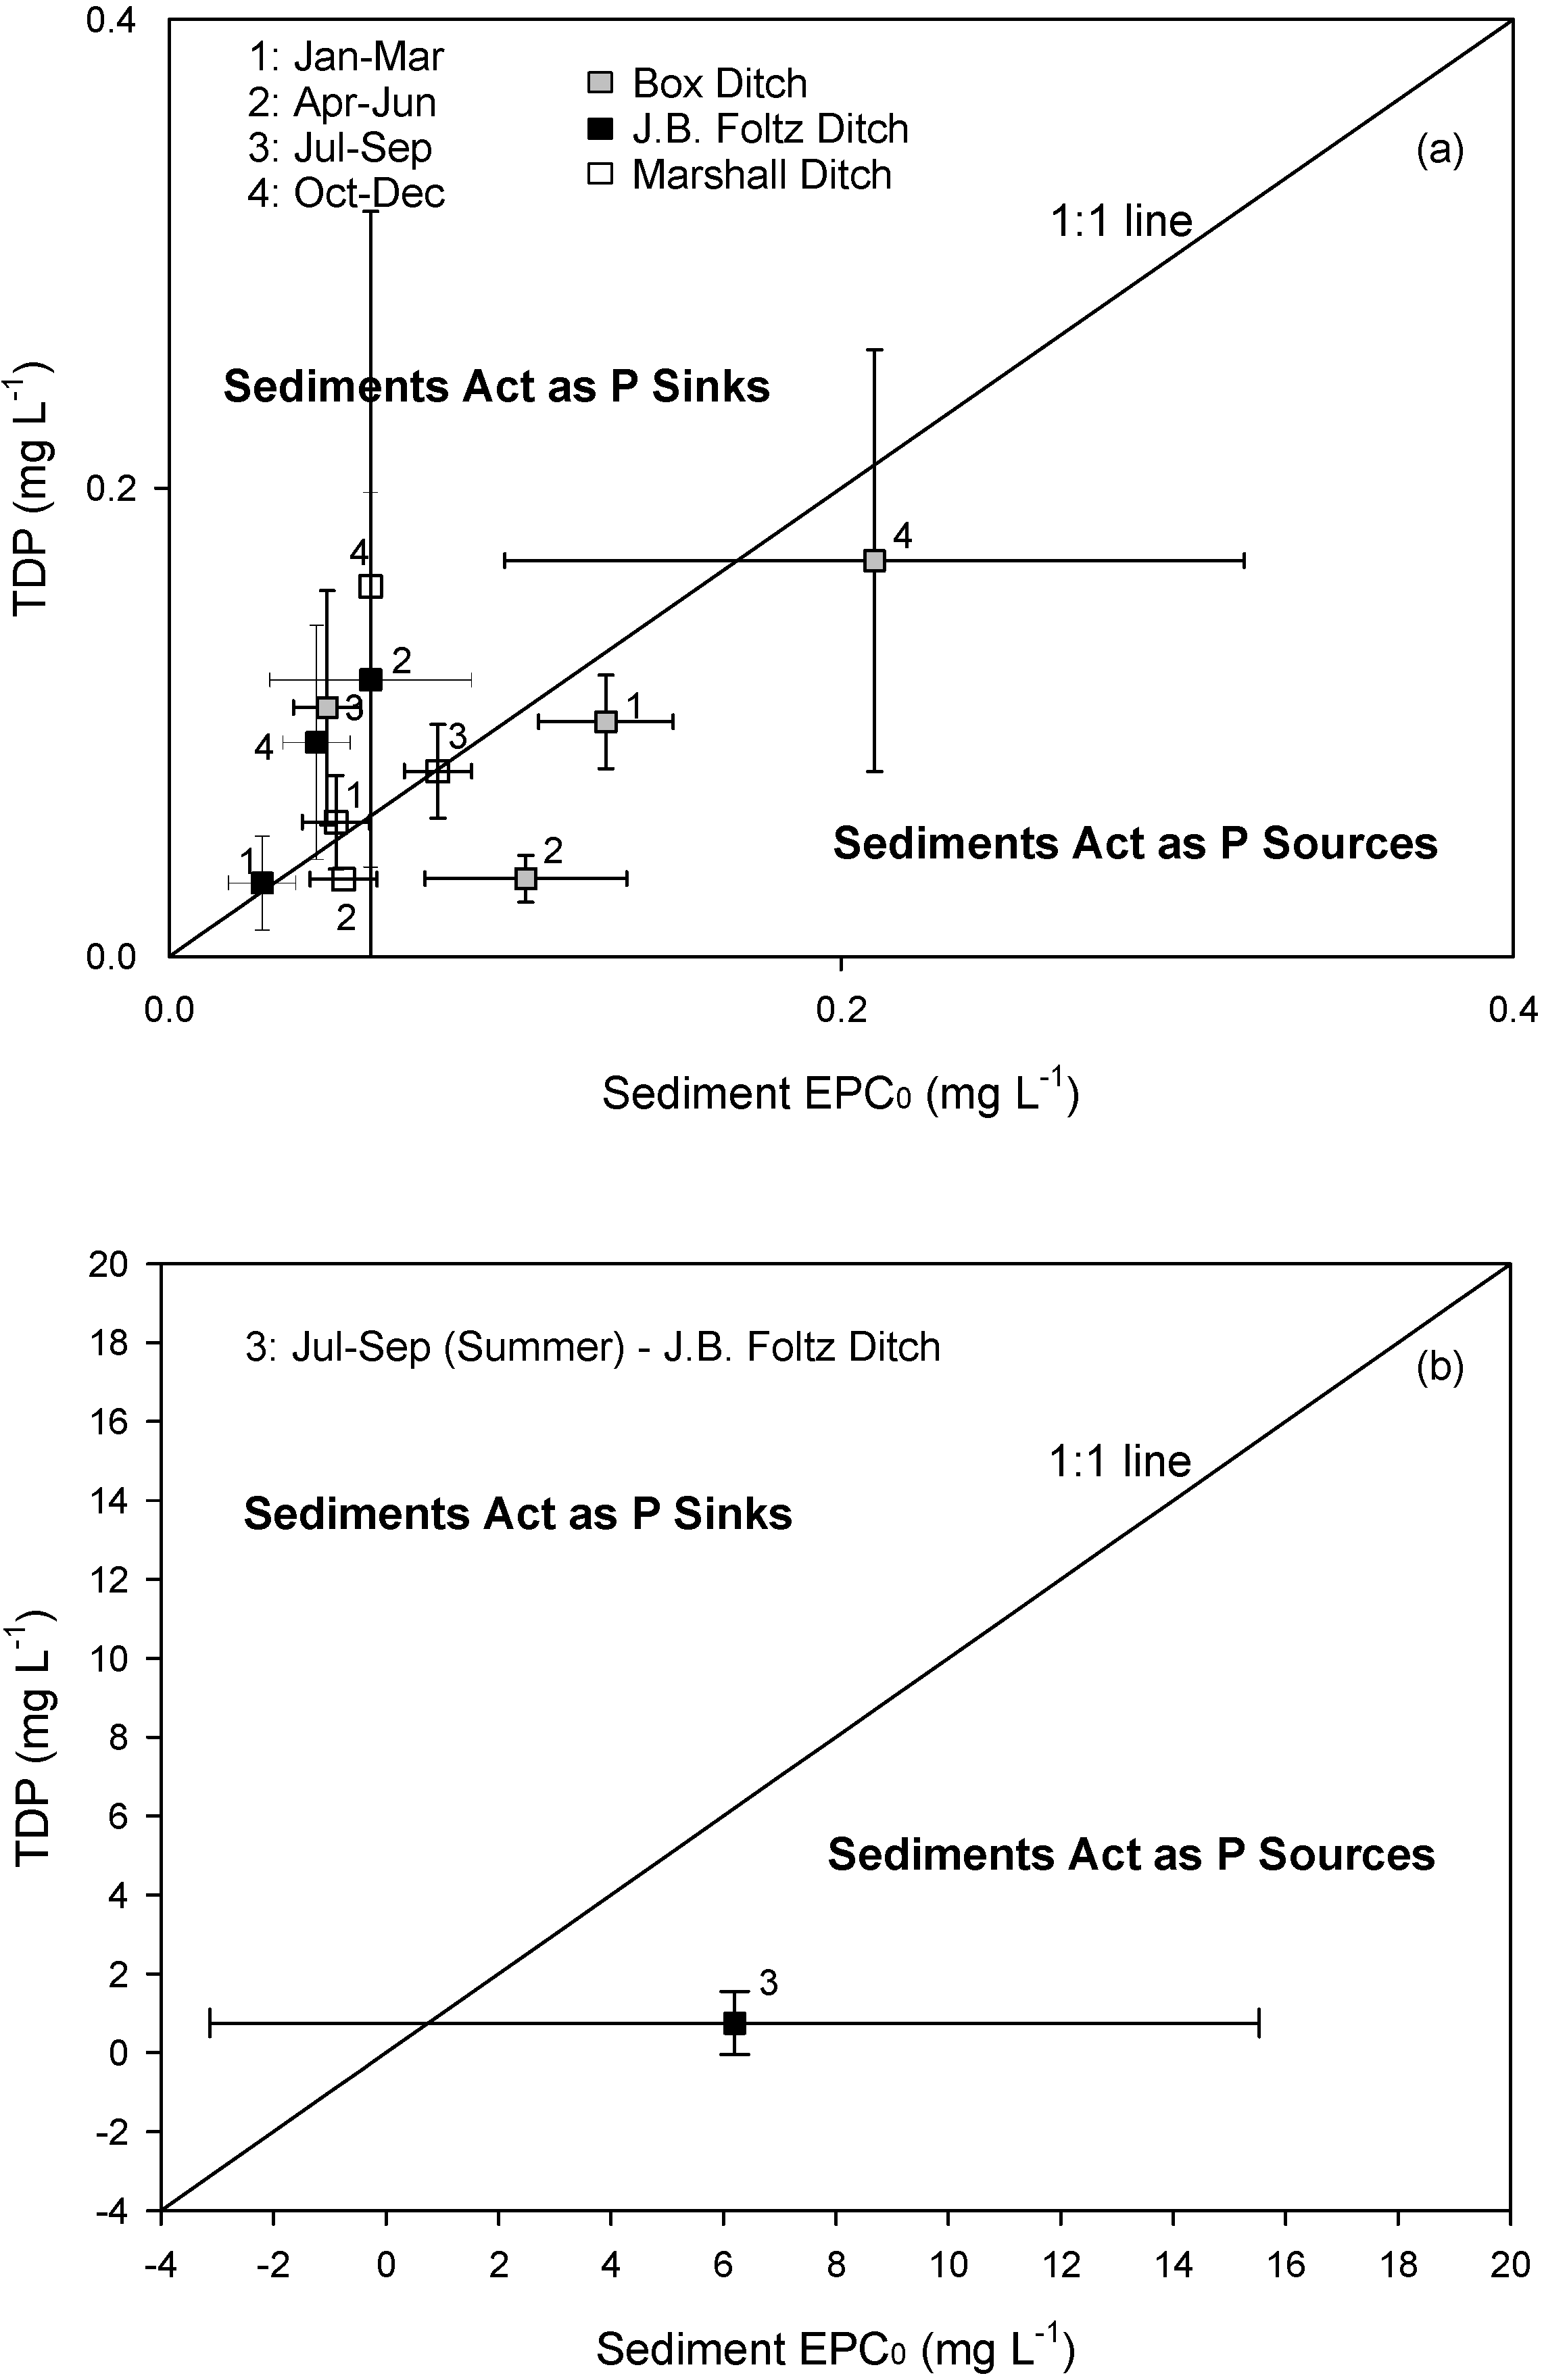
Even though sediment EPC0 and TDP concentrations tend to be higher during low flow conditions [3], and lower during winter when flow are generally greater [55], the sink-source relationship between sediments and water column TDP in these ditches did not exhibit any clear pattern. Possible reasons for this lack of patterns could include land management practices (e.g., animal manure and fertilizer application rates and timings) and rainfall-runoff characteristics that relate landscape influence on P inputs to the ditches; variability in nutrient inputs from tile outlets; ditch morphology; or ditch water velocity. Sediment EPC0 and sediment adsorption/desorption behavior could be influenced by many factors in stream environments [54]. Additional studies (unpublished) conducted during parts of the study period to compare nutrient concentrations in the ditch water to nutrient concentrations at tile outlets, showed a varying pattern of P losses in tile effluent. Though a few data points with a wide range of error, sediment EPC0 measurements, with ±20% cut-off limit [55], indicate that sediments were acting as both source and sink of P during different time of the year, or were in equilibrium with the overlying water column TDP concentrations (Figure 2). High sediment EPC0 values in agricultural drainage ditches indicate that sediments could potentially act as P sources [3]. The unstable sink, source, or equilibrium behavior of sediments in these ditches could be the results of a combination of factors such as tile drain discharge, overland flow, groundwater or sediments themselves. Organic matter content and particle size of sediments could also play a crucial role in sediment-nutrient interactions [19,38].
Figure 2 shows that P could be easily transported through the drainage ditches during the period sediment EPC0 was in equilibrium with the overlying water column TDP concentrations. McDaniel [13] also reported that sediments did not significantly influence P loads in streams elsewhere in the Midwest. When upstream and downstream sediments from tile outlets were compared for equilibrium characteristics, there were no spatial variations in the sediment EPC0 (Table 4). The data indicates that sediments in the ditches already have elevated P content due to sustained P loads originating from agricultural fields. Therefore differences in sediment EPC0 could not be observed between sediment samples collected upstream and downstream from the tile outlets.
Table 4. Means and standard deviations of upstream and downstream from tile drain outlets EPC0 and TDP concentrations in the three ditches.
EPC0TDP
UpstreamDownstreamUpstreamDownstream
MeanSDMeanSDMeanSDMeanSD
Jan-Mar
Box0.1430.0100.1040.0000.1000.0200.1010.002
J.B. Foltz0.0250.0140.0270.0120.0270.0190.0360.018
Marshall0.0490.0180.0510.0000.0490.0060.0750.000
Apr-Jun
Box0.1070.0240.1040.0260.0330.0080.0330.011
J.B. Foltz0.0460.0200.0670.0290.1050.0880.1310.073
Marshall0.0520.0070.0510.0100.0320.0050.0360.001
Jul-Sep
Box0.0460.0100.0510.0000.1140.0400.0950.055
J.B. Foltz4.7760.9247.71410.9590.5800.7820.9110.908
Marshall0.0760.0040.0850.0020.0880.0210.0620.020
Oct-Dec
Box0.2520.0900.1440.0060.1590.0810.1840.079
J.B. Foltz0.0460.0190.0420.0100.0840.0580.0990.056
Marshall0.0630.0010.1090.0000.1400.0200.1940.010
Comparisons between sediment EPC0 and TDP concentrations indicated that sediments in Box Ditch acted as a P source during spring and as a P sink in Jul–Sep (p < 0.04; Figure 2). Sediment P was in equilibrium with ditch water TDP during Jan–Mar (+13%) and Oct–Dec (+11%). In J.B. Foltz Ditch, sediments seemed to absorb P from the water column during Apr–Jun and Oct–Dec (Figure 2). Sediment EPC0 in J.B. Foltz Ditch was in equilibrium with TDP concentrations in the ditch water during Jan–Mar. Sediments in Marshall Ditch acted as a P sink during Oct–Dec and as a P source during Apr–Jun (Figure 2). Sediments were in equilibrium with ditch water P during Jan–Mar and Jul–Sep (−9%). Except some differences, there were no particular spatial variations in the data when upstream and downstream sediments from tile outlets were compared for equilibrium characteristics (p > 0.10; Table 4). The source characteristic of sediments in Box Ditch and Marshall Ditch during Apr–Jun is comparable to previous studies [37]. Apr–Jun coincides with a period of high flow season in this region and elevated P in runoff resulted in the source characteristic of sediments. Sediments were in equilibrium with TDP concentrations during winter (Jan–Mar) in all three ditches.
Intra-seasonal comparisons across sites for overall mean EPC0 indicated that Box Ditch EPC0 was significantly lower than the observed EPC0 in the other two ditches during Jul–Sep (p < 0.01). EPC0 in Box Ditch was significantly greater than the observed EPC0 in the other two ditches during the other sampling periods (p < 0.02). These comparisons resulted in no significant differences in EPC0 between J.B. Foltz Ditch and Marshall Ditch.
Figure 2. Comparison of sediment EPC0 and water column TDP concentrations showing that sediments acted as sinks or sources of P or were in equilibrium with the overlying water column. The whiskers represent standard deviation from the measured data.
Water 02 00411 g002

3.3. Phosphorus Uptake of Upstream and Downstream Sediments
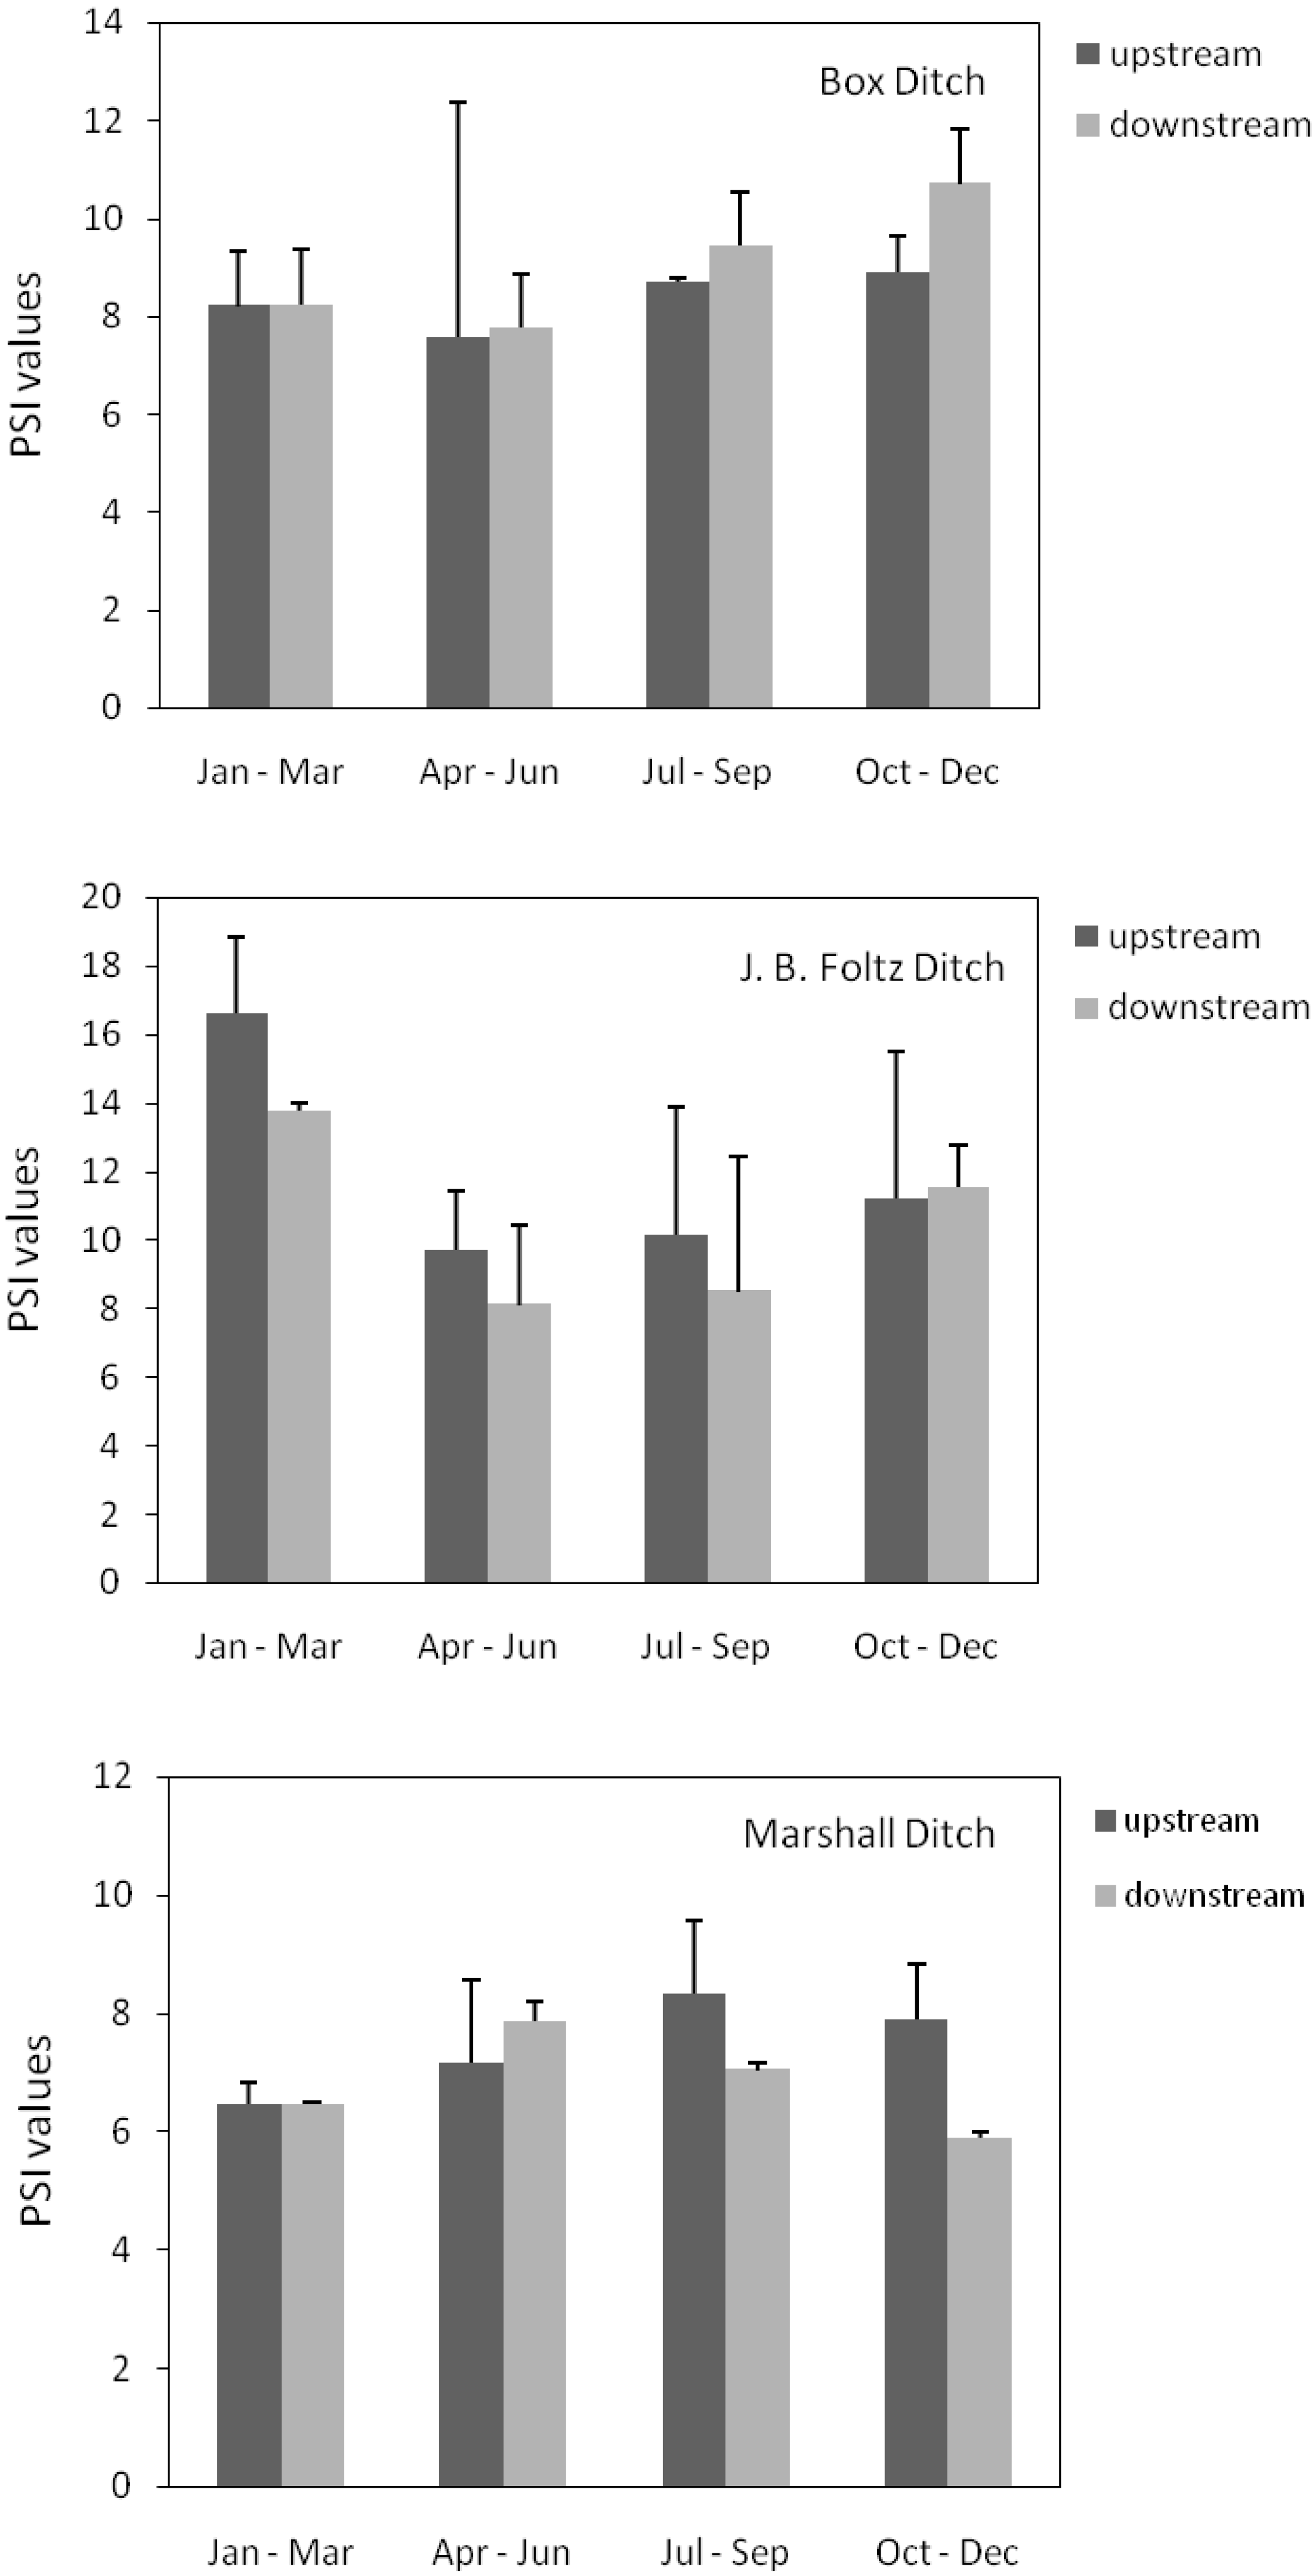
Overall, average PSI values in this study ranged from 7.7 to 9.6 in Box Ditch, from 8.9 to 15.2 in J.B. Foltz Ditch, and from 6.5 to 7.9 in Marshall Ditch, respectively (Figure 3). These mean values were comparable to the range of 2.7 to 13.8 published on Indiana drainage ditches [14]. Inter-seasonal comparisons of PSI within individual ditches resulted in significant variations only in Box Ditch where Jan–Mar, Oct–Dec, and Jul–Sep PSI were significantly higher than Apr–Jun PSI (p < 0.008). Based on previous investigations that have associated high nutrient losses from tile drains [30,31,32], increased P concentrations in downstream sediments from tile outlets were expected. Nonetheless there were no specific patterns and statistical differences detected in the ability of benthic sediments to adsorb P from the ditch water when sediments collected upstream and downstream of tile drains were compared (p > 0.10; Figure 3). This was likely due to high P storage in sediments of these ditches as mentioned in the discussion above. However, measured PSI values were similar to values reported for agricultural streams and consistent with the range of PSI values reported for other agricultural drainage ditches in Indiana [37,38,44,1]. This study indicates that sediments in drainage ditches could already have high P content due to high P loadings from surrounding fields to the drainage ditches. P inputs from tile drains, even in small amounts, would result in greater P concentrations in sediments over time. Therefore, further P losses from tile outlets will likely be transported efficiently through the drainage ditches and can impact eutrophication in downstream waters [33].
Figure 3. Ability for P uptake of upstream and downstream sediments from tile drains in the three ditches.
Water 02 00411 g003

3.4. Sediment Exchangeable Nutrient

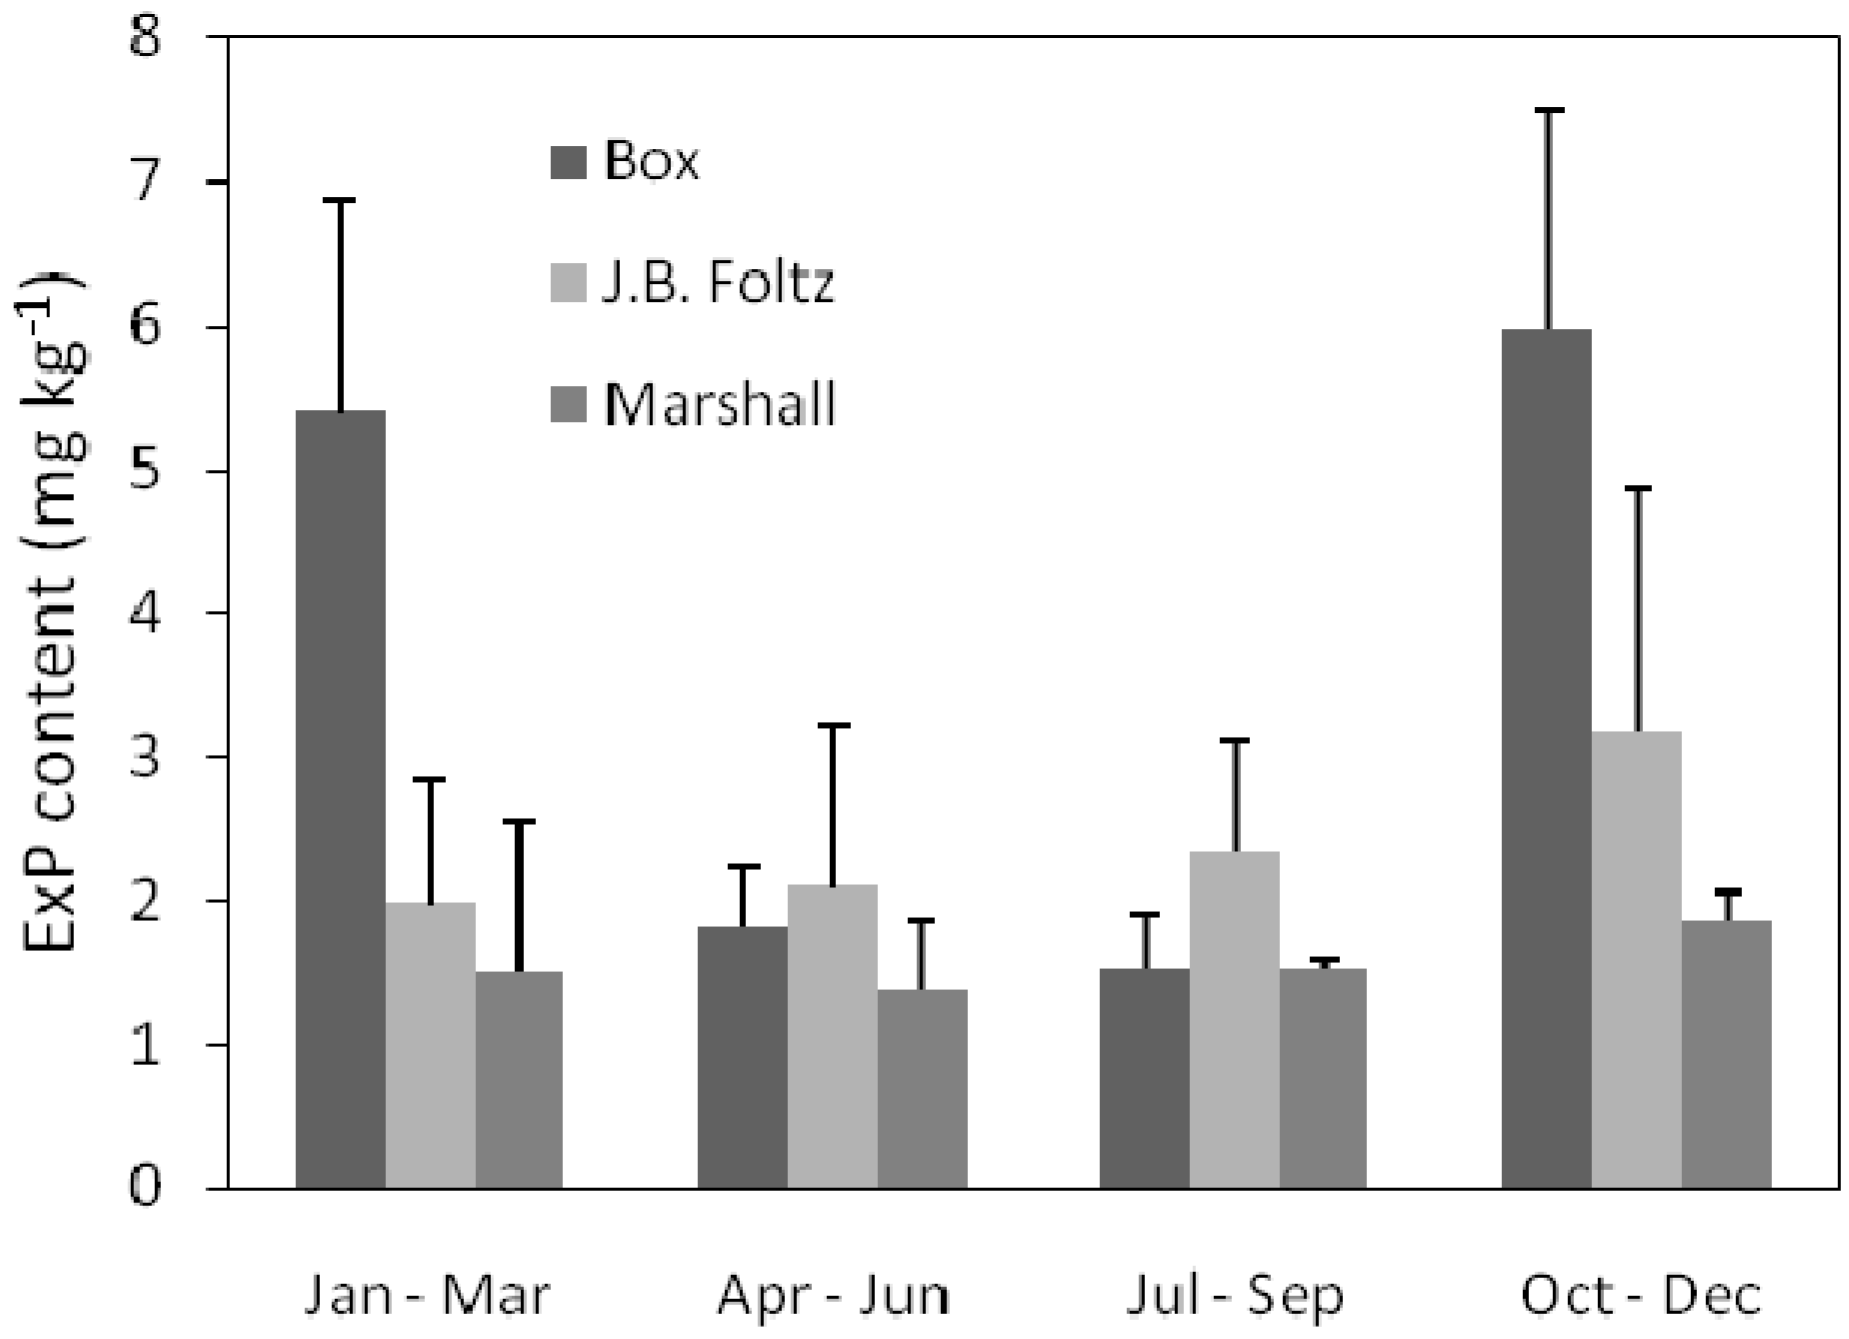
Average ExP values ranged from 1.51 to 5.98 mg kg−1 in Box Ditch, from 1.39 to 1.85 mg kg−1 in Marshall Ditch, and from 1.98 to 3.16 mg kg−1 in Foltz Ditch, respectively (Figure 4) and were consistent with the range of 0.5 to 9.35 mg kg−1 reported in drainage ditches from Indiana [1,14,56]. When the influence of tile discharge was evaluated for all 4 seasons in each ditch, results showed that overall ExP for Box Ditch in Oct–Dec and in Jan–Mar were significantly higher than ExP for Jul–Sept and Apr–Jun (p < 0.05). There was no significant change in ExP concentrations in J.B. Foltz Ditch during the study period. In Marshall Ditch overall ExP in Jul–Sept was significantly less than ExP observed between October and December (p < 0.001). In addition, Apr–Jun ExP in Marshall Ditch was significantly less than ExP during Jan–Mar (p < 0.0001). Overall, mean ExP values were higher during October through December at all three sites (p < 0.001). However, comparison for ExP contents respective to upstream and downstream of tile drains did not indicate any significant difference at all sites (p > 0.10).
Figure 4. Average exchangeable content in sediments in the P three ditches.
Water 02 00411 g004
It can be expected that low EPC0 values should be inversely correlated to PSI values, and positively correlated with ExP and water column TDP concentration [54]. Most of these relationships were not statistically significant for these parameters in the three ditches. In Foltz Ditch, there was a positive correlation between sediment EPC0 and TDP (p = 0.0540), and both EPC0 and TDP were negatively correlated to PSI (p < 0.05). Overall mean EPC0 was also positively correlated to TDP at all sites (p = 0.0033). The lack of pattern in sediment ability to adsorb P upstream and downstream of tile drain outlets reflects the presence of high P storage in the sediments. Therefore, P inputs from tile drains did not appear to influence sediment-water column TDP interactions. This is also supported by a lack of pattern during low flow conditions in summer, indicating that the dilution caused by high flow conditions was not a factor influencing sediment-water column TDP interactions.
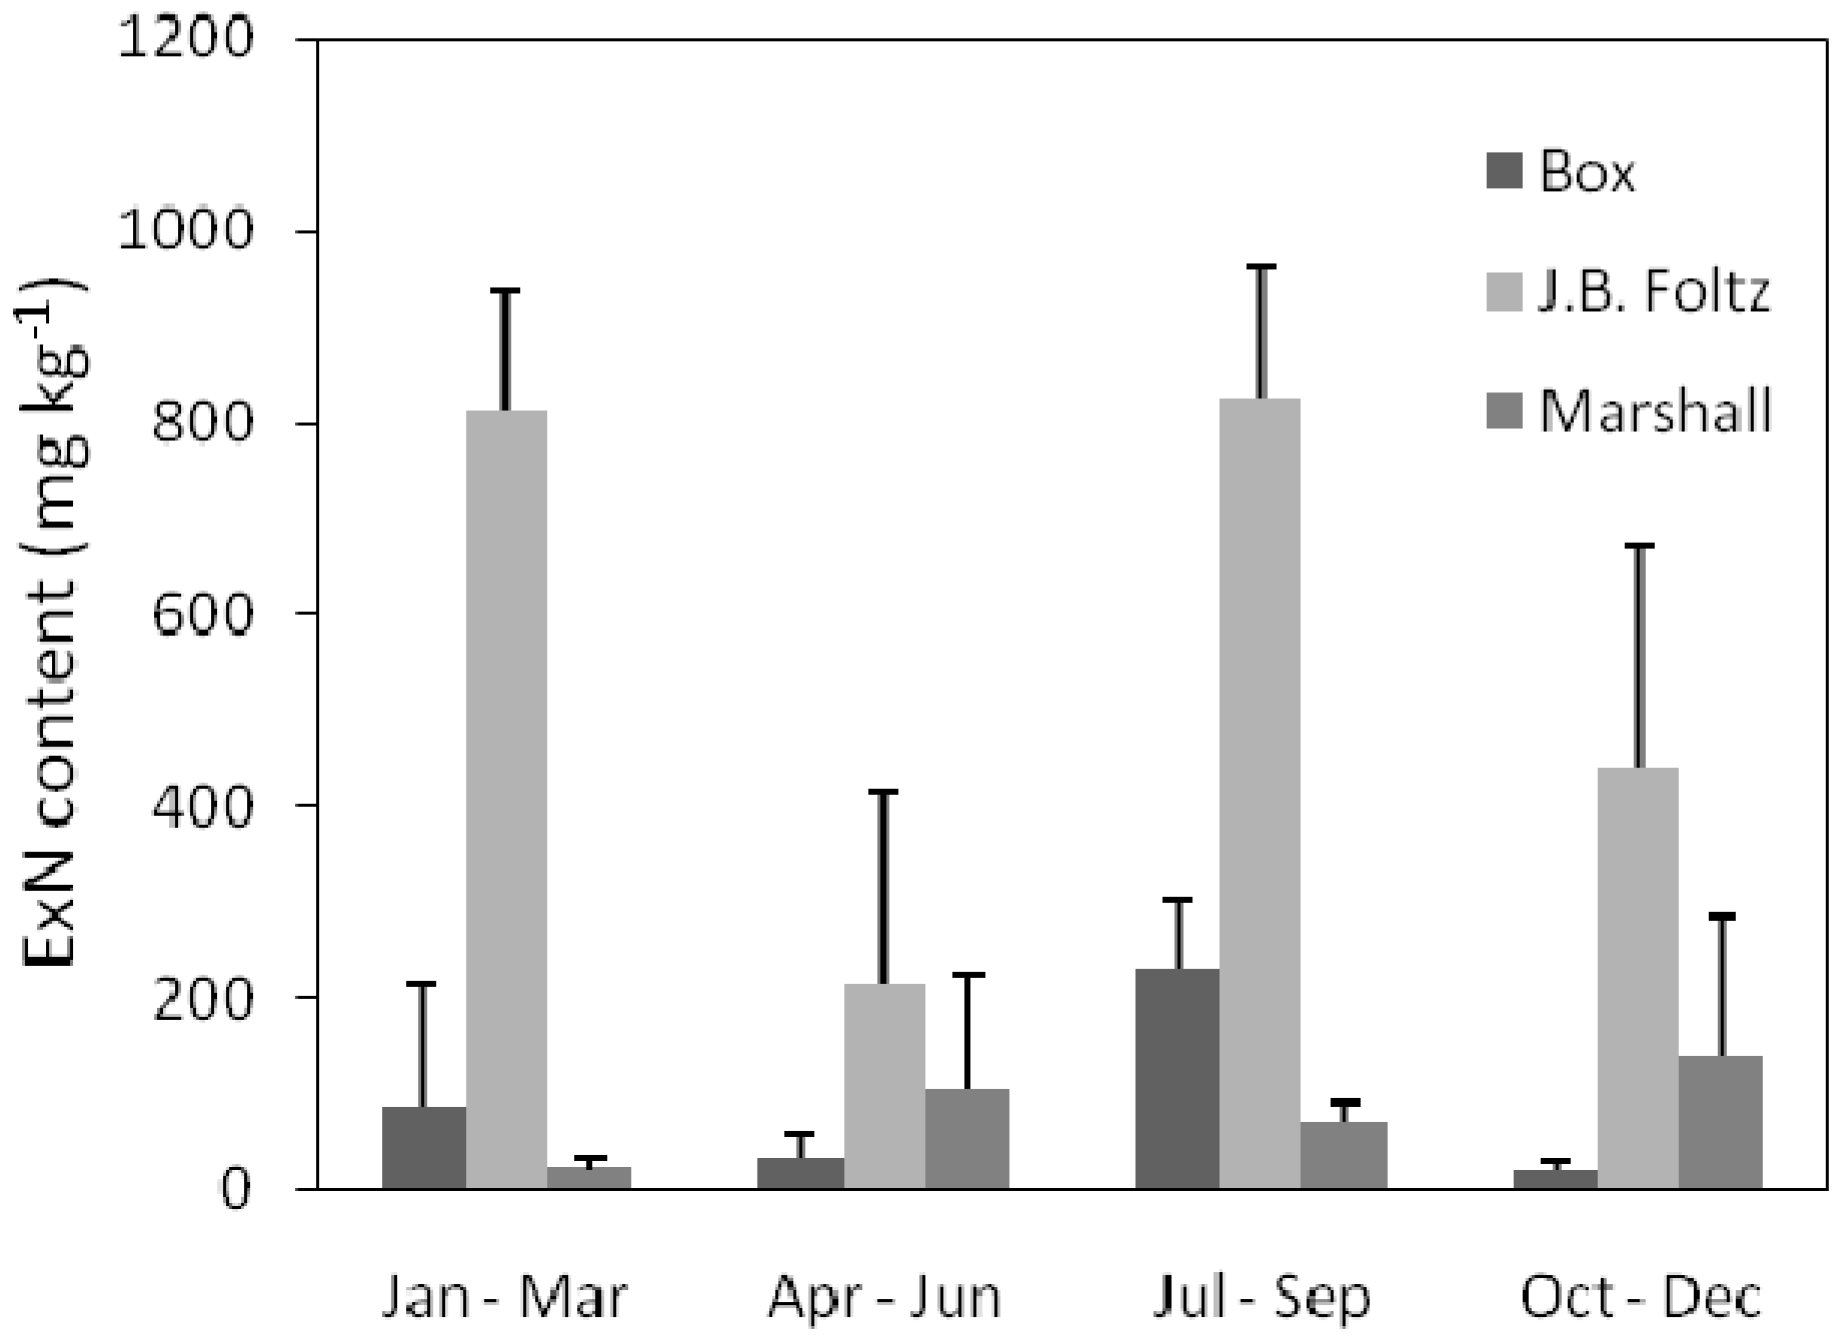
Average ExN for all the samples varied between 20 and 231 mg kg−1 in Box Ditch, between 215 and 826 mg kg−1 in J.B. Foltz Ditch, and between 22 and 138 mg kg−1 in Marshall Ditch, respectively (Figure 5). The test for seasonal discharge of tile drains in each ditch indicated that ExN contents in Box Ditch during Apr–Jun were significantly greater than ExN observed during Oct–Dec but less than ExN observed in Jan–Mar and in Jul–Sept (p < 0.05). Measured ExN content in J.B. Foltz Ditch was high during Jul–Sept, and Jan–Mar (p < 0.0001). Seasonal differences in ExN contents were also observed in Marshall Ditch where ExN during Jul–Sept was significantly less than ExN during Oct–Dec (p < 0.005) and during Apr–Jun (p < 0.02). Overall ExN content was high for all the three ditches during winter (Jan–Mar) and summer (Jul–Sep). The application of anhydrous ammonia and phosphorus fertilizer generally applied in fall could have resulted in greater P and N losses to the ditches with the first precipitation events in winter. Summer low discharge in the ditches could also have contributed to the elevated N in sediments.
Comparison of ExN contents in sediments upstream and downstream of tile drains resulted in no significant differences in all the three ditches (p > 0.10). While the ExN values were extremely high compared to the range of 0.4 to 5.0 mg kg−1 for ExN from streams in Oklahoma [44], the data in this study was not surprising because agricultural drainage ditches in the Midwest have been shown to have large amounts of N storage [9,25,57]. Similarly, researchers have reported a range of 34 to 42 mg kg−1 for ExN in sediments from urban bays located in China [58].
Exchangeable P and N varied extensively between sampling location (upstream and downstream from the tile drain outlet), among seasons, and among nutrients (Figure 4 and Figure 6). Despite these variations, there were no particular patterns for all the three ditches. The values were quite high for both ExP and ExN contents, indicating that benthic sediments in these ditches had high P and N contents. Similarly previous studies have reported relatively high ExN content for Oklahoma streams [44], and stream with high organic matter [58]. These observations support the idea that benthic sediments could temporarily store large amounts of nutrients that could easily be released back into the ditch water column and transported downstream during flow events. The lack of significant differences observed in ExP and ExN contents among seasons and between sampling locations combined with high ExP and ExN contents indicate that nutrient inputs from tile drains can only deteriorate further water quality in these receiving ditches.
Figure 5. Average exchangeable N content in sediments in the three ditches.
Water 02 00411 g005

4. Conclusions

The analysis of sediment EPC0 measurements indicated that ditch sediments were acting as a sink or a source of P, or were in equilibrium with water column TDP, without any particular pattern in the ditches. The ability of sediment to remove P from the water column did not show any significant difference between upstream and downstream sediments. Sediments did not appear to be sensitive to nutrient inputs from tile drains in these drainage ditches, suggesting little active control of sediments on the water column TDP. Exchangeable P and N contents in ditch sediments were high but did not display any particular pattern relative to seasonal variability. This suggests that ditch sediments may likely already store large amounts of P and N that could be easily released back into the overlying water column. The drainage ditches were nutrient-rich ditches, particularly with N. Significant nutrient storage in these ditches may come from various sources such as erosion due to surface runoff, tile drain outflows, or sediments themselves. Though benthic sediments in nutrient-rich drainage ditches could temporarily retain nutrients, this uptake would not always be efficient provided that tile drainage continue to be major transport pathways of nutrients into headwater streams in the Midwest. Therefore, watershed management strategies should consider approaches to minimize losses of nutrients from agricultural fields into the drainage ditches. The results indicated that, once nutrients are delivered into the ditches, they will likely be transported downstream without much attenuation in the drainage ditches. Future investigations that would account for manure application, soil types, and nutrient loadings from individual tile outlets must be conducted to examine impact of tile drain inputs on sediments at different reach scale and in different ditches (vegetated, non-vegetated, dredged, and non-dredged).

Acknowledgements

The authors are grateful to the Ivanhoe Foundation for financial assistance; Sheila Harris, Chetan Maringanti, Katie Merriman, Li-Chi Chiang, Shashank Singh, and Rahul Bhutani for assistance during data collection in the field and/or in the lab; Yang Zhao in the Department of Statistics at Purdue University; Jeremy Schulman and Nicole De Armond for technical assistance in the lab. The authors would like to thank anonymous reviewers for their technical critics and comments that improved the earlier version of this manuscript.

References

  1. Smith, D.R.; Haggard, B.E.; Warnemuende, E.A.; Huang, C. Sediment phosphorus dynamics for three tile fed drainage ditches in northeast Indiana. Agric. Water Manag. 2005, 71, 19–32. [Google Scholar] [CrossRef]
  2. Kleinman, P.J.A.; Allen, A.L.; Needleman, B.A.; Sharpley, A.N.; Vadas, P.A.; Saporito, L.S.; Folmar, G.J.; Bryant, R.B. Dynamics of phosphorus transfers from heavily manured coastal plain soils to drainage ditches. J. Soil Water Conserv. 2007, 62, 225–234. [Google Scholar]
  3. Sharpley, A.N.; Krogstad, T.; Kleinman, P.J.A.; Haggard, B.; Shigaki, F.; Saporito, L.S. Managing natural processes in drainage ditches for nonpoint source phosphorus control. J. Soil Water Conserv. 2007, 62, 197–205. [Google Scholar]
  4. Gentry, L.E.; David, M.B.; Royer, T.V. Phosphorus transport pathways to streams in tile-drained agricultural watersheds. J. Environ. Qual. 2007, 36, 408–415. [Google Scholar] [CrossRef] [PubMed]
  5. Alexander, R.B.; Smith, R.A.; Schwarz, G.E.; Boyer, E.W.; Nolan, J.V.; Brakebill, J.W. Differences in phosphorus and nitrogen delivery to the Gulf of Mexico from the Mississippi River Basin. Environ. Sci. Technol. 2008, 42, 822–830. [Google Scholar] [CrossRef] [PubMed]
  6. Sims, J.T.; Simard, R.R.; Joern, B.C. Phosphorus loss in agricultural drainage: Historical perspective and current research. J. Environ. Qual. 1998, 27, 277–293. [Google Scholar] [CrossRef]
  7. Dunne, E.; McKee, K.A.; Clark, M.W.; Grunwald, S.; Reddy, K.R. Phosphorus in agricultural ditch soil and potential implications for water quality. J. Soil Water Conserv. 2007, 62, 244–252. [Google Scholar]
  8. DeLaune, P.B.; Moore, P.A., Jr.; Carman, D.K.; Sharpley, A.N.; Haggard, B.E.; Daniel, T.C. Development of a phosphorus index for pastures fertilized with poultry litter-Factors affecting phosphorus runoff. J. Environ. Qual. 2004, 33, 2183–2191. [Google Scholar] [CrossRef] [PubMed]
  9. Smith, D.R.; Linvingston, S.J.; Zuercher, B.W.; Larose, M.; Heathman, G.C.; Huang, C. Nutrient losses from row crop agriculture in Indiana. J. Soil Water Conserv. 2008, 63, 396–409. [Google Scholar] [CrossRef]
  10. House, W.A.; Donaldson, L. Adsorption and coprecipitation of phosphate with calcite. J. Colloid Interface Sci. 1986, 112, 309–324. [Google Scholar] [CrossRef]
  11. Lottig, N.R.; Stanley, E.H. Benthic sediment influence on phosphorus concentrations in a headwater stream. Biogeochemistry 2007, 84, 297–309. [Google Scholar] [CrossRef]
  12. Haggard, B.E.; Ekka, S.A.; Matlock, M.D.; Chaubey, I. Phosphate equilibrium between stream sediments and water: Potential effect of chemical amendments. Trans. ASAE 2004, 47, 1113–1118. [Google Scholar] [CrossRef]
  13. McDaniel, M.D.; David, M.B.; Royer, T.V. Relationships between benthic sediments and water column phosphorus in illinois streams. J. Environ. Qual. 2009, 38, 607–617. [Google Scholar]
  14. Smith, D.R.; Warnemuende, E.A.; Haggard, B.E.; Huang, C. Changes in sediment-water column phosphorus interactions following sediment disturbance. Ecol. Engng. 2006, 27, 71–78. [Google Scholar] [CrossRef]
  15. Meyer, J.L. The role of sediments and bryophytes in phosphorus dynamics in a headwater ecosystem. Limnol. Oceanogr. 1979, 24, 365–375. [Google Scholar]
  16. Smith, D.R. Assessment of in-stream phosphorus dynamics in agricultural drainage ditches. Sci. Total Environ. 2009, 407, 3883–3889. [Google Scholar] [CrossRef] [PubMed]
  17. Kröger, R; Holland, M.M. Hydrolodical variability and agricultural drainage ditch inorganic nitrogen reduction capacity. J. Environ. Qual. 2007, 36, 1646–1652. [Google Scholar] [CrossRef] [PubMed]
  18. Dorioz, J.M.; Cassell, E.A.; Orand, A.; Eisenman, K.G. Phosphorus storage, transport and export dynamics in the Foron River watershed. Hydrol.l Process. 1998, 12, 285–309. [Google Scholar] [CrossRef]
  19. McDowell, R.W.; Sharpley, A.; Folmar, G. Phosphorus export from an agricultural watershed: Linking source and transport mechanisms. J. Environ. Qual. 2001, 30, 1587–1595. [Google Scholar] [CrossRef] [PubMed]
  20. Haggard, B.E.; Storm, D.E.; Stanley, E.H. Effect of a point source input on stream nutrient retention. J. Am. Wat. Resour. Ass. 2001, 35, 1291–1299. [Google Scholar] [CrossRef]
  21. Smith, D.R.; Moore, P.A., Jr.; Maxwell, C.V.; Haggard, B.E.; Daniel, T.C. Reducing phosphorus runoff from swine manure with dietary phytase and aluminum chloride. J. Environ. Qual. 2004, 33, 1048–1054. [Google Scholar] [CrossRef] [PubMed]
  22. Smith, D.R.; Moore, P.A., Jr.; Miles, D.M.; Haggard, B.E.; Daniel, T.C. Reducing phosphorus runoff from land applied poultry litter with dietary modifications and alum addition. J. Environ. Qual. 2004, 33, 2210–2216. [Google Scholar] [CrossRef] [PubMed]
  23. Alexander, R.B.; Smith, R.A.; Schwarz, G.E. Effect of stream channel size on the delivery of nitrogen to the Gulf of Mexico. Nature 2000, 403, 758–761. [Google Scholar] [CrossRef] [PubMed]
  24. Bernot, M.J.; Tank, J.L.; Royer, T.V.; David, M.B. Nutrient uptake in streams draining agricultural catchments of the midwestern United States. Freshw. Biol. 2006, 51, 499–509. [Google Scholar]
  25. Gentry, L.E.; David, M.B.; Smith, K.M.; Kovacic, D.A. Nitrogen cycling and tile drainage nitrate loss in a corn/soybean watershed. Agricult. Ecosys. Environ. 1998, 68, 85–97. [Google Scholar] [CrossRef]
  26. Kladivko, E.J.; Frankenberger, J.R.; Jaynes, D.B.; Meek, D.W.; Jenkinson, B.J.; Faussey, N.R. Nitrate leaching to subsurface drains as affected by drain spacing and changes in crop production system. J. Environ. Qual. 2004, 33, 1803–1813. [Google Scholar] [CrossRef] [PubMed]
  27. Royer, T.V.; Tank, J.L.; David, M.B. Transport and fate of nitrate in headwater agricultural streams in Illinois. J. Environ. Qual. 2004, 33, 1296–1304. [Google Scholar] [CrossRef] [PubMed]
  28. Strock, J.S.; Dell, C.J.; Schmidt, J.P. Managing natural processes in drainage ditches or nonpoint source nitrogen control. J. Soil Water Conserv. 2007, 62, 188–196. [Google Scholar]
  29. Clark, G.M.; Mueller, D.K.; Mast, M.A. Nutrient concentrations and yields in undeveloped stream basins of the United States. J. Am. Wat. Resour. Ass. 2000, 36, 849–860. [Google Scholar] [CrossRef]
  30. Kladivko, E.J.; Van Scoyoc, G.E.; Monke, E.J.; Oates, K.M.; Pask, W. Pesticide and nutrient movement into subsurface tile drains on a silt loam soil in Indiana. J. Environ. Qual. 1991, 20, 264–270. [Google Scholar] [CrossRef]
  31. Randall, G.W.; Vetsch, J.A.; Huffman, J.R. Nitrate losses in subsurface drainage from a corn-soybean rotation as affected by time of nitrogen application and use of nitrapyrin. J. Environ. Qual. 2003, 32, 1764–1772. [Google Scholar] [CrossRef] [PubMed]
  32. Randall, G.W.; Vetsch, J.A. Nitrate losses in subsurface drainage from a corn-soybean rotation as affected by fall and spring application of nitrogen and nitrapyrin. J. Environ. Qual. 2005, 34, 590–597. [Google Scholar] [CrossRef] [PubMed]
  33. Petrolia, D.R.; Gowda, P.H. Missing the Boat: Midwest Farm Drainage and Gulf of Mexico Hypoxia. Rev. Agric. Econ. 2006, 28, 240–253. [Google Scholar] [CrossRef]
  34. Marti, E.; Autmatell, J.; Godé, L.; Poch, M.; Sabater, F. Nutrient retention efficiency in streams receiving inputs from wastewater treatment plants. J. Environ. Qual. 2004, 33, 285–293. [Google Scholar] [CrossRef] [PubMed]
  35. Naz, B.S.; Ale, S.; Bowling, L.C. Detecting subsurface drainage systems and estimating drain spacing in intensively managed agricultural landscapes. Agric. Water Manag. 2008, 96, 627–637. [Google Scholar] [CrossRef]
  36. Popova, Y.A. Sediment-Phosphorus Chemistry in Ozark Plateau Streams in Northeast Oklahoma. M.S. Thesis, Oklahoma State University, Oklahoma City, OK, USA, 2000. [Google Scholar]
  37. Chaubey, I.; Sahoo, D.; Haggard, B.E.; Matlock, M.D.; Costello, T.A. Nutrient retention, nutrient limitation, and sediment-nutrient interactions in a pasture-dominated stream. Trans. ASABE 2007, 50, 35–44. [Google Scholar] [CrossRef]
  38. Haggard, B.E.; Stanley, E.H.; Hyler, R. Sediment-Phosphorus relationships in three Northcentral Oklahoma streams. Trans. ASAE 1999, 42, 1709–1714. [Google Scholar] [CrossRef]
  39. Taylor, A.W.; Kunishi, H.M. Phosphate equilibria on stream sediment and soil in a watershed draining an agricultural region. J. Agric. Food Chem. 1971, 19, 827–831. [Google Scholar] [CrossRef]
  40. Klotz, R.L. Sediment control of soluble reactive phosphorus in Hoxie Gorge Creek, New York. Can. J. Fish Aquat. Sci. 1988, 45, 2026–2034. [Google Scholar] [CrossRef]
  41. Bache, B.W.; Williams, E.G. Phosphate sorption index for soils. J. Soil Sci. 1971, 22, 289–301. [Google Scholar] [CrossRef]
  42. Richey, J.S.; McDowell, W.H.; Likens, G.E. Nitrogen transformation in a small mountain stream. Hydrobiogia 1985, 124, 129–139. [Google Scholar] [CrossRef]
  43. Ruttenburg, K.C. Development of a sequential extraction method of different forms of phosphorus in marine sediments. Limnol. Oceanogr. 1992, 37, 1460–1482. [Google Scholar] [CrossRef]
  44. Popova, Y.A.; Keyworth, V.G.; Haggard, B.E.; Storm, D.E.; Lynch, R.A.; Payton, M.E. Stream nutrient limitation and sediment interactions in the Eucha-Spavinaw Basin. J. Soil Water Conserv. 2006, 61, 105–115. [Google Scholar]
  45. Bremner, J.M. Inorganic forms of nitrogen. In Methods of soil analysis; Black, C.A., Ed.; American Society of Agronomy: Madison, WI, USA, 1965; Part 2; pp. 1152–1191. [Google Scholar]
  46. Rowland, A.P.; Haygarth, P.M. Determination of Total Dissolved Phosphorus in Soil Solutions. J. Environ. Qual. 1997, 26, 410–415. [Google Scholar] [CrossRef]
  47. Jarvie, H.P.; Withers, P.J.A.; Neal, C. Review of robust measurement of phosphorus in river water: Sampling, storage, fractionation and sensitivity. Hydrol. Earth Syst. Sci. 2002, 6, 113–132. [Google Scholar] [CrossRef]
  48. House, W.A.; Denison, F.H.; Armitage, P.D. Comparison of the uptake of inorganic phosphorus to a suspended and stream bed-sediment. Wat. Res. 1995, 29, 767–779. [Google Scholar] [CrossRef]
  49. Klotz, R.L. Factors controlling phosphorus limitation in stream sediments. Limnol. Oceanogr. 1985, 30, 543–553. [Google Scholar] [CrossRef]
  50. Triska, F.J.; Jackman, A.P.; Duff, J.H.; Avanzino, R.J. Ammonium sorption to channel and riparian sediments: A transient storage pool for dissolved inorganic nitrogen. Biogeochemistry 1994, 2, 67–83. [Google Scholar] [CrossRef]
  51. SAS, version 9.1; SAS Institute Inc.: Cary, NC, USA, 2003.
  52. Indiana Administrative Code (IAC). Water Quality Standards. Article 2. Available online: www.in.gov/legislative/iac/pdf-iac/iac2008 (accessed on 30 November 2008).
  53. Vaughan, R.E.; Needelman, B.A.; Kleinman, P.J.A.; Allen, A.L. Vertical distribution of phosphorus in agricultural drainage ditch soils. J. Environ. Qual. 2007, 36, 1895–1903. [Google Scholar] [CrossRef] [PubMed]
  54. Ekka, S.A.; Haggard, B.E.; Matlock, M.D.; Chaubey, I. Dissolved phosphorus concentrations and sediment interactions in effluent dominated Ozark streams. Ecol. Engng. 2006, 26, 375–391. [Google Scholar] [CrossRef]
  55. Jarvie, H.P.; Juergens, M.D.; Williams, R.J.; Neal, C.; Davies, J.J.L.; Barrett, C.; White, J. Role of river bed sediments as sources and sinks of phosphorus across two major eutrophic UK river basins: The Hampshire Avon and Herefordshire Wye. J. Hydrol. 2005, 305, 51–74. [Google Scholar] [CrossRef]
  56. Smith, D.R.; Warnemuende, E.A.; Haggard, B.E.; Huang, C. Dredging of drainage ditches increases short-term transport of soluble phosphorus. J. Environ. Qual. 2006, 35, 611–616. [Google Scholar] [CrossRef] [PubMed]
  57. David, M.B.; Gentry, L.E.; Kovacic, D.A. Nitrogen balance in and export from an agricultural watershed. J. Environ. Qual. 1997, 26, 1038–1048. [Google Scholar] [CrossRef]
  58. Zheng, A.; Shen, H.; Chen, D. Study of exchangeable nitrogen and their bioavailability in the sediments. EIA 2006, 4, 26–34. [Google Scholar]
  59. Haggard, B.E.; Smith, D.R.; Brye, K.R. Variations in stream water and sediment phosphorus among select Ozark Catchments. J. Environ. Qual. 2007, 36, 1725–1734. [Google Scholar] [CrossRef] [PubMed]