
Assessment of per Capita Contribution to Fecal Sewage in Rural Residences of Quilombola Communities


Abstract

1. Introduction
2. Materials and Methods
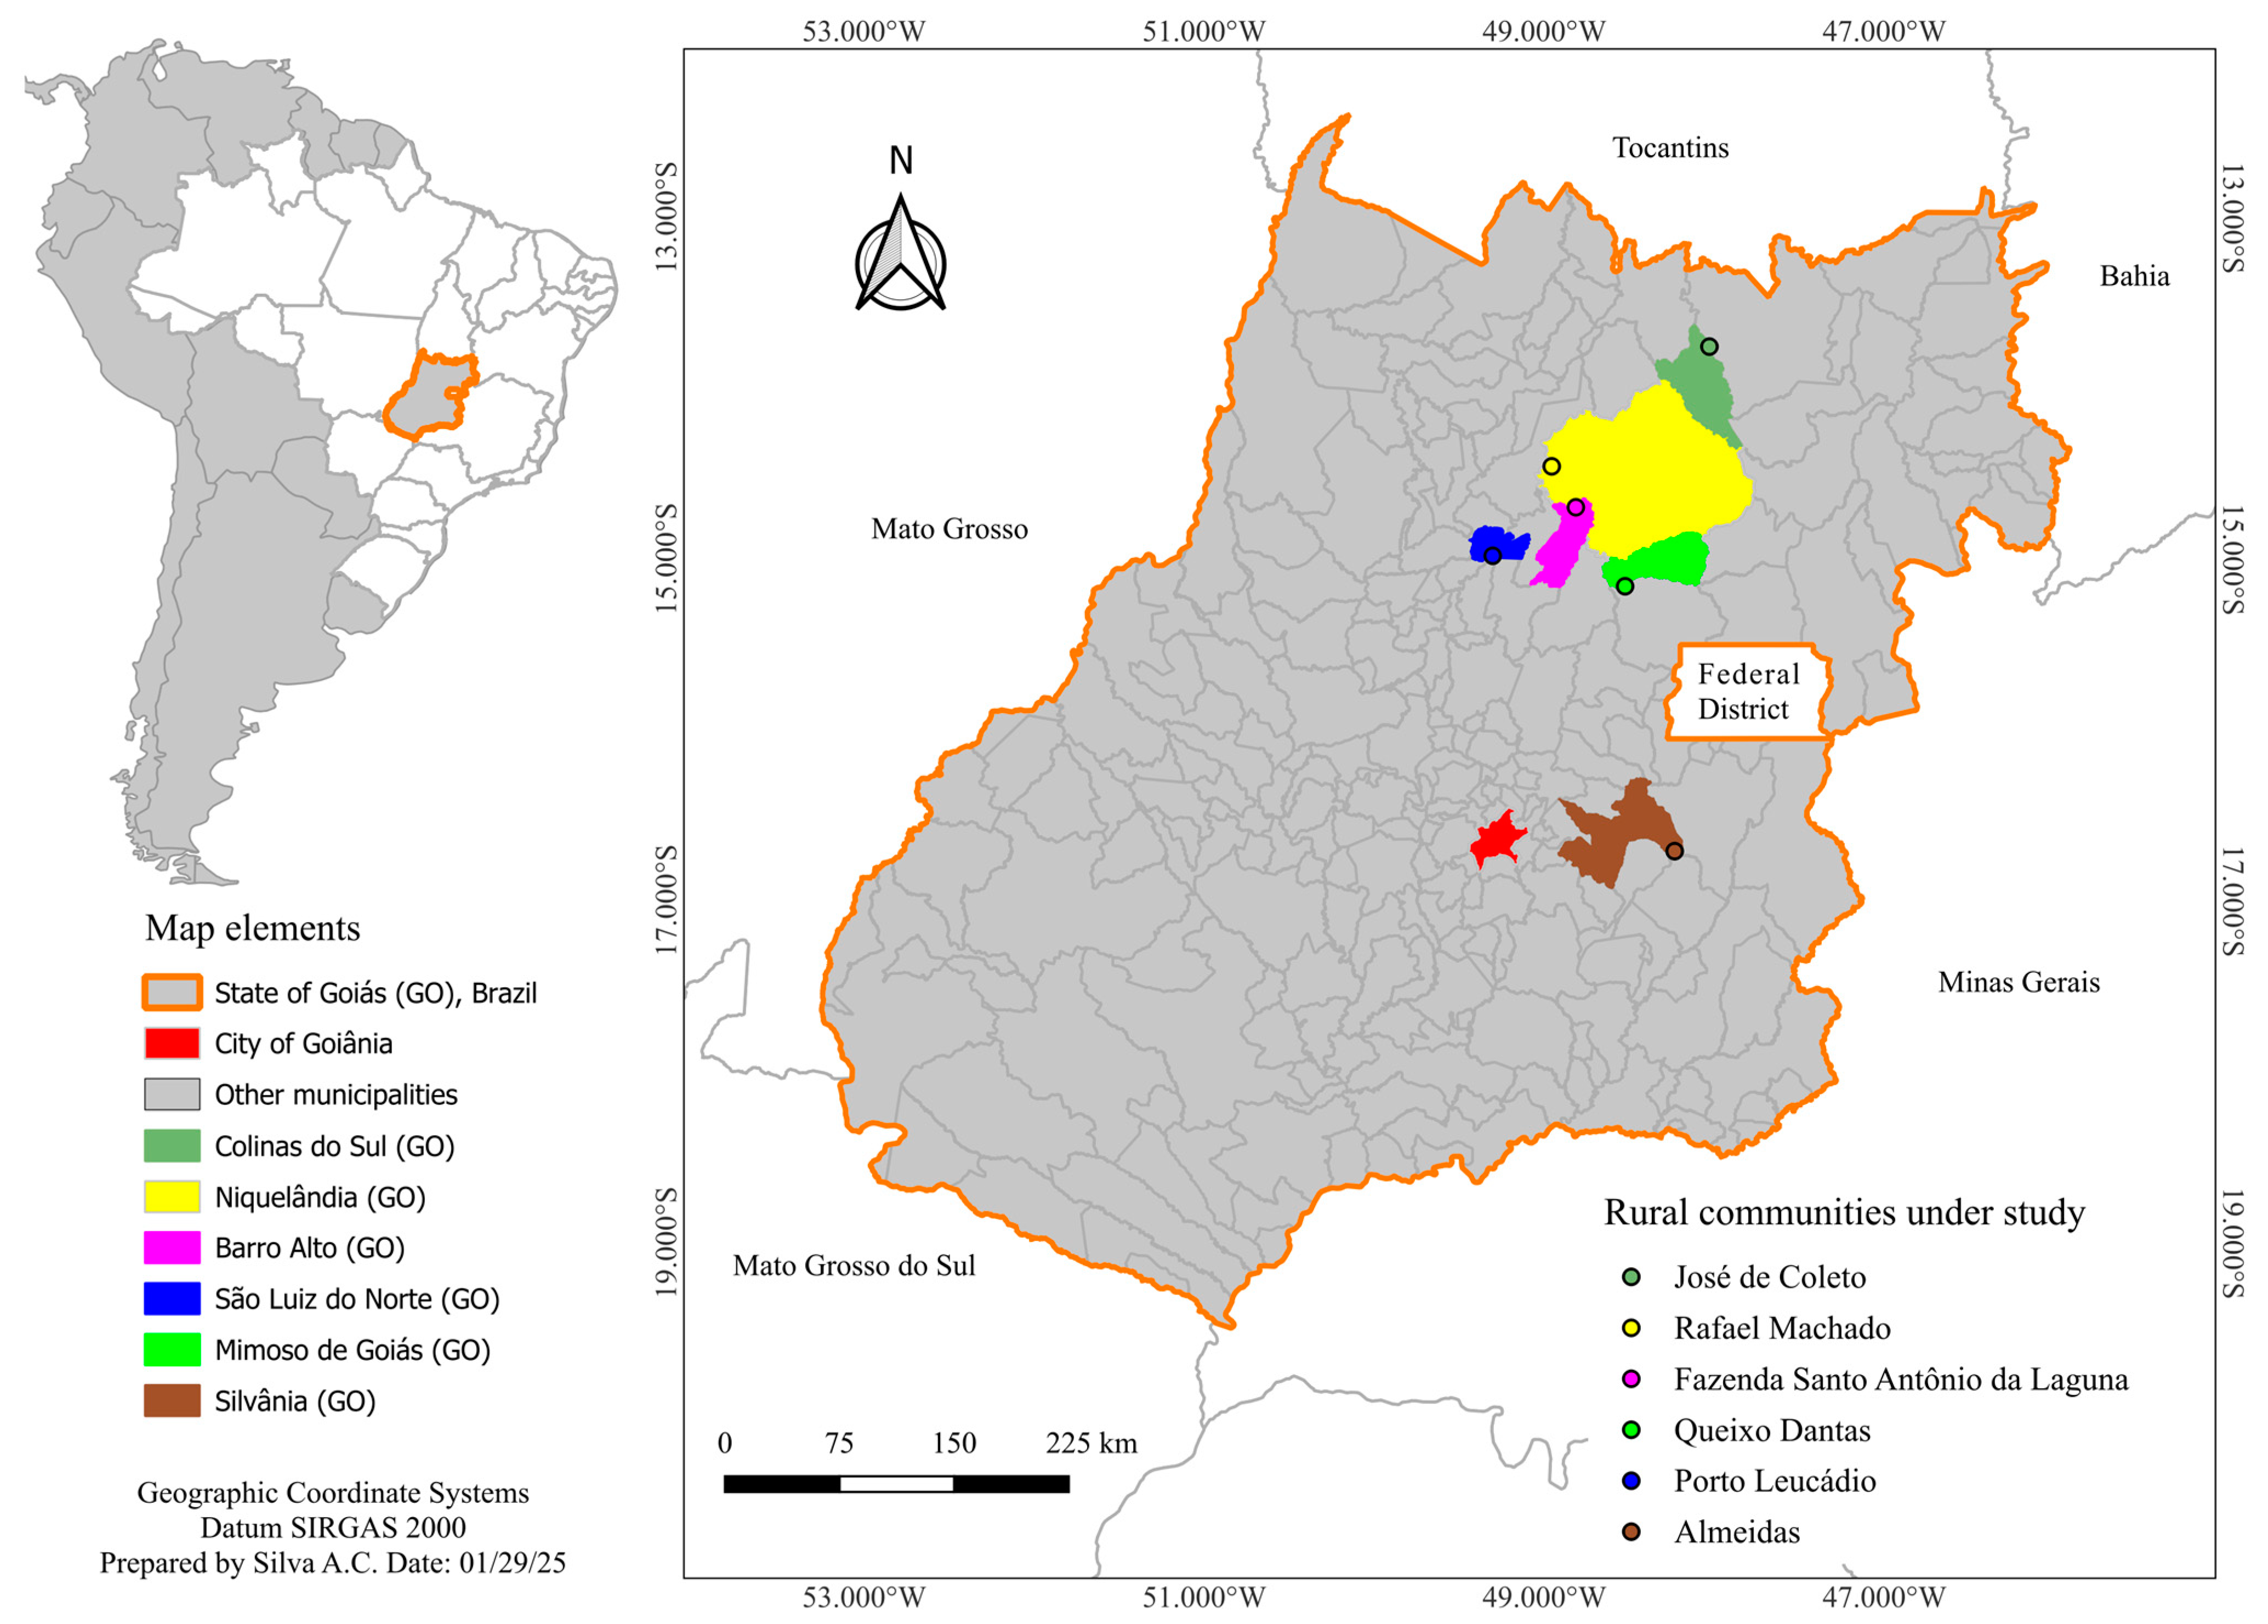
2.1. Study Area
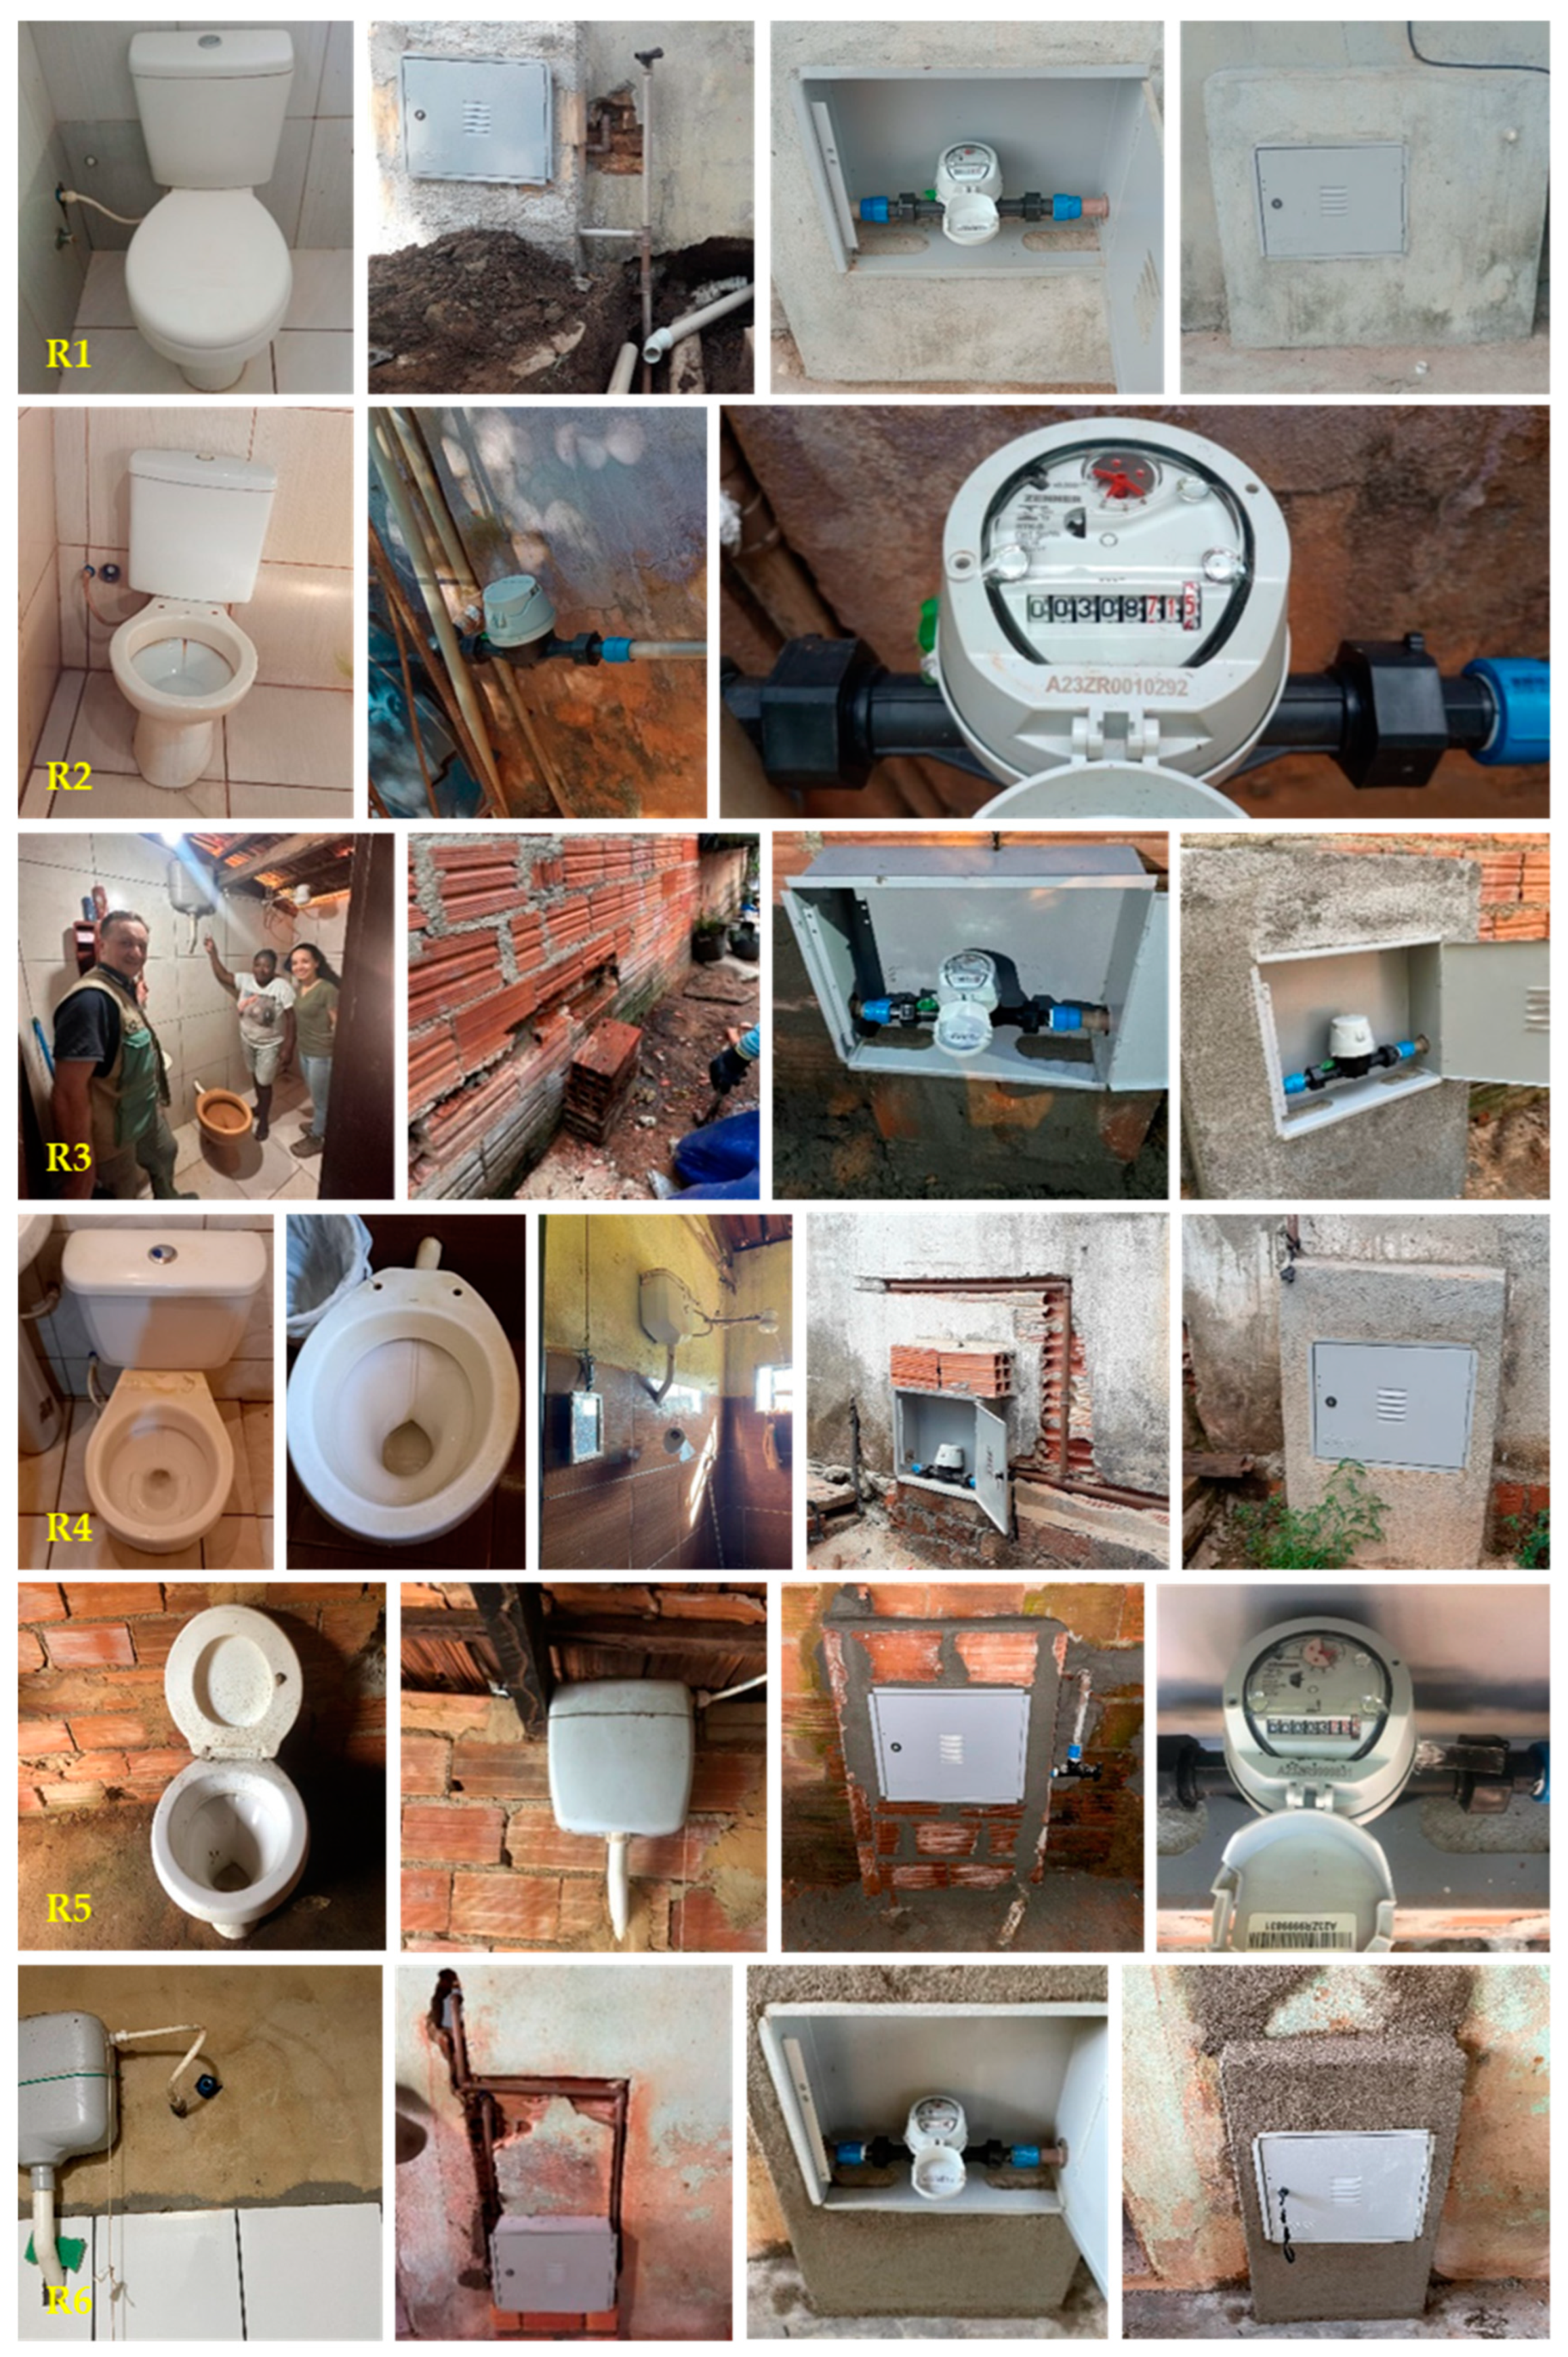
- (i)
- Residences with an indoor bathroom;
- (ii)
- Bathrooms equipped with a toilet featuring a coupled or elevated flush tank;
- (iii)
- Not having other sources of fecal sewage such as urinals or toilets without flushing;
- (iv)
- Willingness to record readings at least weekly;
- (v)
- Feasibility of installing a water meter;
- (vi)
- Uninterrupted water supply.
2.2. Bibliometric Analysisdr
2.3. On-Site Measurement and Calculation of per Capita Contribution to Fecal Sewage
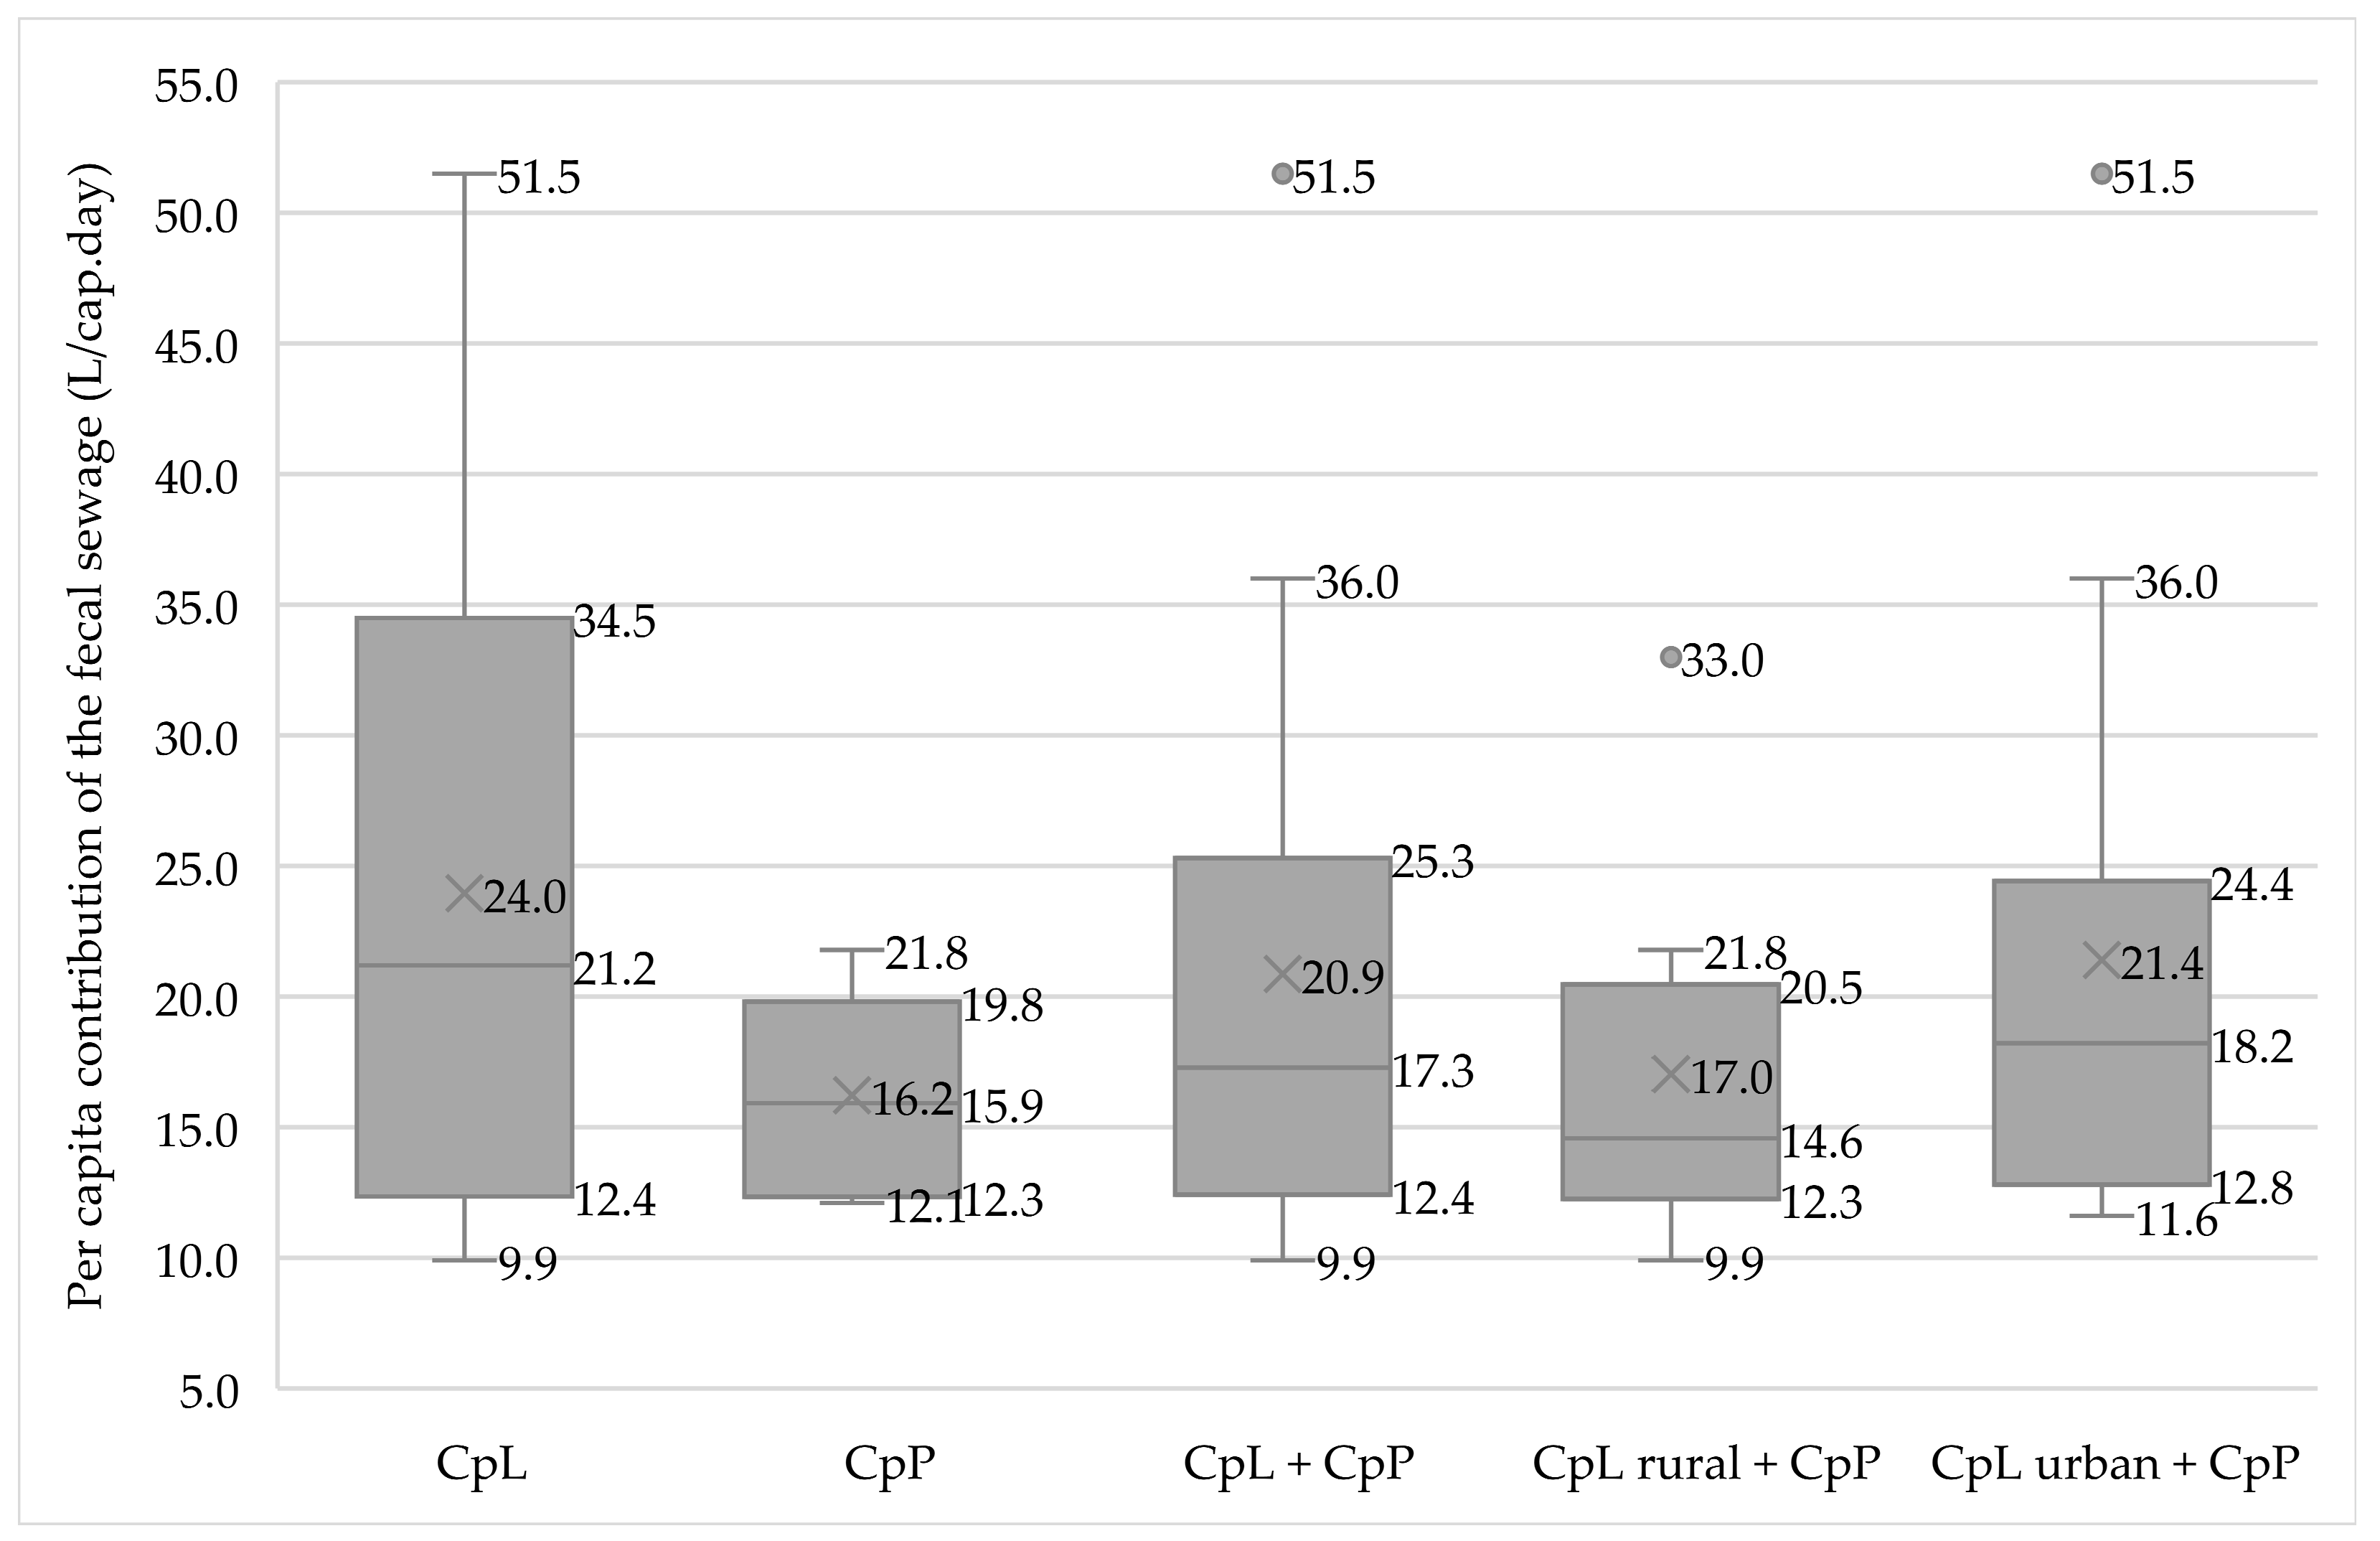
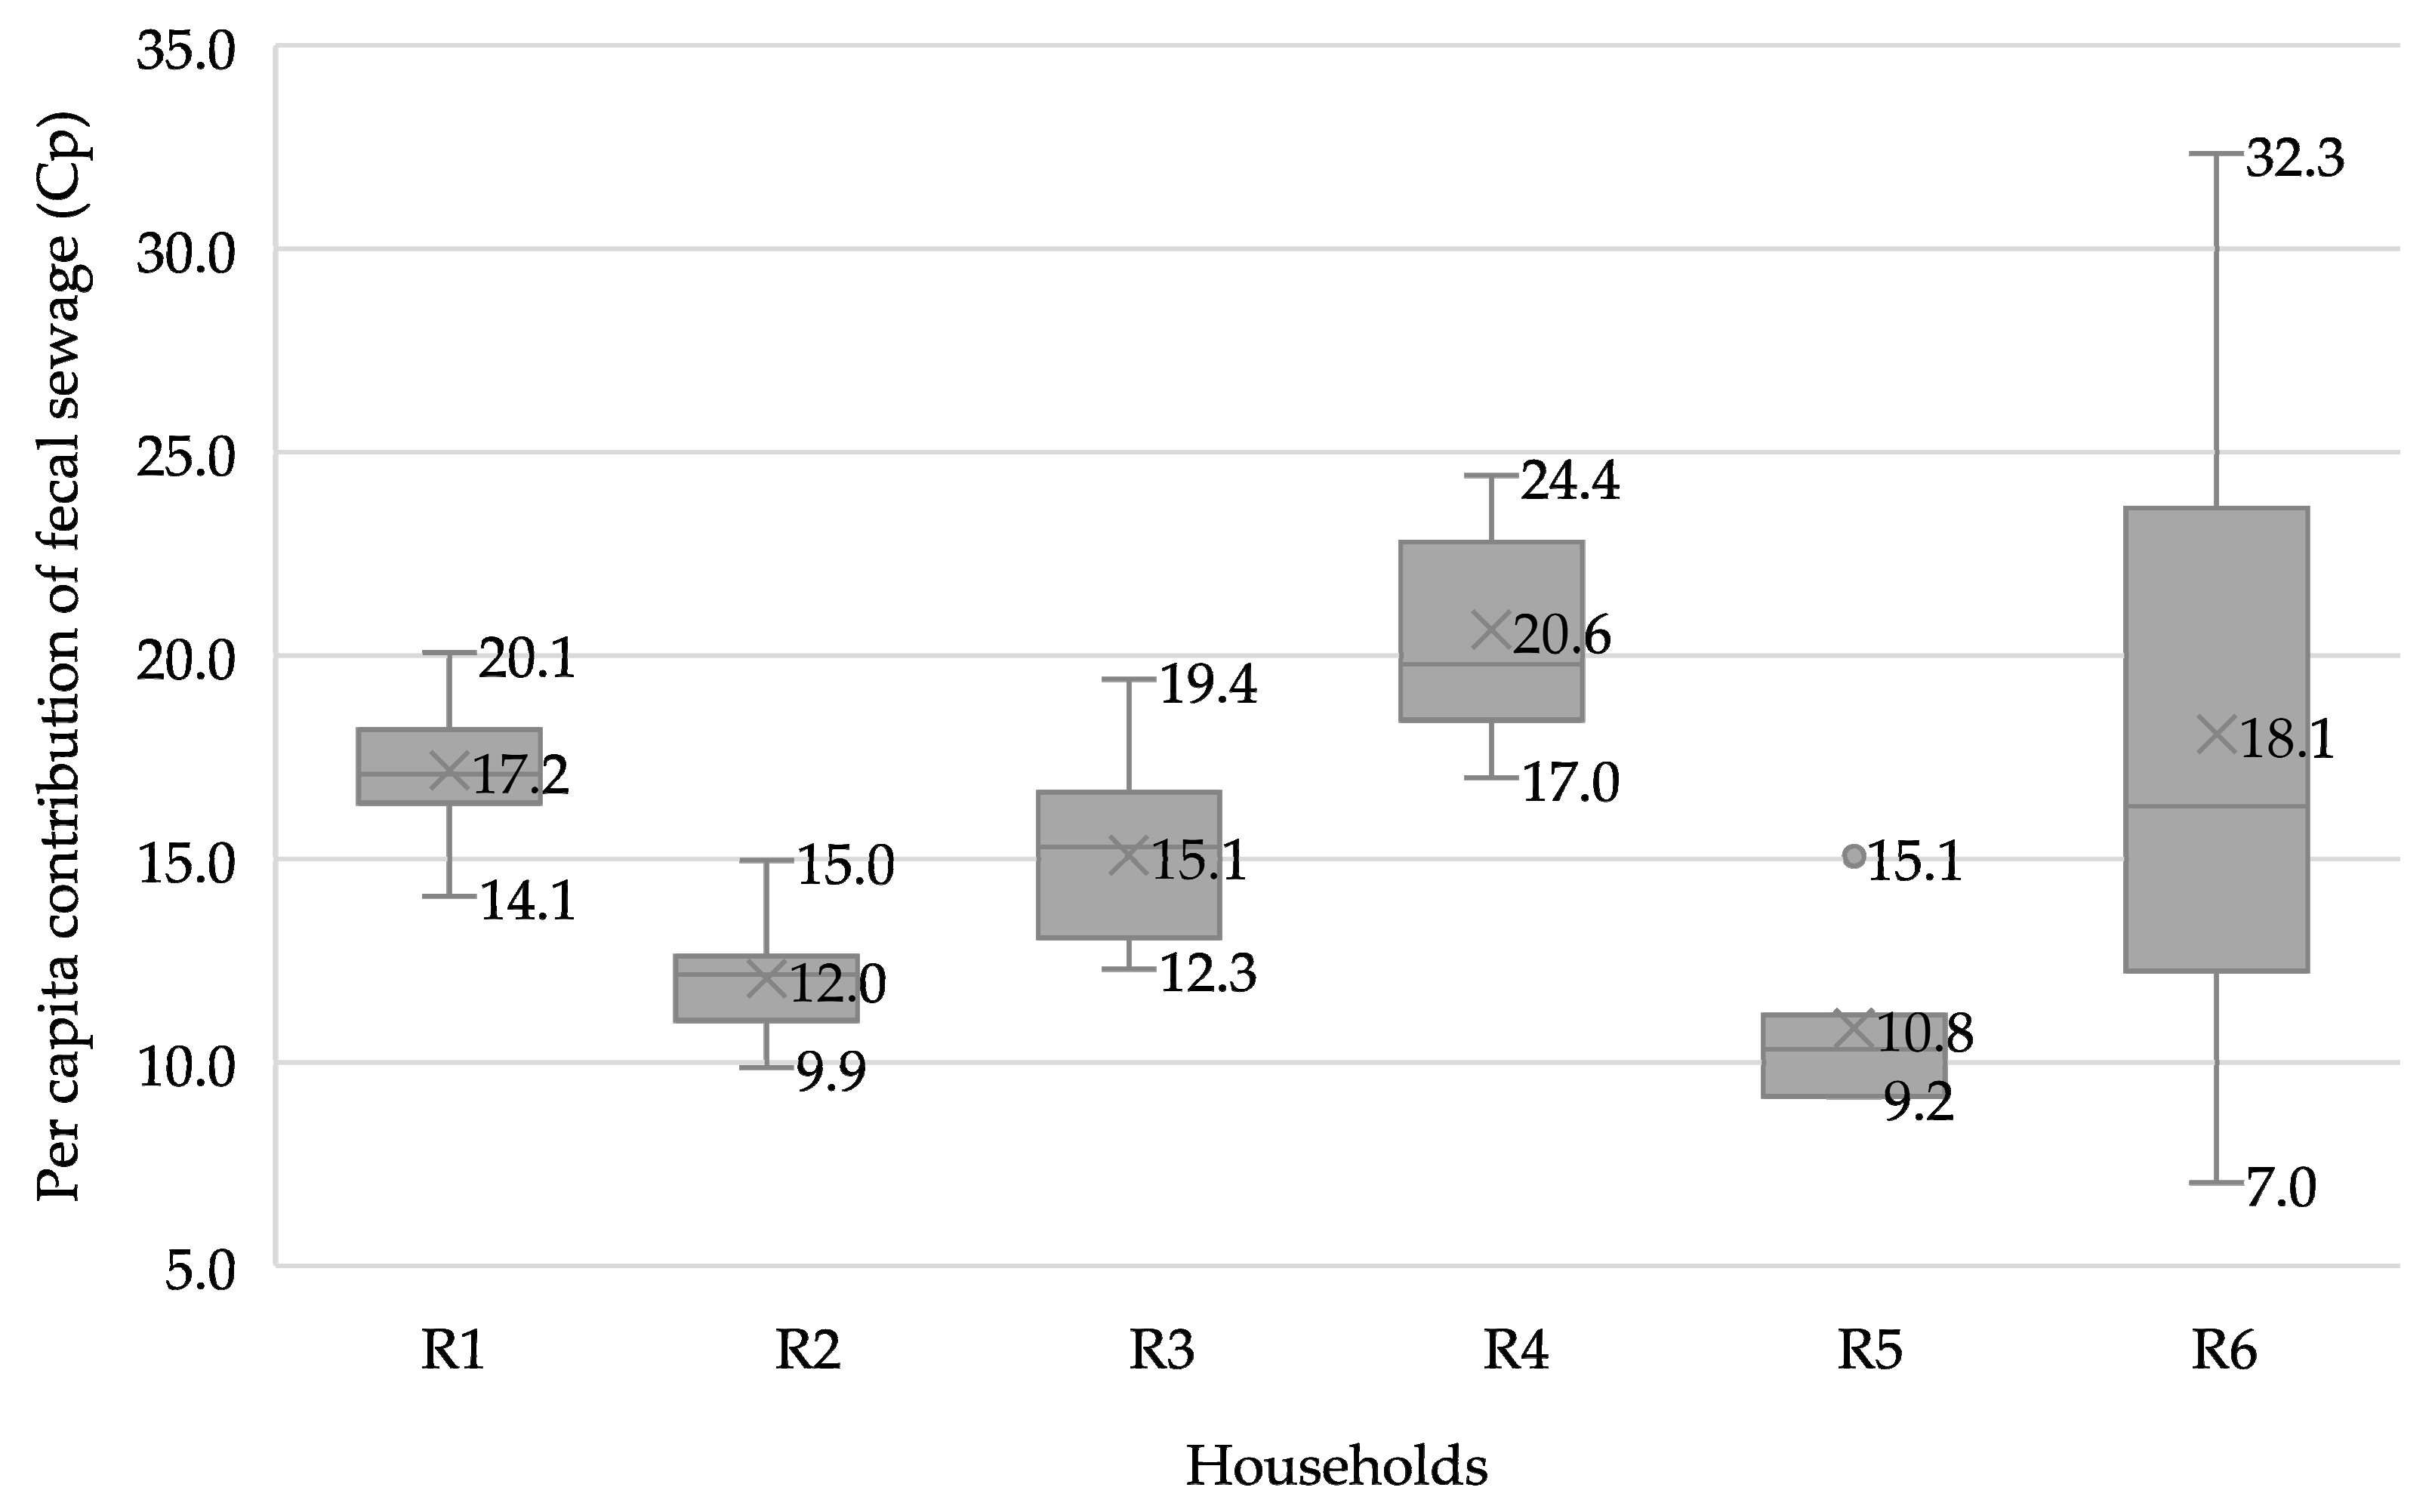
3. Results
4. Discussion
5. Conclusions
- There is a scarcity of studies based on local flowrate measurements in both urban and, particularly, rural areas.
- Estimated values tend to be higher than those calculated from direct measurements.
- The results obtained in this study are consistent with the lower range of values found in the literature based on flowrate measurements.
- Precise determination of Cp is crucial for the planning of decentralized basic sanitation systems.
- On-site measurements confirm that relying solely on estimated values can lead to under- or overestimation in projects, thereby compromising the effectiveness and sustainability of the proposed solutions.
- Cp can be influenced by seasonal variations.
- The use of appropriate meters, along with consideration of cultural factors, is essential to ensure the collection of consistent data.
Supplementary Materials
Author Contributions
Funding
Data Availability Statement
Acknowledgments
Conflicts of Interest
References
- United Nations. Water. 2024. Available online: https://www.un.org/en/global-issues/water (accessed on 14 November 2024).
- World Health Organization & United Nations Children’s Fund. Progress on Household Drinking Water, Sanitation and Hygiene 2000–2020: Five Years into the SDGs. World Health Organization. 2021. Available online: https://www.who.int/publications/i/item/9789240030848 (accessed on 15 November 2024).
- UNESCO. The United Nations World Water Development Report 2017: Wastewater: The Untapped Resource; Facts and Figures. World Water Assessment Programme. 2017. Available online: https://unesdoc.unesco.org/ark:/48223/pf0000247553 (accessed on 18 October 2024).
- BRASIL. Atualiza o Marco Legal do Saneamento Básico […]. Law N° 14.026; Diário Oficial da Repútlica Federativa do Brasil: Brasília, Brazil, 2020. Available online: https://www.planalto.gov.br/ccivil_03/_ato2019-2022/2020/lei/l14026.htm (accessed on 11 January 2025).
- Vale, G.B.D.; Ruggeri Junior, H.C.; Scalize, P.S. Service and precariousness of sanitary sewage in rural communities in the state of Goiás, Brazil. Eng. Sanit. Ambient. 2022, 27, 1067–1075. [Google Scholar] [CrossRef]
- Silva, A.C.; Scalize, P.S. Environmental Variables Related to Aedes aegypti Breeding Spots and the Occurrence of Arbovirus Diseases. Sustainability 2023, 15, 8148. [Google Scholar] [CrossRef]
- Vale, G.B.; Scalize, P.S.; Tonetti, A.L.; Ruggeri Junior, H.C. Cost-effectiveness study of septic tank management in rural communities. Int. J. Environ. Sci. Technol. 2023, 21, 4599–4610. [Google Scholar] [CrossRef]
- Kihila, J.M.; Balengayabo, J.G. Adaptable improved onsite wastewater treatment systems for urban settlements in developing countries. Cogent. Environ. Sci. 2020, 6, 1823633–2182650. [Google Scholar] [CrossRef]
- Karunanidhi, D.; Aravinthasamy, P.; Subramanim, T.; Kumar, M. Human health risks associated with multipath exposure of groundwater nitrate and environmental friendly actions for quality improvement and sustainable management: A case study from Texvalley (Tiruppur region) of India. Chemosphere 2021, 265, 129083–129094. [Google Scholar] [CrossRef]
- Kuai, W.; Li, H.-Y.; Gao, Y.; Yang, B.; Zhang, C.-X.; Xu, Y.; Zheng, X.-Q. Environmental risk and influencing factors of effluent from three-compartment septic tanks. J. Agro-Environ. Sci. 2021, 40, 1051–1061. [Google Scholar] [CrossRef]
- Jaiswal, J.; Mehta, D.; Mehta, M. Impacts of scheduled desludging on quality of water and wastewater in Wai city, India. Environ. Plan. B Urban Anal. City Sci. 2022, 49, 2216–2229. [Google Scholar] [CrossRef]
- Custódio, D.A.; Ghisi, E. Potential for potable water savings using rainwater: A case study in a university building in Southern Brazil. Urban Water J. 2023, 21, 252–258. [Google Scholar] [CrossRef]
- Pires, F.J. Construção Participativa de Sistemas de Tratamento de Esgoto Doméstico no Assentamento Rural Olga Benário—MG (Participatory Construction of Domestic Sewage Treatment Systems in the Rural Settlement Olga Benário—MG). Master’s Thesis, Federal University of Viçosa, Minas Gerais, Brazil, 2012. Available online: http://locus.ufv.br/handle/123456789/3786 (accessed on 14 January 2025). (In Portuguese).
- Bastos, M.M.A. Opções Tecnológicas para Conservação de Água e Redução de Esgoto Doméstico em um Edifício Residencial Dotada de Sistema de Reuso de Água Cinza (Technological Options for Water Conservation and Reduction of Domestic Sewage in a Residential Building Equipped with a Gray Water Reuse System). Undergraduate Course Completion Work, Federal University of Espírito Santo, Brazil, 2013. Available online: https://engenhariaambiental.ufes.br/sites/ambiental.ufes.br/files/field/anexo/opcoes_tecnologicas_para_conservacao_de_agua_e_reducao_de_esgoto_domestico_em_um_edificio_residencial_dotado_de_sistema_de.pdf (accessed on 12 November 2024). (In Portuguese).
- Costa, H.C.; Marcuzzo, F.F.N.; Ferreira, O.M.; Andrade, R.A. Seasonality and Spatial Distribution of Rainfall in the State of Goiás and Federal District. Rev. Bras. Geogr. Fís. 2012, 5, 87–100. [Google Scholar] [CrossRef]
- Sano, S.M.; de Almeida, S.P.; Ribeiro, J.F. Cerrado: Ecologia e Flora; Da Silva, F.A.M., Assad, E.D., Evangelista, B.A., Eds.; Embrapa Informação Tecnológica: Brasília, DF, Brazil, 2008; Chapter 3; 19p, Available online: https://www.infoteca.cnptia.embrapa.br/infoteca/handle/doc/570911 (accessed on 14 October 2024). (In Portuguese)
- Fundação Cultural Palmares. Certificação Quilombola: Comunidades Certificadas; Federal Government: Brasília, Brazil, 2019. Available online: https://www.gov.br/palmares/pt-br/departamentos/protecao-preservacao-e-articulacao/certificacao-quilombola (accessed on 16 November 2024).
- BRASIL. Regulamenta o Procedimento para Identificação, Reconhecimento, Delimitação, Demarcação e Titulação das Terras Ocupadas por Remanescentes das Comunidades dos Quilombos de que Trata o Art. 68 do Ato das Disposições Constitucionais Transitórias; Decreto N° 4.887; Diário Oficial da Repútlica Federativa do Brasil: Brasília, Brazil, 2003. Available online: https://www.planalto.gov.br/ccivil_03/decreto/2003/d4887.htm (accessed on 11 January 2025).
- BRASIL. Institui o Conselho Nacional dos Povos e Comunidades Tradicionais; Decreto N° 8.750; Diário Oficial da Repútlica Federativa do Brasil: Brasília, Brazil, 2016. Available online: https://www.planalto.gov.br/ccivil_03/_ato2015-2018/2016/decreto/d8750.htm (accessed on 11 January 2025).
- Scalize, P.S. Diagnóstico Técnico Participativo da Comunidade dos Almeidas, Silvânia, Goiás, 2018; Cegraf UFG: Goiânia, Brazil, 2020; 220p, Available online: https://sanrural.ufg.br/wp-content/uploads/2022/02/DTP_ALMEIDAS.pdf (accessed on 23 December 2024). (In Portuguese)
- Scalize, P.S. Diagnóstico Técnico Participativo da Comunidade de Mimoso (Queixo Dantas), Mimoso de Goiás, Goiás, 2019; Cegraf UFG: Goiânia, Brazil, 2021; 219p, Available online: https://sanrural.ufg.br/wp-content/uploads/2021/08/DTP_MIMOSO_QUEIXO_DANTAS_III.pdf (accessed on 23 December 2024). (In Portuguese)
- Scalize, P.S. Diagnóstico Técnico Participativo da Comunidade de Porto Leucádio, São Luiz do Norte, Goiás, 2019; Cegraf UFG: Goiânia, Brazil, 2020; 214p, Available online: https://sanrural.ufg.br/wp-content/uploads/2022/02/DTP_PORTO_LEUCAUDIO.pdf (accessed on 23 December 2024). (In Portuguese)
- Scalize, P.S. Diagnóstico Técnico Participativo da Comunidade Fazenda Santo Antônio da Laguna, Barro Alto, Goiás, 2019; Cegraf UFG: Goiânia, Brazil, 2021; 214p, Available online: https://sanrural.ufg.br/wp-content/uploads/2021/08/DTP_FAZENDA_SANTO_ANT%C3%94NIO_DA_LAGUNA_III.pdf (accessed on 23 December 2024). (In Portuguese)
- Scalize, P.S. Diagnóstico Técnico Participativo da Comunidade de José de Coleto, Colinas do Sul, Goiás, 2019; Cegraf UFG: Goiânia, Brazil, 2021; 212p, Available online: https://sanrural.ufg.br/wp-content/uploads/2022/02/DTP_JOSE_DE_COLETO.pdf (accessed on 23 December 2024). (In Portuguese)
- Scalize, P.S. Diagnóstico Técnico Participativo da Comunidade Rafael Machado, Niquelândia, Goiás, 2019; Cegraf UFG: Goiânia, Brazil, 2020; 220p, Available online: https://sanrural.ufg.br/blog/2021/08/02/comunidade-rafael-machado/ (accessed on 23 December 2024). (In Portuguese)
- Peters, M.R. Potencialidade de uso de Fontes Alternativas de Água para Fins não Potáveis em uma Unidade Residencial (Potential for Using Alternative Water Sources for Non-Potable Purposes in a Residential Unit). Master’s Thesis, Federal University of Santa Catarina, Florianópolis, Brazil, 2006. Available online: https://repositorio.ufsc.br/xmlui/handle/123456789/88951 (accessed on 16 October 2024). (In Portuguese).
- Coelho, C.F.; Reinhardt, H.; Araújo, J.C. Green pit technology as a rural sanitation component for the semiarid region of Brazil. Eng. Sanit. Ambient. 2018, 23, 801–810. [Google Scholar] [CrossRef]
- Barreto, D. Residential water consumption pattern and internal uses of water. Ambient. Constr. 2008, 8, 23–40. Available online: https://seer.ufrgs.br/ambienteconstruido/article/download/5358/3280 (accessed on 27 January 2025). (In Portuguese with English Abstract).
- Makki, A.A.; Stewart, R.A.; Beal, C.D.; Panuwatwanich, K. Novel bottom-up urban water demand forecasting model: Revealing the determinants, drivers and predictors of residential indoor end-use consumption. Resour. Conserv. Recycl. 2015, 95, 15–37. [Google Scholar] [CrossRef]
- Costa, T.H.S.; Mota, F.S.B. Quantitative analysis of greywater in a residential building. Eng. Sanit. Ambient. 2022, 27, 413–421. [Google Scholar] [CrossRef]
- Santos Junior, E.L.d. Tecnologia alternativa para tratamento seletivo dos resíduos provenientes da bacia sanitária em comunidades rurais (Alternative technology for selective treatment of waste from sewage basins in rural communities). Doctoral Thesis, State University of Western of Paraná, Cascavel, Brazil, 2019. Available online: https://tede.unioeste.br/handle/tede/4203 (accessed on 11 November 2024). (In Portuguese).
- Moruzzi, R.B. Estimating disposal of rainwater on sewage system by means of rainwater harvesting practices in households. Eng. Sanit. Ambient. 2016, 21, 85–94. [Google Scholar] [CrossRef]
- Kujawa-Roeleveld, K.; Zeeman, G. Anaerobic treatment in decentralized and source-separation-based sanitation concepts. Rev. Environ. Sci. Biotechnol. 2006, 5, 115–139. [Google Scholar] [CrossRef]
- Samways, G.; Andreoli, C.V.; Aisse, M.M.; Rietow, J.C.; Rossetti, G.R.C.; Bico, A.K. Technical Note 8—Codisposition of septic tank sludge in wastewater treatment. Cad. Téc. Eng. San. Ambient. 2023, 3, 95–111. [Google Scholar] [CrossRef]
- Pamplona, S.; Venturi, M. Esgoto à flor da terra (Sewage on the surface of the earth). Perma. Brasil 2004, Year VI, 16. Available online: https://fazenda.paginas.ufsc.br/files/2017/02/Pamplona-Venturi-Permacultura-Brasil-2004-n16.pdf (accessed on 28 January 2025). (In Portuguese).
- Paulo, P.L.; Galbiati, A.F.; Magalhães Filho, F.J.C.; Bernardes, F.S.; Carvalho, G.A.; Boncz, M.Á. Evapotranspiration tank for the treatment, disposal and resource recovery of blackwater. Resour. Conserv. Recycl. 2019, 147, 61–66. [Google Scholar] [CrossRef]
- Magalhães Filho, F.J.C.; De Queiroz, A.A.F.S.L.; Machado, B.S.; Paulo, P.L. Sustainable Sanitation Management Tool for Decision Making in Isolated Areas in Brazil. Int. J. Environ. Res. Public Health 2019, 16, 1118. [Google Scholar] [CrossRef]
- Hube, S.; Saqout, T.; Ögmundarson, O.; Anddradóttir, H.O.; Wu, B. Constructed wetlands with recycled concrete for wastewater treatment in cold climate: Performance and life cycle assessment. Sci. Total Environ. 2023, 904, 166778. [Google Scholar] [CrossRef] [PubMed]
- Reis, M.C.G.; Borges, A.C.; Da Cunha, F.F.; Da Silva, R.R. Evapotranspiration beds as a zero-discharge nature-based solution for wastewater disposal: A review. Ecol. Eng. 2023, 189, 106896. [Google Scholar] [CrossRef]
- Rose, C.; Parker, A.; Jefferson, B.; Cartmell, E. The characterization of feces and urine: A review of the literature to inform advanced treatment technology. Crit. Rev. Environ. Sci. Technol. 2015, 45, 1827–1879. [Google Scholar] [CrossRef] [PubMed]


| Code | Name of Quilombola Community | Water Source | Municipality | Number of Residents Per Household | Total Households and Estimated Population (cap/HH) | Distance from Goiânia * (km) |
|---|---|---|---|---|---|---|
| R1 | Almeidas | WSS (a) | Silvânia | 8 | 42 (3 cap/HH [20] | 83 |
| R2 | Queixo Dantas | WSS (a) | Mimoso de Goiás | 8 | 17 (5 cap/HH [21] | 267 |
| R3 | Porto Leucádio | WSS (b) | São Luíz do Norte | 5 | 10 (4 cap/HH) [22] | 246 |
| R4 | Fazenda Santo Antônio da Laguna | IAS (b) | Barro Alto | 2 | 18 (3 cap/HH) [23] | 249 |
| R5 | José de Coleto | WSS (b) | Colinas do Sul | 1 | 11 (3 cap/HH) [24] | 393 |
| R6 | Rafael Machado | IAS (b) | Niquelândia | 1 | 18 (4 cap/HH) [25] | 377 |
| Total | 6 communities | 132 households |
| Cp (L/cap.day) | Authorship | Type of Work | Area of Study |
|---|---|---|---|
| 9.9 (*) | [13] | Dissertation | Rural |
| 11.6 (*) | [26] | Dissertation | Urban |
| 13.1 (**) | [27] | Article | Rural |
| 14.0 (*) | [28] | Article | Urban |
| 21.2 (**) | [29] | Article | Urban |
| 25.3 (**) | [30] | Article | Urban |
| 33.0 (**) | [31] | Thesis | Rural |
| 36.0 (**) | [32] | Article | Urban |
| 51.5 (*) | [14] | FCW | Urban |
| Area of Study | Demography (cap/HH) | Period | Interval (days) | Va (L/day) | Average Volume (L/day) | Cp (L/cap.day) |
|---|---|---|---|---|---|---|
| R1 | 8 (4 adults, 4 children) | 8 April 2024 to 8 November 2024 | 214 | 29.583 | 138.24 | 17.28 |
| R2 | 8 (4 adults, 2 teenagers, 2 children) | 19 September 2024 to 7 September 2024 | 49 | 4.744 | 96.81 | 12.10 |
| R3 | 5 (3 adults, 1 teenager, 1 children) | 30 September 2023 to 13 June 2024 and 7 July 2024 to 25 August 2024 | 306 | 22.285 | 72.83 | 14.57 |
| R4 | 2 (adults) | 13 February 2024 to 8 November 2024 | 269 | 11.725 | 43.59 | 21.79 |
| R5 | 1 (adult) | 29 February 2024 to 18 October 2024 | 232 | 2.878 | 12.41 | 12.41 |
| R6 | 1 (elderly) | 16 December 2023 to 7 November 2024 | 327 | 6.259 | 19.14 | 19.14 |
| Average | 16.22 | Average | ||||
| CV | 0.239 | CV |
Disclaimer/Publisher’s Note: The statements, opinions and data contained in all publications are solely those of the individual author(s) and contributor(s) and not of MDPI and/or the editor(s). MDPI and/or the editor(s) disclaim responsibility for any injury to people or property resulting from any ideas, methods, instructions or products referred to in the content. |
© 2025 by the authors. Licensee MDPI, Basel, Switzerland. This article is an open access article distributed under the terms and conditions of the Creative Commons Attribution (CC BY) license (https://creativecommons.org/licenses/by/4.0/).
Share and Cite
da Silva, A.C.; Scalize, P.S.; Albuquerque, A. Assessment of per Capita Contribution to Fecal Sewage in Rural Residences of Quilombola Communities. Water 2025, 17, 1350. https://doi.org/10.3390/w17091350
da Silva AC, Scalize PS, Albuquerque A. Assessment of per Capita Contribution to Fecal Sewage in Rural Residences of Quilombola Communities. Water. 2025; 17(9):1350. https://doi.org/10.3390/w17091350
Chicago/Turabian Styleda Silva, Adivânia Cardoso, Paulo Sérgio Scalize, and António Albuquerque. 2025. "Assessment of per Capita Contribution to Fecal Sewage in Rural Residences of Quilombola Communities" Water 17, no. 9: 1350. https://doi.org/10.3390/w17091350
APA Styleda Silva, A. C., Scalize, P. S., & Albuquerque, A. (2025). Assessment of per Capita Contribution to Fecal Sewage in Rural Residences of Quilombola Communities. Water, 17(9), 1350. https://doi.org/10.3390/w17091350