Article

Compression Characteristics and Damage Constitutive Model of Loess Under Dry–Wet and Freeze–Thaw Cycles

College of Architecture and Civil Engineering, Xi’an University of Science and Technology, Xi’an 710054, China
*
Author to whom correspondence should be addressed.
Water 2025, 17(9), 1328; https://doi.org/10.3390/w17091328
Submission received: 6 March 2025 / Revised: 5 April 2025 / Accepted: 14 April 2025 / Published: 29 April 2025

Abstract

:
The study of the compression characteristics of loess in seasonal regions involves analyzing the mechanical properties and mesoscale damage evolution of intact loess subjected to dry–wet freeze–thaw cycles. This study meticulously examines the evolution of the stress–strain curve at the macroscale and the pore structure at the mesoscale of loess by consolidation and drainage triaxial shear tests, as well as nuclear magnetic resonance (NMR), under varying numbers of dry–wet freeze–thaw cycles. Then, utilizing the Duncan–Chang model (D-C), the damage model for intact loess is derived based on the principles of equivalent strain and Weibull distribution, with testing to verify its applicability. The results indicate that the stress–strain curve of undisturbed loess exhibits significant strain softening during the initial stage of the freeze–thaw dry–wet cycle. As the number of cycles increases, the degree of strain softening weakens and gradually exhibits a strain-hardening morphology; the volume strain also changes from dilatancy to shear contraction. According to the internal pore test data analysis, the undisturbed loess contributes two components to shear strength: cementation and friction during the shear process. The cementation component of the aggregate is destroyed after stress application, resulting in a gradual enlargement of the pore area, evidenced by the change from tiny pores into larger- and medium-sized pores. After 10 cycles, the internal pore area of the sample expands by nearly 35%, indicating that the localized damage caused by the dry–wet freeze–thaw cycle controls the macroscopic mechanical properties. Finally, a damage constitutive model is developed based on the experimental phenomena and mechanism analysis, and the model’s validity is verified by comparing the experimental data with theoretical predictions.

1. Introduction

The Loess Plateau is situated in a location characterized by arid conditions and seasonal frost, resulting in the loess slope soil experiencing periodic dry–wet freeze–thaw cycles, which leads to the deterioration of shallow loess strength, thus inducing landslide disasters [1]. The undisturbed loess exhibits a large pore structure and cementation structure. The synergistic effect of freeze–thaw and dry–wet cycles causes cementation failure and changes in internal pore structure, thus influencing the evolution of its mechanical properties [2,3,4,5,6]. This interaction process facilitates the accumulation of irreversible soil degradation, resulting in a potential attenuation of shear strength and deformation modulus, eventually leading to the slope’s instability.
The structural properties of loess are the core of soil mechanics, and freeze–thaw and dry–wet cycles are essentially damaging to these properties. Many results have been observed when studying the mechanical properties of soils under freeze–thaw cycles, dry–wet cycles, or both [7,8,9]. Fan et al. [10] conducted a collapsible loess mechanical properties test under dry–wet and freeze–thaw conditions and found that shear strength demonstrated a three-stage rapid decrease development trend with increased cycles. As the pore size increases, the compression coefficient, index, and cycle count have a distinct functional relationship with the drop. Conversely, the small- and medium-sized pores enlarge while the particle size progressively diminishes. Zhang et al. [11,12] conducted a study on the alteration of compression and permeability properties of soil due to dry–wet freeze–thaw cycles, revealing that the influence of dry and wet conditions on the permeability coefficient of soil is more pronounced than that of freeze–thaw cycles. Based on microscopic tests, Mu [13] revealed the changing rules of soil parameters, such as porosity, under dry and wet cycling through fractal theory. Gao et al. [14] revealed contrasting microstructural responses of Malan loess to dry–wet cycles; the open-environment cycles reduced structural strength due to ionic leaching and cementation loss with each cycle and quantitatively linked hydraulic boundaries to microscale structural divergence. Zhang et al. [15] analyzed the microscopic pore structure of soil from a specific angle using microscopic tests, and the results demonstrate that the apparent porosity of soil increased after experiencing the dry–wet and freeze–thaw cycles; the pore changes were mainly reflected in the large and medium pores. Lian et al. [16] demonstrated that dry–wet cycling significantly increased loess creep deformation, with triaxial tests revealing exponential decay in long-term strength according to the number of cycles (72.3% reduction within the first five cycles). An SEM-IPP analysis demonstrates that aggregate clustering and skeleton rearrangement transformed initial dense structures into macroporous configurations, directly correlating pore evolution with mechanical weakening. Li et al. [17] found that the loess specimens’ unconfined compressive strength, elastic modulus, and cohesion decrease with increasing WD and FT cycles, while the vertical compression strain and collapse deformation increase for densely compacted loess. Zhang et al. [18] combined the effect of W–D and F–T cycles on the shear strength evolution of Yili loess through cyclic and triaxial shear tests; with the increase in W–D and F–T cycles, the cohesion of loess decreases first and then gradually stabilizes, while the internal friction angle first grows and then drops before stabilizing. From the above research results, it can be seen that there are many studies on the mechanical properties of loess or soft soil under dry–wet and freeze–thaw cycles, and they focus on the influence of freeze–thaw times on strength or cohesion or internal friction angle, as well as the internal pore evolution mechanism. However, these test methods are primarily focused on direct shear test methods, which do not fully consider the mechanical degradation characteristics of loess under triaxial stress and the quantitative analysis of the multiscale pore conversion damage mechanism.
The study of the loess constitutive model for dry–wet and freeze–thaw cycles is mainly based on damage mechanics to consider the deterioration mechanism of its mechanical properties [19]. Conversely, damage mechanics-based approaches [20] explicitly address cumulative degradation via scalar or tensor damage variables [21,22,23]. Nevertheless, most existing damage models focus solely on freeze–thaw or drying–wetting processes individually, overlooking their synergistic effects.
Many studies on the macroscopic and microscopic properties under the action of dry–wet and freeze–thaw cycles have been carried out and some results have been obtained, which are essential for further research. However, the damage mechanism under the two alternating actions must be further studied regarding the undisturbed loess. To this end, in-depth studies on the mesoscopic change characteristics of loess under undisturbed conditions are carried out through a combination of indoor experiments and theoretical analyses to reveal its mesoscopic deformation mechanism and to establish a constitutive model of loess damage applicable to dry–wet and freezing–thawing coupling conditions.

2. Materials and Methods

2.1. Samples

The soil used in this study was taken from a slope in the Loess Plateau of China (Figure 1), characterized by arid conditions and seasonal frost. To ensure that the tested sample is not disturbed by climate and no defects, the depth of the soil was roughly 3.0 m. After analysis, the soil was light yellowish-brown, and uniform. Meanwhile, according to the test, the basic physical indexes was determined, as shown in Table 1.

2.2. Dry–Wet and Freeze–Thaw Cycles (DWFT)

In this paper, loess samples are subjected to dry–wet and then freeze–thaw cycles, and compression tests are are carried out to study the mechanical deterioration behavior under dry–wet and freeze–thaw cycles. The following are the dry–wet and freeze–thaw cycle test steps:
(1)
Dry and wet cycle: The prepared triaxial specimens (height: 80 mm, diameter: 39.1 mm) were humidified by adding pure water to simulate the rainfall process in the humidifying cylinder, and then artificially dried in the electric blast drying box to simulate the evaporation behavior. The lower limit moisture content was 0.6 times the moisture content, and the upper limit was set as the saturated moisture content, and one cycle was 24 h.
(2)
Freeze–thaw cycle: The sample after the dry–wet cycle was placed in a freeze–thaw tester, and was frozen at −20 °C for 12 h, and the remaining 12 h were at a temperature of 20 °C, that is, the test time of each freeze–thaw cycle was 24 h.

2.3. Mechanical Test and NMR Test Scheme

(1)
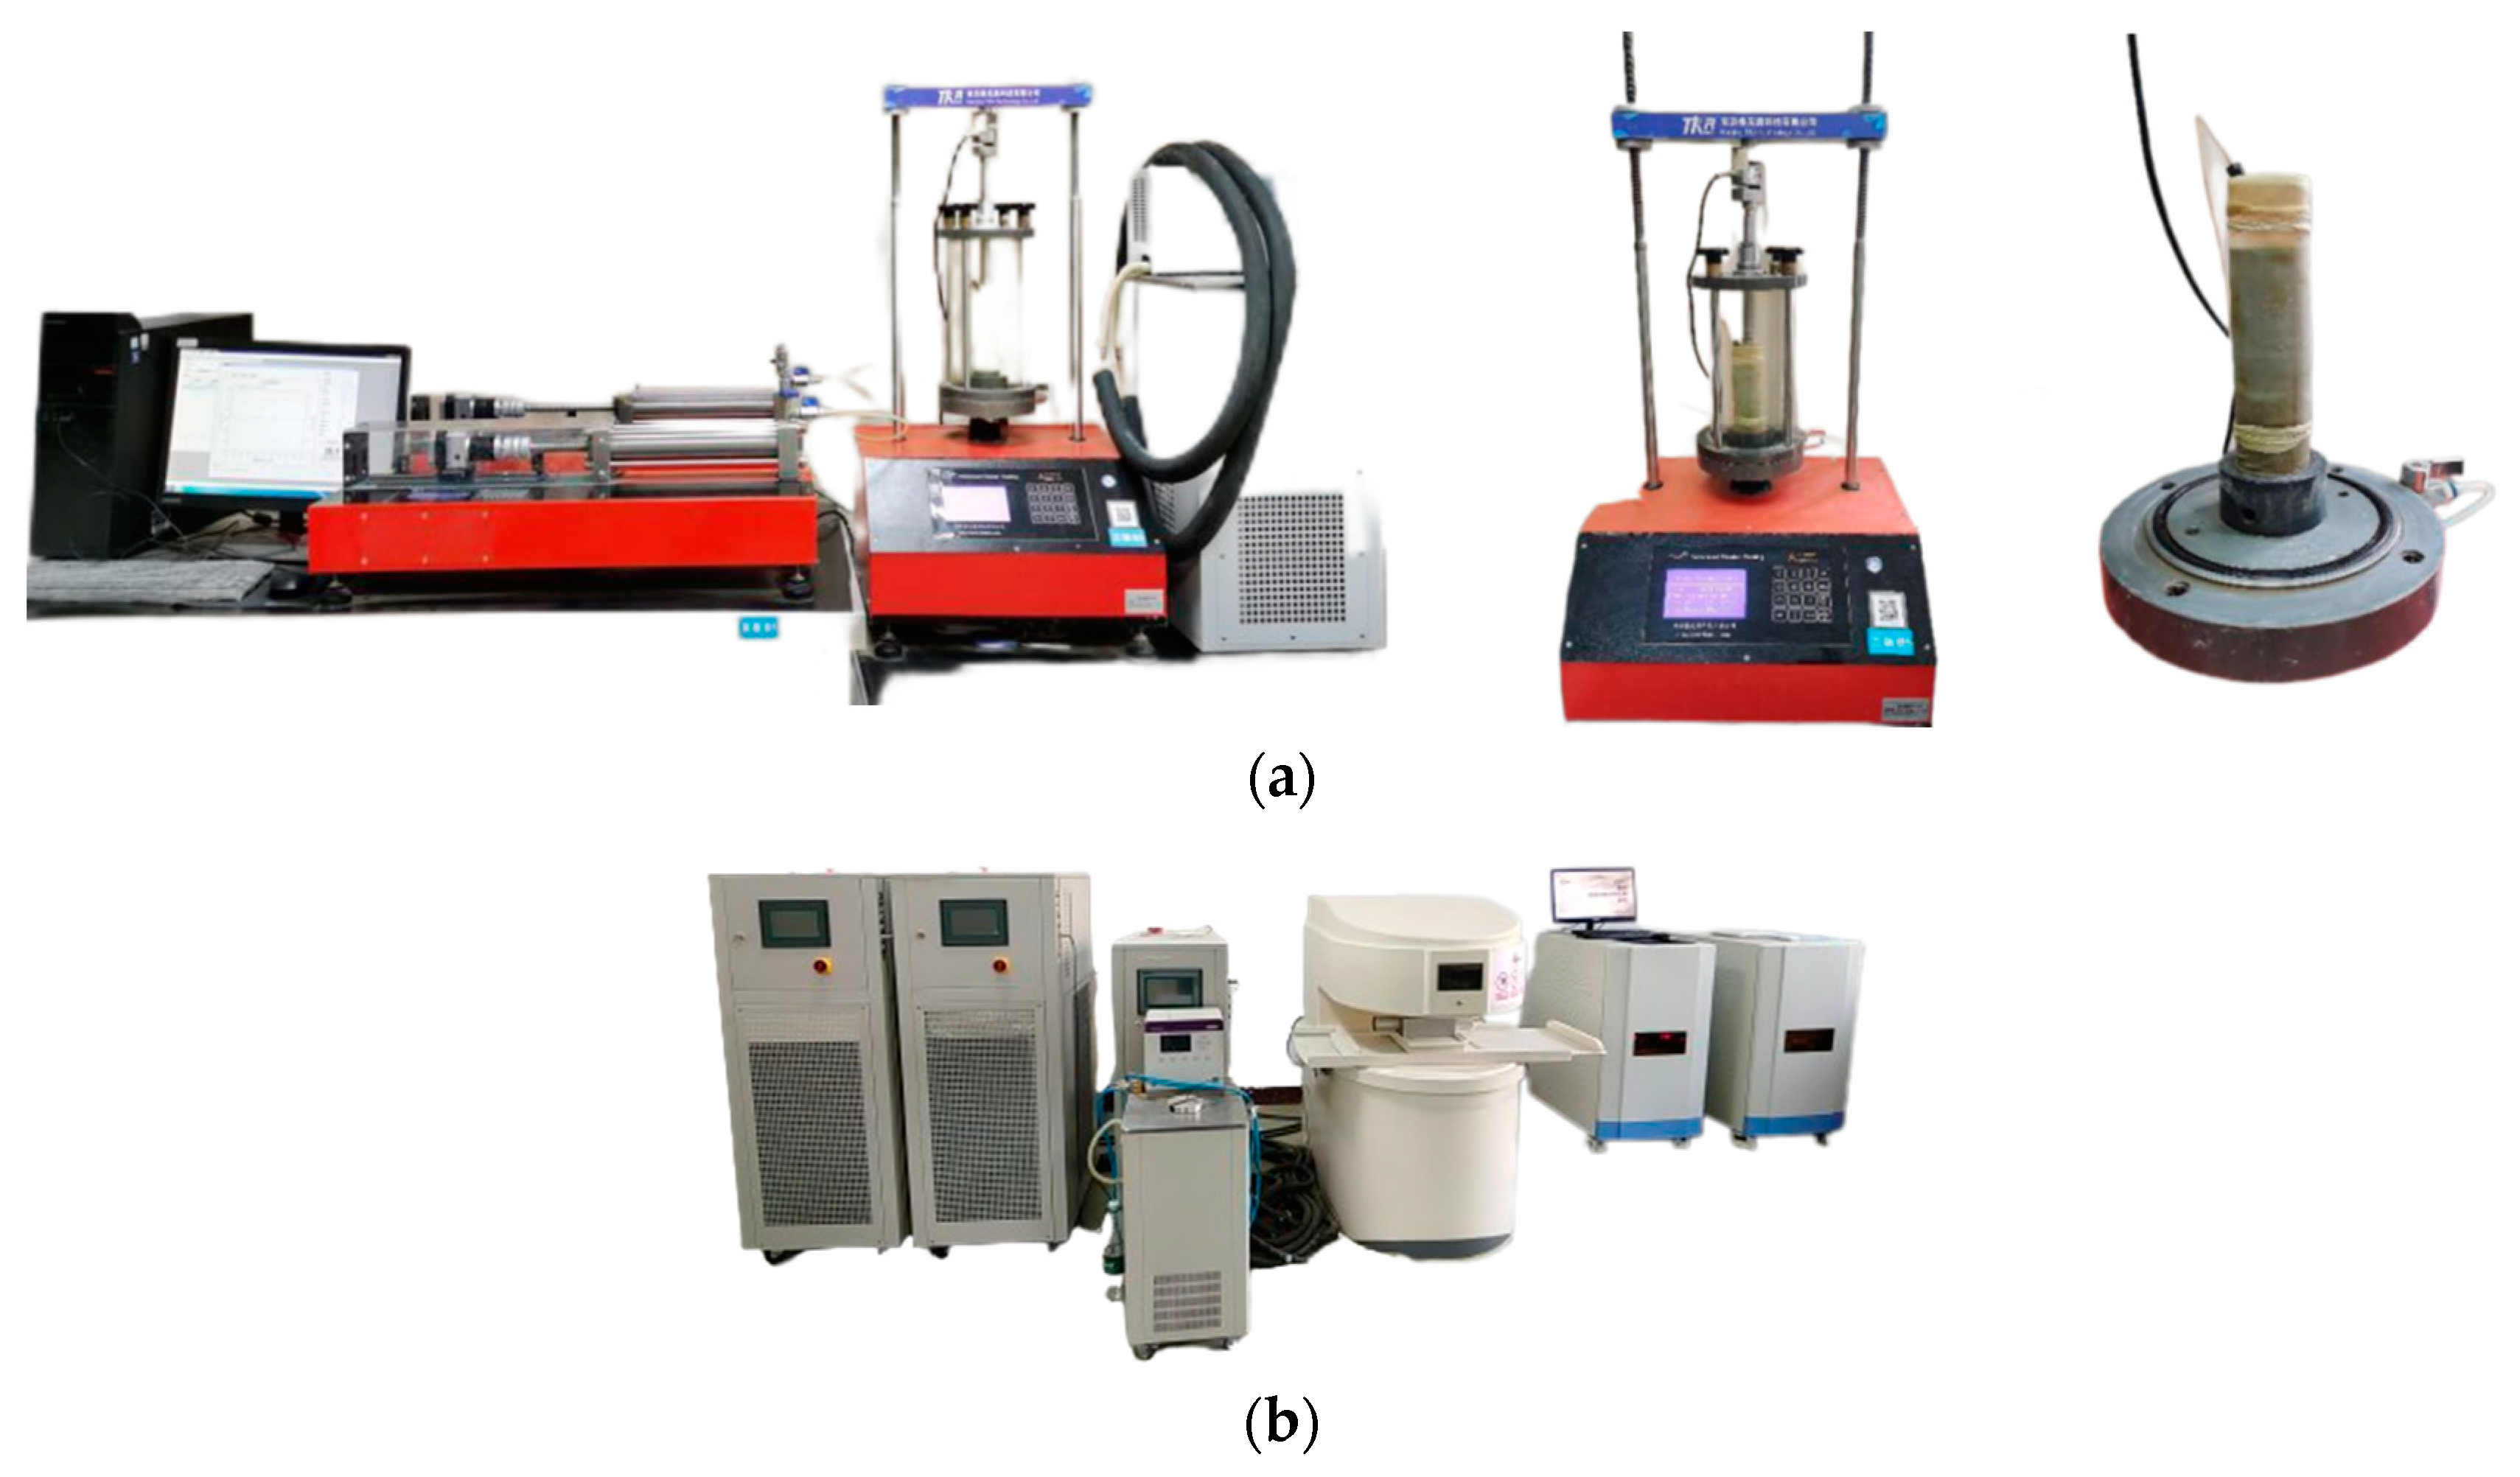
Triaxial shear test: After the completion of cyclic action, the triaxial shear test of loess samples was carried out; the test apparatus is shown in Figure 2a. The confining pressure was set to 50 kPa, 100 kPa, 200 kPa, and 400 kPa, and the loading axial displacement rate was set to 0.08 mm/min. The test was terminated by samples failure or axial strain of 15%.
(2)
Nuclear magnetic resonance testing of internal pores (NMR): The test principle of this method is to invert the internal pore structure of the saturated sample by measuring the signal amplitude of the fluid inside the sample, as shown in Figure 2b. After the loess sample is saturated, the surface relaxation time T2 of the pores is measured, and the distribution curve is given to determine the proportion of pores of different scales [25].
Figure 2. Mechanical test equipment and mesoscopic pore scanning equipment. (a) TKA-TTS-1WS triaxial shear (XLTE Co., Ltd., Xi’an, China); (b) Nuclear Magnetic Resonance (SHNMET Co., Ltd., Shanghai, China).
Water 17 01328 g002

3. Results

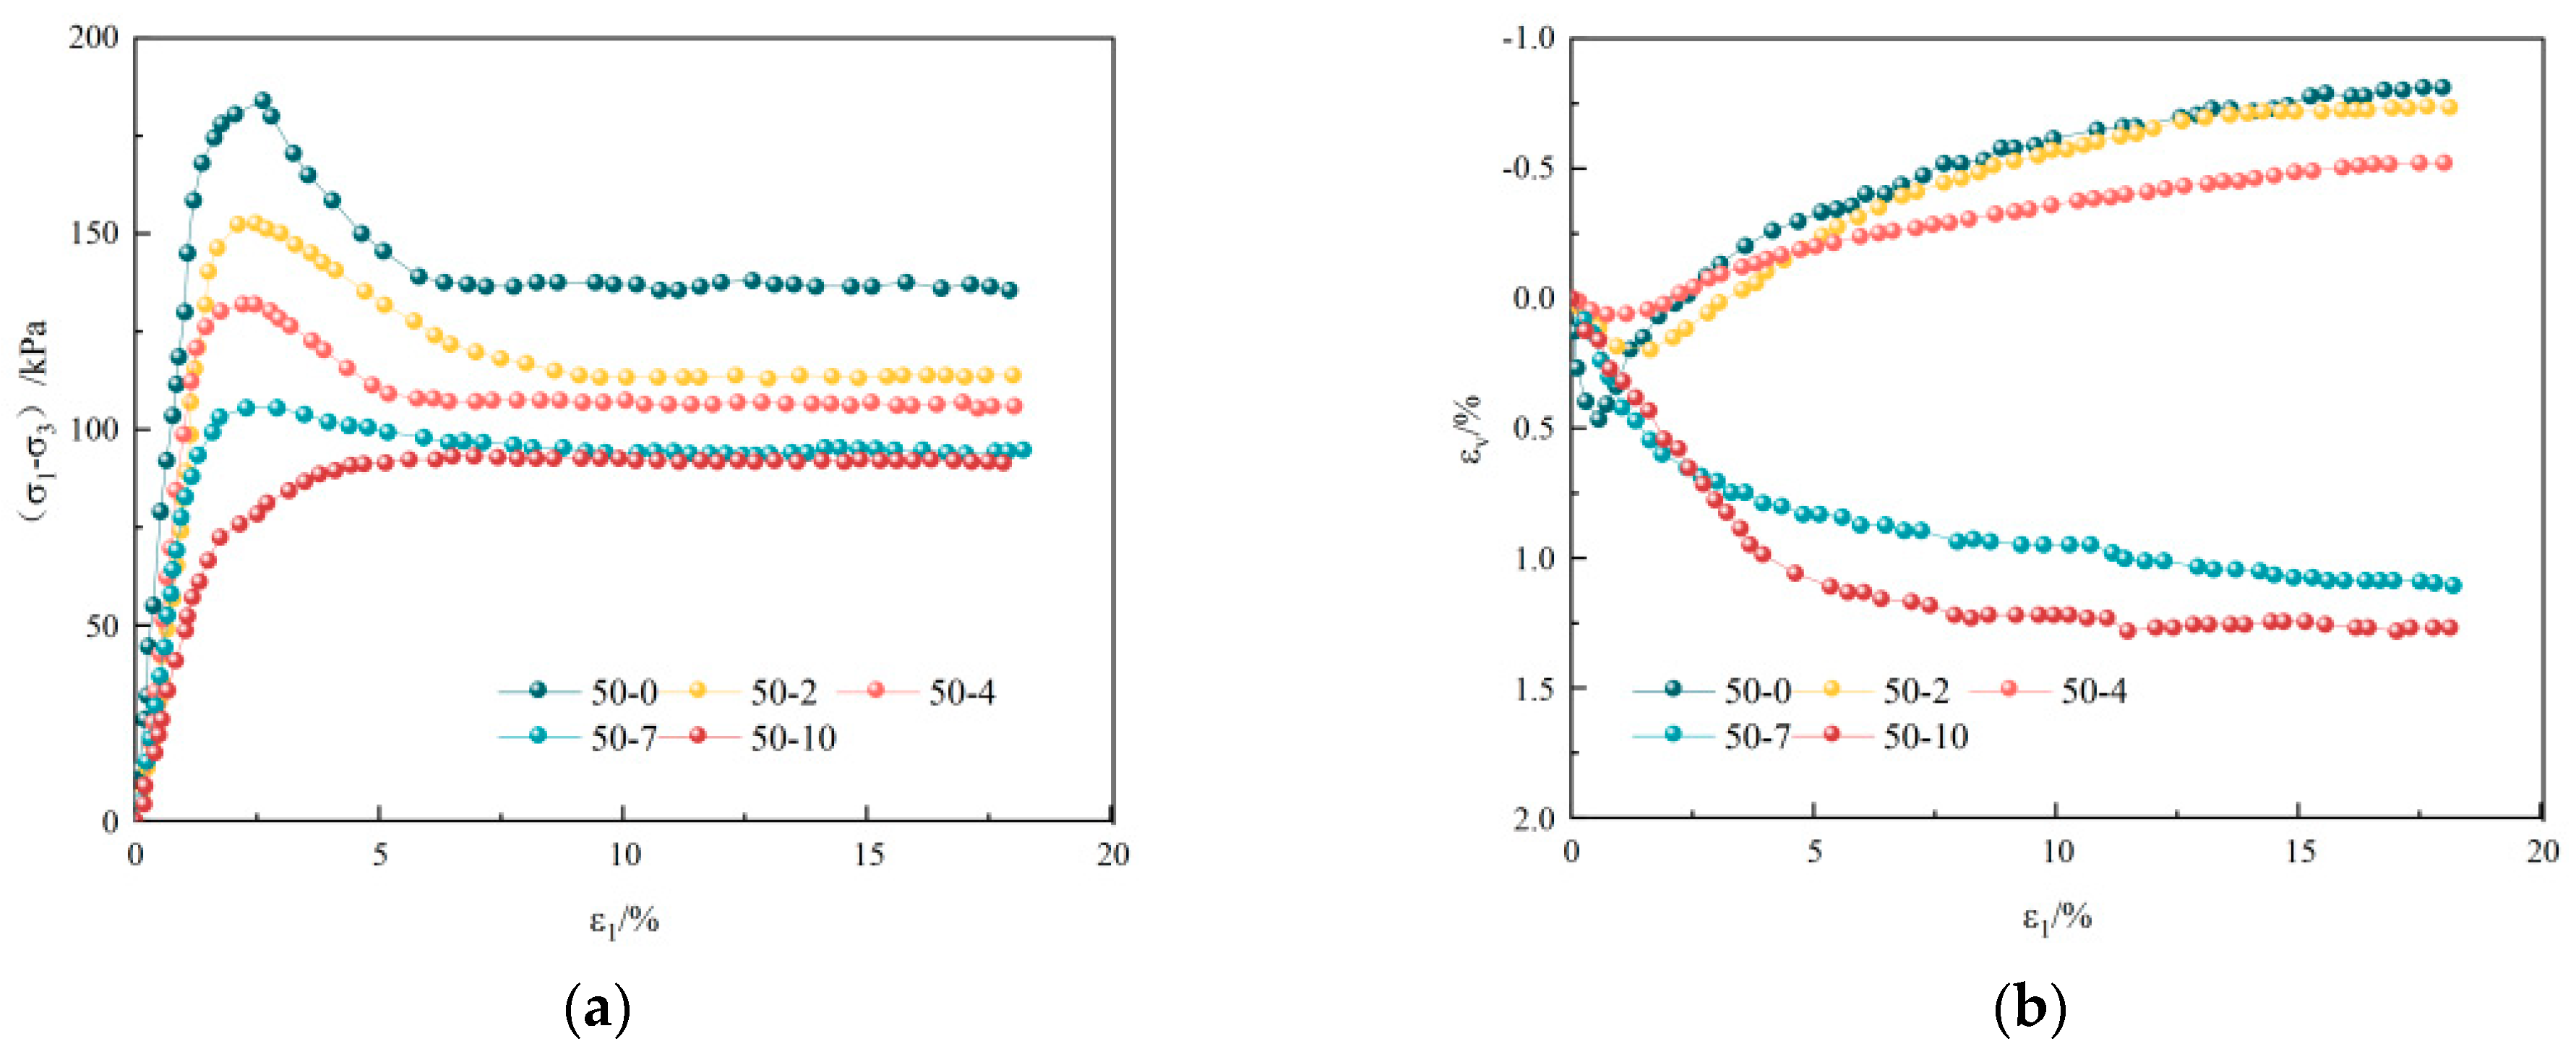
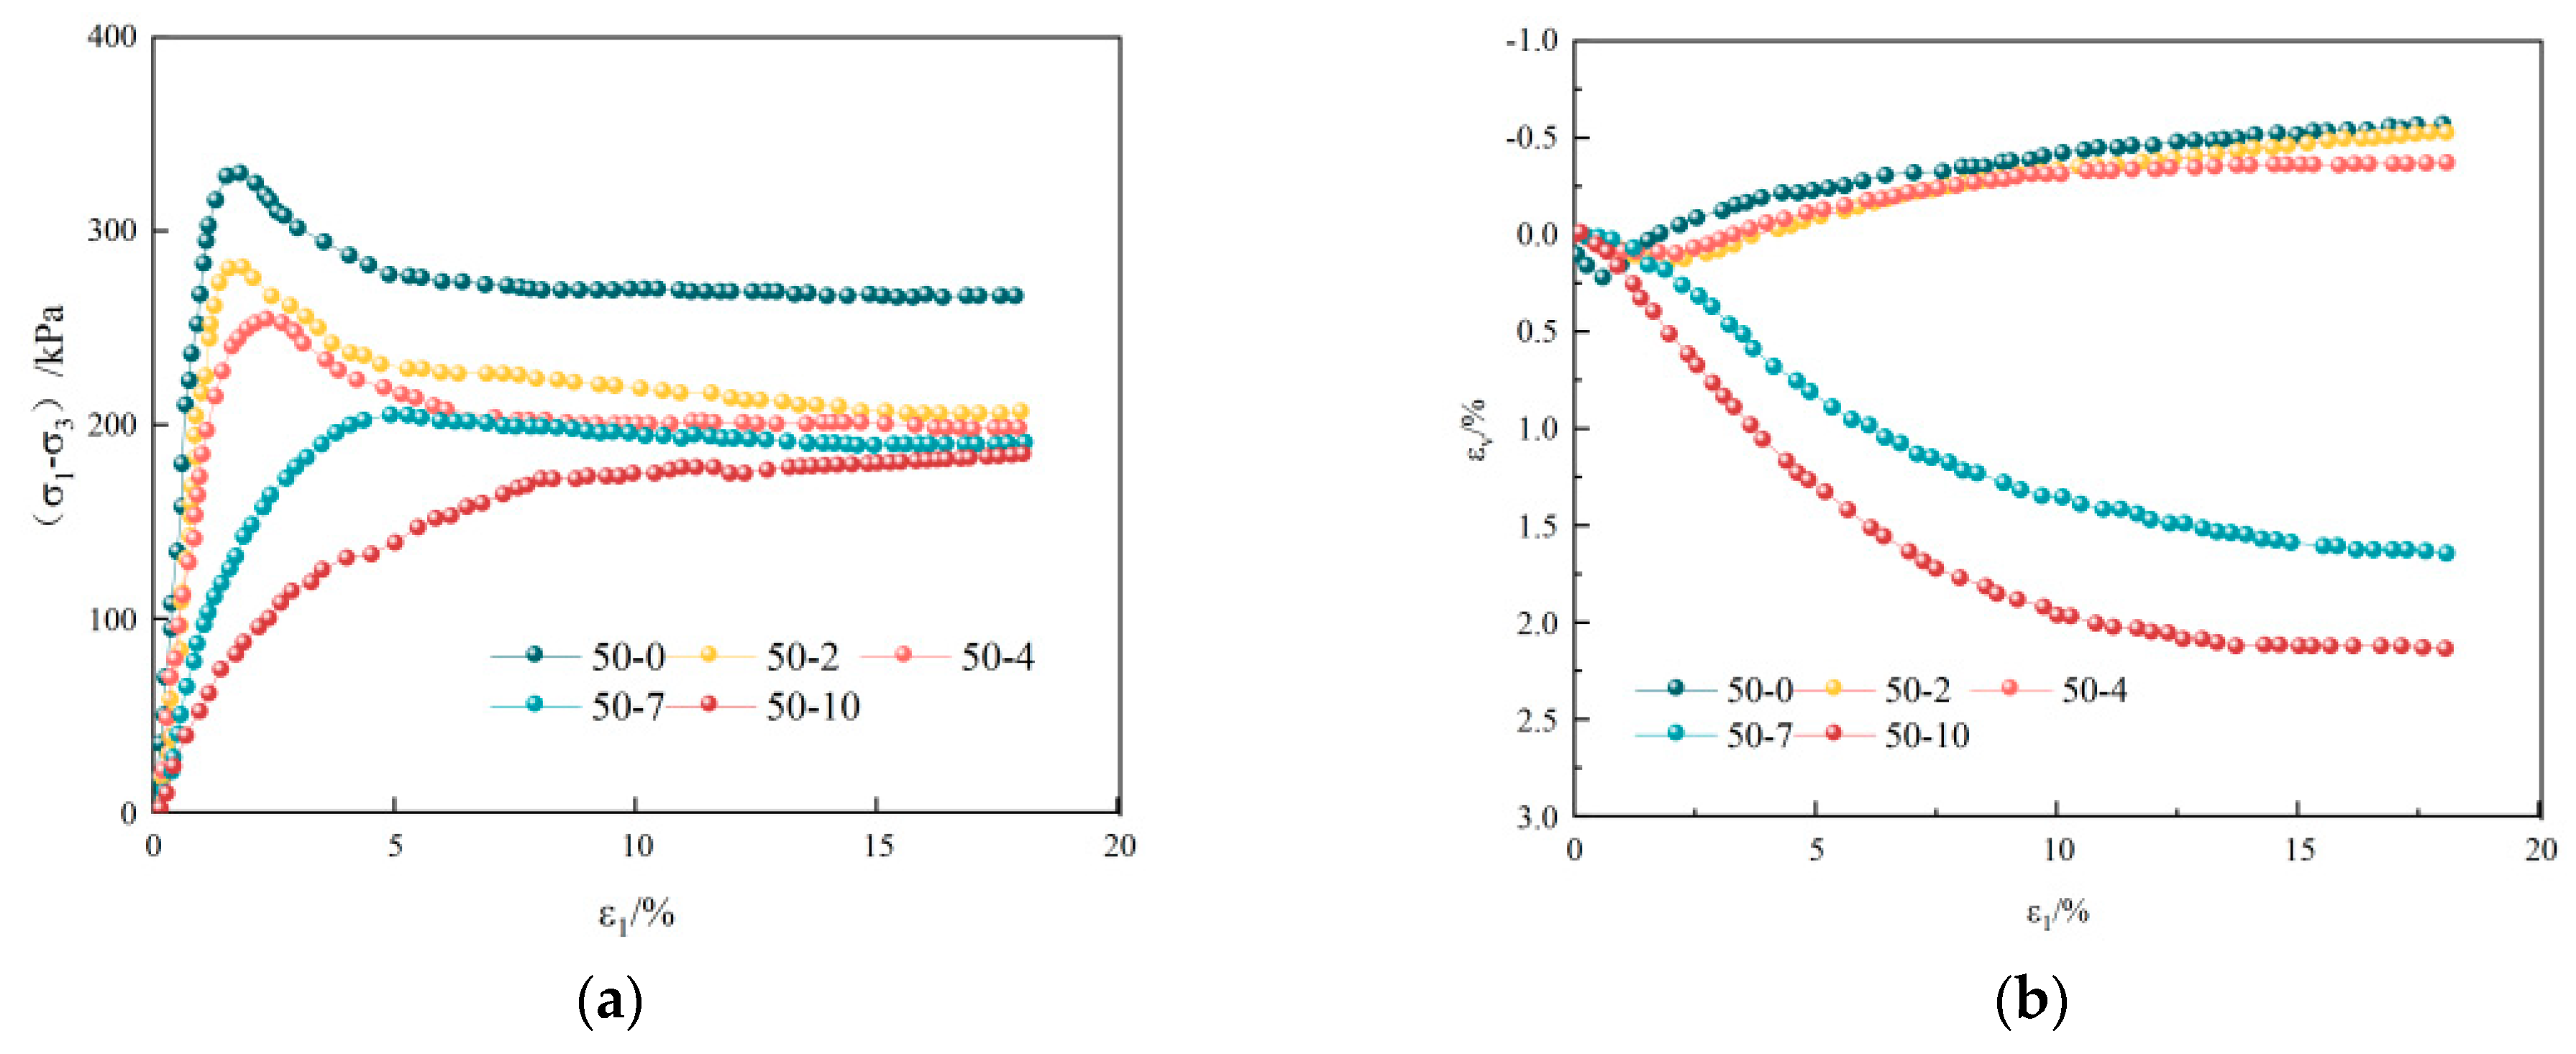
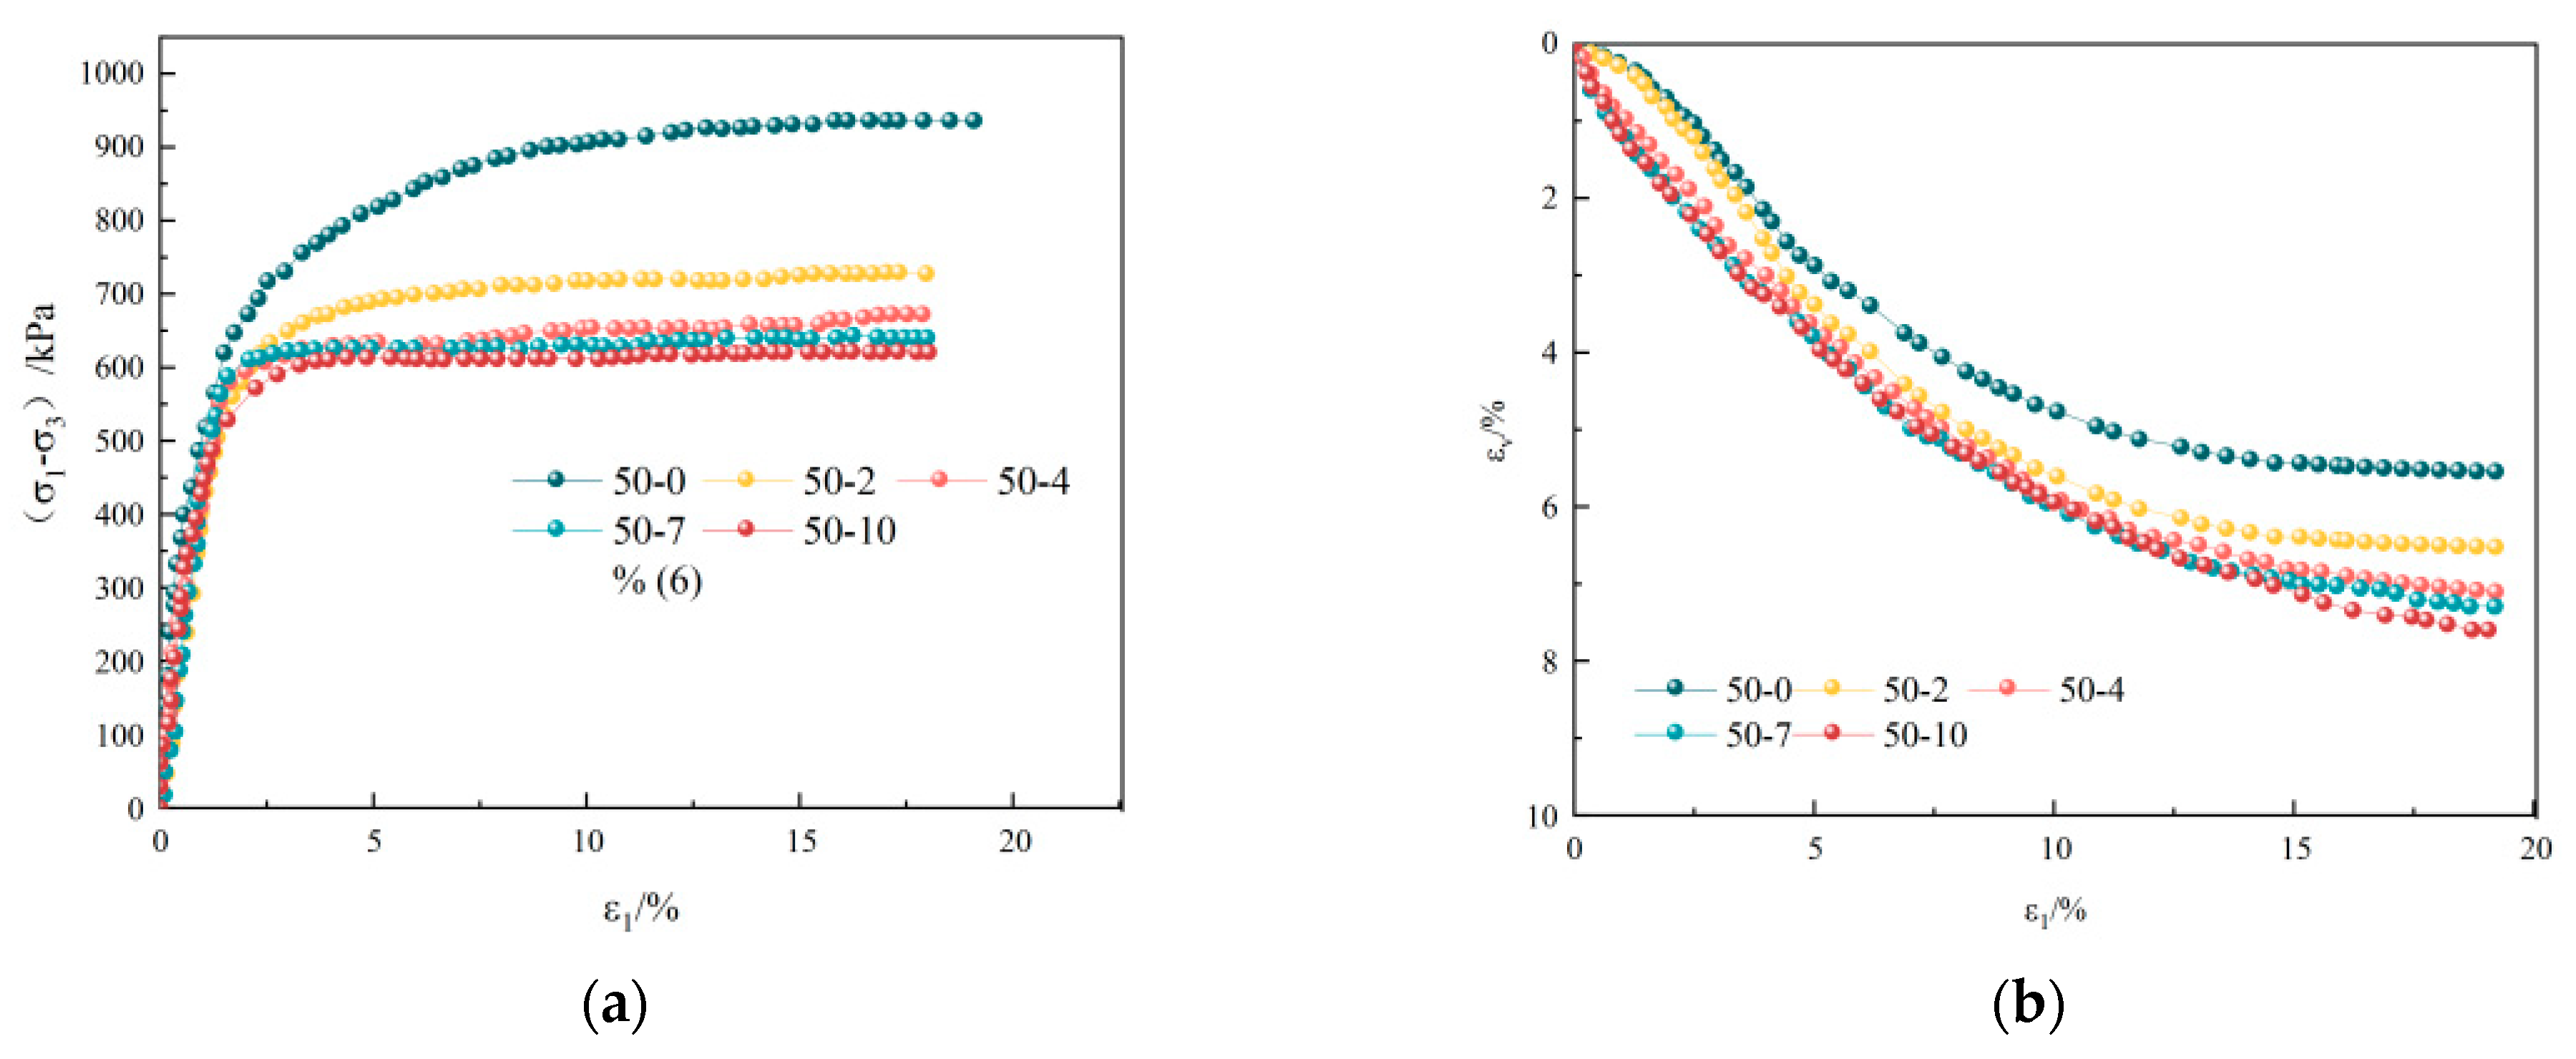
3.1. Stress–Strain Curve After Freeze–Thaw Dry–Wet Cycle of Loess

To deeply explore the joint action of the two, the axial strain–shear stress and axial strain–volumetric strain curves of the loess specimens under the dry–wet and freeze–thaw cycles were investigated, as shown in Figure 3, Figure 4, Figure 5 and Figure 6.
By analyzing Figure 3, Figure 4, Figure 5 and Figure 6, it can be seen that at the initial deformation stage, the strain shows a significant linear elastic growth trend, and the axial strain exceeds 3%, the test curve begins to show nonlinear characteristics, and the increasing rate of deviatoric stress gradually decreases and develops into strain hardening or soft exchange. Meanwhile, the strain softening occurs in the specimens under lower confining pressures and cycles, and the degree of softening decreases with the increase in the DWFT cycles. Along with the increase in the DWFT cycles, the initial increasing rate and peak value of deviatoric stress of the specimen gradually reduced, and the intensity decreased the most after two cycles, which weakened by 17.6%, 23.2%, 24.5%, and 18.1% under different confining pressures, respectively. The internal mechanism of this interesting test phenomenon is that at the beginning of the shear test, the shear strength of the loess mainly comes from the complete part of the internal cementation structure, which shows greater stiffness characteristics. However, with the continuous development of the shear process, the internal cemented blocks are gradually reduced and transformed into damaged structures. At the same time, the DWFT cycle process causes cementation damage to the loess sample in the initial state. Due to the phase change of ice water in the freeze–thaw cycle and the increase in water in the dry–wet cycle, the cementation material is damaged. As the DWFT cycle test continues, the initial damage of the cement block inside the sample gradually increases, and its stiffness against external load decreases, showing a decrease in shear strength and strain softening. However, as the number of cycles continues to increase, a new stable meso-structure is formed inside the loess sample. At this time, the degree of strain softening decreases and gradually changes to strain hardening, which approaches the mechanical properties of remolded soil.
The analysis of the axial strain–volumetric strain curve shows that when the confining pressure is 50–100 kPa, the loess sample exhibits a negative volume strain under fewer DWFT cycles, exhibiting dilatancy characteristics. With the increase in the number of DWFT cycles, the volumetric strain gradually shifts to a positive value, showing shear shrinkage characteristics and the curve is hyperbolic. With the increase in DWFT cycles, the final value of the volumetric strain shows a gradually increasing evolution trend. The internal mechanism may be due to the local damage of the internal cemented block, which leads to the overall weakening of the internal structure of the sample, the deterioration of the shear capacity, and finally the reduction in the resistance to volume deformation. When the number of DWFT cycles reaches 7 or 10, the internal structure of the loess sample tends to be stable, showing shear shrinkage characteristics, and the final volume strain tends to be stable.

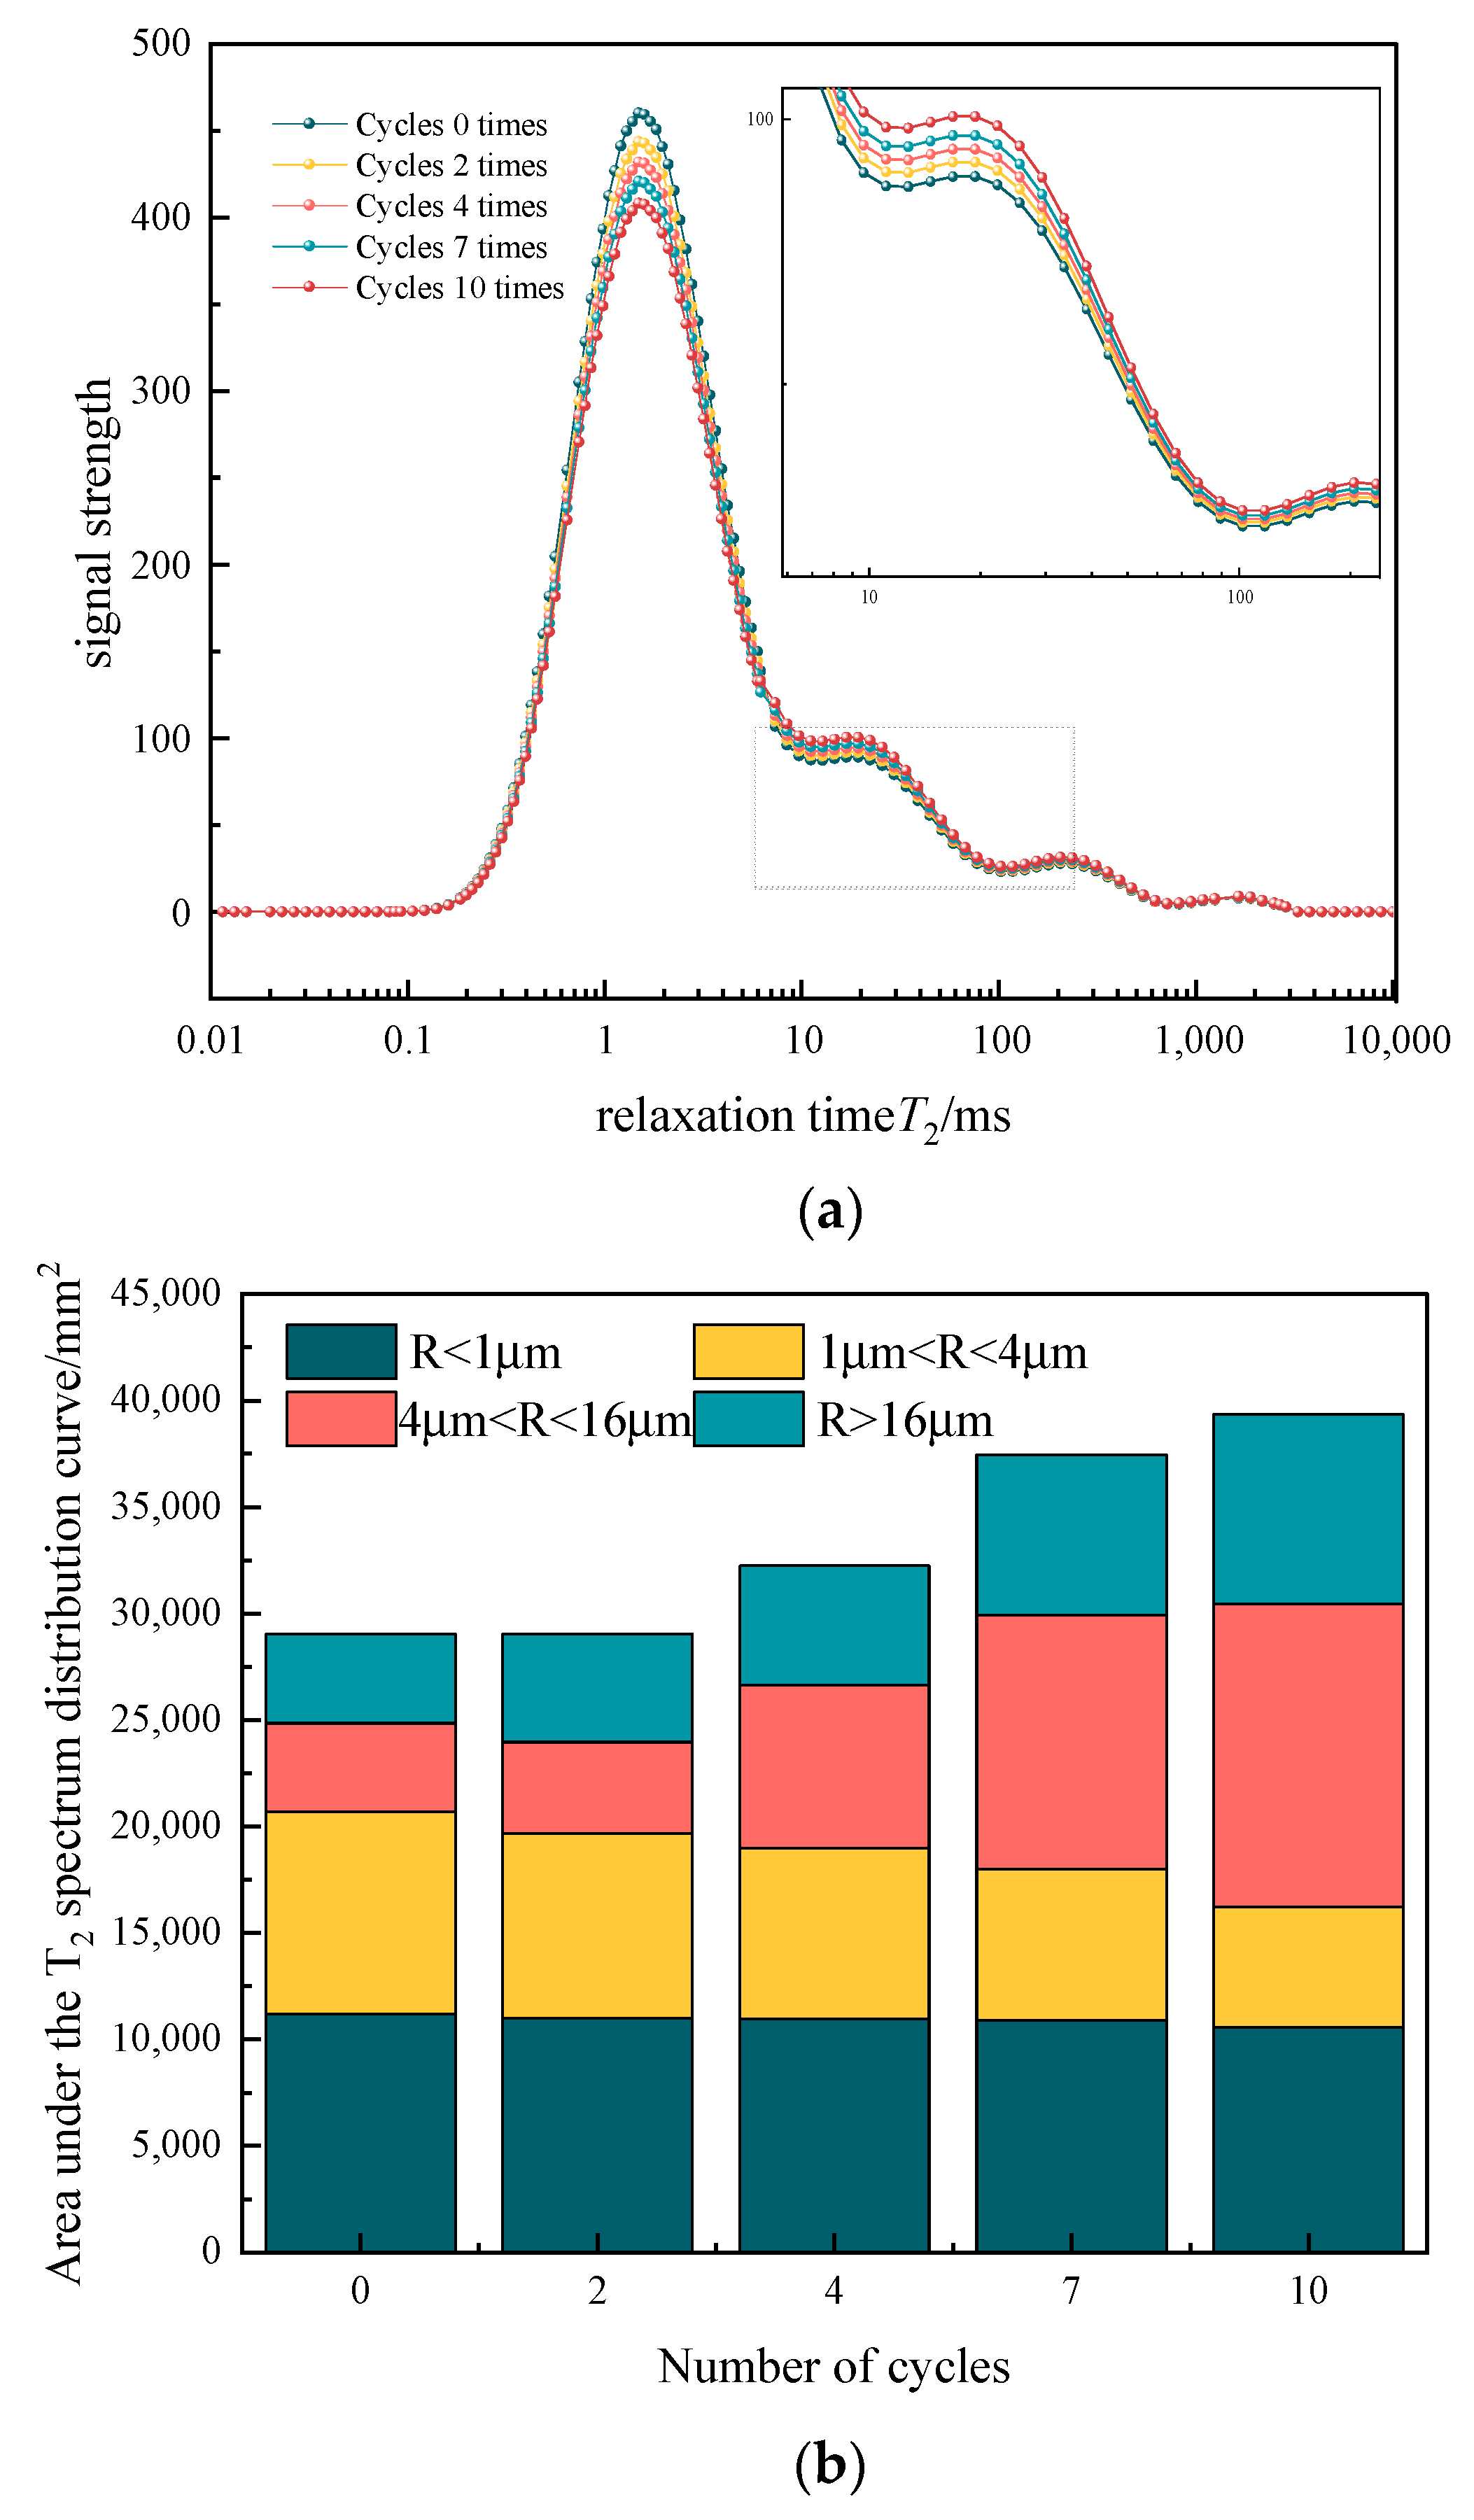
3.2. Analysis of Inner Pore Mechanisms

The fluid relaxation mechanisms within the pores of geotechnical materials include the relaxation of surface fluid, the relaxation of molecules’ own diffusion, and the free fluid relaxation. The relaxation time can be expressed by Equation (1).
1 T 2 = 1 T 2 f + 1 T 2 s + 1 T 2 d
where T 2 f is the T 2 relaxation time for a pore fluid in a sufficiently large space; T 2 s is the T 2 relaxation time due to surface relaxation; and T 2 d is the T 2 relaxation time due to molecular diffusion. The three mechanisms combine to produce a total T 2 relaxation time, and the percentage of all mechanisms depends on the fluid type and medium.
Free relaxation is a fluid property related to its physical properties and external factors, including temperature, pressure, and viscosity. For example, the free relaxation time of water can be calculated by Equation (2). Taking water as an example, its free relaxation time can be calculated by Equation (2):
1 T 2 f 3 T k 289 η
Assuming that the internal pores of the soil sample are sufficiently small, the surface relaxation is sufficiently slow, and the molecules can move continuously back and forth in the pores during the relaxation process, the contribution to the T 2 surface relaxation is mainly
1 T 2 s = ρ S V
where ρ is the strength of the T 2 relaxation on the particle surface; S V is the ratio of pore surface area to internal fluid volume.
From the above equation, it can be seen that the fluid time for surface relaxation is only related to its own properties, and the test can be completed at room temperature, giving a scale to parameters such as permeability and simplifying the interpretation process.
The diffusion relaxation can be expressed by Equation (4):
1 T 2 d = D γ G T e 2 12
where D is the diffusion coefficient; γ is the magnetic spin ratio; G is the magnetic field gradient; and T e is the echo time.
Combining Equations (1)–(4) gives
1 T 2 = 3 T k 289 η + ρ S V + D γ G T e 2 12
Loess is a porous medium, and its own relaxation is negligible during the study. The inversion of the relaxation signal was completed to obtain the T 2 time spectrum, from which we analyzed the characteristics of the fluid content inside the pores and the distribution of different pore sizes, as shown in Figure 7.
The T2 curve of the loess specimen under the DWFT cycles shows a three-peak distribution characteristic. It is demonstrated that the size of the internal pores of the loess is distributed in three intervals. The central peak is more prominent, distributed in a range of 0.3~−22 ms, with the lower area accounting for more than 39% of the total area of the curve. The remaining two secondary peaks, with the first being more pronounced than the second, have distributions ranging from 22 to 200 ms and 200 to 1080 ms, consistent with those observed under one-factor cycling. During the 0th DWFT cycle, the pore of loess predominantly comprises micro-pores and small holes, while the fraction of medium and large pores is comparatively minimal. After DWFT cycles, the area of the central peak of the T2 curve gradually decreases, the location of the secondary peak gradually increases, and the overall curve gradually moves to the right. This is the damage behavior of the internal cementation structure part of the loess sample under the action of repeated humidifying–freezing–melting, which leads to the interconnection of internal fine pores and the generation of medium and large pores, which increases the macro-scale volume. After the DWFT cycle is completed, the internal pore area of the sample increases by about 35%.
The specimen loses water and shrinks during dehumidification and drying, and the soil particles are mainly tensile damage to each other and break up to produce pores at the weak points of stress. In humidification and saturation, the water absorption and expansion due to the saturator constraints accumulate energy within the soil and fill the pore spaces with tiny particles under the water flow. In the freezing process, the internal moisture is transformed into ice crystals; the volume increases so that the internal particle structure is further broken, and so on. The thawing of the broken particles produces migration, a certain degree of repair to the pore space, the cyclic action, the original structure of the sample as a whole is lost, and the pores gradually become interconnected due to changes in the external environment. The interlinked pores divide the particle structure into smaller particle structures. After breakage, the micro-pores are filled by the small particles produced by slab rubber breakage, and the cementation ability of the sample will be weakened. Along with the increase in DWFT cycles, the internal structure gradually stabilized to form a new equilibrium structure; the pore space in the specimen increased significantly, with smaller cemented blocks as the skeleton. There are through cracks inside, and small particles generated by the breakage of the original structural blocks are attached to the particle connections, forming a relatively stable new structure.

4. Damage Constitutive Modeling

At present, a constitutive model considering the DWFT cycle is relatively rare, especially considering its damage mechanism, which has been proven to be the key behavior to control macro-scale deformation in the previous chapter.

4.1. Modeling

Kondner [25] proposed fitting general soil’s stress–strain curve from numerous triaxial experiments using a hyperbolic curve, in Equation (6). Later, Duncan and Chang [26] and others proposed an incremental elasticity model based on this hyperbolic stress–strain relationship, i.e., the Duncan–Chang (D-C) model.
σ 1 σ 3 = ε 1 a + b ε 1
The traditional D-C model is used to predict the stress–strain curve of loess under the DWFT cycle, which found that the prediction accuracy of the hardening curve is high, while the prediction accuracy of the softening curve is low. To accurately characterize its deformation characteristics, this paper uses an improved D-C model for analysis.
a = 1 E i
b = 1 σ 1 σ 3 m 2 ε 1 m E i
c = 1 E i ε 1 m 2
where Ei is the initial tangential modulus and ɛ1m is the axial strain corresponding to the peak bias stress.
Quantitative analysis of the NMR area was performed, and the following relationship was derived between the pore area within the loess and the number of cycles:
T m = 1.38 0.39 / 1 + N / 5 ^ 3.7
where N is the number of cycles, and T m is the ratio of the NMR area to the initial area for a different cycles.
Considering the influence mechanism of initial damage behavior on macroscopic mechanical properties of loess samples after the DWFT cycle, the empirical formula of initial deformation modulus can be established as follows:
E i = 5.03 E 20     e x p ( T m / 0.03 )
According to the equivalent strain methods, the strain in the damaged material caused by the macroscopic stress is equal to that in the undamaged material caused by the effective stress, and the following equation can be established:
σ = σ / ( 1 D )
Combining Equations (6) and (12) gives
σ 1 σ 3 = ε 1 a + b ε + c ε 1 2 1 D
The core of establishing the damage constitutive model of loess is to construct an appropriate damage factor. Due to the local damage of loess samples under the combined action of load, dry–wet and freeze–thaw cycles, a coupled damage evolution is proposed in this study:
D = D p + D q D p D q
where Dp and Dq are the damage factors for dry–wet and freeze–thaw cycling and loading, respectively, and DpDq are the damage factors for coupling effect.
The damage variable is defined through the modulus of elasticity, i.e.,
D p = 1 E n E 0
The damage variable is defined as the ratio of the damaged granular skeleton in the loaded state of the soil to the intact granular skeleton in the unloaded state, i.e.,
D q = X r X
It is assumed that the probability of strength damage of soil micro-elements is p ( y ) , and the number of damaged micro-elements during loading is
X r ( F ) = 0 F X p ( y ) d y
Then, the damage variable is
D q = 0 F p ( y ) d y
It is assumed that the distribution function of the intensity of the micro-element satisfies the Weibull distribution, and the probability density function of the Weibull distribution is
P ( ε ) = m F 0 ε F 0 m 1 exp ( ε F 0 ) m
Substituting Equation (19) into Equation (18) yields
D q = 1 exp ε F 0 m
This can be evidenced by combining Equations (14), (15), and (20):
D = 1 E n E 0 exp ε F 0 m
Combining Equations (13) and (21), the damage constitutive equation based on the D-C model is
σ 1 σ 3 = ε 1 a + b ε 1 + c ε 1 2 E n E 0 exp ε F 0 m
The above equation contains a , b , c , ε , F 0 parameters, of which a , b , c can be derived from experimental data, and ε , F 0 needs to be extrapolated to the calculation.
Equation (22) is obtained by deforming the parameter ε , F 0 :
a + b a + b ε 1 + c ε 1 2 E 0 E n ε 1 = exp ε F 0 m
Taking the logarithm on both sides gives
ln ln σ 1 σ 3 a + b ε 1 + c ε 1 2 E 0 E n ε 1 = m ln ε 1 m ln F 0
where m and m ln F 0 can be considered as the slope and intercept, respectively, for a linear fit to Equation (24).
Y = ln ln σ 1 σ 3 a + b ε 1 + c ε 1 2 E 0 E n ε 1
X = ln ε 1
b = m ln F 0
Then, Equation (24) can be simplified as:
Y = m X + b
The fitting method was used to obtain the parameters m and F0, up to which all the parameters have been solved.

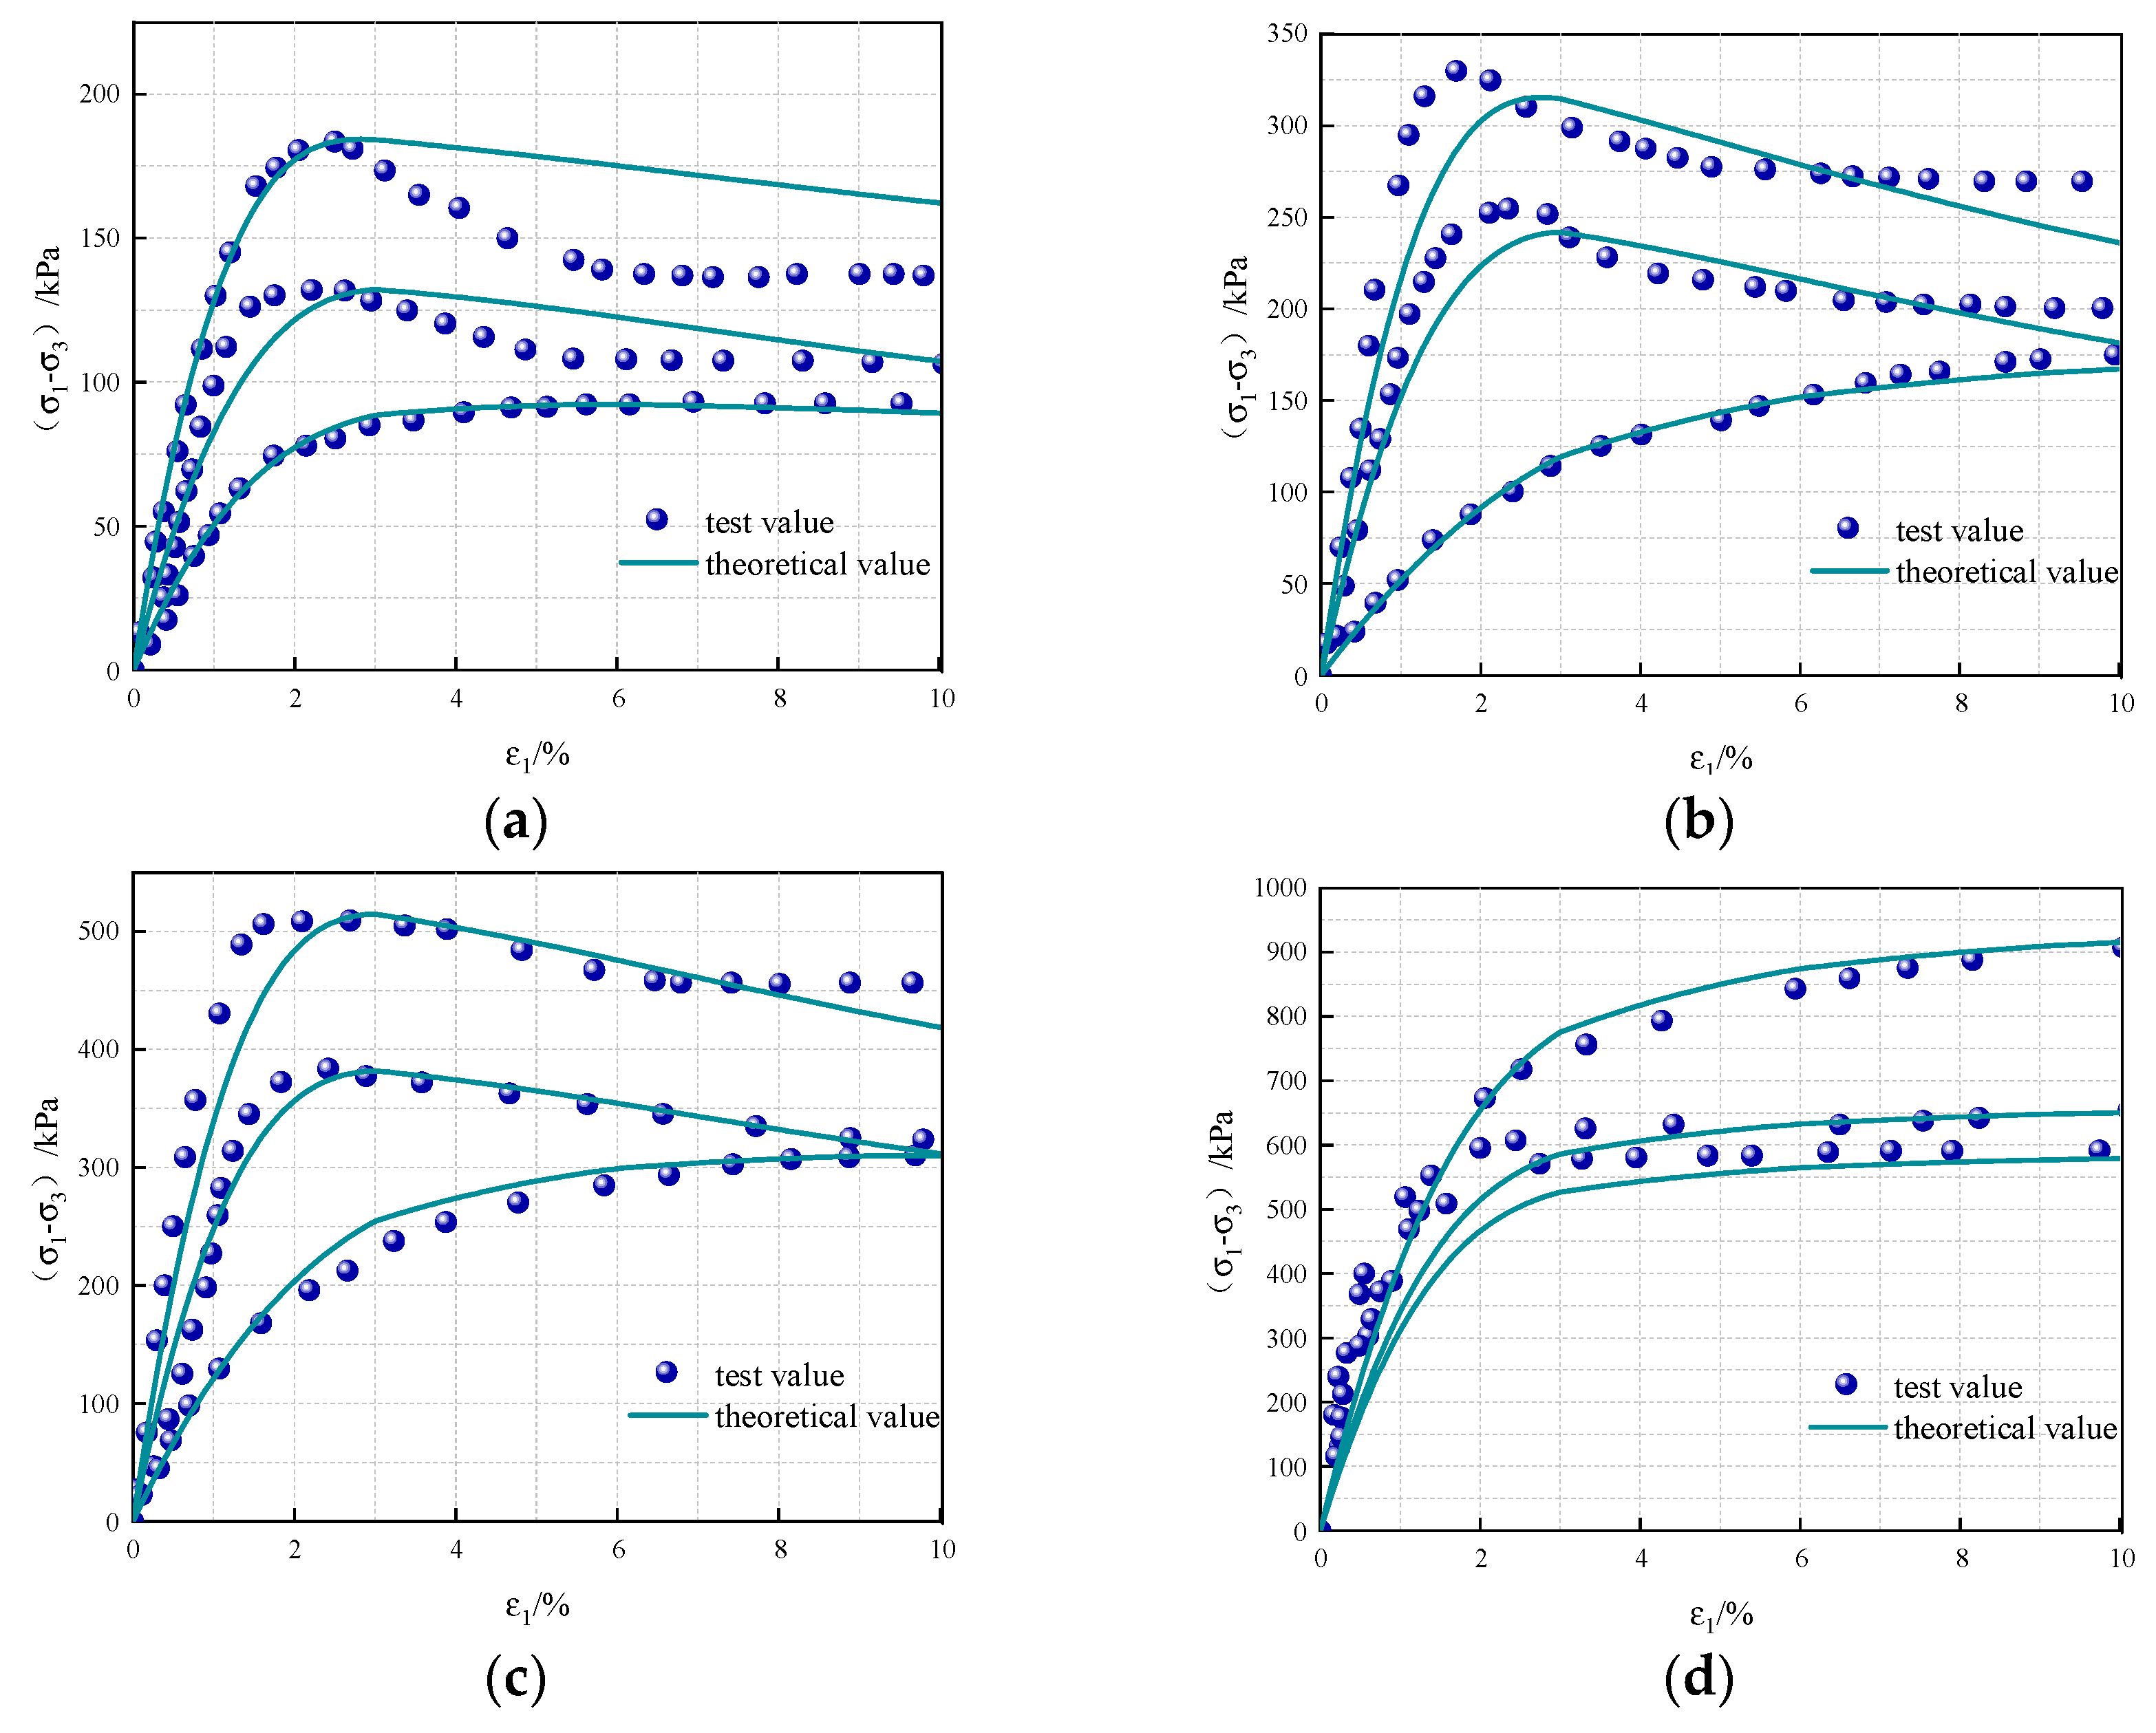
4.2. Model Validation

Through the above triaxial test, the parameters required for modeling in this study are extracted to validate the damage model under the action of the dry–wet and freeze–thaw cycles, and the model parameters are shown in Table 2.
We substituted the model parameters into Equation (22) and plotted the theoretical and experimental curves for a comparative analysis, as shown in Figure 8, with different confining pressures and three cycle times of 0, 4, and 10.
From Figure 8, the results show that the model can more accurately describe the deformation characteristics of loess under dry–wet and frost–thaw cycle coupling conditions, and its overall development trend is consistent with the experiments. Therefore, the damage model in this study can more accurately describe the damage law for loess under dry–wet and frost–thaw cycle coupling conditions well. However, the simulation accuracy of the model in this paper is reduced for the softening type in the larger axial strain, which may be due to the fact that the model in this paper does not emphasize the influence of plastic strain when considering the softening characteristics. In the current study of soil constitutive relations, the simulation of plastic deformation and softening characteristics is a theoretical difficulty involving transforming the yield surface in the stress space. In the next research work, this problem should be fully solved by using a multi-scale mechanics method and plastic mechanics perspective, so as to improve the model in this paper.

5. Conclusions

In this paper, the mechanical characteristics and inner pore evolution law of loess under the action of dry–wet and freeze–thaw cycles are studied in detailed, as follows:
(1)
In the shear test, the deformation characteristics of loess samples show strain softness under low confining pressure and low cycle times and gradually transform into hardening with the increase in cycle times. In the shear process, the DWFT cycle makes the internal cementation damage control the macroscopic mechanical behavior.
(2)
The dry–wet and freeze–thaw cycles can change the internal pore structure of loess samples. After multiple dry–wet and freeze–thaw cycles, small pores changed into medium and large pores, and the pore area increased by 35%.
(3)
Based on the mechanical properties and local damage law for loess, a damage factor is proposed under the the dry–wet and freeze–thaw cycle effect, and a damage model of loess is proposed based on the improved D-C model and the principle of equivalent effect variation, and its validity is confirmed.
For the loess slope in seasonal frozen soil areas and arid areas, the deterioration of the mechanical properties of the shallow loess under the action of dry–wet and freeze–thaw cycles is bound to have a non-negligible impact on shallow stability. Therefore, in the calculation of slope stability, the mechanical parameters of shallow loess must be determined to consider the effect of dry–wet and freeze–thaw cycles, and the constitutive relationship is also applicable to the description of mechanical behavior in such environments. The research work and results of this paper can provide a solid theoretical basis and reference for this, and provide a feasible method for accurate calculation of slope stability.

Author Contributions

Conceptualization, H.-M.Z. and P.W.; data curation, H.L.; writing—original draft preparation, Y.Y.; writing—review and editing, Y.Y., H.-M.Z. and P.W.; supervision, H.-M.Z. All authors have read and agreed to the published version of the manuscript.

Funding

This research was supported by Open Fund of Xi’an Key Laboratory of Geotechnical and Underground Engineering.

Data Availability Statement

The datasets generated during this study are fully available within the article.

Conflicts of Interest

The authors declare that they have no known competing financial interests or personal relationships that could have appeared to influence the work reported in this study.

References

  1. Wei, L.; Zeng, Z.; Yan, J. Factors Affecting the Stability of Loess Landslides: A Review. Appl. Sci. 2024, 14, 2735. [Google Scholar] [CrossRef]
  2. Dijkstra, T.A.; Wasowski, J.; Winter, M.G.; Meng, X.M. Introduction to geohazards of central China. Quart. J. Eng. Geol. Hydrogeol. 2014, 47, 195–199. [Google Scholar] [CrossRef]
  3. Ma, F.; Yang, J.; Bai, X. Water sensitivity and microstructure of compacted loess. Transp. Geotech. 2017, 11, 41–56. [Google Scholar] [CrossRef]
  4. Zhang, M.; Liu, J. Controlling factors of loess landslides in western China. Environ. Earth Sci. 2010, 59, 1671–1680. [Google Scholar] [CrossRef]
  5. Liu, K.; Ye, W.; Jing, H. Multiscale evaluation of the structural characteristics of intact loess subjected to wet/dry cycles. Nat. Hazards 2024, 120, 1215–1240. [Google Scholar] [CrossRef]
  6. Zhou, W.; Cheng, J.; Zhang, G.; Li, H.; Cheng, Y.; Ma, G.; Ji, X. Effects of wetting–drying cycles on the breakage characteristics of slate rock grains. Rock Mech. Rock Eng. 2021, 54, 6323–6337. [Google Scholar] [CrossRef]
  7. Han, X.; Hu, Z.; Li, H.; Yin, Y.; Zhang, B.; Zhang, L. Study on the mechanical properties and microstructural evolution of loess under different wet-dry and freeze-thaw coupled cycling paths. Case Stud. Constr. Mater. 2024, 21, e03924. [Google Scholar] [CrossRef]
  8. Li, J.; Chen, H.; Gao, X.; Ding, Q.; Shan, W.; Guo, H.; Zhuo, J. Cracks evolution and micro mechanism of compacted clay under wet-dry cycles and wet-dry-freeze-thaw cycles. Cold Reg. Sci. Technol. 2023, 214, 103944. [Google Scholar] [CrossRef]
  9. Xu, J.; Hu, K.; Zhou, L.; Li, Y.; Ye, W.; Wang, S. Influence of wet–dry cycles on uniaxial compression behavior of fissured loess. Environ. Earth Sci. 2023, 82, 5. [Google Scholar] [CrossRef]
  10. Fan, P.; Zhang, L.; Ding, X. Deterioration law of shear and compression characteristics of wetted loess under dry-wet-freeze-thaw cycle. Geotechnics 2024, 45, 2050–2060. [Google Scholar]
  11. Zhang, L.; Cui, Z. Changing law of compression and permeability characteristics of expansive soils under dry-wet-freeze-thaw cycle. Geotechnics 2023, 44, 728–740. [Google Scholar]
  12. Zhang, L.; Zhang, H.; Cui, Z. Study on the variation rule of mechanical properties of expansive soil and its physical mechanism under different cyclic mode conditions. J. Civil Eng. 2023, 56, 135–148. [Google Scholar]
  13. Mu, M. Research on the Effect of Coarse Particle Cracking and Microstructure of Soil Under Freeze-Thaw Dry-Wet Cycling Conditions. Ph.D. Thesis, Ningxia University, Yinchuan City, China, 2023. [Google Scholar]
  14. Gao, R.; Li, X.-A.; An, M.; Hao, Z.; Qin, B.; Wen, F. Experimental study on structural effects of particle migration in Malan loess under different dry and wet conditions. Environ. Earth Sci. 2024, 83, 353. [Google Scholar] [CrossRef]
  15. Zhang, W.; Li, X.; Lei, G.; Liu, Z.; Zhou, X. Microporosity study of sulfate saline soil under freeze-thaw-dry-wet cycle. J. Undergr. Space Eng. 2023, 19, 465–473. [Google Scholar]
  16. Lian, B.Q.; Wang, X.G.; Zhan, H.B.; Wang, J.D.; Peng, J.B. Creep mechanical and microstructural insights into the failure mechanism of loess landslides induced by dry-wetcycles in the Heifangtai platform, China. Eng. Geol. 2022, 300, 106589. [Google Scholar] [CrossRef]
  17. Li, G.; Wang, F.; Ma, W.; Fortier, R.; Mu, Y.; Mao, Y.; Hou, X. Variations in strength and deformation of compacted loess exposed to wetting-drying and freeze-thaw cycles. Cold Reg. Sci. Technol. 2018, 151, 159–167. [Google Scholar] [CrossRef]
  18. Zhang, Y.; Zhang, Z.; Hu, W.; Zhang, Y. Evolution and influencing mechanisms of the Yili loess mechanical properties under combined wetting-drying and freeze-thaw cycling. Materials 2023, 16, 4727. [Google Scholar] [CrossRef]
  19. Kachnov, L.M. Time of the rupture process under creep conditions. Izv. Akad. Nauk. 1958, 8, 26–31. [Google Scholar]
  20. Li, J.; Zhu, L.; Zhou, K.; Chen, H.; Gao, L.; Lin, Y.; Shen, Y. Non-linear creep damage model of sandstone under freeze-thaw cycle. J. Cent. South Univ. 2021, 28, 954–967. [Google Scholar] [CrossRef]
  21. Liu, Q.; Huang, S.; Kang, Y.; Liu, X. A prediction model for uniaxial compressive strength of deteriorated rocks due to freeze-thaw. Cold Reg. Sci. Technol. 2015, 120, 96–107. [Google Scholar] [CrossRef]
  22. Li, B.; Zhu, Z.; Ning, J.; Li, T.; Zhou, Z. Viscoelastic-plastic constitutive model with damage of frozen soil under impact loading and freeze-thaw loading. Int. J. Mech. Sci. 2022, 214, 537–548. [Google Scholar] [CrossRef]
  23. Ye, W.; Qiang, Y.; Jing, H.; Zou, Y. Experimental study on freeze-thaw cycles of paleosols in loess with different water contents based on nuclear magnetic resonance. J. Eng. Geol. 2022, 30, 144–153. [Google Scholar]
  24. Kang, S.; Jia, X.; Zhao, Y.; Han, L.; Ma, C.; Bai, Y. Spatiotemporal Variation and Driving Factors of Ecological Environment Quality on the Loess Plateau in China from 2000 to 2020. Remote Sens. 2024, 16, 4778. [Google Scholar] [CrossRef]
  25. Kondner, R.L. Hyperbolic Stress-Strain Response: Cohesive Soils. J. Soil. Mech. Found. Div. 1963, 89, 115–143. [Google Scholar] [CrossRef]
  26. Duncanj, M.; Chang, C.Y. Nonlinear analysis of stress and strain in soils. J. Soil Mech. Found. Div. ASCE 1970, 96, 1629–1653. [Google Scholar] [CrossRef]
Figure 1. Spatial location of the Loess Plateau. (Kang et al., 2024 [24]).
Water 17 01328 g001
Figure 3. (a) Axial strain-deviatoric stress curve; (b) axial strain-volumetric strain curve at different cycles at of confining pressure 50 kPa.
Water 17 01328 g003
Figure 4. (a) Axial strain-deviatoric stress curve; (b) axial strain-volumetric strain curve at different cycles at of confining pressure 100 kPa.
Water 17 01328 g004
Figure 5. (a) Axial strain-deviatoric stress curve; (b) axial strain-volumetric strain curve at different cycles at of confining pressure 200 kPa.
Water 17 01328 g005
Figure 6. (a) Axial strain-deviatoric stress curve; (b) axial strain-volumetric strain curve at different cycles at of confining pressure 400 kPa.
Water 17 01328 g006
Figure 7. Analysis of mesoscale pore results. (a) T2 spectral curve; (b) pore area distribution.
Water 17 01328 g007
Figure 8. Comparison of test curves and theoretical curves: (a) 50 kPa; (b) 100 kPa; (c) 200 kPa; and (d) 400 kPa.
Water 17 01328 g008
Table 1. Basic physical indexes of soil samples.
IndexesDry Density (g/cm3)Water Content (%)Liquid Limit (%)Plastic Limit (%)
Value1.6212.5628.818.6
Table 2. Model parameters.
Pressure/kPaCycle Number a b c m F 0
40008.6608 × 10−49.7713 × 10−42.3776 × 10−6−0.86580.0201
21.06 × 10−31.2557 × 10−33.2851 × 10⁻⁶
47.1574 × 10−41.4064 × 10−32.23997 × 10⁻⁶
78.8213 × 10−41.4663 × 10−32.72806 × 10⁻⁶
106.8938 × 10−41.5338 × 10−32.12208 × 10⁻⁶
Disclaimer/Publisher’s Note: The statements, opinions and data contained in all publications are solely those of the individual author(s) and contributor(s) and not of MDPI and/or the editor(s). MDPI and/or the editor(s) disclaim responsibility for any injury to people or property resulting from any ideas, methods, instructions or products referred to in the content.

