Article

Sentinel-2 Images Discover How Extraordinary Water Inputs Allow the Ephemeral Resurgence of Najas marina in a Shallow Hypertrophic Lagoon (Albufera of Valencia, Spain)

by
Juan M. Soria
1,*,
Noelia Campillo-Tamarit
1,
Juan Víctor Molner
1 and
Xavier Soria-Perpinyà
2
1
Cavanilles Institute of Biodiversity and Evolutionary Biology (ICBiBE), University of Valencia, Catedràtic José Beltrán Martínez, 2, 46980 Paterna, Spain
2
Image Processing Laboratory (IPL), University of Valencia, Catedràtic Agustín Escardino Benlloch, 9, 46980 Paterna, Spain
*
Author to whom correspondence should be addressed.
Water 2025, 17(9), 1302; https://doi.org/10.3390/w17091302
Submission received: 28 February 2025 / Revised: 29 March 2025 / Accepted: 25 April 2025 / Published: 27 April 2025
(This article belongs to the Special Issue Application of Satellite Remote Sensing in Water Quality Monitoring)

Abstract

:
Anthropogenic activities represent a significant challenge to macrophyte conservation worldwide. Eutrophication, resulting from excessive nutrient inputs to aquatic ecosystems, is one of the main man-induced disturbances affecting the health of wetlands. Albufera of Valencia has experienced a hypertrophic and turbid state since the 1970s, with the consequent disappearance of macrophyte meadows and the predominance of phytoplankton. However, unique episodes of water clarity occurred in 2018 and 2022, leading to the reappearance of Myriophyllum spicatum and Najas marina, respectively. In the present study, the Normalized Difference Vegetation Index (NDVI) is used to monitor the emergence, growth, and disappearance of N. marina in 2022, as was previously done for M. spicatum. In November 2022, we obtained the maximum cover with 48.42 ha and began declining until March 2023. This methodology supports the potential of remote sensing in assessing the cover, density, and health of aquatic vegetation, while allowing us to examine the influence of water quality and quantity on this prominent phenomenon. After removing the outlier data, all variables except for suspended solids presented normal distribution. The results suggest that, by improving the water quality in the Albufera and maintaining an adequate ecological flow, managed by the competent authorities, the recovery of the macrophyte meadows that characterised this ecosystem more than five decades ago could be feasible.

1. Introduction

Submerged aquatic macrophytes, otherwise referred to as hydrophytes, have been shown to play a prominent role in wetland functioning, especially in terms of nutrient cycling [1]. Macrophytes can be categorised as either floating or rooted, with the latter being further classified as emergent, floating-leaved and/or submerged (SAV). Floating macrophytes have the capacity to directly filter nutrients from the water column, while rooted macrophytes take nutrients from the surrounding sediment [2]. These plants have a significant impact on the biogeochemical processes occurring in the water column and sediments. Macrophyte species exhibit significant variation in terms of biomass production, nutrient recycling, and impact on the rhizosphere, specifically carbon and oxygen exchange, as well as their capacity to emit methane [1].
The significance of aquatic vegetation in water bodies is highlighted by the role of macrophytes as key components of food webs. These organisms serve as a primary source of nutrients for detritivores and herbivores [3] while also providing an essential source of carbon for indigenous microbial communities [1]. Furthermore, the leaves, roots, and stems of these plants act as a substrate for periphyton and provide a habitat for a variety of amphibians, invertebrates and fish [4,5,6]. However, due to its unique morphology, N. marina is regarded as an undesirable aquatic plant, because it does not provide shelter for fish and is not consumed in the food chain like other aquatic plants.
Light plays a fundamental role in the growth of aquatic plants, as photosynthesis is a crucial process for their development. Light availability is considered a limiting factor for macrophyte primary production and growth [7,8]. The intensity and duration of light exposure are critical, as they directly affect macrophytes and are influenced by water depth, turbidity, and shade [7,8]. Turbidity, for instance, is increased by algal blooms in nutrient-rich water systems and by the presence of clay and sediment (especially from runoff or the effect of persistent winds), which can decrease water transparency and light availability, thereby inhibiting the growth of submerged macrophytes [7].
The light regime is identified as the primary driver of the macrophyte niche within the riparian zones of lakes and reservoirs [7], where angiosperms typically dominate in shallower zones, while bryophytes and charophytes predominate in deeper parts [8]. This characteristic zonation is attributable to a combination of light availability and the adaptation of macrophytes to divergent light conditions. Aquatic ecosystems with reduced light penetration and intensity are characterised by the dominance of free-floating macrophytes and other rooted species adapted to grow with their leaves on the water surface where light is abundant. Conversely, submerged macrophytes are abundant in ecosystems where there is abundant light availability in the water column [9].
Fluctuations in water level significantly affect light availability. During flooding periods, the rapid rise in water level can result in a significant decrease in light availability, which, in turn, has a negative effect on the spatial extent and biomass of submerged macrophytes due to the limited penetration of light in deeper water [10].
The distribution and abundance of aquatic macrophytes is also influenced by substrate composition. Submerged rooted macrophytes are influenced by substrate characteristics, such as organic content and redox potential, which, in turn, affect their nutrient uptake rates and anchoring capacity [11,12,13]. Substrates with a high silt content tend to favour the presence of higher macrophyte diversity [14].
Human activities challenge the conservation status of macrophytes globally. Eutrophication, resulting from excessive nutrient inputs to aquatic ecosystems, is one of the main human-induced disturbances affecting wetland health [15]. Intensive agriculture and wastewater discharge are significant sources of nutrients entering aquatic ecosystems, exacerbating the phenomenon of eutrophication and altering the natural balances of wetlands [16]. Increased nutrients drive the competition for light between different macrophyte taxa and between macrophytes and phytobenthos and phytoplankton [17]. Initially, macrophytes are displaced from deeper waters where light penetration is limited, and as eutrophication progresses, submerged macrophytes may eventually disappear from algal-dominated aquatic ecosystems [18]. Once established, the state of algal dominance in the aquatic ecosystem tends to be stable, making it difficult to switch between an algal-dominated and a macrophyte-dominated state [19].
The Albufera de Valencia, a Mediterranean coastal lagoon, has been found to be in a turbid state since the 1970s [20]. This state is characterised by the dominance of phytoplankton and the absence of submerged macrophytes as species of Myriophyllum, Chara, Ceratophyllum, and Potamogeton previously reported. Najas marina L. (1753) (hereafter, N. marina) is a monocotyledonous, annual, and dioecious species [21] also present in some areas. It is propagated by seed [22] and has a cosmopolitan distribution [21]. In the Mediterranean region, it is commonly found in coastal lagoons, such as the Albufera. However, the proliferation of nutrients and water degradation, primarily attributable to industrial, agricultural, and urban discharges, has led to its decline. Since the 1990s, efforts have been made to enhance the water quality of the lagoon, with the objective of facilitating the recovery of aquatic vegetation.
The aquatic vegetation exhibited a resurgence in the Albufera in 2016 and was sporadically observed in 2017 and 2019 on the western side of the lagoon. In 2018, a substantial development in the extent of aquatic macrophytes was observed, particularly in the northern area [23]. In 2022, during the regular annual remote sensing monitoring of rice crops flooding throughout the water index normalised (mNDWI) and lagoon trophic state using chlorophyll-a (Chl-a), total suspended solids (TSS), and Secchi Disk Depth (ZSD) conducted by our research team (see Section 2.4 for more details), a significant increase of this species was observed in the western area of the lake, where water from the Jucar enters through the irrigation channels, with some media impact. Initially, this occurrence was deemed an anomaly in the final September Sentinel-2 observed image. However, subsequent analysis revealed that this ‘anomaly’ exhibited a response to the vegetation spectrum in the subsequent October image. The observed occurrence was considerably more substantial than the documented one five years prior, albeit in scattered and isolated specimens. The 2022 resurgence was attributed to a combination of factors, including a reduction in discharges and an increase in the supply of water from the Jucar, facilitated by an agreement with the Jucar Basin Authority [24].
A useful strategy for monitoring these macrophytes is through satellite imagery, for which the Normalized Difference Vegetation Index (NDVI) [25] is a widely used tool in remote sensing to assess vegetation health and density. This index is suitable for aquatic vegetation because emergent and partially emergent aquatic plants have similar optical properties to terrestrial plants, allowing the NDVI to be sensitive to aquatic vegetation down to a depth of approximately 50 cm. However, beyond this depth, water absorption in the Near Infrared band hinders detection [26].
It is imperative to emphasise that the NDVI was previously selected in the study by Soria et al. [23] to monitor the exceptional occurrence of Myriophyllum spicatum L. (1753) (hereafter, M. spicatum) in the Albufera lagoon between spring and summer of 2018. The study employed a spectral view to illustrate the distinct radiometric differences between clear water, turbid water, and aquatic vegetation, providing a robust rationale for the effectiveness of the NDVI in this specific context. The study concluded that the singular increase in water transparency, since summer 2017 was a key factor in the reappearance of M. spicatum, while high summer temperatures subsequently caused its disappearance. The authors further suggested that enhancing water quality could play a critical role in restoring submerged macrophyte meadows within the aquatic ecosystem. Although the study affirmed the suitability of the NDVI, it also acknowledged the potential for other indices to offer better performance in different scenarios or ecosystems, thus inviting further exploration into alternative approaches for monitoring aquatic vegetation.
Following this line of work, the main objective of the present study is to carry out detailed monitoring of the massive appearance of N. marina in the west of the Albufera during the years 2022–2023. The hypotheses that may explain both its appearance and its disappearance in the area after a vegetative cycle will be evaluated. In addition, an exhaustive observation of the water upwellings (‘ullals’ in Valencian language) existing between the masses of N. marina will be carried out to better understand the relationship between this species and its aquatic environment.

2. Materials and Methods

2.1. Study Site

The Albufera of Valencia (Figure 1) is a shallow, hypertrophic, oligohaline Mediterranean coastal lagoon that covers an area of 2320 hectares. It is surrounded by 16,000 hectares of marshland that are used for rice cultivation. The lagoon is located 10 km south of the city of Valencia (Spain). The volumes of water reaching the lagoon are controlled by the Jucar Basin Authority, while the water level inside the lagoon is controlled by the Drainage Council, which is comprised of farmers and is responsible for adjusting the water level according to the needs of the rice fields [27,28].
The Albufera of Valencia has undergone significant changes in its recent history, especially in relation to its water use and management. Over the years, a transformation in the uses of the Albufera has been observed, from being known as the ‘Albufera of fishermen’ to the ‘Albufera of farmers’. This evolution has resulted in a predominant focus on agricultural uses, which has led to a decline in the influence of fishing on ecosystem management [28].
This transition commenced in the 18th century, when the natural connection with the sea was completely severed in the Albufera of Valencia, signifying a pivotal ecological shift in the ecosystem due to the modification of intercommunication channels and the regulation of water levels for rice cultivation. In the mid-20th century, urban and industrial development began in the towns located to the west of the Albufera, which has had a considerable impact on the trophic state of the lagoon. The trophic state of the lagoon underwent an alteration between 1972 and 1974, resulting in the manifestation of a hypertrophic turbid lagoon, as is evident in the present day [29].
In 1986, the Albufera lagoon and its environs were designated a Natural Park, a decision that was made in recognition of its environmental, scenic, and cultural significance. The objective of this designation was to halt the degradation suffered in the 1970s and to recover the original values of the ecosystem [27,29]. Consequently, a series of measures were implemented. These include the collection of in-depth knowledge on the ecosystem’s status, the construction of wastewater conveyance infrastructures, water treatment in the basin’s towns, and the implementation of environmental restoration measures, such as the construction of green filters [30].

2.2. In Situ Observations

The primary study area is situated in the western part of the Albufera lagoon, which is accessible by boat. The presence of a substantial growth of emergent vegetation, which has been atypical in this region of the lagoon over the past fifty years, prompted a boat exploration of the site in mid-October. Once confirmed the presence of the vegetation, we conducted a follow-up remote sensing observation and analysis work.

2.3. Remote Sensing Images

The investigation was conducted systematically, and a total of 20 Sentinel-2A and 2B images (Level 2A) was obtained between Juny 2022 and March 2023, from which the nine images with a cloud cover of less than 15% were selected. The vegetation was observed to completely disappear in the image from 1 March 2023. These images were obtained free of charge through the Copernicus Browser platform of the European Space Agency (ESA).
The Sentinel-2 mission is an Earth observation satellite mission developed by the European Space Agency (ESA), consisting of twin satellites (S2A and S2B) equipped with the Multispectral Sensor Instrument (MSI). This sensor measures the reflectance of the Earth’s surface in 13 spectral bands, ranging from the visible to the shortwave infrared, with spatial resolutions of 60, 20, and 10 metres, respectively. With a revisit time of 5 days, the mission allows for detailed monitoring of changes in the Earth’s surface over time. The data collected by Sentinel-2 find application in a wide variety of fields, including agriculture, natural resource management, environmental change detection, and urban planning [31].

2.4. Extraction of Hydrochemical Variables

Following the selection and download of the Sentinel-2 images, the image processing was initiated using the freely available SNAP 9.0 software (Brockmann Consult, Hamburg, Germany) provided by the ESA. The variables chlorophyll-a, total suspended solids (TSS), and transparency measured by the mean Secchi Disk Depth (ZSD) were calculated using the corresponding equations previously published in other works for estimation using Sentinel-2 imagery.
The equation for chlorophyll-a is as follows [32]:
C h l a ( m g · m 3 ) = 104.1 · T B D O 2 + 221.14 · T B D O + 2
where TBDO is
T B D O = R 740 · ( R 665 1 R 705 1 )
The equation for total suspended solids is as follows [33]:
T S S m g · L 1 = 705.98 · R 783 · R 705 · R 490 1
The equation for transparency (ZSD) is as follows [34]:
Z S D m = 0.4242 · R 560 R 705 0.0577
where R490 (blue), R560 (green), R665 (red), R705 (red edge 1), R740 (red edge 2), and R783 (red edge 3) are the Sentinel-2 spectral bands, which can be combined throughout spectral indices to estimate biophysical parameters with optical properties after validation with in situ data [32,33,34].
For each image, a region of interest (ROI) was defined by first applying the chlorophyll-a equation to the water mask of the entire lake. Then, focusing on the western area where the plants emerged, the ROI was selected by manually drawing polygons over clear water zones, guided by chlorophyll-a values. These selected areas corresponded to regions influenced by the inflow from irrigation canals and natural groundwater upwellings (‘ullals’), which provided aa conditions for macrophyte growth. It should be noted that the selected regions varied slightly between images, as the extent of clear water areas fluctuated over time. Once the ROI had been defined for each image, the mean values of chlorophyll-a (Chl-a), total suspended solids (TSS), and water transparency (measured as Secchi Disk Depth, ZSD) were extracted from the selected areas using previously validated equations for Sentinel-2 imagery.

2.5. Plant Area Extraction

For each image, the Normalised Difference Vegetation Index (NDVI) proposed by Tucker [23] was applied within the ROI:
N D V I = N I R R e d N I R + R e d
The threshold of NDVI > 0.25 was utilised as an indicator of the presence of aquatic vegetation, and the number of N. marina pixels in each image within the designated study area was obtained in accordance with this criterion. Employing the sum of pixels with NDVI > 0.25 and considering the pixel size of 100 m2 in the Sentinel-2 images, the area of N. marina in hectares (ha) was determined for each date.

2.6. Data Analysis

Initially, the normality of the N. marina area and hydrochemical variables was assessed utilising the Shapiro–Wilk test, as it is regarded as the most suitable method for the sample size from which the study commenced (n = 10). This step was a prerequisite for the subsequent application of the Pearson’s correlation test. Subsequent to this assessment, outliers were identified, and non-normal variables were standardised through the implementation of the base 10 logarithm transformation. Following this procedure, the normality of the data was re-evaluated using the Shapiro–Wilk test. Subsequently, the Pearson’s correlation test was employed to identify potential relationships between the surface area of N. marina and the various variables associated with the quality of the water in which they were cultivated.

2.7. Thematic Maps

Thematic maps were created to illustrate the area of N. marina during specific cases of the studied period by applying the NDVI. Furthermore, maps of Chl-a and SST concentration, as well as ZSD, were generated by applying the corresponding equations presented previously [32,33,34] in the water zone surrounding the plants. For the water quality maps, the aforementioned equations were applied to water only, using the water mask provided by Sentinel-2 L2A images. This mask was overlaid on the false colour image using SNAP 9.0 software.

3. Results

3.1. Field Observations and Remote Sensing Results

The in situ exploration conducted in October yielded the visual evidence depicted in Figure 2, thereby confirming the presence of the plants. Moreover, the posterior remote sensing image observations revealed a clear presence of the plants in images captured from August.
Once the 20 selected Sentinel-2 images were analysed, the NDVI products were extracted and the corresponding equations were applied to estimate water quality variables, the results of the vegetation cover and hydrochemical variables presented in Table 1 were obtained. It can be observed that the four variables increase, reaching a maximum in November 2022 (except in ZSD, which is two months before) and then declining.
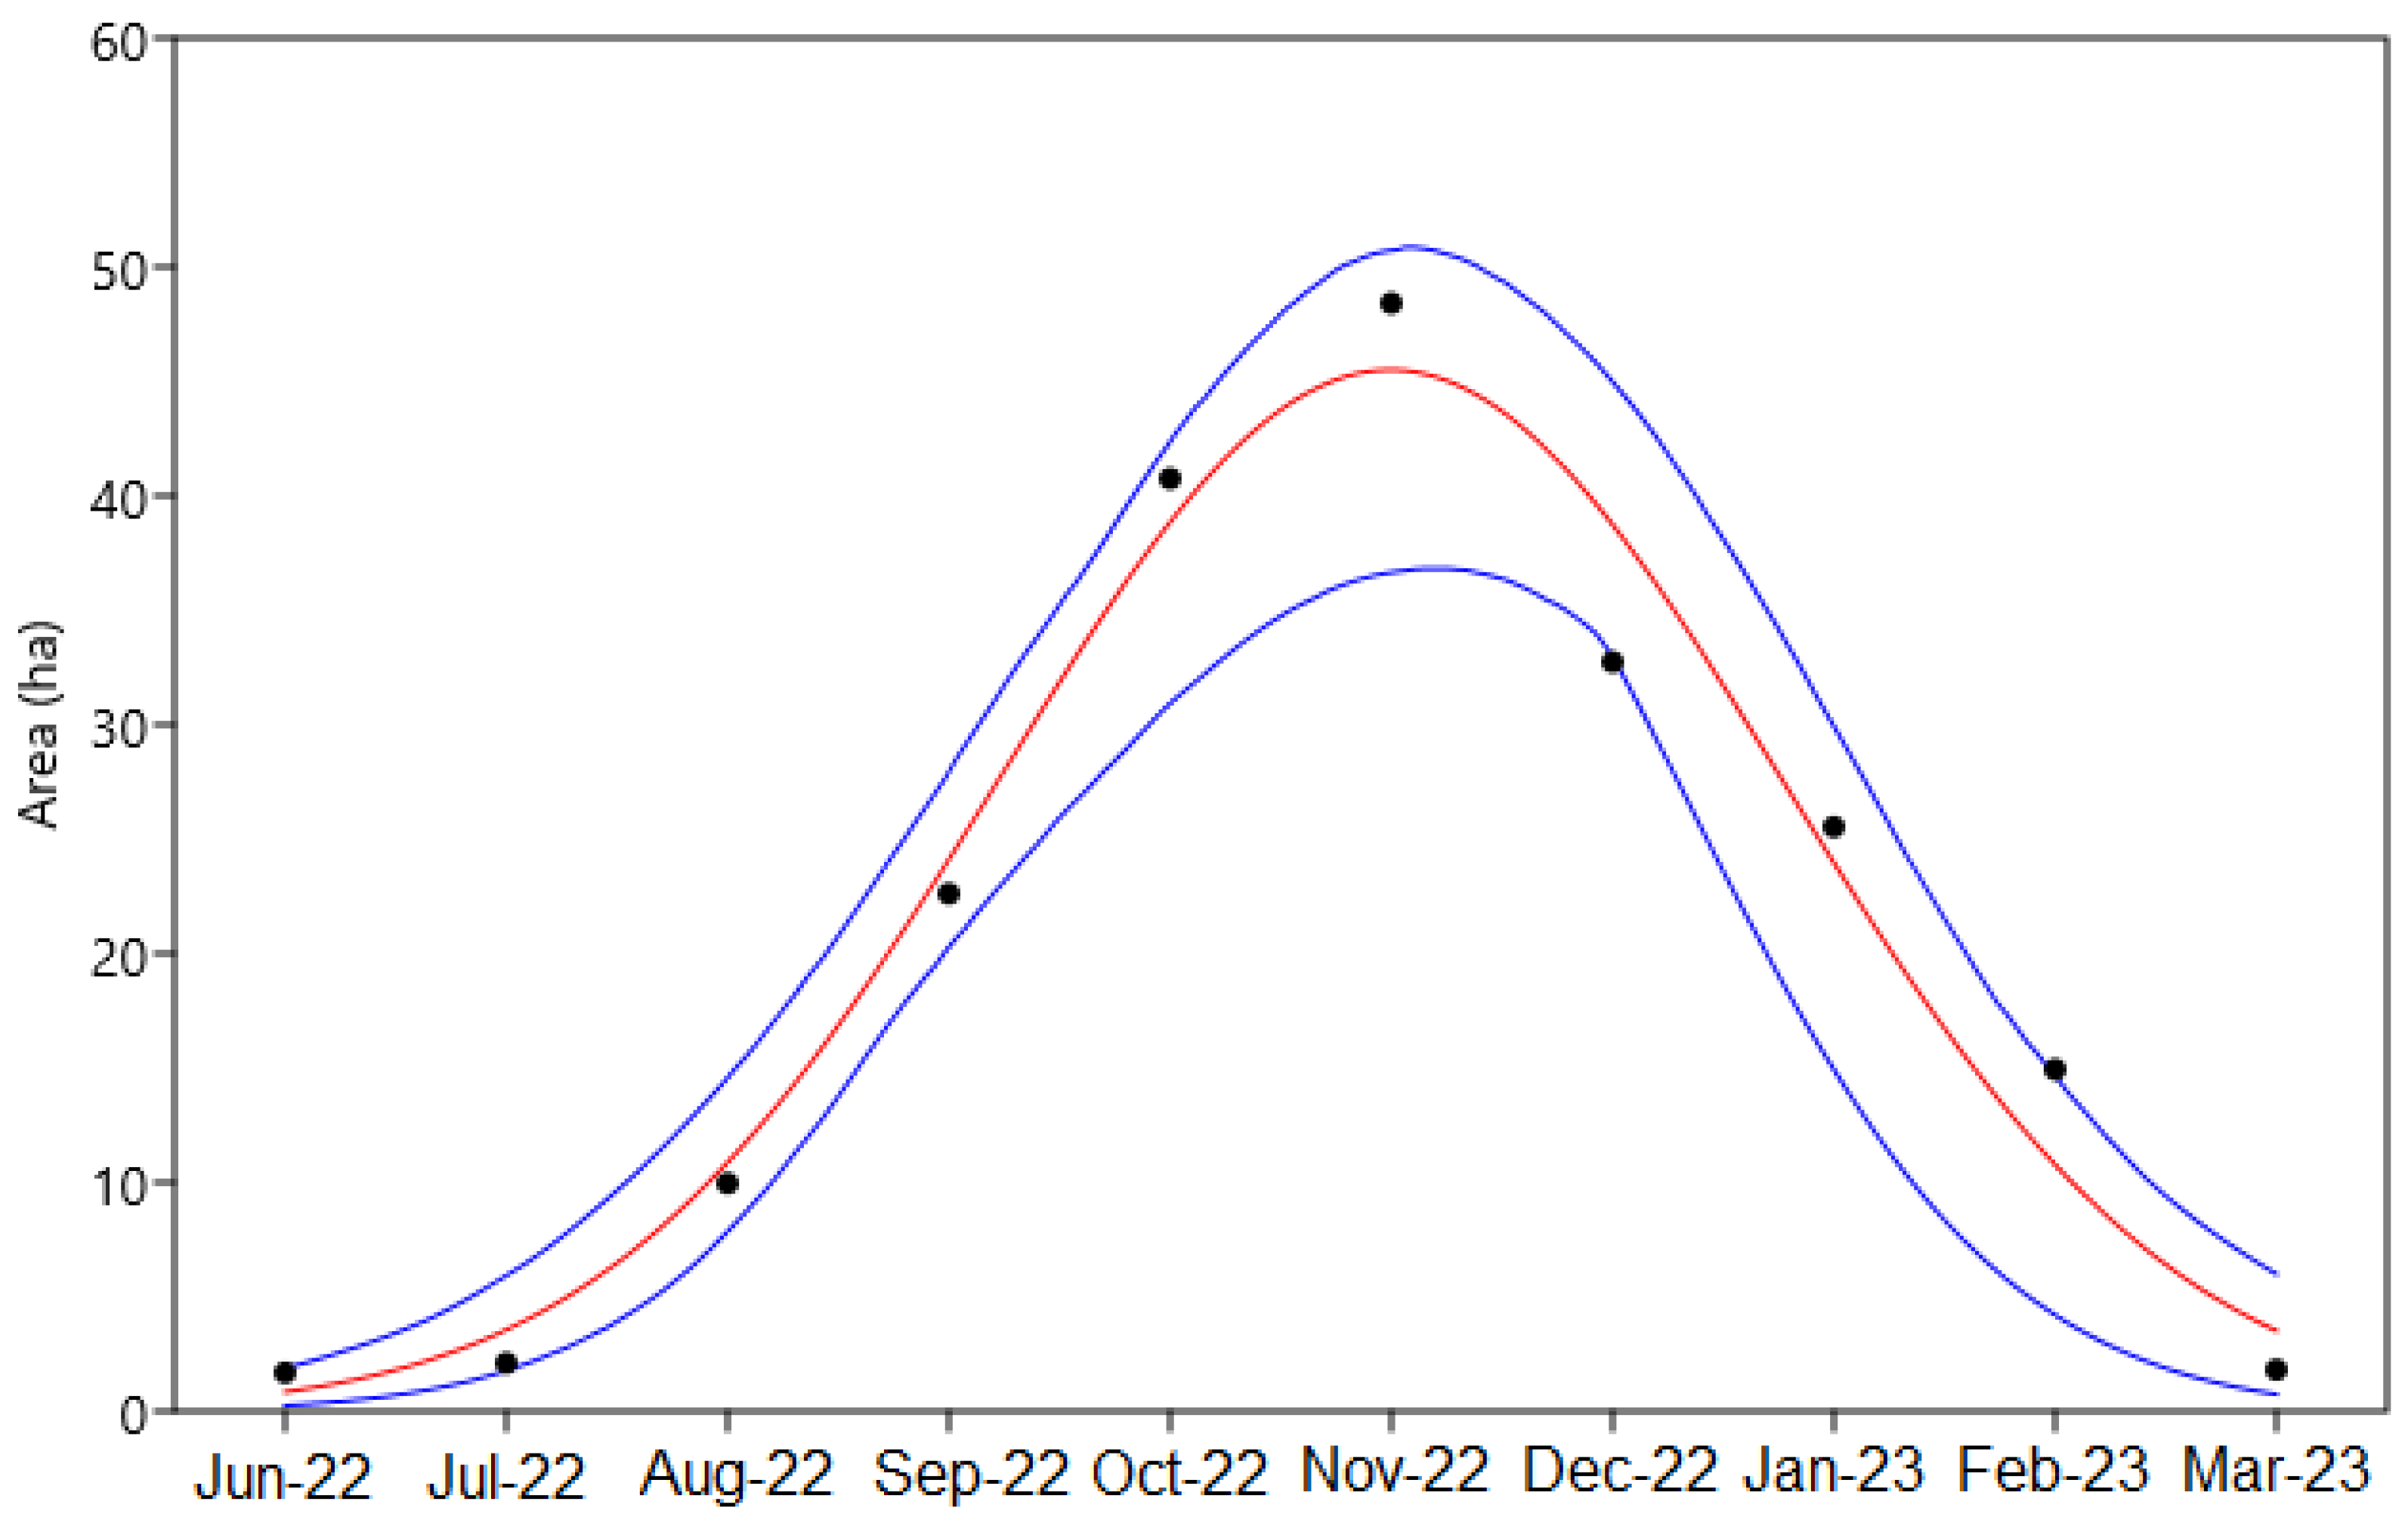
The temporal analysis of the remote sensing images allowed for the characterisation of the colonisation and senescence process of N. marina in the lagoon during the study period (Figure 3). On 29 June 2022, the image revealed an absence of vegetation in the analysed area. However, by 9 July, the initial indications of N. marina emergence were observed, initially concentrated in the western region of the lagoon.
By July 19, the vegetation cover had increased considerably, indicating an active expansion process. By 18 August, the vegetation had already formed a dense mass that progressively extended northward, suggesting favourable conditions for its development.
On 27 September, N. marina reached an important spatial development, covering a large part of the study area. In November 2022, we obtained the maximum cover with 48.42 ha and began declining.
At this time, clearings in the vegetation were identified, coinciding with water upwelling points in the lagoon, indicating a possible relationship between these water flows and the distribution of the plant.

3.2. Multivariate Statistics

Initially, following the implementation of the Shapiro–Wilk test (Table 2), it was ascertained that the sole normal variable is the ZSD. The statistical analysis indicated that suspended solids and chlorophyll-a did not meet the criteria for statistical normality. Given the seasonal patterns of the lake, as determined by the available database, it was hypothesised that the elevated values of these variables on 6 November 2022 were the primary cause.
Given these findings, it was deemed appropriate to exclude of the statistical analysis the data from 6 November 2022, as this date marks an annual occurrence of a substantial and brief phytoplankton bloom in the lagoon, spanning a few weeks and culminating in the production of elevated concentrations of chlorophyll-a and suspended solids throughout the lake, accompanied by a significant decline in transparency.
After the elimination of anomalous data points for November, the Shapiro–Wilk test yielded the results presented in Table 3.
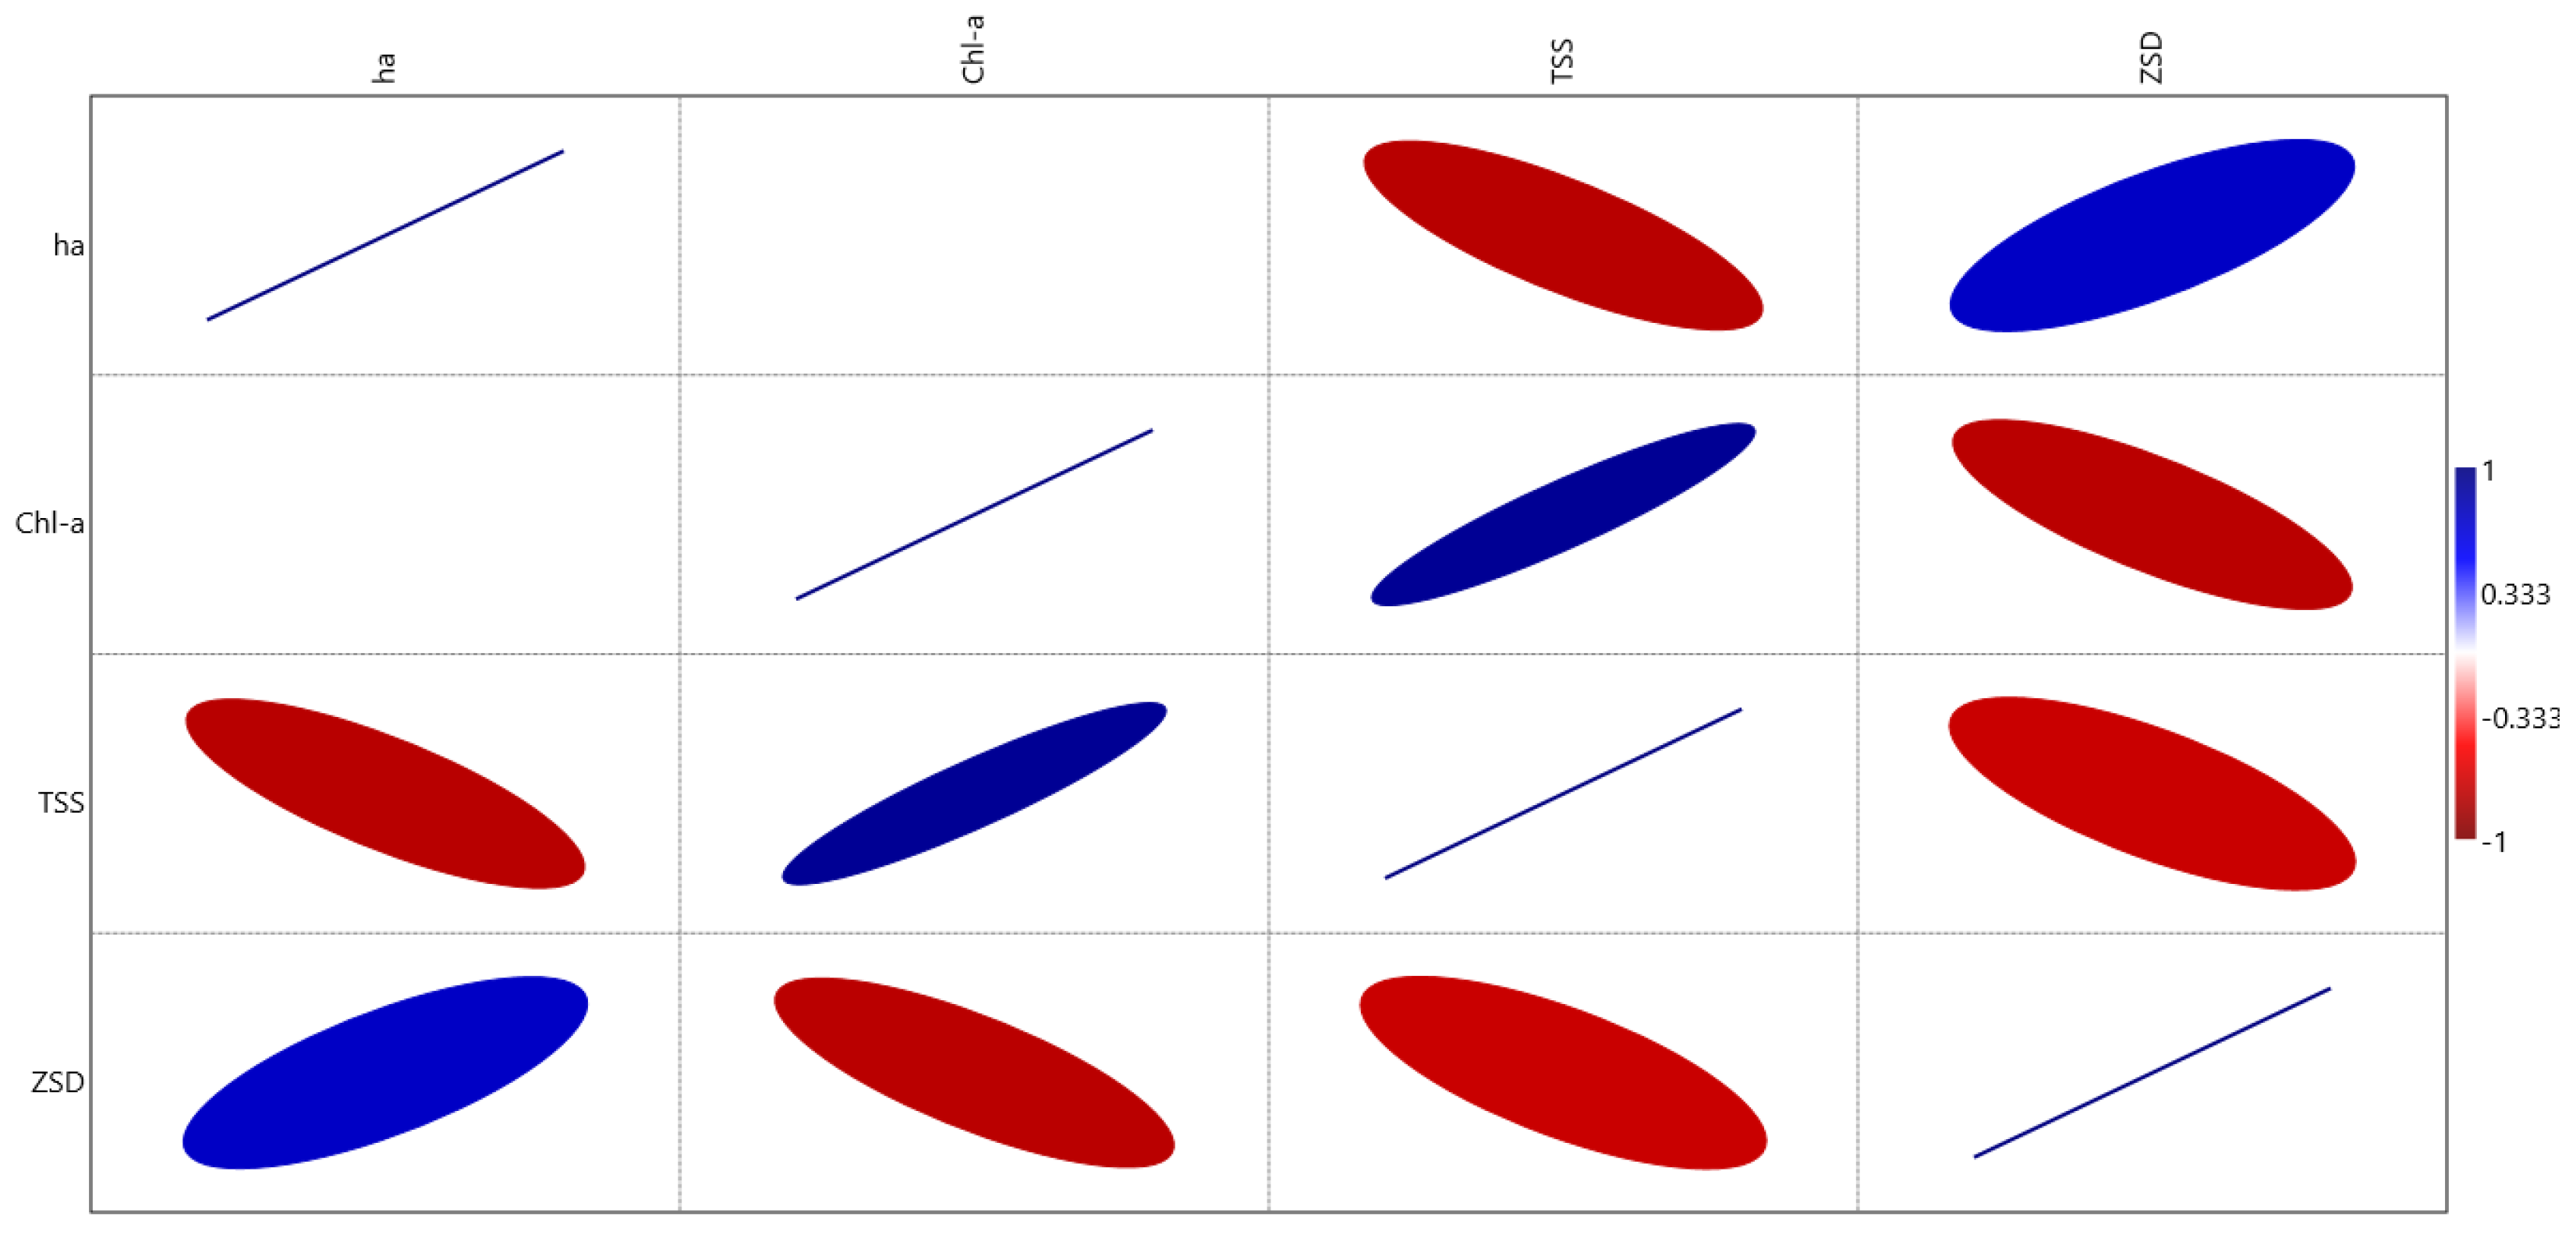
It was observed that, after the elimination of the anomalous value, all variables except suspended solids had become statistically normal, according to the Shapiro–Wilk test. To address this, the suspended solids variable was normalised through the logarithm transformation, and the Shapiro–Wilk test was repeated, yielding the results shown in Table 4. The Pearson’s correlation coefficients were then calculated and are presented in Table 5, showing the strongest positive correlation between area and TSS.
Figure 4 presents the same results in a visual form by means of an ellipse graph produced by the PAST software 4.04.
The results of this analysis show a significant negative correlation between the area covered by N. marina (ha) and the concentration of total suspended solids (TSS), while a positive correlation is observed with water transparency, measured by Secchi depth. This suggests that the expansion and density of N. marina in the Albufera de Valencia are favoured by improved water clarity and lower suspended solids concentrations, which allow greater light penetration to the submerged macrophytes. The absence of a significant correlation with chlorophyll-a concentration suggests that phytoplankton biomass does not play a primary role in limiting N. marina growth, at least within the range of conditions observed.

3.3. Thematic Maps

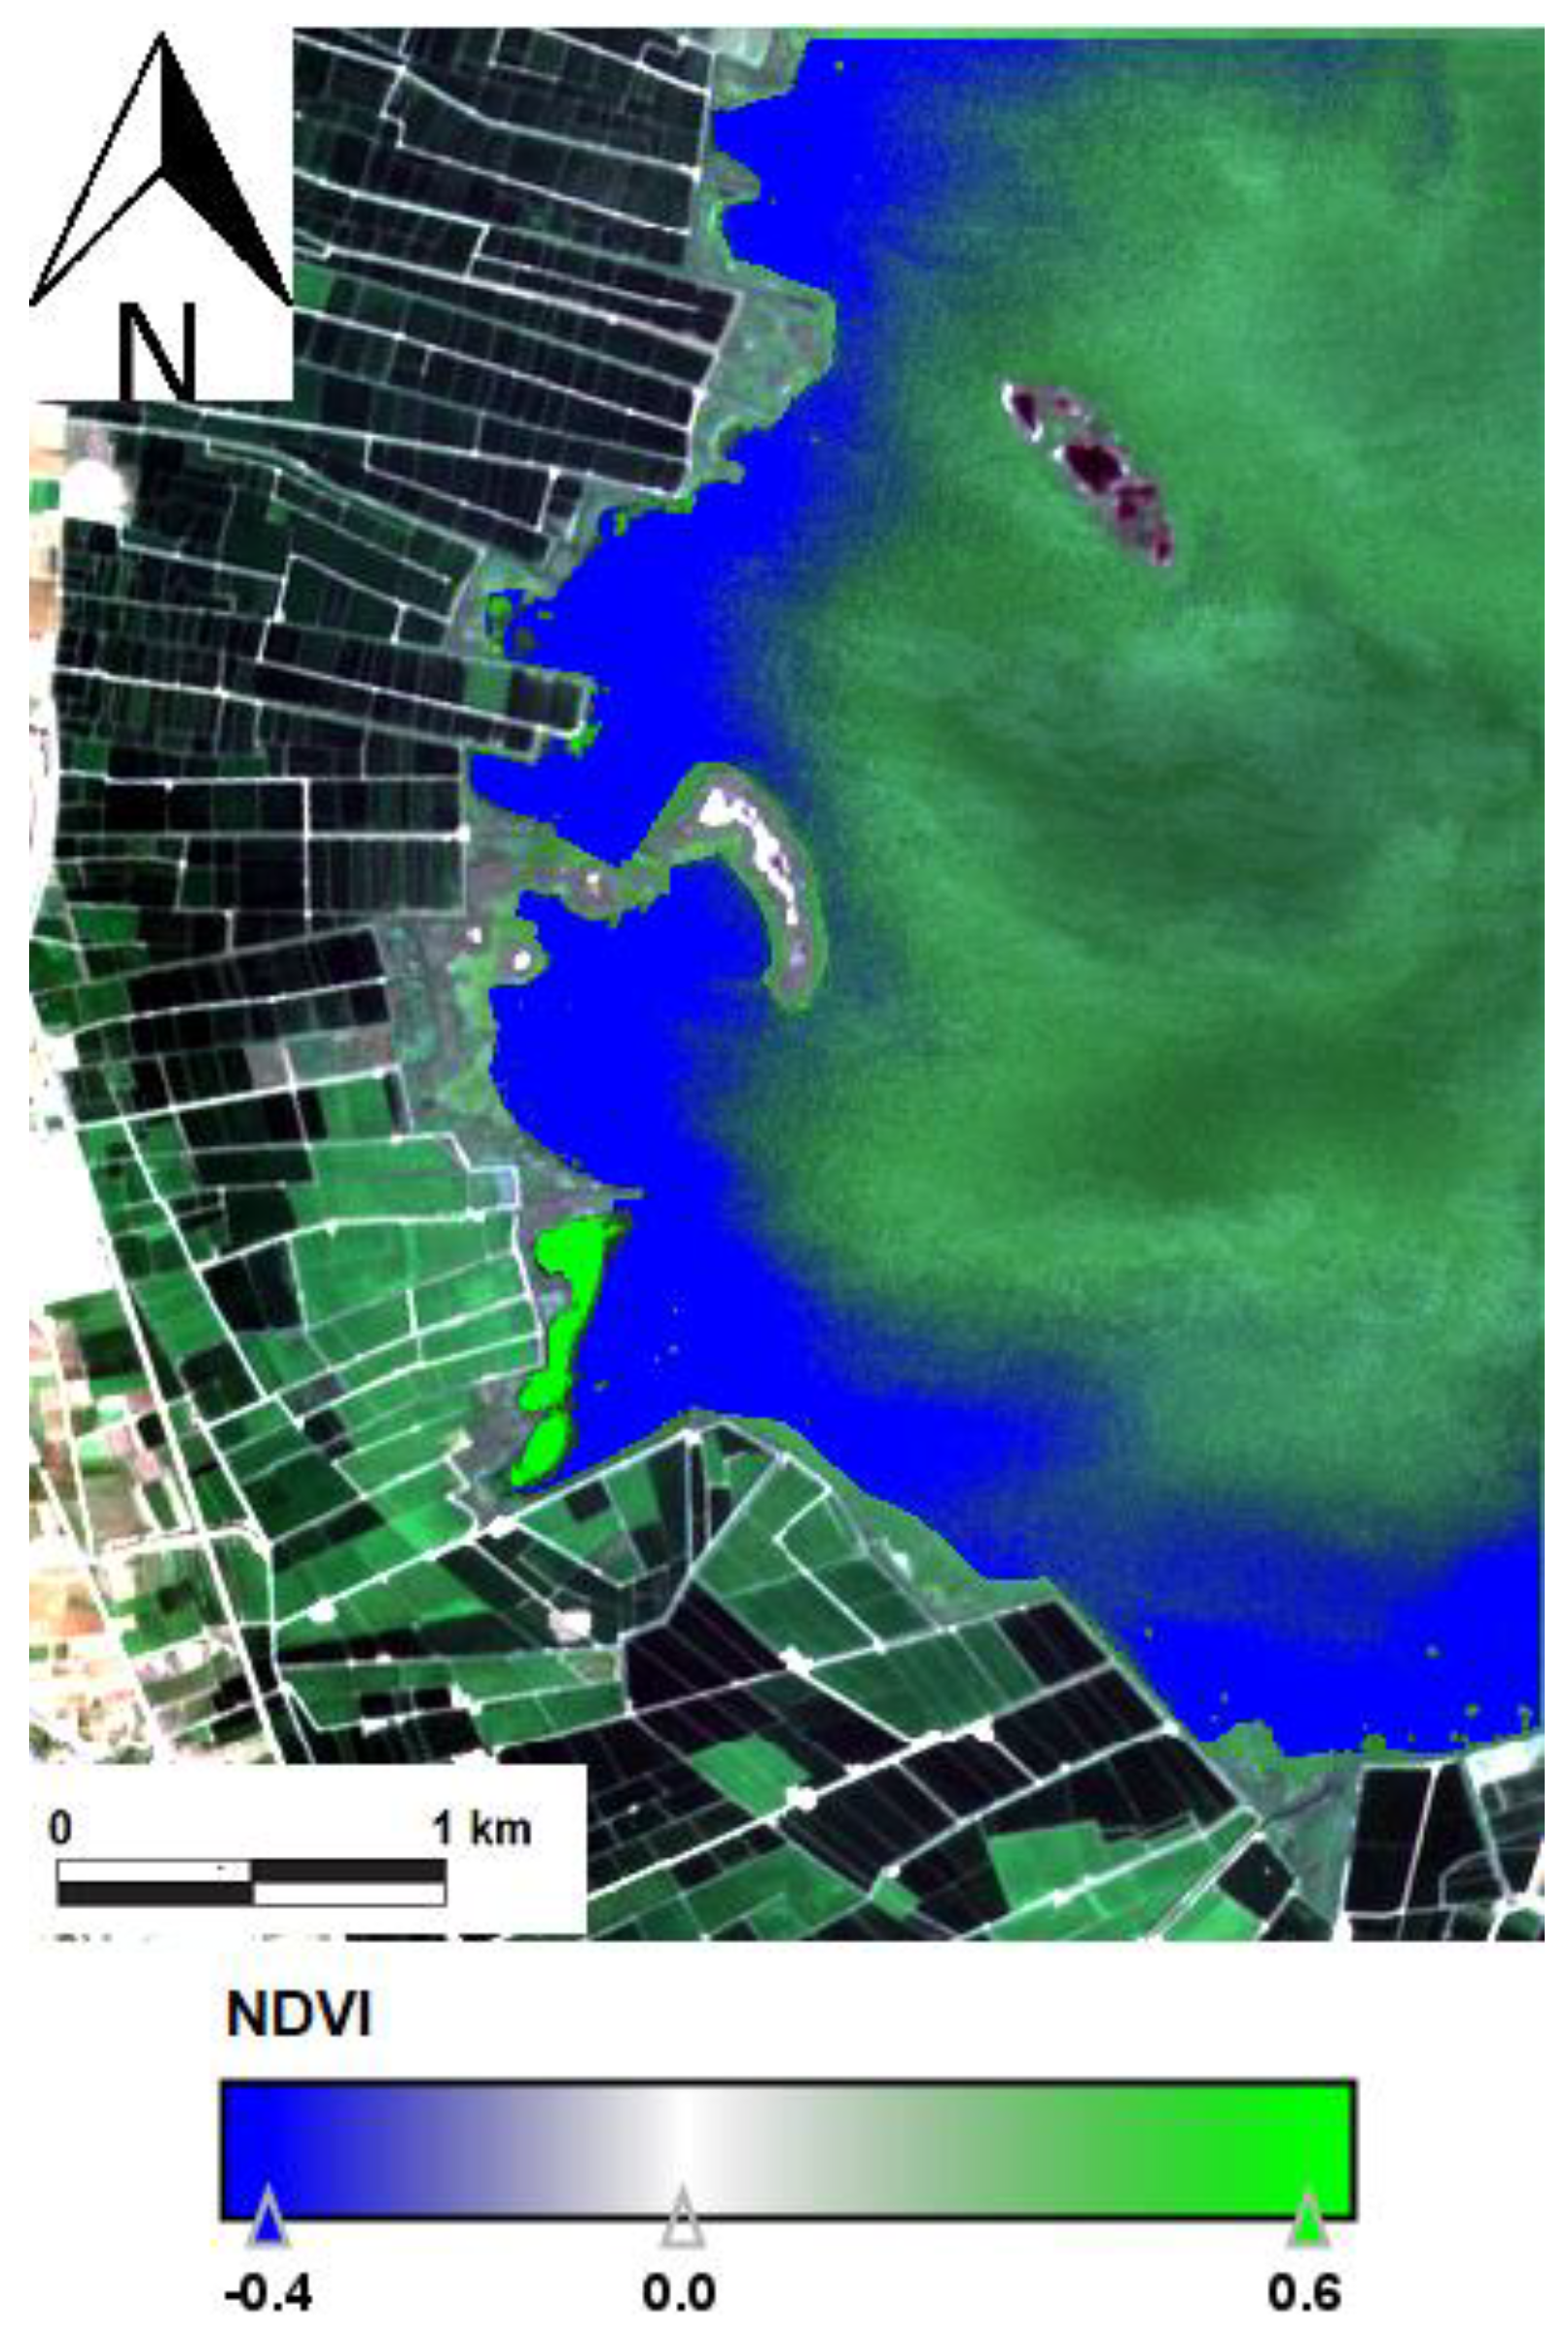
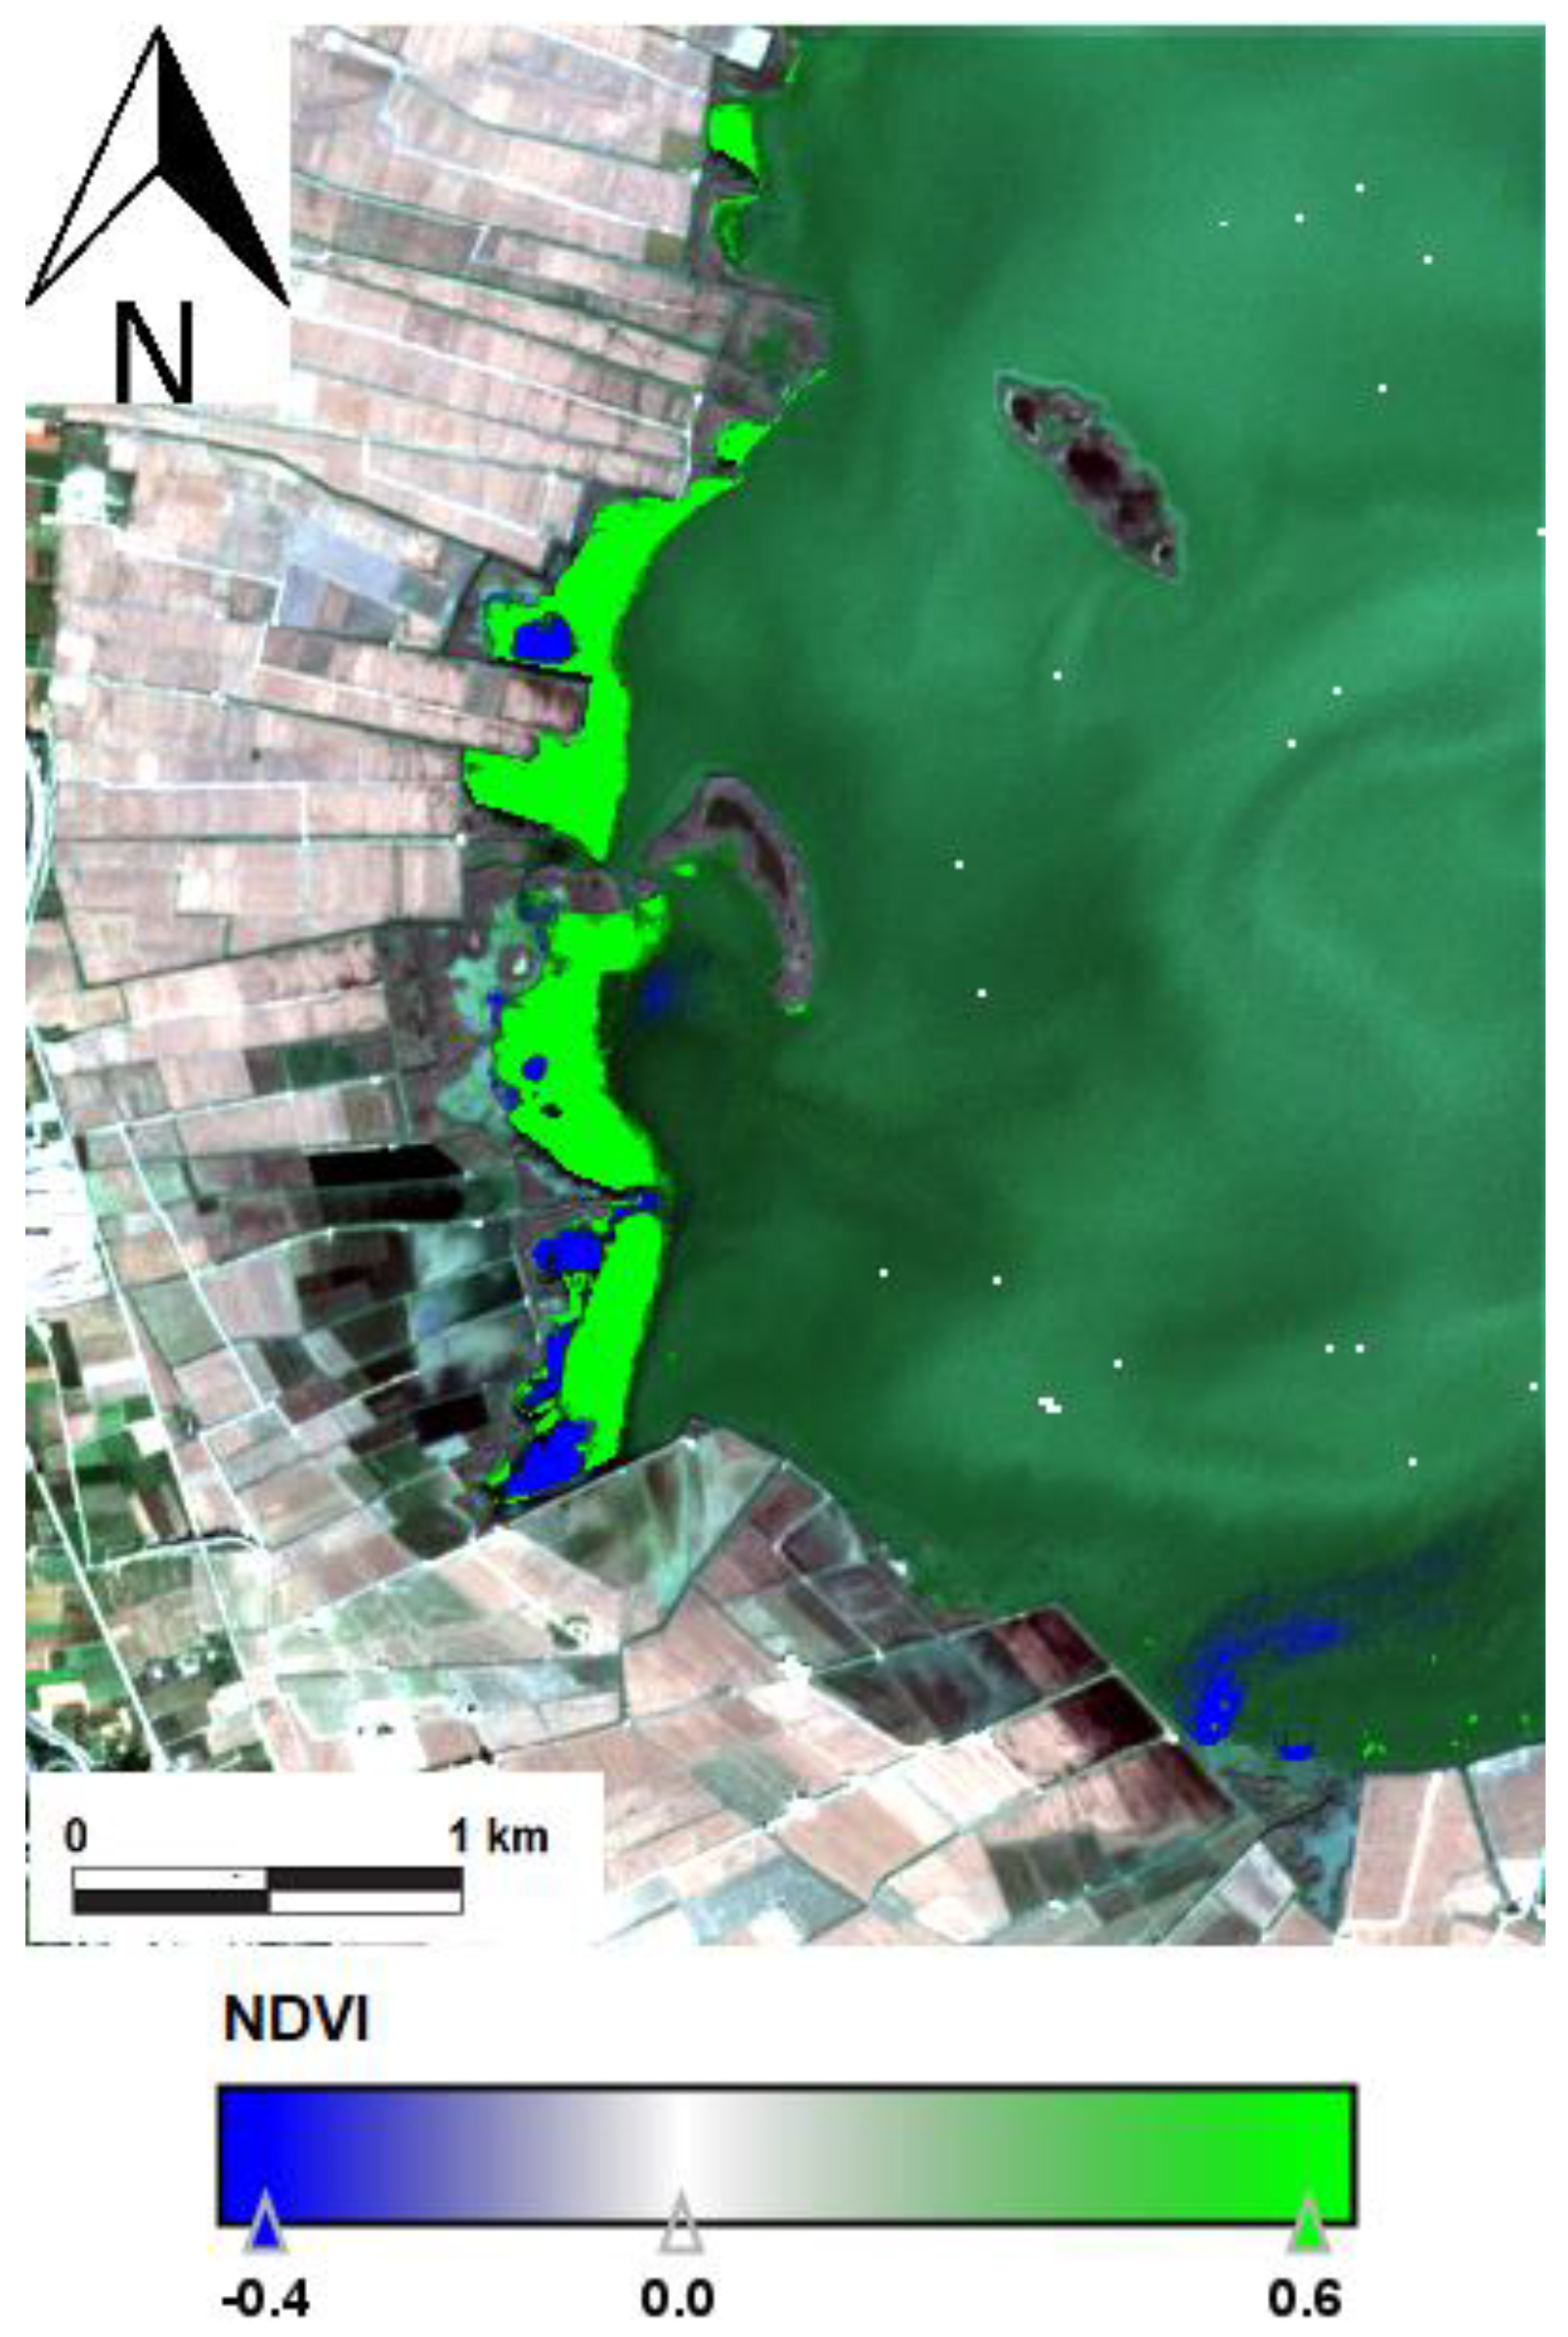
As illustrated in Figure 5, the initial growth phase of N. marina is predominantly located in the southwestern part of the lagoon (brilliant green) and an area of low NDVI values near the shore of the lagoon (blue colour) indicating clearer waters.
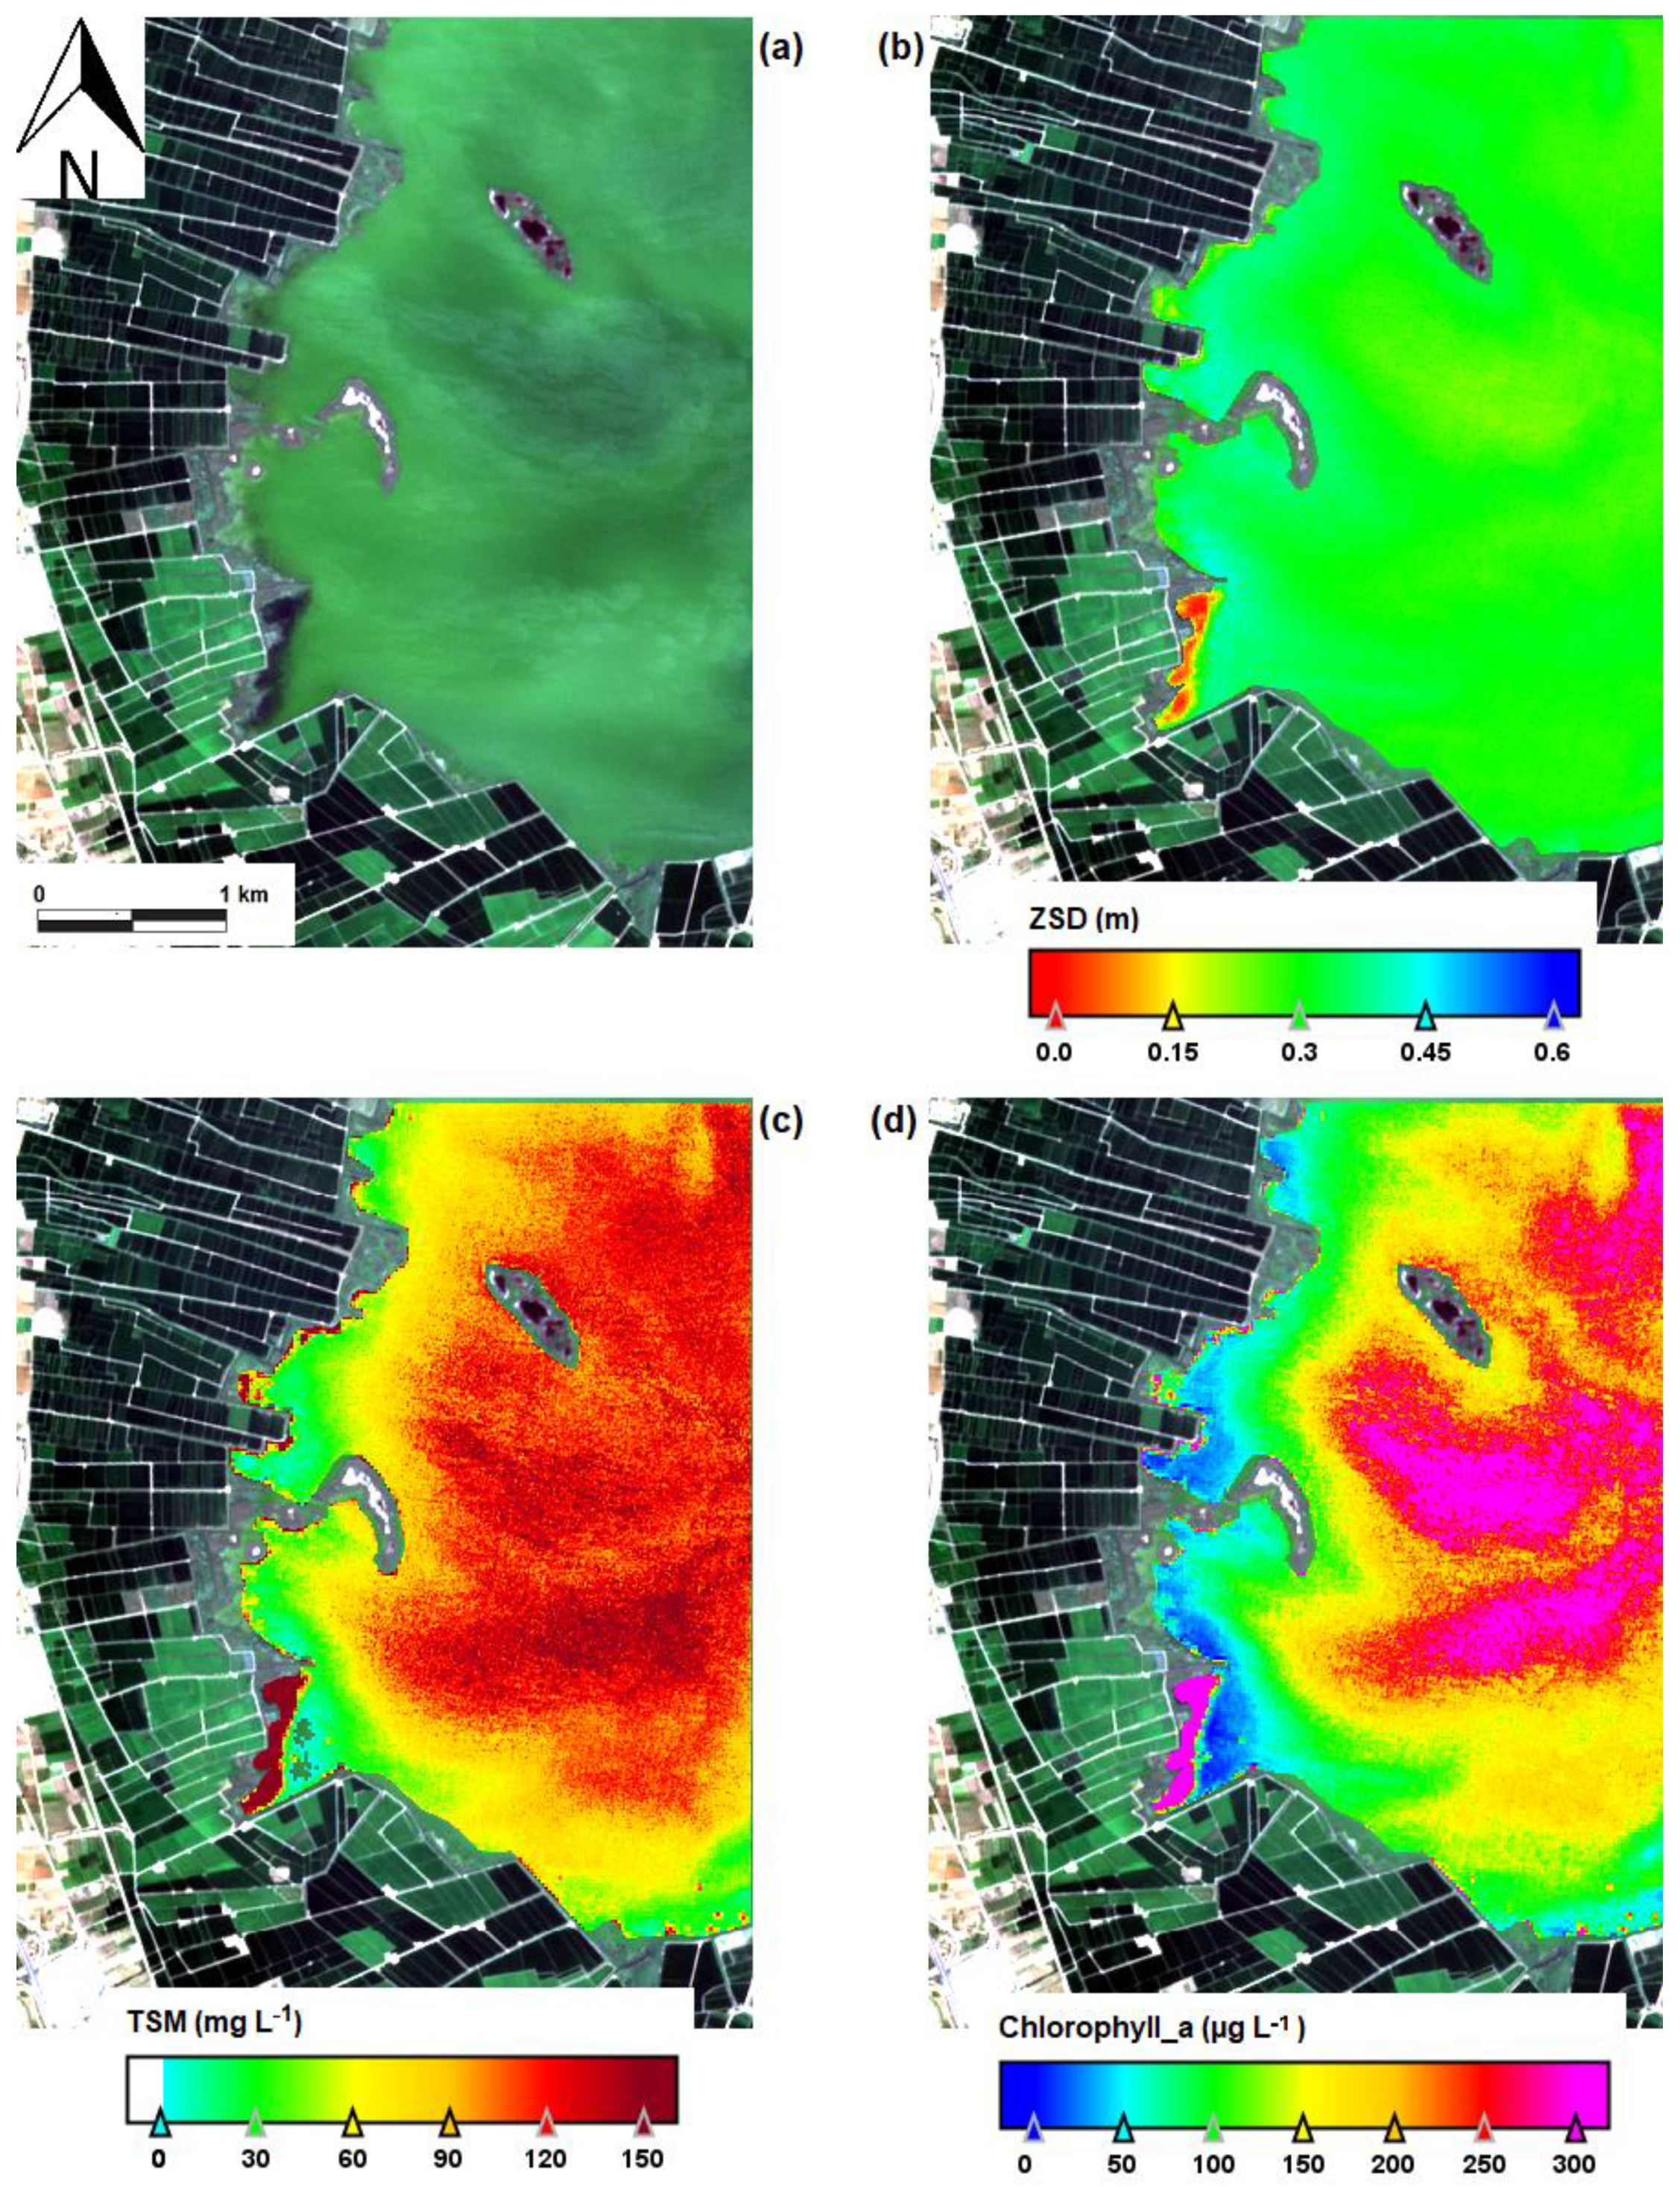
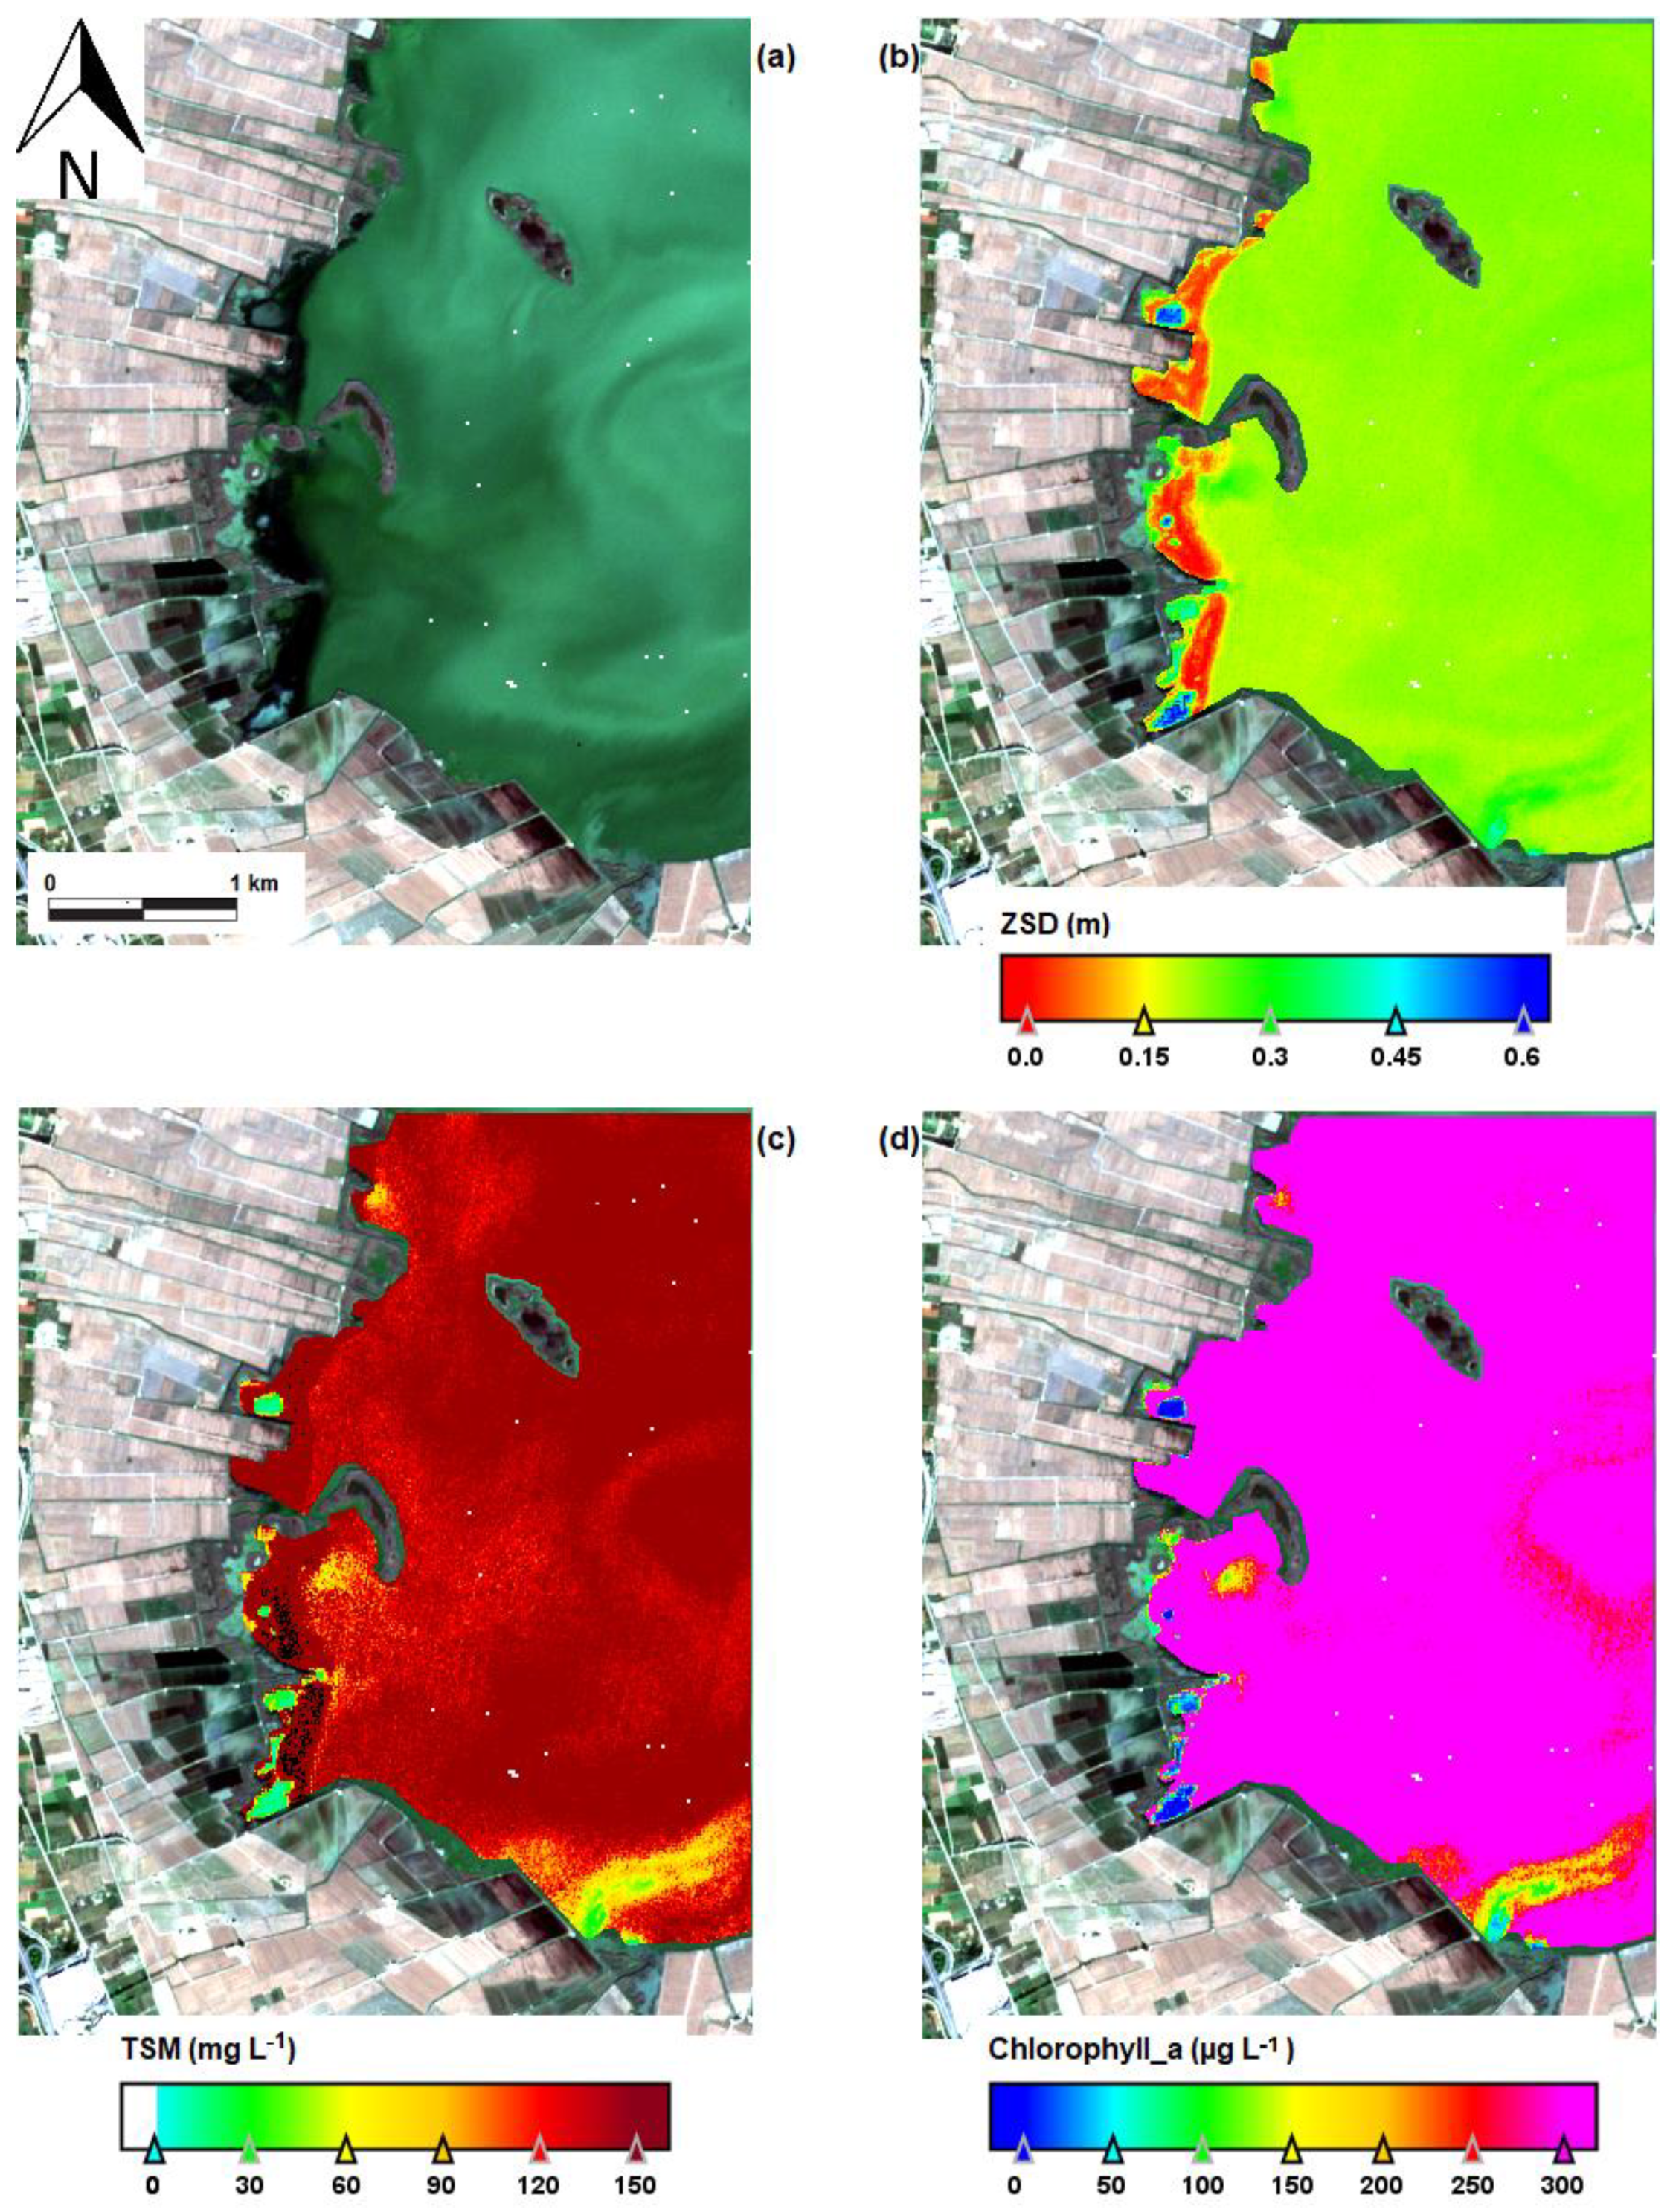
This initial establishment is facilitated by the enhancement of water quality, as demonstrated in Figure 6. The figure reveals that areas with reduced suspended solids concentrations and chlorophyll-a (illustrated in blue colour in Figure 6c,d) and augmented water transparency (indicated in green in Figure 6b) are identified. These alterations indicate more favourable conditions for the proliferation of aquatic macrophytes that appeared in the southwest side (orange and red colour in Figure 6c,d).
In Figure 7, the fully developed vegetation mass is observed in the western shore part of the lagoon. However, this period coincides with the worst water quality time of the year, characterised by an autumn phytoplankton bloom, caused by the closure of the floodgates that connect the Albufera to the Mediterranean sea. The substantial phytoplankton biomass during this period exerts an influence on the near-infrared reflectance, thereby hindering the NDVI from accurately differentiating between water and vegetation. This phenomenon has been extensively documented, as the NDVI is predicated on the contrast between red and near-infrared reflectance, which can be adversely affected by elevated concentrations of suspended particulate matter and algal blooms. Consequently, in such instances, the spectral response of phytoplankton-rich waters may bear a resemblance to that of bare soil, potentially leading to misclassification in the absence of prior knowledge about the study area. In this study, we designate NDVI values ranging from 0 to 0.2 as indicative of no vegetation, which, under conditions of eutrophication, can coincide with the spectral response of turbid waters [23].
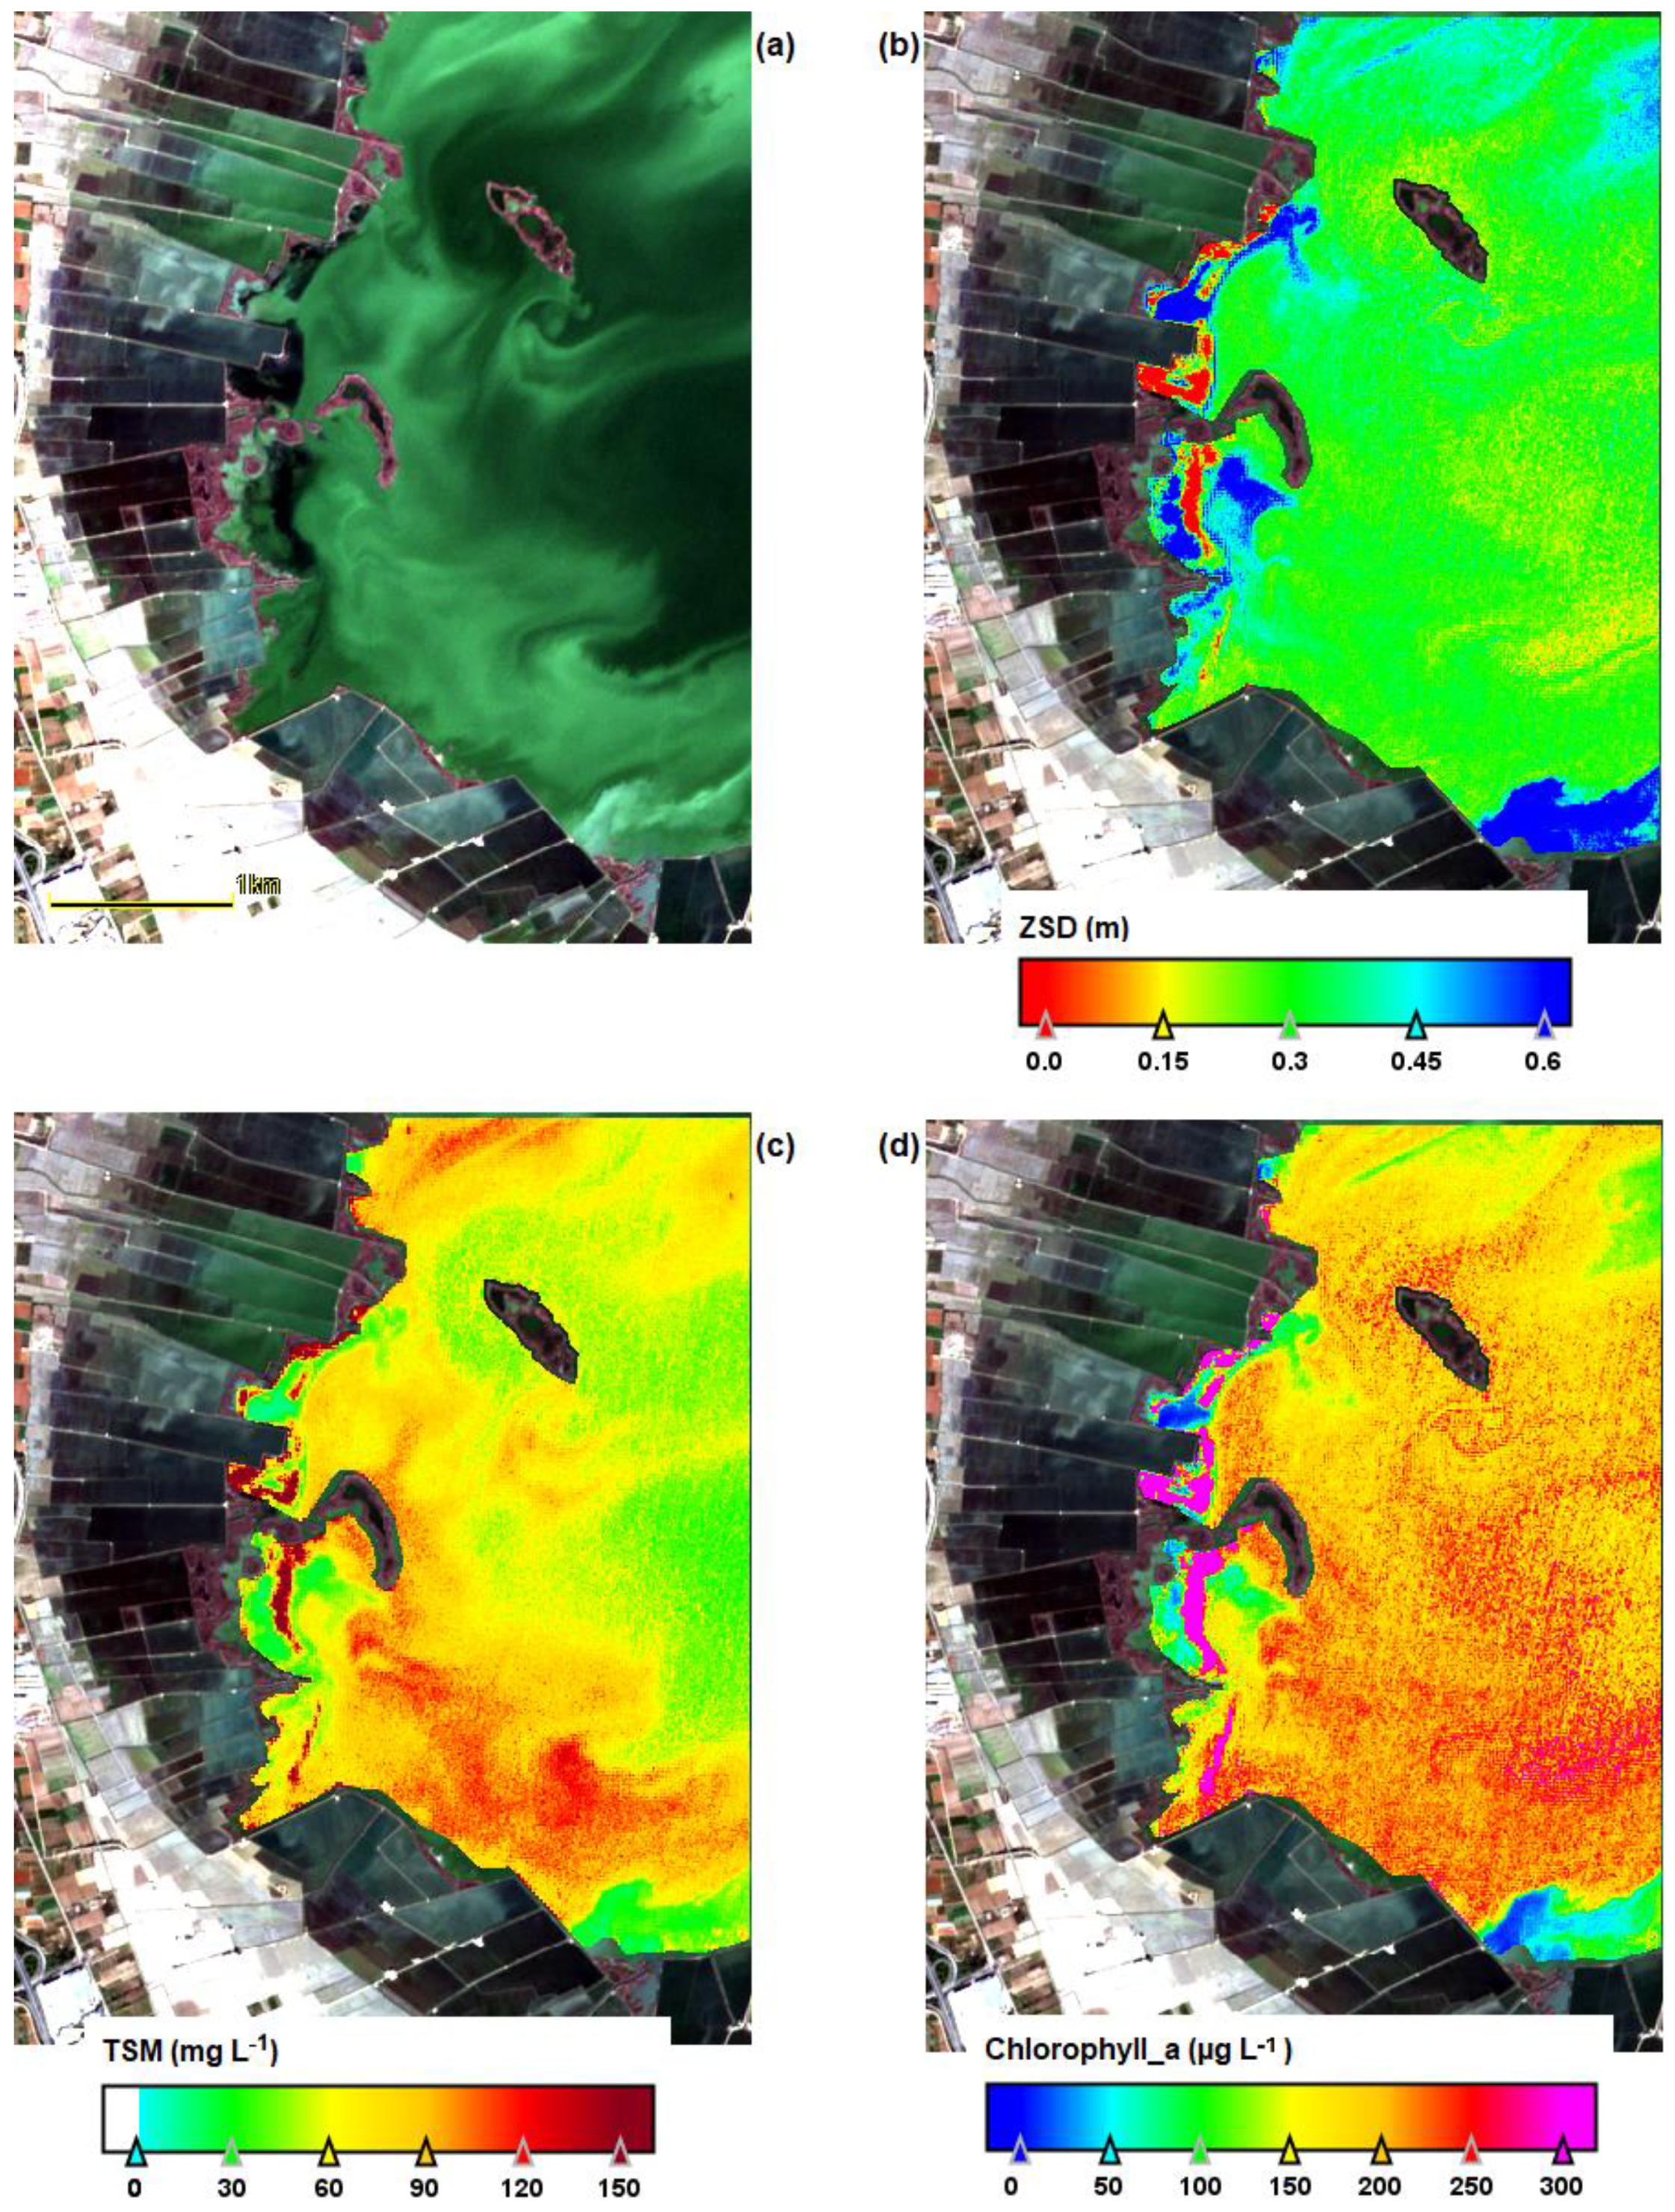
The deterioration in water quality is evident in the maps presented in Figure 8, where there is an extreme concentration of chlorophyll and suspended solids, accompanied by a substantial reduction in transparency throughout the lagoon in the date of the image. Due to the presence of these anomalous conditions, the data from this period have been excluded from the multivariate statistical analysis as outlier values.
The senescence phase of N. marina is observed in Figure 9, with most of the plants already deceased. This transition is again detected by the NDVI, which shows a progressive deterioration of the vegetation and some areas with clearer water.
Finally, Figure 10 confirms that vegetation senescence was associated with the continuous worsening of water conditions, evidenced by decreasing transparency and increasing the chlorophyll and solids concentrations. It is noteworthy that this stage also corresponds to the occurrence of winter flooding in the rice fields, a seasonal phenomenon that has the potential to influence the nutrient dynamics and water quality of the lagoon. We can also observe the presence of Cyanobacteria in the water, giving the green colour typical of these microorganisms of the phytoplankton studied by Molner et al. [20].

4. Discussion

The presence of N. marina in aquatic environments is mainly controlled by temperature, which is the most decisive environmental factor in its growth, ahead of the substrate [35]. In this sense, their optimal germination temperature is 20–25 °C [36], and faster and higher growth is favoured with water above 20 °C, but plant death is caused in water below 15 °C [37]. This may be the reason why it is uncommon in Europe [38]. In this sense, in the Albufera in summer, the water temperature can reach these temperatures. According to Molner et al. [20], water temperature in the summer reaches 32.0 °C, in autumn around 15 °C, and in winter 10 °C, and occasionally, the minimum arrives at 8.0 °C.
As for its phenology, N. marina begins its growth in July when the nutrients in lakes are usually scarce [22], coinciding with the present study. On this point, Forsberg [39] was the first to show that low temperatures are required to break dormancy. Therefore, it is logical to think that, in the Albufera, its development is difficult due to the high concentration of nutrients and phytoplankton and that, in this year, the management measures that involved the contribution of more water from the Jucar into the lake improved the water quality and allowed its reappearance.
The appearance of N. marina has not only been observed in the Albufera but also in the case of the inland lake Velenjsko Jezero (Slovenia), where N. marina was first recorded in 1997 [40]. This species has proliferated rapidly and has become dominant over the previously most prevalent species in the lake, M. spicatum and Potamogeton crispus L. [41,42]. However, in this instance, the favourable conditions of warm water and unstable sediments played a pivotal role in its ecological strategy. In the case of coastal Lake Myall (New South Wales, Australia), which is in a catchment modified by agriculture, urbanisation, and sewage treatment plant discharge, the high biomass of N. marina is related to the low biomass of Nitella hyalina and limited by mechanical disturbances occurring in spring [43]. Additionally, the macrophytes in Lake Nasser (an artificial reservoir in Egypt) face significant challenges due to alterations in temperature and water level, which are regulated by a dam [44].
From the methodological perspective employed in our study, it has been determined that there is a paucity of specific studies on the NDVI methodology applied specifically to N. marina, with the majority of studies encompassing multiple species per area and failing to differentiate between species. This is exemplified by Ma et al. [45], who utilised the NDVI to analyse changes in both emerged and submerged vegetation cover within Lake Taihu (China) by employing Landsat Thematic Mapper images. Their findings indicated a substantial decline in vegetation cover between 2001 and 2007.
In other instances, the NDVI has been utilised to examine various species of Najas through the analysis of Landsat images. In the study of Bao’am Lake [46], in the middle reaches of the Yangtze River, various indices were tested, including Floating Algae Index and the NDVI, to ascertain that aquatic vegetation cover was controlled by various factors, such as water level, fish production, and sediment [47]. The study revealed that submerged aquatic vegetation exhibited an increase in spring and a decrease in summer, attributable to competition with floating and emergent species. Consistent with the present study, Song [46] identified a negative correlation between macrophyte cover and total nitrogen and phosphorus concentration, with the effect being positive when considering the combined impact of water level and transparency.
Other studies have monitored Najas, though employing different methodologies, such as the application of Leaf Area Index. In Lake Garda (Italy), a monitoring program was conducted from 2005 to 2010 using GeoEye-1 data to assess the health of common reed beds in the southern part of the lake. The results of the study revealed a decline in the leaf area of the reed beds, from approximately 4 m2 m−2 (leafs vs. total leafs) in the initial three years to less than 3 m2 m−2 in 2008 and 2010 [48]. The observed decline in reed beds between 2007 and 2010 represented a loss of 12% of the total area occupied in the southern part of the lake [49]. The results of this study, in line with those of Bresciani [48], indicate that water level plays a key role in the regeneration efficiency of reed patches and in the health of reeds.
The work of Silva et al. [50] in the Madu Ganga Estuary (Sri Lanka), which is the most similar to our own methodologically, does monitor Najas using the NDVI but, in this case, over several years and with the ASTER satellite. However, in contrast to our study and those conducted on Lake Garda in Italy, and in agreement with the findings of Cao et al. [51], they demonstrate that macrophyte growth is enhanced by moderate and low water levels, primarily due to the increased availability of light. This is one of the factors contributing to the predominance of N. marina on the shoreline and bay regions within the study area. The absence of N. marina in the central part of the estuary may be attributed to the velocity of the water, which impedes vegetation growth. In the present Albufera study, the plant also developed on one shore, suggesting that lower water velocity may also be a contributing factor.
This study demonstrates that the use of remote sensing in aquatic vegetation studies is justifiable for several reasons. Firstly, remote sensing facilitates the collection of large-scale and temporal data, which, in turn, allow for the monitoring of changes in aquatic vegetation over time. This technique provides detailed maps that reveal the heterogeneity of water bodies and the behaviour of certain species, thus helping to understand their dynamics and their relationship with environmental conditions [52].
The NDVI has been identified as a key index in the context of aquatic vegetation, having been demonstrated as an effective indicator for monitoring species such as M. spicatum in aquatic environments [23]. Despite assertions regarding certain optical limitations of the NDVI, it has been found to be sensitive to aquatic vegetation even at depths of 50 cm [26]. This is significant due to the specific nature of reflectance in the visible and near-infrared spectrum, which is similar between emergent aquatic plants and their terrestrial counterparts. Therefore, its application in the study of aquatic vegetation allows estimates of their density, growth, and health to be obtained, providing important information for the management and conservation of these ecosystems.
The use of satellites to map macrophyte communities has facilitated the study of these ecosystems on a large scale, beyond what could be observed on the ground alone. This has enabled the monitoring of the spatial and temporal dynamics of freshwater ecosystems [53]. Wetlands, being highly dynamic ecosystems, experience rapid changes in their vegetation [54], and remote sensing is a key tool for their management and prevention of disturbances. The NDVI, measuring vegetation health, has proven useful for tracking these changes and contributing to a better understanding of the dynamics of aquatic ecosystems.
From an ecological standpoint, the significant changes in water quality parameters observed during the study period can be attributed to both meteorological conditions and human water management. In the spring of 2022, unusually high rainfall was recorded, totalling 198 mm in April and May, exceeding the typical annual rainfall. Subsequently, between 10 June and 5 July 2022, an exceptional influx of high-quality water was delivered to the Albufera by the Jucar River Basin Authority, with an estimated flow of 0.5 m3 s−1 entering through the western channels of the lake. This continuous supply of clean water, which lasted for approximately three months, significantly improved water transparency and facilitated the unprecedented development of N. marina. However, as the year progressed, the water quality deteriorated due to hydrological management practices. The autumn phytoplankton bloom, triggered by the closure of the sluice gates that regulate water exchange between the lagoon and the sea, led to nutrient accumulation and stratification, promoting eutrophic conditions that reduced transparency. In addition, the winter flooding of rice fields further affected the water quality by introducing organic matter and nutrients from decomposing vegetation, increasing suspended solids and phytoplankton growth. These dynamics highlight the strong coupling between hydrological management and aquatic vegetation dynamics in the Albufera.
From a management perspective, it has been demonstrated that such extraordinary inflows of water result in an increase in the lake’s renewal rate, thereby contributing to an enhancement in water quality. This phenomenon was observed in the experimental setups conducted in 2015 and during the extreme weather events in autumn 2024, where a substantial decline in the chlorophyll and conductivity levels was documented. However, both parameters returned to normal values within a month [55].
These phenomena can promote the temporary appearance and subsequent disappearance of macrophyte species that were previously present in the Albufera but which disappeared due to the deterioration of their ecological status during the 20th century. An outstanding case is that of M. spicatum, which reached a significant surface area in the lagoon in the spring of 2018, having undergone its greatest development. This phenomenon was attributed to the influx of clean water from the Jucar River during the winter of 2017–2018, which led to an increase in water transparency and facilitated the recolonisation of the species after more than a 40-year absence. However, high summer temperatures caused their disappearance in August 2018 [23]. Consequently, the interplay between the influx of clean water and the period of enhanced transparency proved to be a pivotal factor in the colonisation process.

5. Conclusions

The results of this study demonstrate that the enhancement in water quality is favourable to the recovery of aquatic vegetation in the Albufera. Specifically, Najas marina exhibited substantial recolonisation in 2022 in select areas of the lagoon, coinciding with an increase in water transparency and the contribution of optimal flows. These findings are consistent with those of previous studies in the Albufera, including the documented case of Myriophyllum spicatum, which proliferation in 2018 was also linked to the influx of clean water from the Jucar River. The concurrence of these events underscores the pivotal role of water quality in the restoration of submerged vegetation and emphasises the necessity for continuous monitoring strategies to evaluate its long-term progression.
The utilisation of remote sensing techniques, such as the NDVI and Sentinel-2 satellite imagery, has emerged as a highly effective tool for the monitoring of aquatic vegetation dynamics. The employment of these technologies has facilitated the early detection of the proliferation of Najas marina, thereby providing an efficient alternative to conventional fieldwork methods. The capacity of these techniques to cover vast areas with high data acquisition frequency has been instrumental in facilitating a comprehensive understanding of ecosystem evolution and assessing the effects of water inputs.
These findings underscore the imperative for the ongoing implementation of remote sensing-based monitoring strategies, in conjunction with the assessment of the impact of future water inputs, on the ecological restoration of the Albufera.

Author Contributions

Conceptualisation, J.M.S.; methodology, J.M.S., J.V.M. and X.S.-P.; validation, J.M.S. and J.V.M.; formal analysis, J.M.S., X.S.-P. and J.V.M.; investigation, J.V.M. and N.C.-T.; data curation, J.M.S. and J.V.M.; writing—original draft preparation, J.V.M. and N.C.-T.; writing—review and editing, J.M.S., J.V.M. and X.S.-P.; supervision, J.M.S. All authors have read and agreed to the published version of the manuscript.

Funding

This research was funded by the REmote Sensing Spectroscopy for wetlands BIOdiversity (RESSBIO) project, grant number CIPROM/2021/49, by Generalitat Valenciana.

Data Availability Statement

The original contributions presented in this study are included in the article. Remote sensing imagery was downloaded from Copernicus web page (https://browser.dataspace.copernicus.eu/) accessed on 11 December 2024. Further inquiries can be directed at the corresponding author.

Conflicts of Interest

The authors declare no conflicts of interest.

Abbreviations

The following abbreviations are used in this manuscript:
TSSTotal Suspended Solids
Chl-aChlorophyll-a
ZSDSecchi Disk Depth

References

  1. Siddiqui, A.J.; Jahan, S.; Adnan, M.; Ashraf, S.A.; Singh, R. Macrophytes and Their Role in Wetland Ecosystems. In Aquatic Macrophytes: Ecology, Functions and Services; Kumar, S., Bauddh, K., Singh, R., Kumar, N., Kumar, R., Eds.; Springer Nature: Singapore, 2023; pp. 119–138. [Google Scholar]
  2. Preiner, S.; Dai, Y.; Pucher, M.; Reitsema, R.E.; Schoelynck, J.; Meire, P.; Hein, T. Effects of macrophytes on ecosystem metabolism and net nutrient uptake in a groundwater fed lowland river. Sci. Total Environ. 2020, 721, 137620. [Google Scholar] [CrossRef]
  3. Newman, R.M. Herbivory and detritivory on freshwater macrophytes by invertebrates: A review. J. N. Am. Benthol. Soc. 1991, 10, 89–114. [Google Scholar] [CrossRef]
  4. Swe, T.; Lombardo, P.; Ballot, A.; Thrane, J.E.; Sample, J.; Eriksen, T.E.; Mjelde, M. The importance of aquatic macrophytes in a eutrophic tropical shallow lake. Limnologica 2021, 90, 125910. [Google Scholar] [CrossRef]
  5. Germ, M.; Janež, V.; Gaberščik, A.; Zelnik, I. Diversity of macrophytes and environmental assessment of the Ljubljanica river (Slovenia). Diversity 2021, 13, 278. [Google Scholar] [CrossRef]
  6. Dvořák, J. An example of relationships between macrophytes, macroinvertebrates and their food resources in a shallow euthrophic lake. Hydrobiologia 1996, 339, 27–36. [Google Scholar] [CrossRef]
  7. Harvey, R.M.; Pickett, J.R.; Bates, R.D. Environmental factors controlling the growth and distribution of submersed aquatic macrophytes in two South Carolina reservoirs. Lake Reserv. Manag. 1987, 3, 243–255. [Google Scholar] [CrossRef]
  8. Chambers, P.A.; Lacoul, P.; Murphy, K.J.; Thomaz, S.M. Global diversity of aquatic macrophytes in freshwater. Hydrobiologia 2007, 595, 9–26. [Google Scholar] [CrossRef]
  9. Lacoul, P.; Freedman, B. Environmental influences on aquatic plants in freshwater ecosystems. Environ. Rev. 2006, 14, 89–136. [Google Scholar] [CrossRef]
  10. Zhu, G.; Li, W.; Zhang, M.; Ni, L.; Wang, S. Adaptation of submerged macrophytes to both water depth and flood intensity as revealed by their mechanical resistance. Hydrobiologia 2012, 696, 77–93. [Google Scholar] [CrossRef]
  11. Madsen, J.D.; Adams, M.S. The distribution of submerged aquatic macrophyte biomass in a eutrophic stream, Badfish Creek—The effect of environment. Hydrobiologia 1989, 171, 111–119. [Google Scholar] [CrossRef]
  12. Engloner, A.; Szalma, E.; Sipos, K.; Dinka, M. Occurrence and habitat preference of aquatic macrophytes in a large river channel. Community Ecol. 2013, 14, 243–248. [Google Scholar] [CrossRef]
  13. Shields, E.C.; Moore, K.A. Effects of sediment and salinity on the growth and competitive abilities of three submersed macrophytes. Aquat. Bot. 2016, 132, 24–29. [Google Scholar] [CrossRef]
  14. Kading, J.; Xu, L. Documenting macrophytes and their habitat preferences in southeastern South Dakota. Proc. South. Dak. Acad. Sci. 2021, 100, 37–52. [Google Scholar]
  15. Alexander, T.J.; Vonlanthen, P.; Seehausen, O. Does Eutrophication-Driven Evolution Change Aquatic Ecosystems? Philos. Trans. R. Soc. B Biol. Sci. 2017, 372, 20160041. [Google Scholar] [CrossRef] [PubMed]
  16. Smith, M.J.; Ough, K.M.; Scroggie, M.P.; Schreiber, E.S.G.; Kohout, M. Assessing changes in macrophyte assemblages with salinity in non-riverine wetlands: A Bayesian approach. Aquat. Bot. 2009, 90, 137–142. [Google Scholar] [CrossRef]
  17. Hilton, J.; O’Hare, M.; Bowes, M.J.; Iwan Jones, J. How green is my river? A new paradigm of eutrophication in rivers. Sci. Tot. Environ. 2006, 365, 66–83. [Google Scholar] [CrossRef] [PubMed]
  18. Moss, B. Ecology of Freshwaters, Man and Medium, Past to Future, 3rd ed.; Blackwell Science: Oxford, UK, 1998; ISBN 978-1-444-31342-0. [Google Scholar]
  19. Scheffer, M.; van Nes, E.H. Shallow lakes theory revisited: Various alternative regimes driven by climate, nutrients, depth and lake size. Hydrobiologia 2007, 584, 455–466. [Google Scholar] [CrossRef]
  20. Molner, J.V.; Mellinas-Coperias, I.; Canós-López, C.; Pérez-González, R.; Sendra, M.D.; Soria, J.M. Seasonal Dynamics and Environmental Drivers of Phytoplankton in the Albufera Coastal Lagoon (Valencia, Spain). Environments 2025, 12, 23. [Google Scholar] [CrossRef]
  21. Viinikka, Y. Najas marina L. (Najadaceae). Karyotypes, cultivation and morphological variation. Ann. Bot. Fenn. 1976, 13, 119–131. [Google Scholar]
  22. Agami, M.; Waisel, Y. The effect of temperature and photoperiod on growth of Najas marina L. In Proceedings of the International Symposium on Aquatic Macrophytes, Nijmegen, The Netherlands, 18–23 September 1983. [Google Scholar]
  23. Soria, J.M.; Molner, J.V.; Pérez-González, R.; Alvado, B.; Vera-Herrera, L.; Romo, S. Monitoring the Extraordinary Ephemeral Emergence of Myriophyllum spicatum L. in the Coastal Lagoon Albufera of Valencia (Spain) and Assessing the Impact of Environmental Variables Using a Remote Sensing Approach. J. Mar. Sci. Eng. 2024, 12, 260. [Google Scholar] [CrossRef]
  24. Confederación Hidrográfica del Júcar (Spanish Government). A Delegation of Representatives of the Administrations Responsible for the Management of l’Albufera Made a Technical Visit to the Area Where the Najas Marina Have Proliferated. Valencia, Spain, 2022. (In Spanish). Available online: https://www.chj.es/es-es/ciudadano/salaprensa/Paginas/Visita-Albufera-najas-marinas.aspx (accessed on 16 December 2024).
  25. Tucker, C.J. Red and photographic infrared linear combinations for monitoring vegetation. Remote Sens. Environ. 1979, 8, 127–150. [Google Scholar] [CrossRef]
  26. Malthus, T.J. Bio-optical Modeling and Remote Sensing of Aquatic Macrophytes. In Bio-Optical Modeling and Remote Sensing of Inland Waters; Elsevier: Amsterdam, The Netherlands, 2017; pp. 263–308. [Google Scholar] [CrossRef]
  27. Soria, J.M. Past, present and future of la Albufera of Valencia Natural Park. Limnetica 2006, 25, 135–142. [Google Scholar] [CrossRef]
  28. Jégou, A.; Sanchis-Ibor, C. The opaque lagoon. Water management and governance in l’Albufera de València wetland (Spain). Limnetica 2019, 38, 503–515. [Google Scholar] [CrossRef]
  29. Soria, J.; Romo, S.; Vera-Herrera, L.; Calvo, S.; Sòria-Perpinyà, X.; Pérez, J. Evolución de la conductividad en la Albufera de Valencia entre 1985 y 2018. Limnetica 2021, 40, 223–232. [Google Scholar] [CrossRef]
  30. Mondria, M. Infrastructures and Eutrophication in l’Albufera de València. The Cabhal model (in Spanish). Ph.D. Thesis, Polythecnic University of Valencia, Valencia, Spain, 10 March 2011. [Google Scholar] [CrossRef]
  31. Drusch, M.; Del Bello, U.; Carlier, S.; Colin, O.; Fernandez, V.; Gascon, F.; Hoersch, B.; Isola, C.; Laberinti, P.; Martimort, P.; et al. Sentinel-2: ESA’s Optical High-Resolution Mission for GMES Operational Services. Remote Sens. Environ. 2012, 120, 25–36. [Google Scholar] [CrossRef]
  32. Soria-Perpinya, X.; Urrego, P.; Pereira-Sandoval, M.; Ruíz-Verdú, A.; Peña, R.; Soria, J.; Delegido, J.; Vicente, E.; Moreno, J. Monitoring the ecological state of a hypertrophic lake (Albufera of València, Spain) using multitemporal Sentinel-2 images. Limnetica 2019, 38, 457–469. [Google Scholar] [CrossRef]
  33. Molner, J.V.; Soria, J.M.; Pérez-González, R.; Sòria-Perpinyà, X. Measurement of Turbidity and Total Suspended Matter in the Albufera of Valencia Lagoon (Spain) Using Sentinel-2 Images. J. Mar. Sci. Eng. 2023, 11, 1894. [Google Scholar] [CrossRef]
  34. Molner, J.V.; Soria, J.M.; Pérez-González, R.; Sòria-Perpinyà, X. Estimating Water Transparency Using Sentinel-2 Images in a Shallow Hypertrophic Lagoon (The Albufera of Valencia, Spain). Water 2023, 15, 3669. [Google Scholar] [CrossRef]
  35. Hoffmann, M.; Sacher, M.; Lehner, S.; Raeder, U.; Melzer, A. Influence of sediment on the growth of the invasive macrophyte Najas marina ssp intermedia in lakes. Limnologica 2013, 43, 265–271. [Google Scholar] [CrossRef]
  36. Proctor, V.I. Storage and germination of Chara oospores. J. Phycol. 1967, 3, 90–92. [Google Scholar] [CrossRef]
  37. Triest, L. Electrophoretic polymorphism and divergence in Najas marina L.(Najadaceae): Molecular markers for individuals, hybrids, cytodemes, lower taxa, ecodemes and conservation of genetic diversity. Aquat. Bot. 1989, 33, 301–380. [Google Scholar] [CrossRef]
  38. Handley, R.J.; Davy, A.J. Seedling root establishment may limit Najas marina L. to sediments of low cohesive strength. Aquat. Bot. 2002, 73, 129–136. [Google Scholar] [CrossRef]
  39. Forsberg, C. Sterile Germination of Oospores of Chara and Seeds of Najas marina. Physiol. Plant 1965, 18, 128–137. [Google Scholar] [CrossRef]
  40. Mazej, Z.; Epšek, M. The macrophytes of lake Velenjsko Jezero, Slovenia–the succession of macrophytes after restoration of the lake. Acta Biol. Slov. 2005, 48, 21–31. [Google Scholar] [CrossRef]
  41. Nichols, S.A.; Shaw, B.H. Ecological Life Histories of the Three Aquatic Nuisance Plants, Myriophyllum spicatum, Potamogeton crispus and Elodea canadensis. Hydrobiologia 1986, 131, 3–21. [Google Scholar] [CrossRef]
  42. Bolduan, B.R.; Van Eeckhout, G.C.; Quade, H.W.; Gannon, J.E. Potamogeton crispus—The other invader. Lake Reserv. Manag. 1994, 10, 113–125. [Google Scholar] [CrossRef]
  43. Sanderson, B.G.; Asaeda, T.; Rajapakse, L.; Redden, A.M. Mechanisms affecting biomass and distribution of charophytes and Najas marina in Myall Lake, New South Wales, Australia. Hydrobiologia 2008, 608, 99–119. [Google Scholar] [CrossRef]
  44. Abd Ellah, R.G. Water resources in Egypt and their challenges, Lake Nasser case study. Egypt. J. Aquat. Res. 2020, 46, 1–12. [Google Scholar] [CrossRef]
  45. Ma, R.; Duan, H.; Gu, X.; Zhang, S. Detecting Aquatic Vegetation Changes in Taihu Lake, China Using Multi-temporal Satellite Imagery. Sensors 2008, 8, 3988–4005. [Google Scholar] [CrossRef]
  46. Song, S.; Wu, X.; Hou, J.; Peng, S.; Lin, X.; Ge, X.; Yan, D.; Lin, G. Monitoring the Dynamics of Aquatic Vegetation in a Typical Shallow Lake Using the Water Bloom Index Algorithm—A Case Study in Bao’ an Lake in the Middle Reaches of the Yangtze River. Plants 2024, 13, 3090. [Google Scholar] [CrossRef]
  47. Liu, M.; Li, Y.; Li, W.; Qu, X.; Shen, D.; Liu, J.; Qiao, R.; Zhao, Y.; Xiong, F.; Wang, H. Impacts of eutrophication and fishery production on thesuccession of submerged macrophytes in Bao’ an lake. Acta Hydrobiol. Sin. 2023, 47, 1769–1779. [Google Scholar]
  48. Bresciani, M.; Sotgia, C.; Fila, G.L.; Musanti, M.; Bolpagni, R. Assessing Common Reed Bed Health and Management Strategies in Lake Garda (Italy) by Means of Leaf Area Index Measurements. Ital. J. Remote Sens. 2011, 43, 9–22. [Google Scholar] [CrossRef]
  49. Sotgia, C. Censimento e Studio Delle Aree a Canneto del Lago di Garda Meridionale Attraverso Tecniche di Telerilevamento. Ph.D. Thesis, Università di Parma, Parma, Italy, 2010. [Google Scholar]
  50. Silva, S.D.G.T.M.; Dahanayaka, D.D.G.L.; Wijeyaratne, M.J.S. A remote sensing approach for assessing the invasion of Najas marina in Madu Ganga Estuary, Sri Lanka. Int. J. Aquat. Biol. 2020, 8, 377–382. [Google Scholar] [CrossRef]
  51. Cao, J.J.; Wang, Y.; Zhu, Z.L. Growth response of the submerged macrophyte Myriophyllum spicatum to sediment nutrient levels and water-level fluctuations. Aquat. Biol. 2012, 17, 295–303. [Google Scholar] [CrossRef]
  52. Xue, J.; Su, B. Significant Remote Sensing Vegetation Indices: A Review of Developments and Applications. J. Sens. 2017, 2017, 1353691. [Google Scholar] [CrossRef]
  53. Villa, P.; Bresciani, M.; Bolpagni, R.; Pinardi, M.; Giardino, C. A rule-based approach for mapping macrophyte communities using multi-temporal aquatic vegetation indices. Remote Sens. Environ. 2015, 171, 218–233. [Google Scholar] [CrossRef]
  54. Powell, S.J.; Jakeman, A.; Croke, B. Can NDVI response indicate the effective flood extent in macrophyte dominated floodplain wetlands? Ecol. Indic. 2014, 45, 486–493. [Google Scholar] [CrossRef]
  55. Soria, J.M.; Muñoz, R.; Campillo-Tamarit, N.; Molner, J.V. Flash-Flood-Induced Changes in the Hydrochemistry of the Albufera of Valencia Coastal Lagoon. Diversity 2025, 17, 119. [Google Scholar] [CrossRef]
Figure 1. The image captured by Sentinel-2 on 30 May 2022 provides a comprehensive overview of the Albufera de Valencia, including the area surrounding the lagoon. Rice fields were depicted as dry, with the purple polygon delineating the region of occurrence of N. marina. Red star indicates the sampling point.
Water 17 01302 g001
Figure 2. View on 24 October 2022 of the western part of the lagoon showing the extraordinary emergence of N. marina in the area marked with the red dot in Figure 1.
Water 17 01302 g002
Figure 3. Evolution of the area occupied by N. marina in the Albufera de Valencia during the period of growth and disappearance. The red line indicates the Gaussian distribution function fit, while the blue lines indicate the 95% probability interval.
Water 17 01302 g003
Figure 4. Ellipse plot for significant correlations between variables according to Pearson.
Water 17 01302 g004
Figure 5. NDVI thematic map of 8 August 2022. Blue areas indicate clearer waters. Brilliant Green indicates the area covered by N. marina.
Water 17 01302 g005
Figure 6. Thematic maps of 8 August 2022 showing (a) false colour; (b) Secchi disk depth; (c) suspended solids concentration; (d) chlorophyll-a concentration.
Water 17 01302 g006
Figure 7. NDVI thematic map of 6 November 2022. Blue areas indicate clearer waters. Brilliant Green indicates the area covered by N. marina.
Water 17 01302 g007
Figure 8. Thematic maps for 6 November 2022 showing (a) false colour; (b) Secchi disk depth; (c) suspended solids concentration; (d) chlorophyll-a concentration.
Water 17 01302 g008
Figure 9. NDVI thematic map on 4 February 2023. Blue areas indicate clearer waters. Brilliant Green indicates the area covered by N. marina. Other green areas in the lagoon correspond to Cyanobacteria populations.
Water 17 01302 g009
Figure 10. Thematic maps of 4 February 2023 showing (a) false colour; (b) Secchi disk depth; (c) suspended solids concentration; (d) chlorophyll-a concentration.
Water 17 01302 g010
Table 1. Results of the variables obtained by remote sensing.
DateArea (ha)Chl-a (mg m−3)TSS (mg L−1)ZSD (m)
09 June 20221.69187.70127.480.35
09 July 20222.11137.6750.540.29
08 August 20229.9658.6030.600.37
07 September 202222.6226.9119.410.49
02 October 202240.7633.8214.410.49
06 November 202248.42363.50145.300.21
16 December 202232.74110.2238.410.43
05 January 202325.54121.9832.720.32
04 February 202314.94145.1053.200.31
01 March 20231.82113.6265.660.32
Table 2. Results of the Shapiro–Wilk test for normality of the data for the original set.
Area (ha)Chl-a (mg m−3)TSS (mg L−1)ZSD (m)
N10101010
Shapiro–Wilk W0.9180.8430.8270.935
p (normal)0.3450.0490.0310.507 (*)
Note: Signification level: (*) p-value > 0.05.
Table 3. Results of the Shapiro–Wilk test of normality of the data for the set with no outlier.
Area (ha)Chl-a (mg m−3)TSS (mg L−1)ZSD (m)
N9999
Shapiro–Wilk W0.9120.9380.8330.862
p (normal)0.329 (*)0.557 (*)0.0480.102 (*)
Note: Signification level: (*) p-value > 0.05.
Table 4. Results of the Shapiro–Wilk test of normality of the data for the normalised set.
Area (ha)Chl-a (mg m−3)TSS (mg L−1)ZSD (m)
N9999
Shapiro–Wilk W0.9120.9380.9830.862
p (normal)0.329 (*)0.557 (*)0.979 (*)0.102 (*)
Note: Signification level: (*) p-value > 0.05.
Table 5. Results of the Pearson’s test of data correlation for the normalised set.
Area (ha)Chl-a (mg m−3)TSS (mg L−1)ZSD (m)
Area (ha) p = 0.108p = 0.014 (*)p = 0.027 (*)
Chl-a (mg m−3)r = −0.571 p = 0.001 (***)p = 0.016 (*)
TSS (mg L−1)r = −0.774r = 0.914 p = 0.033 (*)
ZSD (m)r = 0.723r = −0.767r = −0.708
Note: Signification level: (*) p-value < 0.05, and (***) p-value < 0.001.
Disclaimer/Publisher’s Note: The statements, opinions and data contained in all publications are solely those of the individual author(s) and contributor(s) and not of MDPI and/or the editor(s). MDPI and/or the editor(s) disclaim responsibility for any injury to people or property resulting from any ideas, methods, instructions or products referred to in the content.