

Groundwater Quantity and Quality Management in a Mountainous Aquifer System in NE Greece †

 ,
,  ,
,  and
and
Abstract
1. Introduction
2. Material and Methods
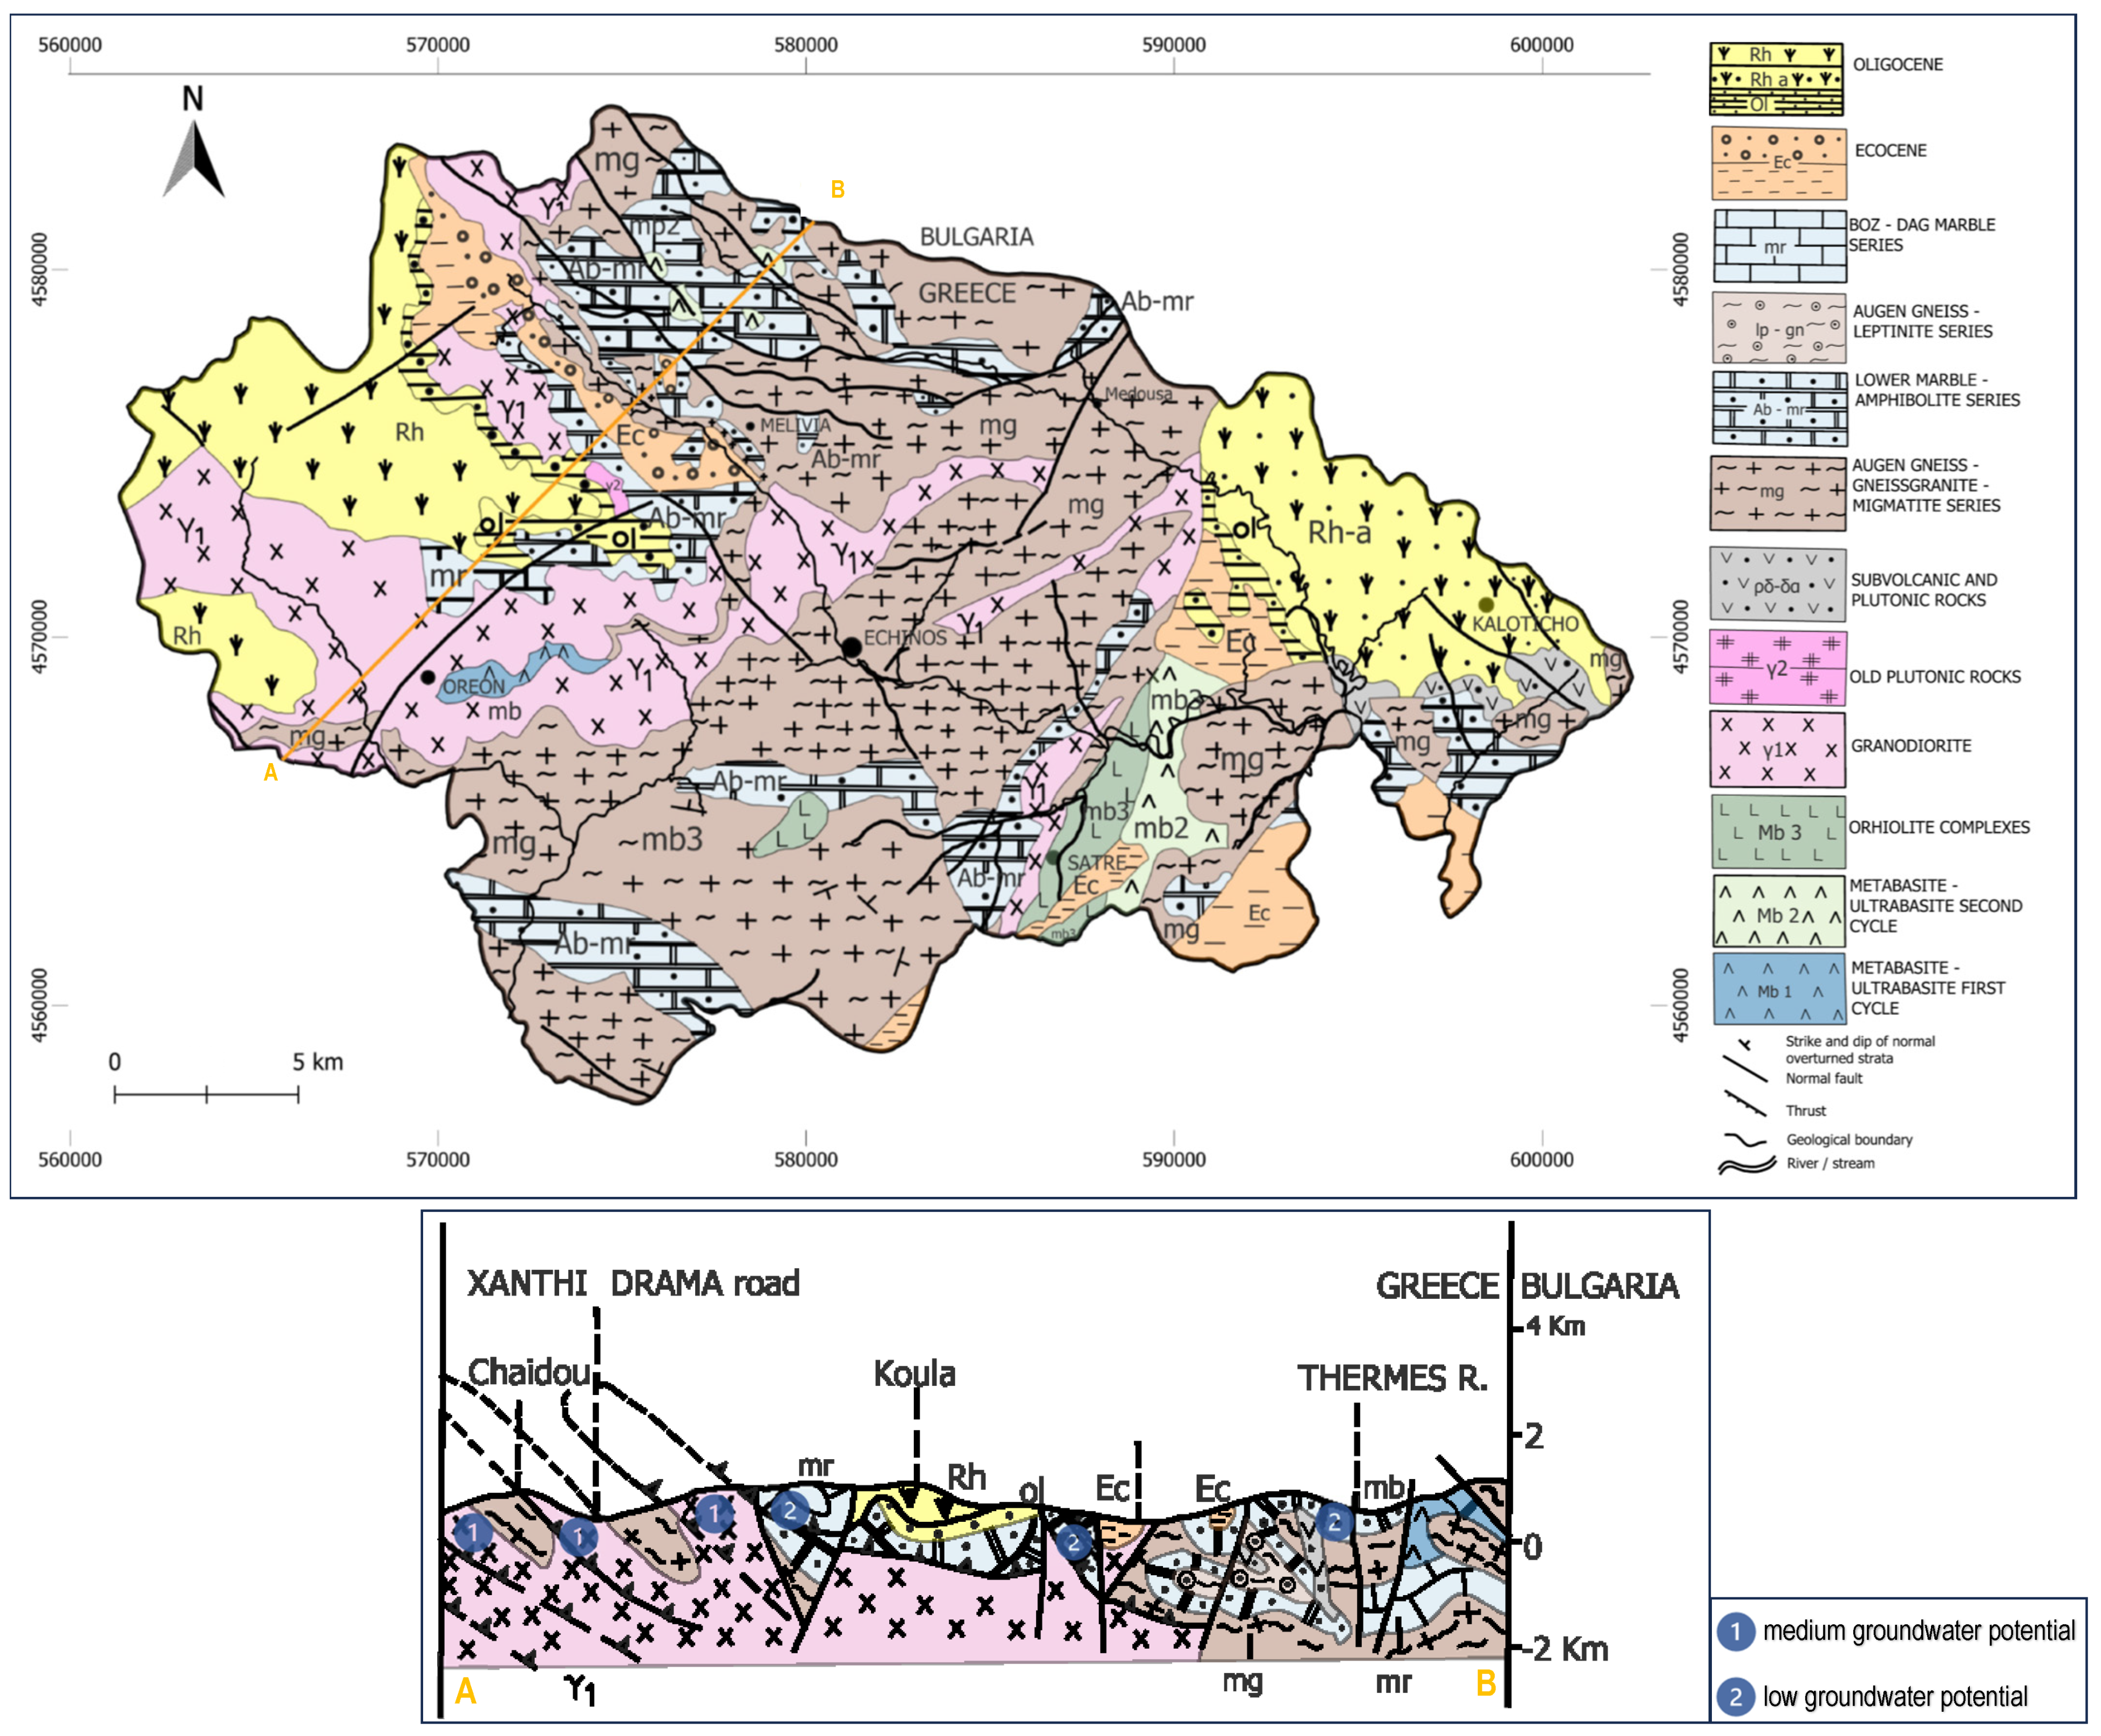
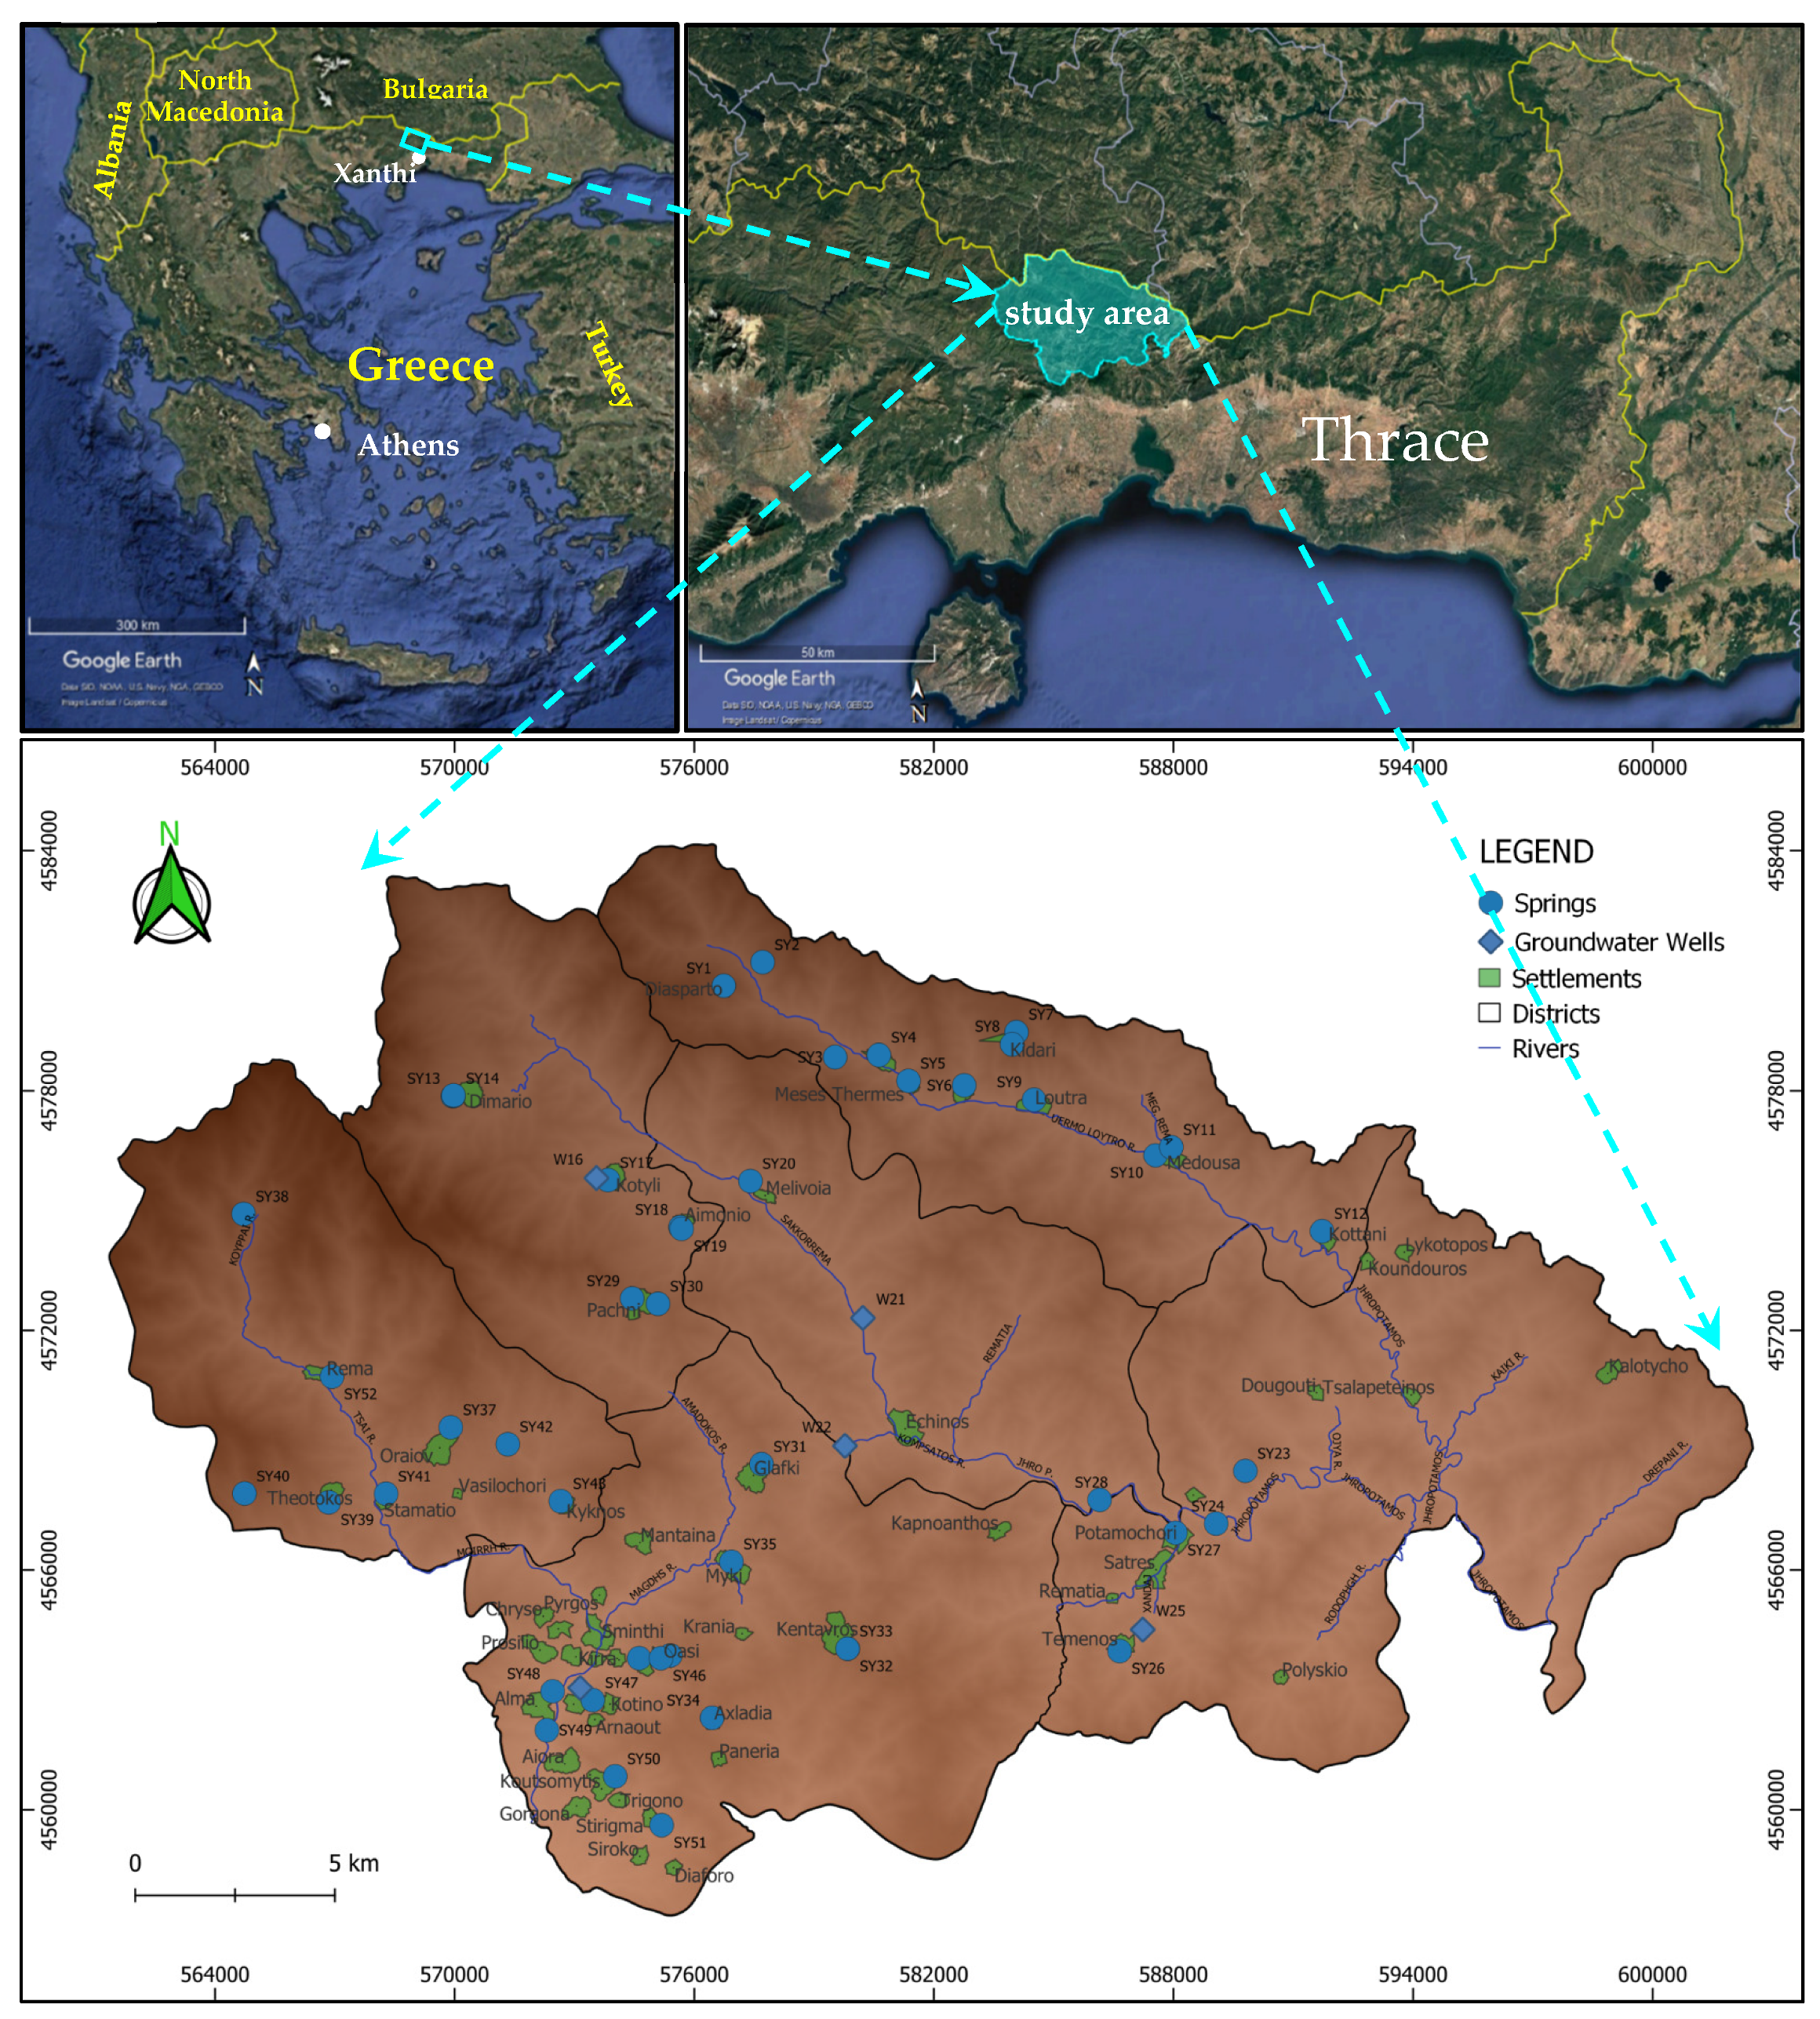
2.1. Study Area, Geological, Hydrological, and Hydrogeological Information

2.2. Groundwater Data Collection and Analysis
- i.
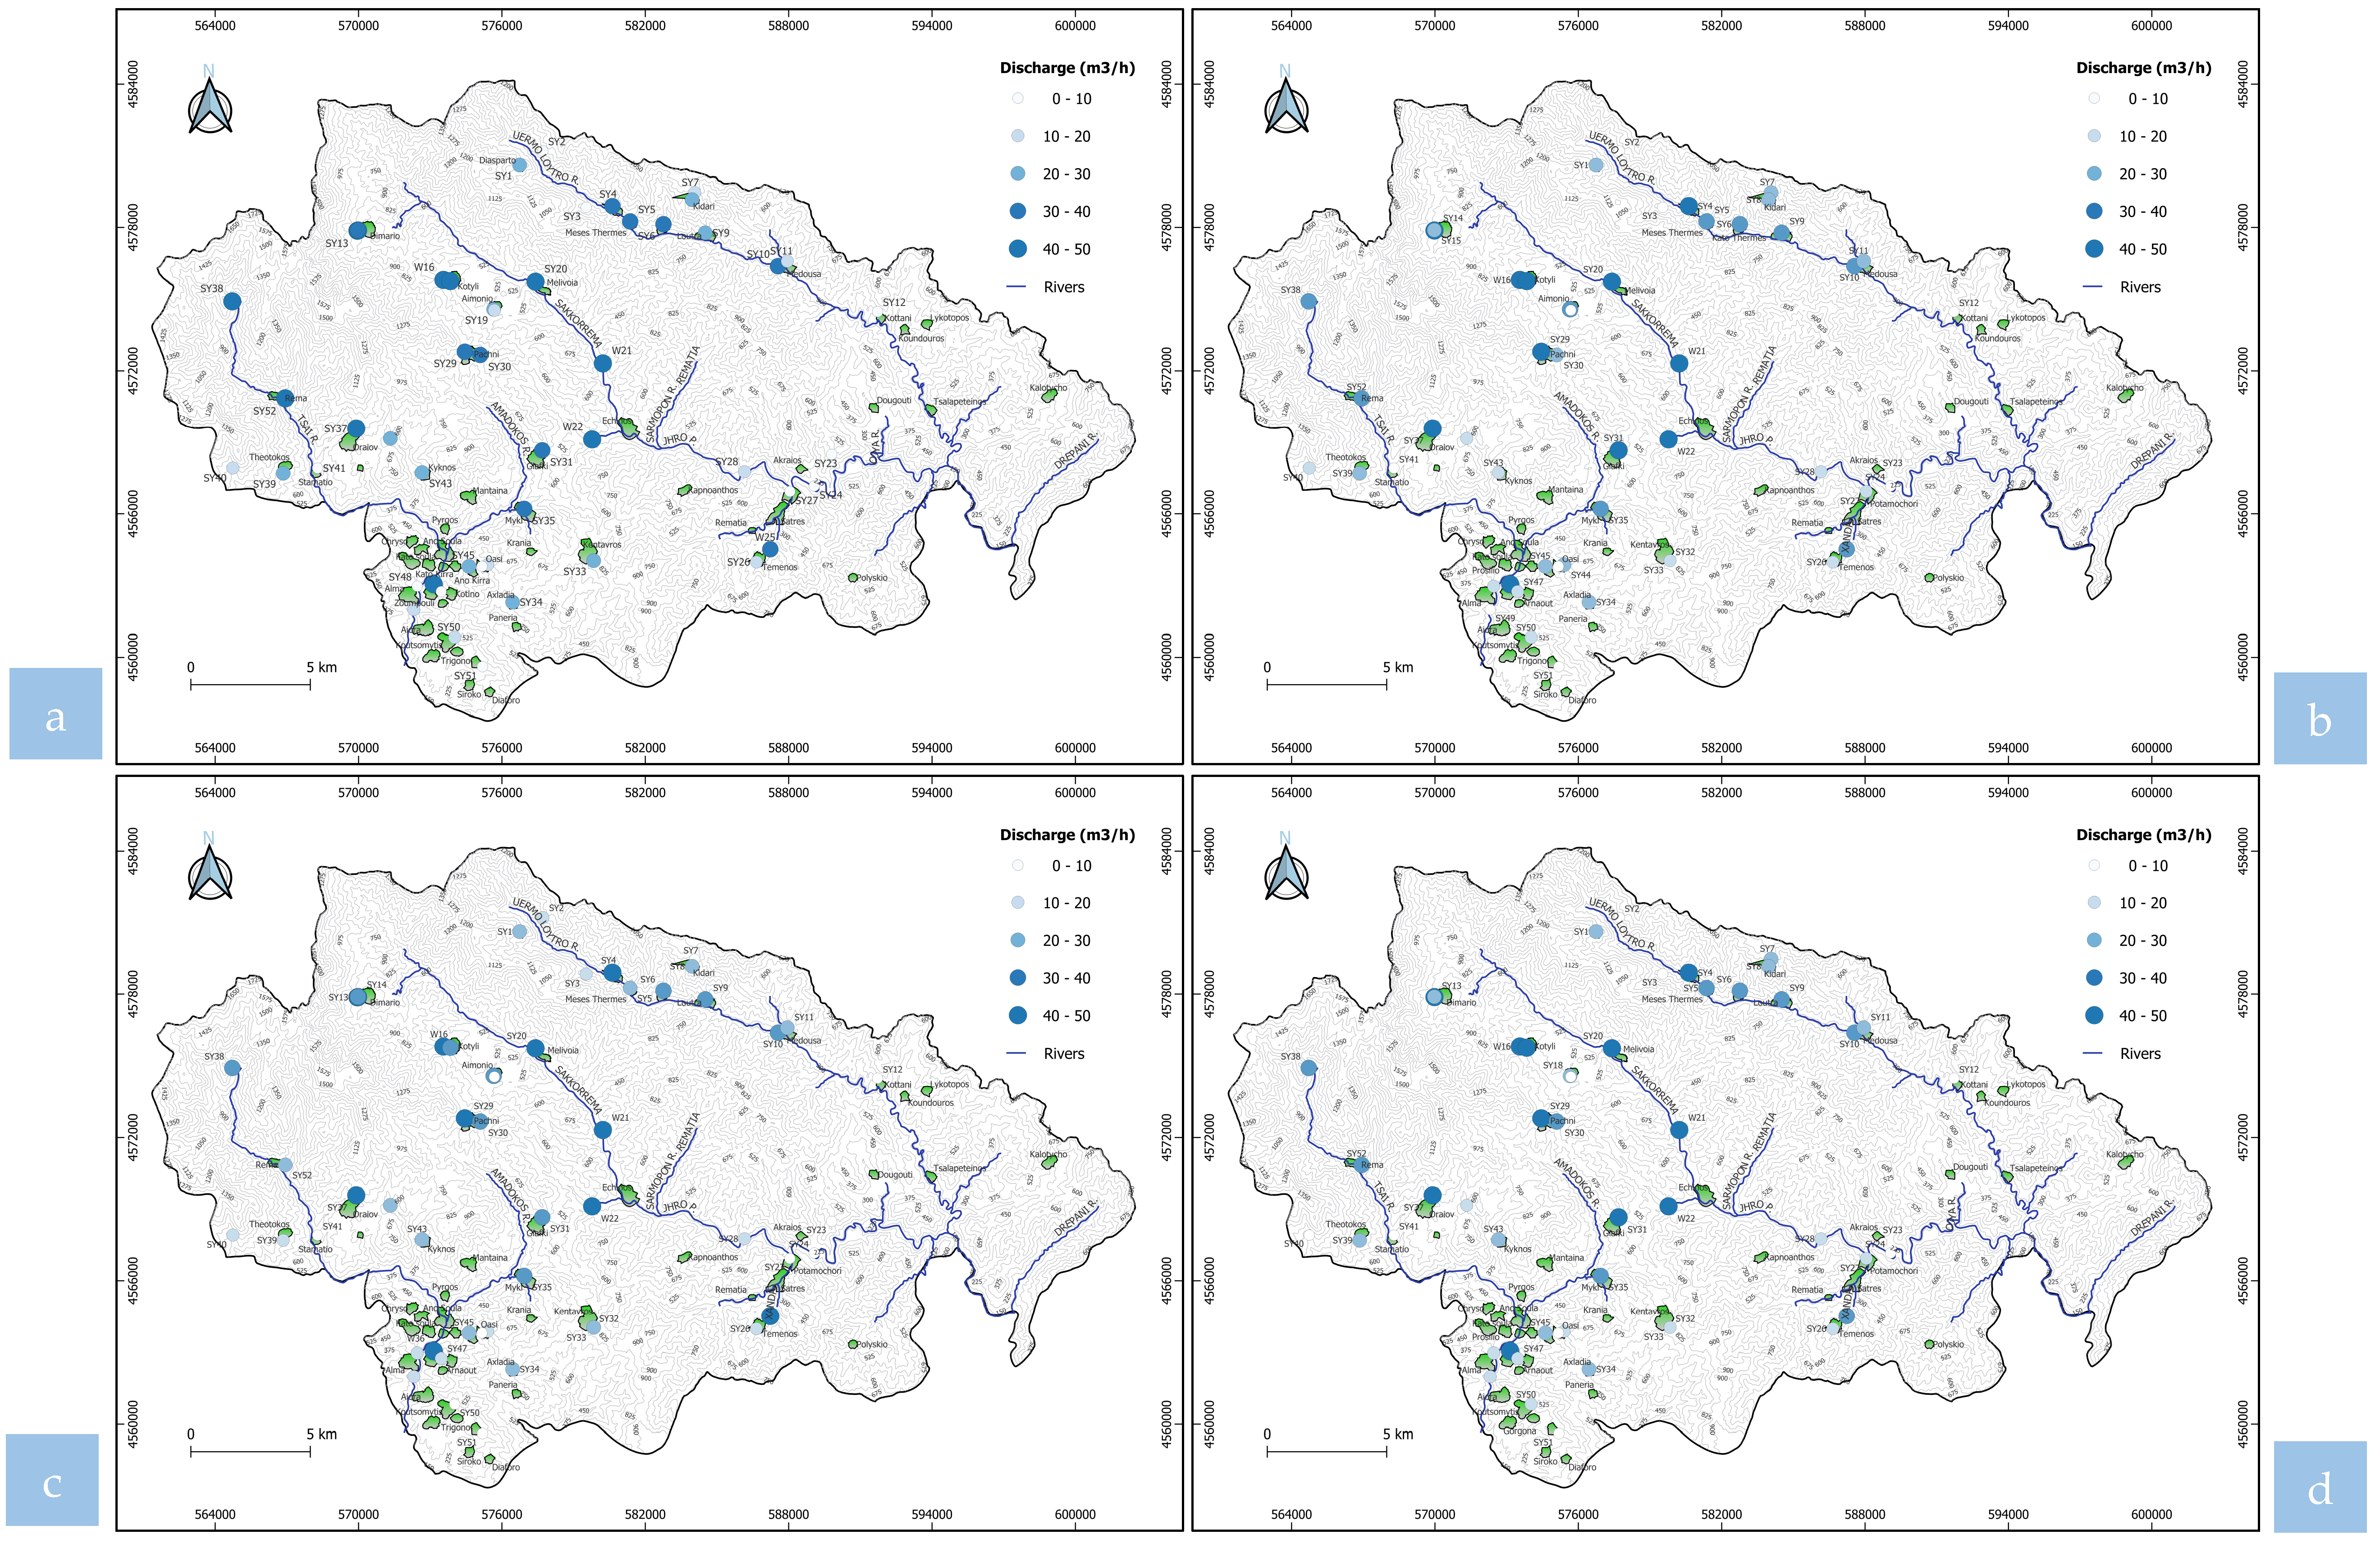
- Measurements of groundwater discharge from 47 springs and five wells (in total 52 water points), as well as in situ measurements of pH, electrical conductivity (EC), and temperature (October 2021, April 2022, October 2022, April 2023);
- ii.
- Sampling of groundwater from the 52 monitoring points;
- iii.
- Chemical analyses in the Laboratory of Engineering Geology and Groundwater Research of the Department of Civil Engineering, DUTH, examining the following parameters: total hardness, Ca2+, Mg2+, Na+, K+, Fe2+, NH4+, HCO3−, Cl−, SO42−, NO3−, NO2−;
- iv.
- Analysis, processing, and presentation of the results produced;
- v.
- Formulation of recommendations that would improve the state of the water supply in Myki Municipality (Figure 1).
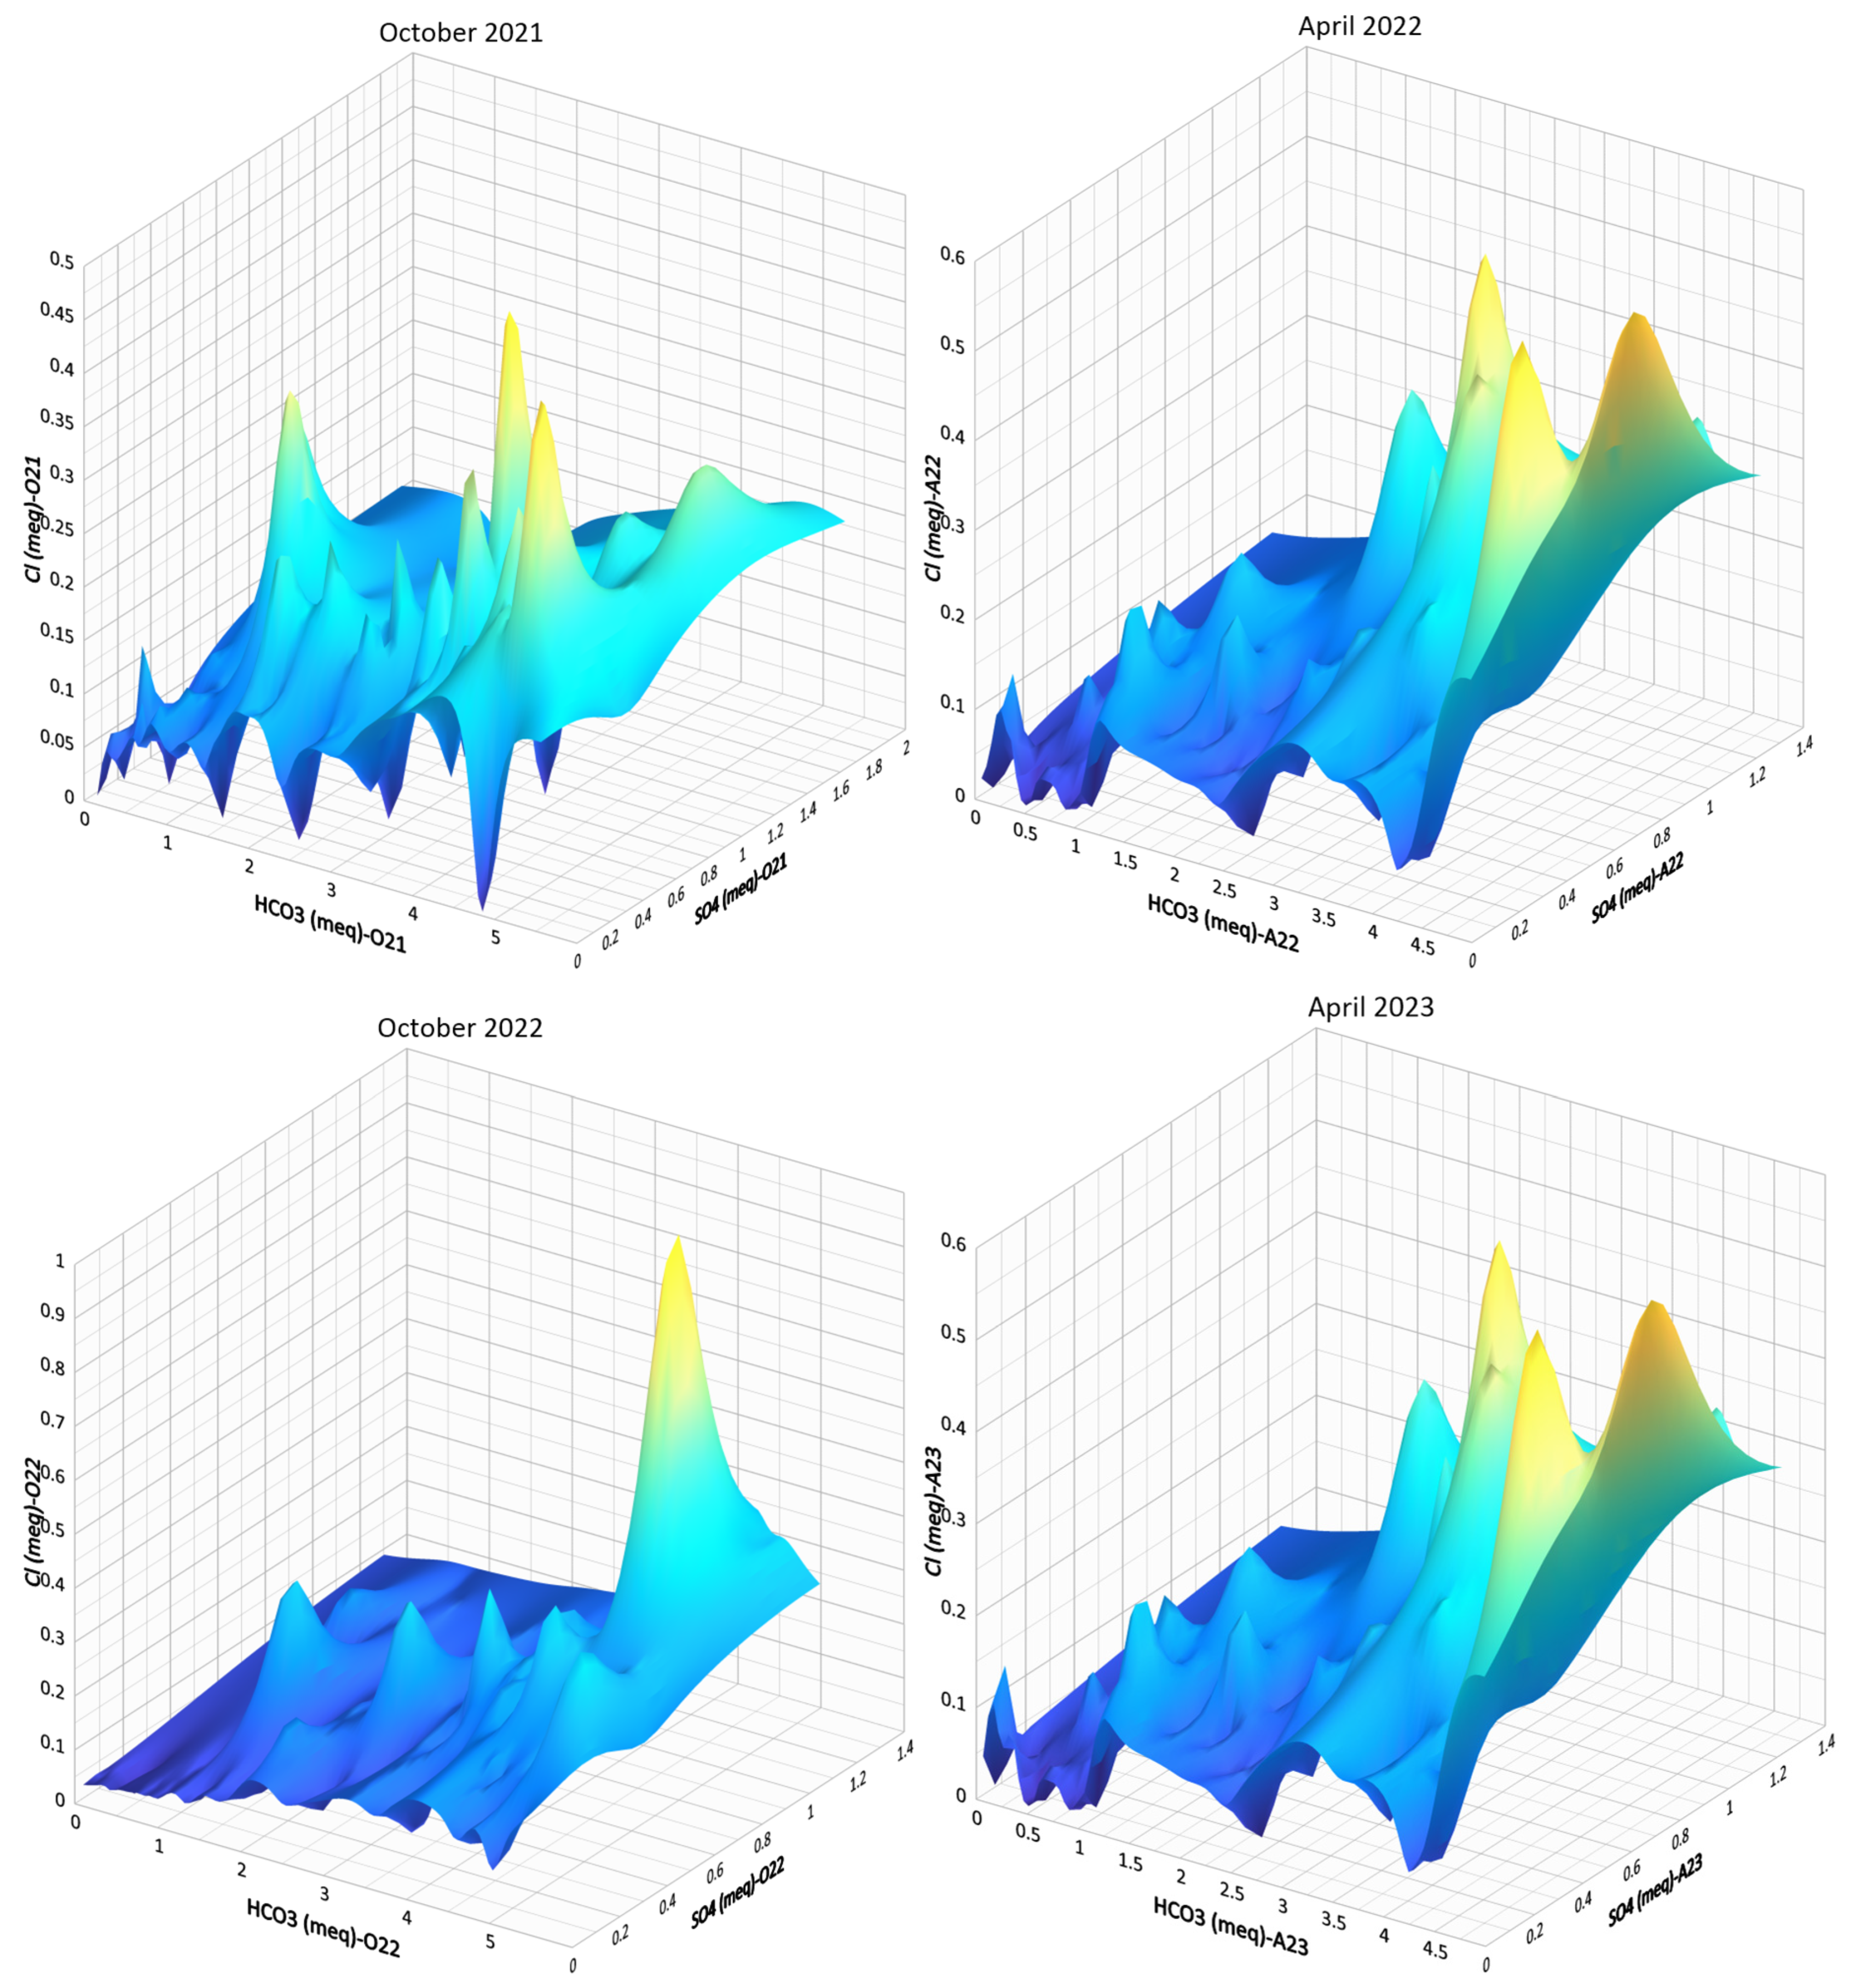
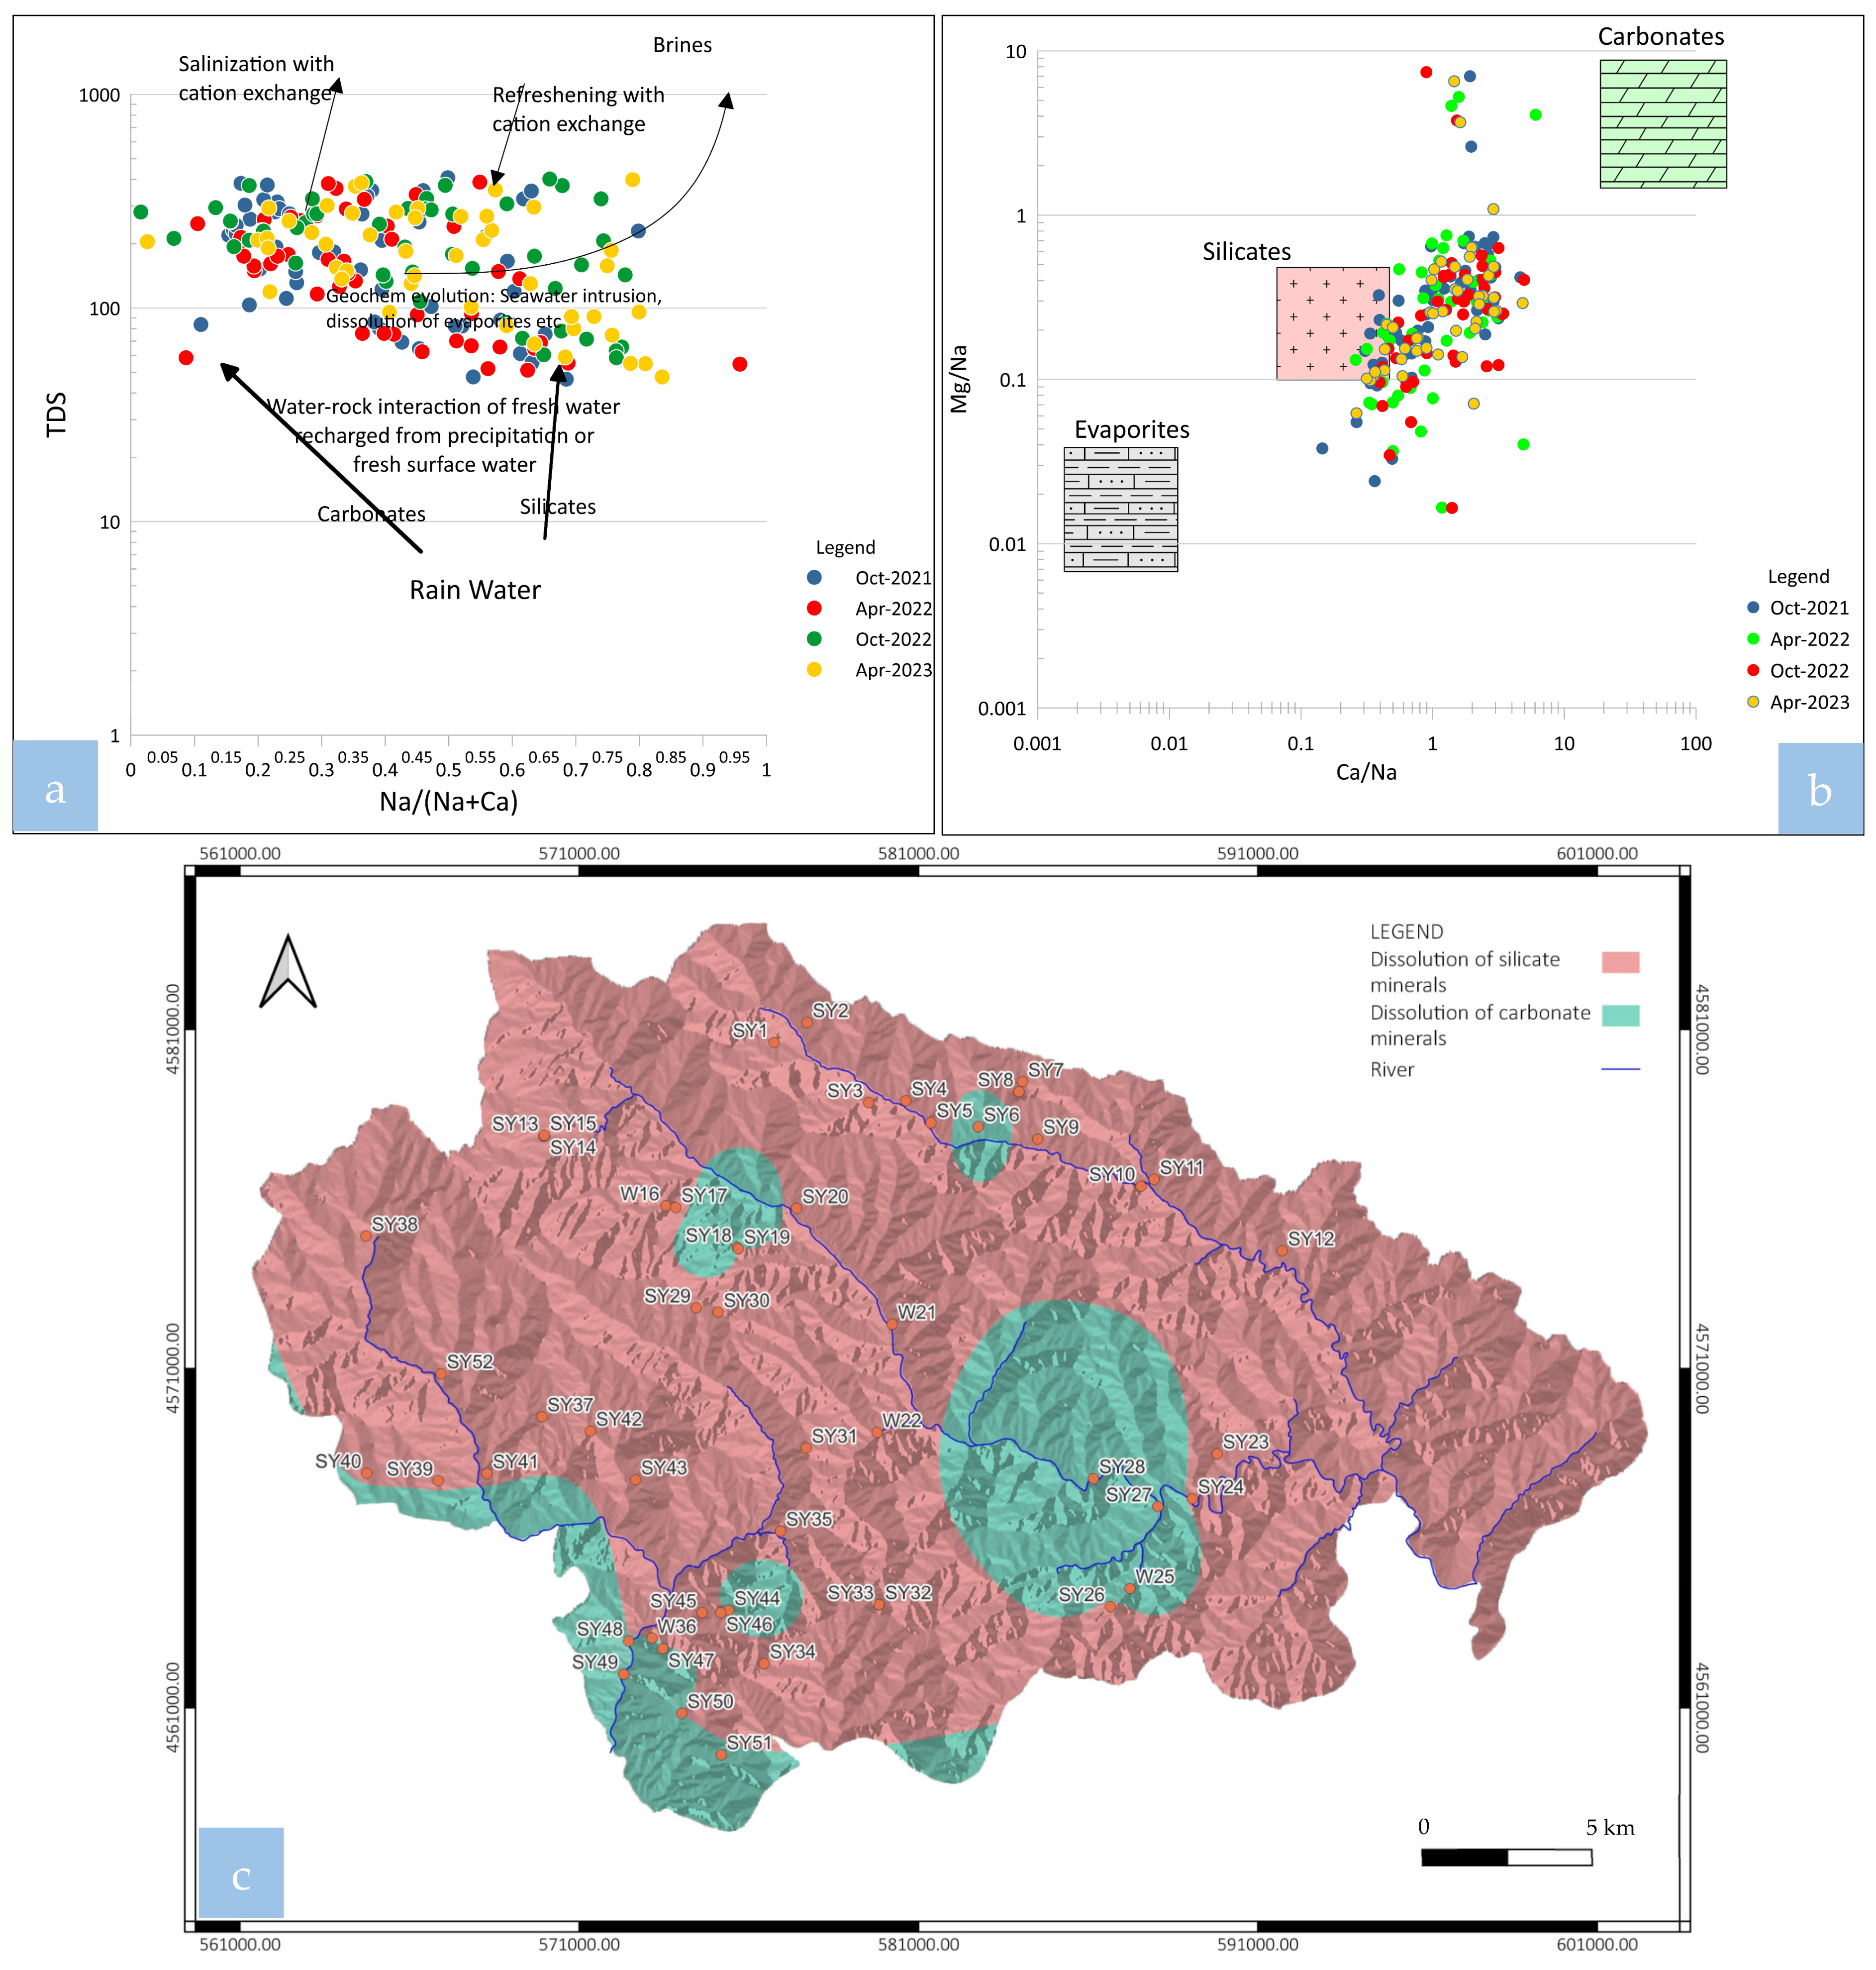
3. Results and Discussion
- –
- Values of calcium ions (Ca2+) concentration are below the maximum allowable threshold of 100 mg/L (variation of values: 0.32–87.37 mg/L);
- –
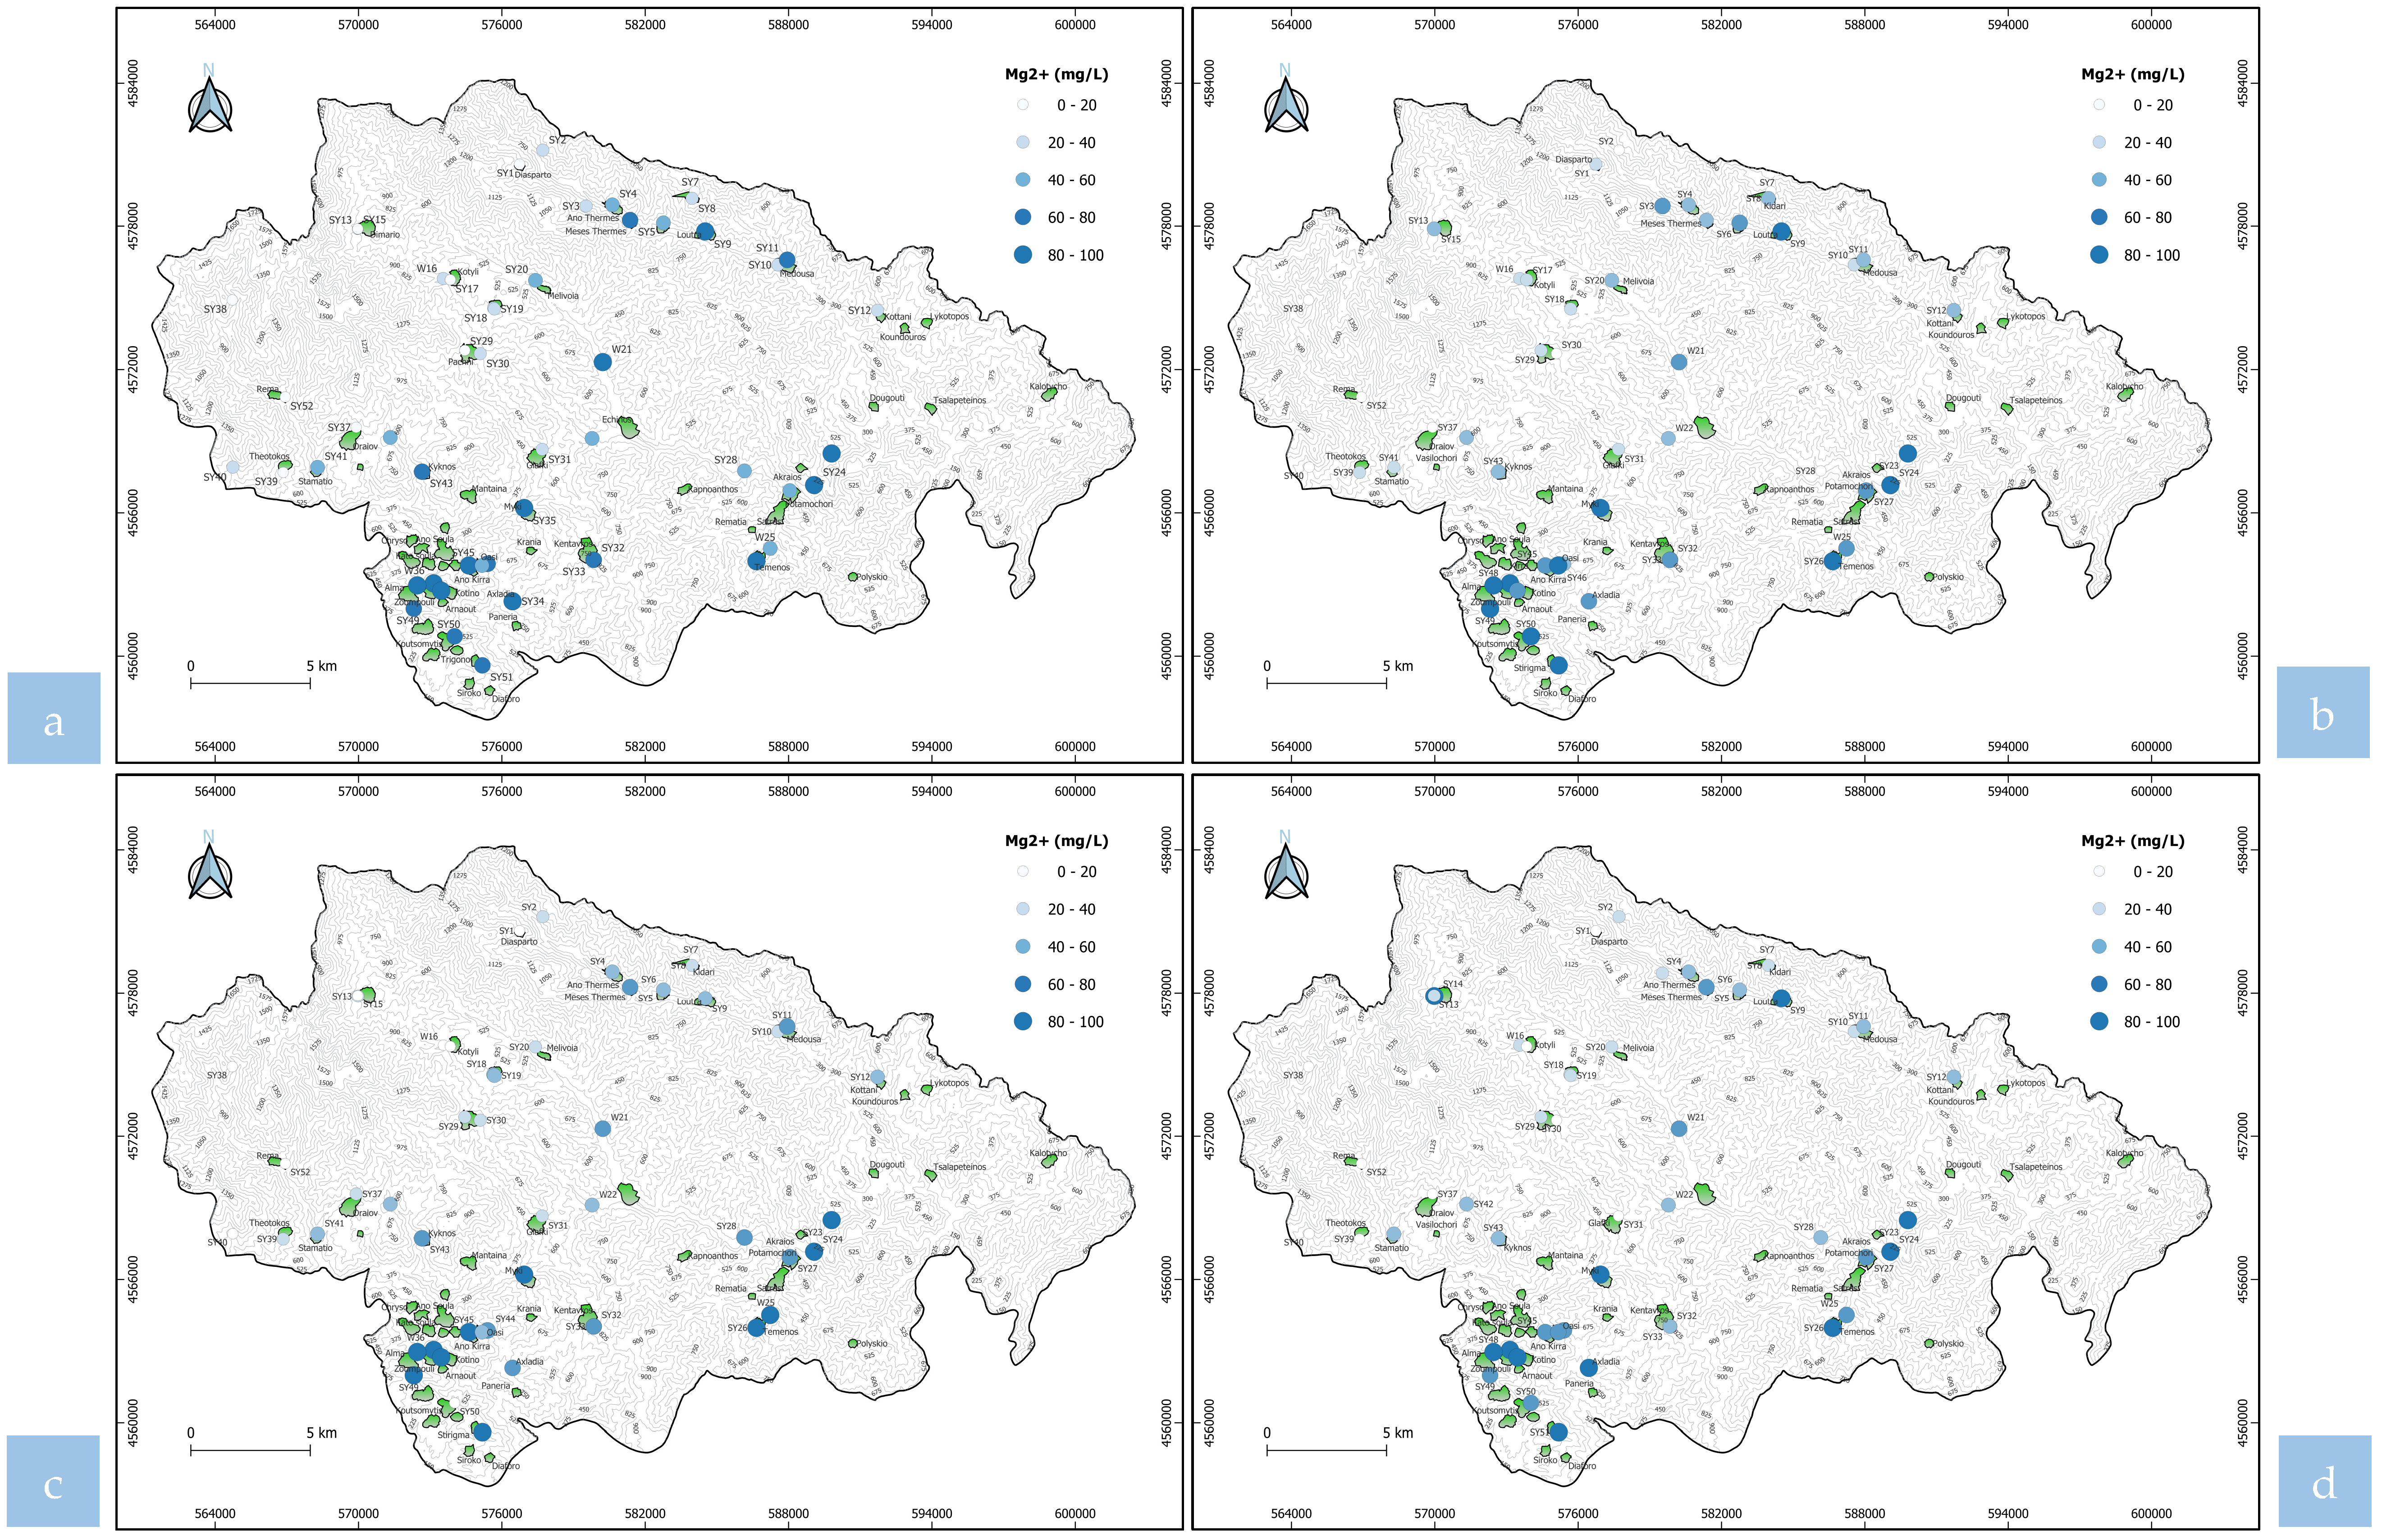
- Values of magnesium ions (Mg2+) concentration are below the maximum allowable threshold of 50 mg/L except for samples from point S24 with values of 53.46 mg/L (October 2021), 60.75 mg/L (October 2022), and 52.81 mg/L (April 2022) (variation of values: 0.00–60.75 mg/L);
- –
- Values of ammonium ions (NH4+) concentration are below the maximum allowable threshold of 0.50 mg/L except for samples from the following points (variation of values: 0.00–0.82 mg/L): S23 with values of 0.52 mg/L (October 2021) and 0.55 mg/L (October 2022); S24 with values of 0.82 mg/L (October 2021), 0.60 mg/L (October 2022), and 0.72 mg/L (April 2023); S27 with a value of 0.58 mg/L (April 2022); W36 with a value of 0.80 mg/L (April 2022); and S37 with a value of 0.53 mg/L (April 2022);
- –
- Values of iron ions (Fe2+) concentration are below the maximum allowable threshold of 0.20 mg/L), except for samples from the following points (variation of values: 0.00–0.60 mg/L): S10 with a value of 0.31 mg/L (October 2021); W21 with a value of 0.28 mg/L (October 2021, April 2022); W22 with a value of 0.22 mg/L (October 2021); S23 with values of 0.26 mg/L (April 2022), 0.60 mg/L (October 2022), and 0.21 mg/L (April 2023); S29 with a value of 0.25 mg/L (October 2021); S30 with a value of 0.40 mg/L (October 2021); S31 with a value of 0.24 mg/L (April 2022); S34 with a value of 0.47 mg/L (October 2021); and S41 with a value of 0.40 mg/L (October 2021);
- –
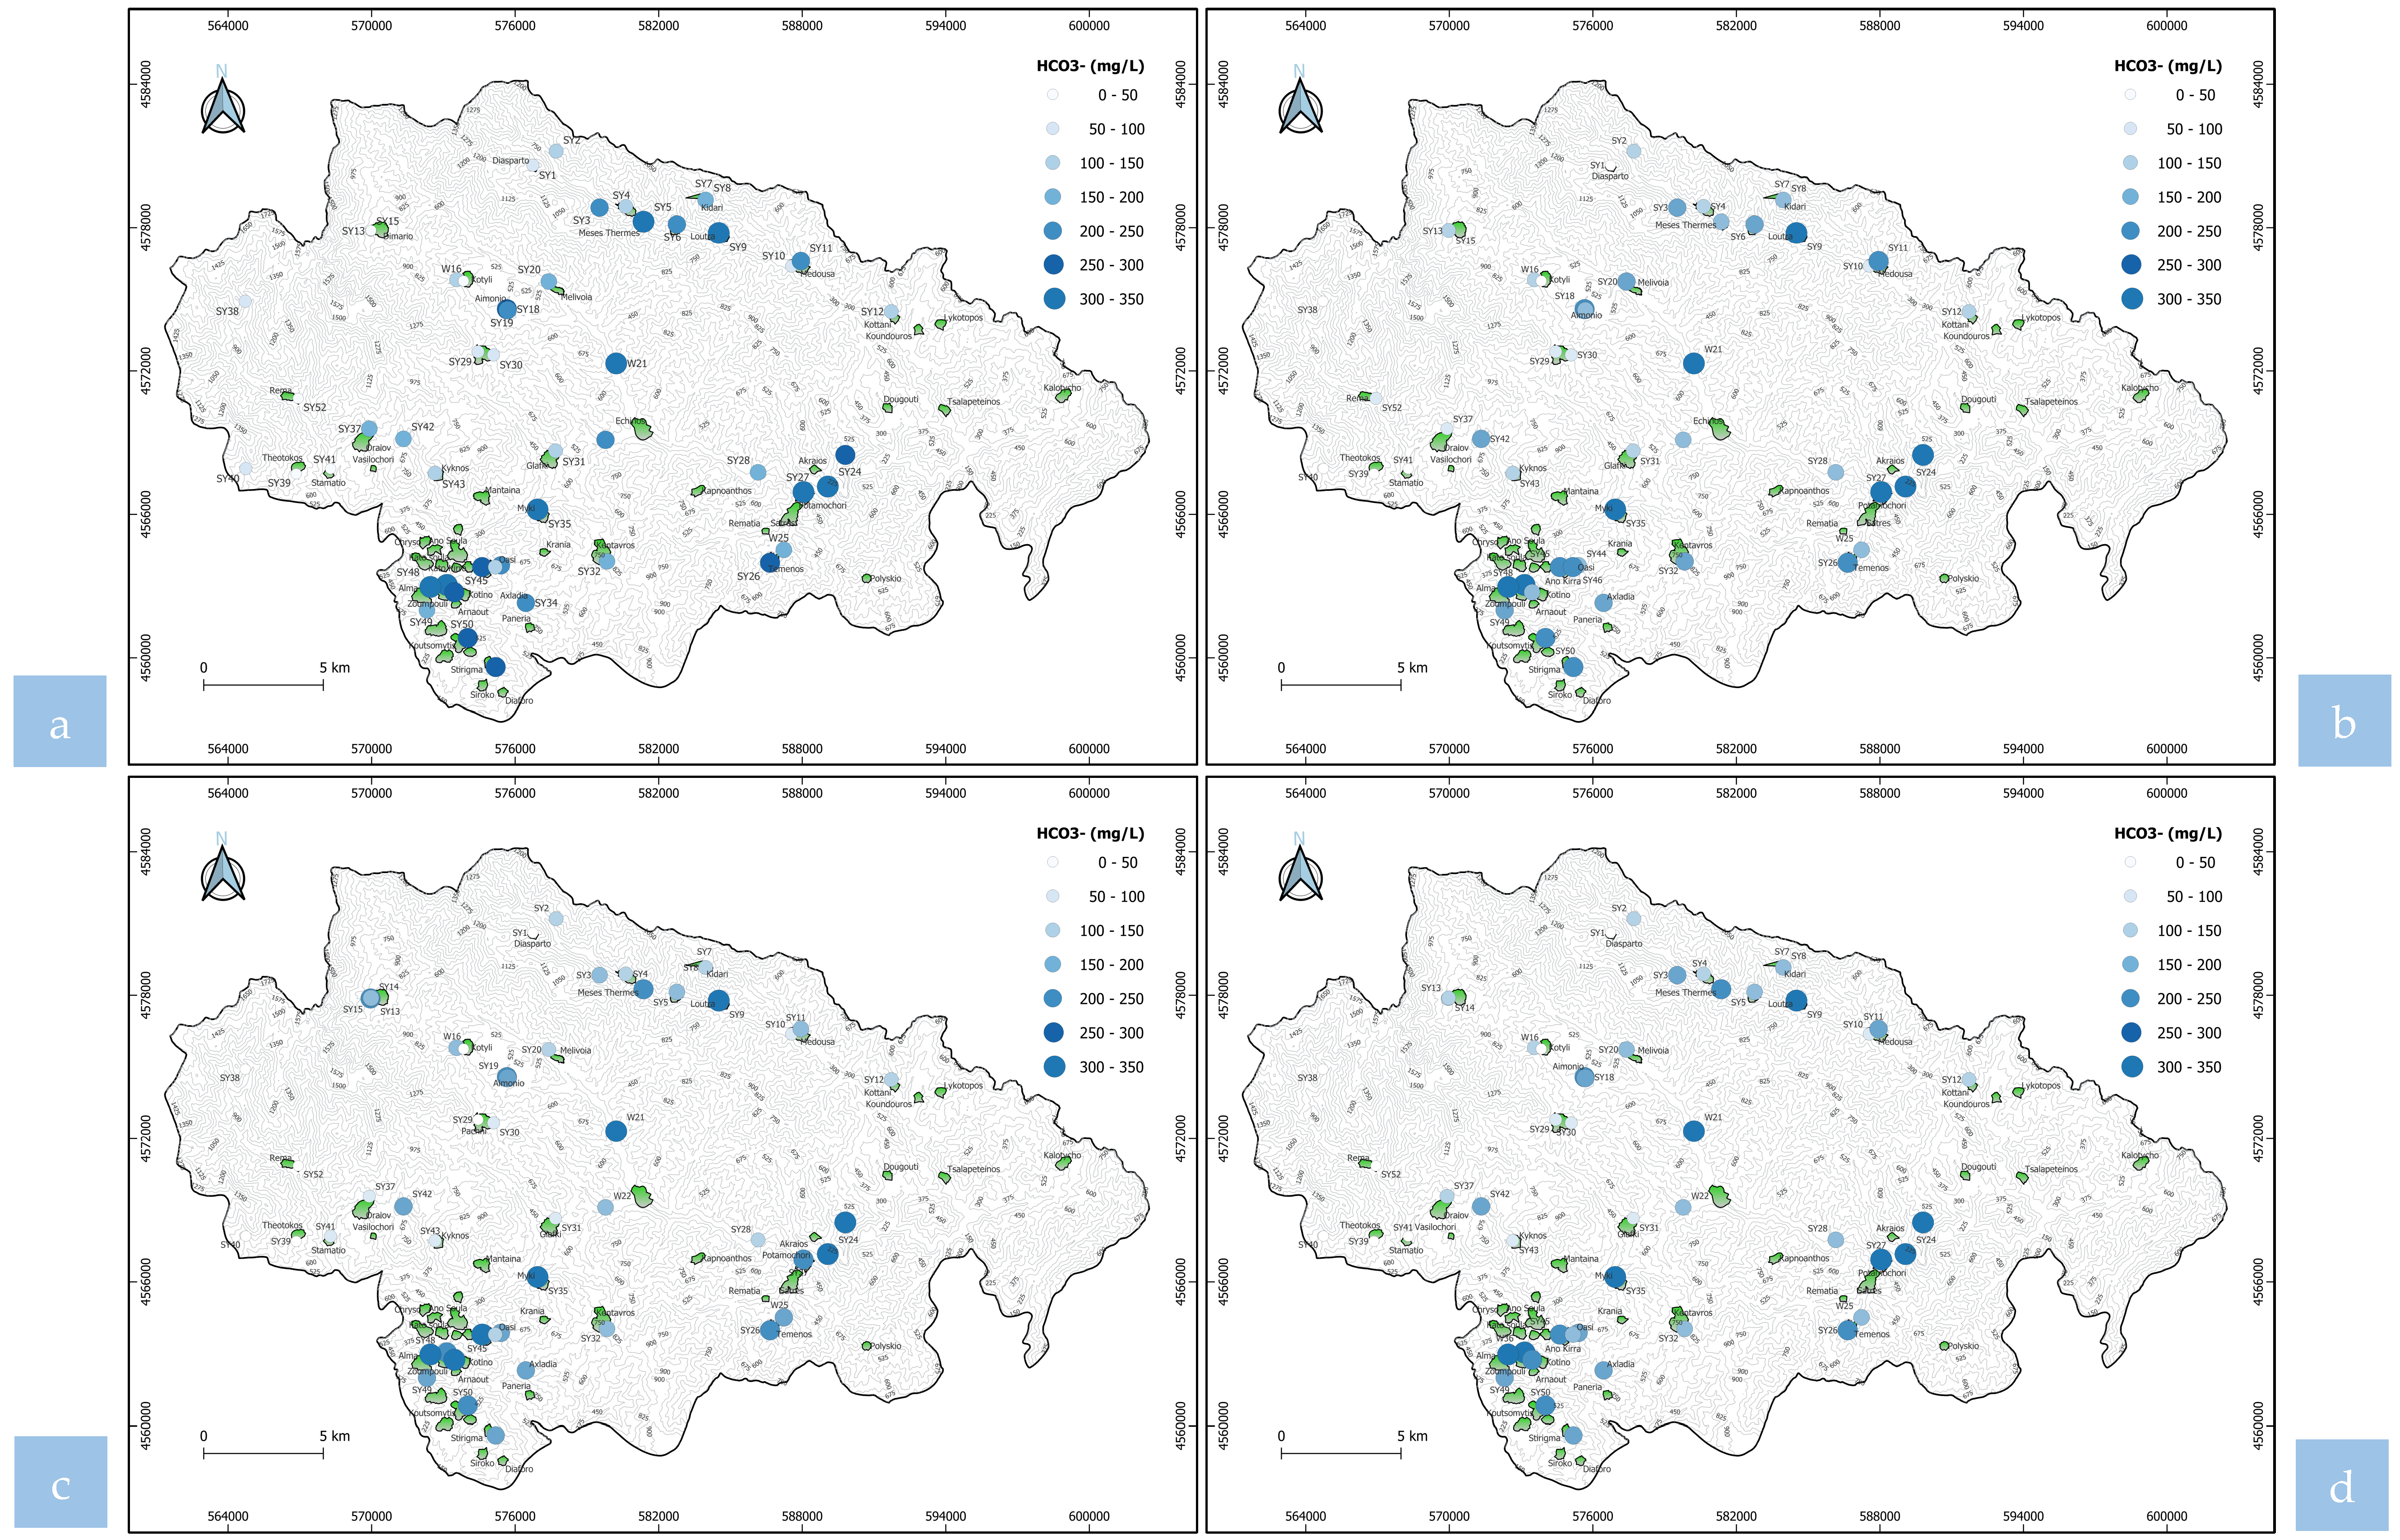
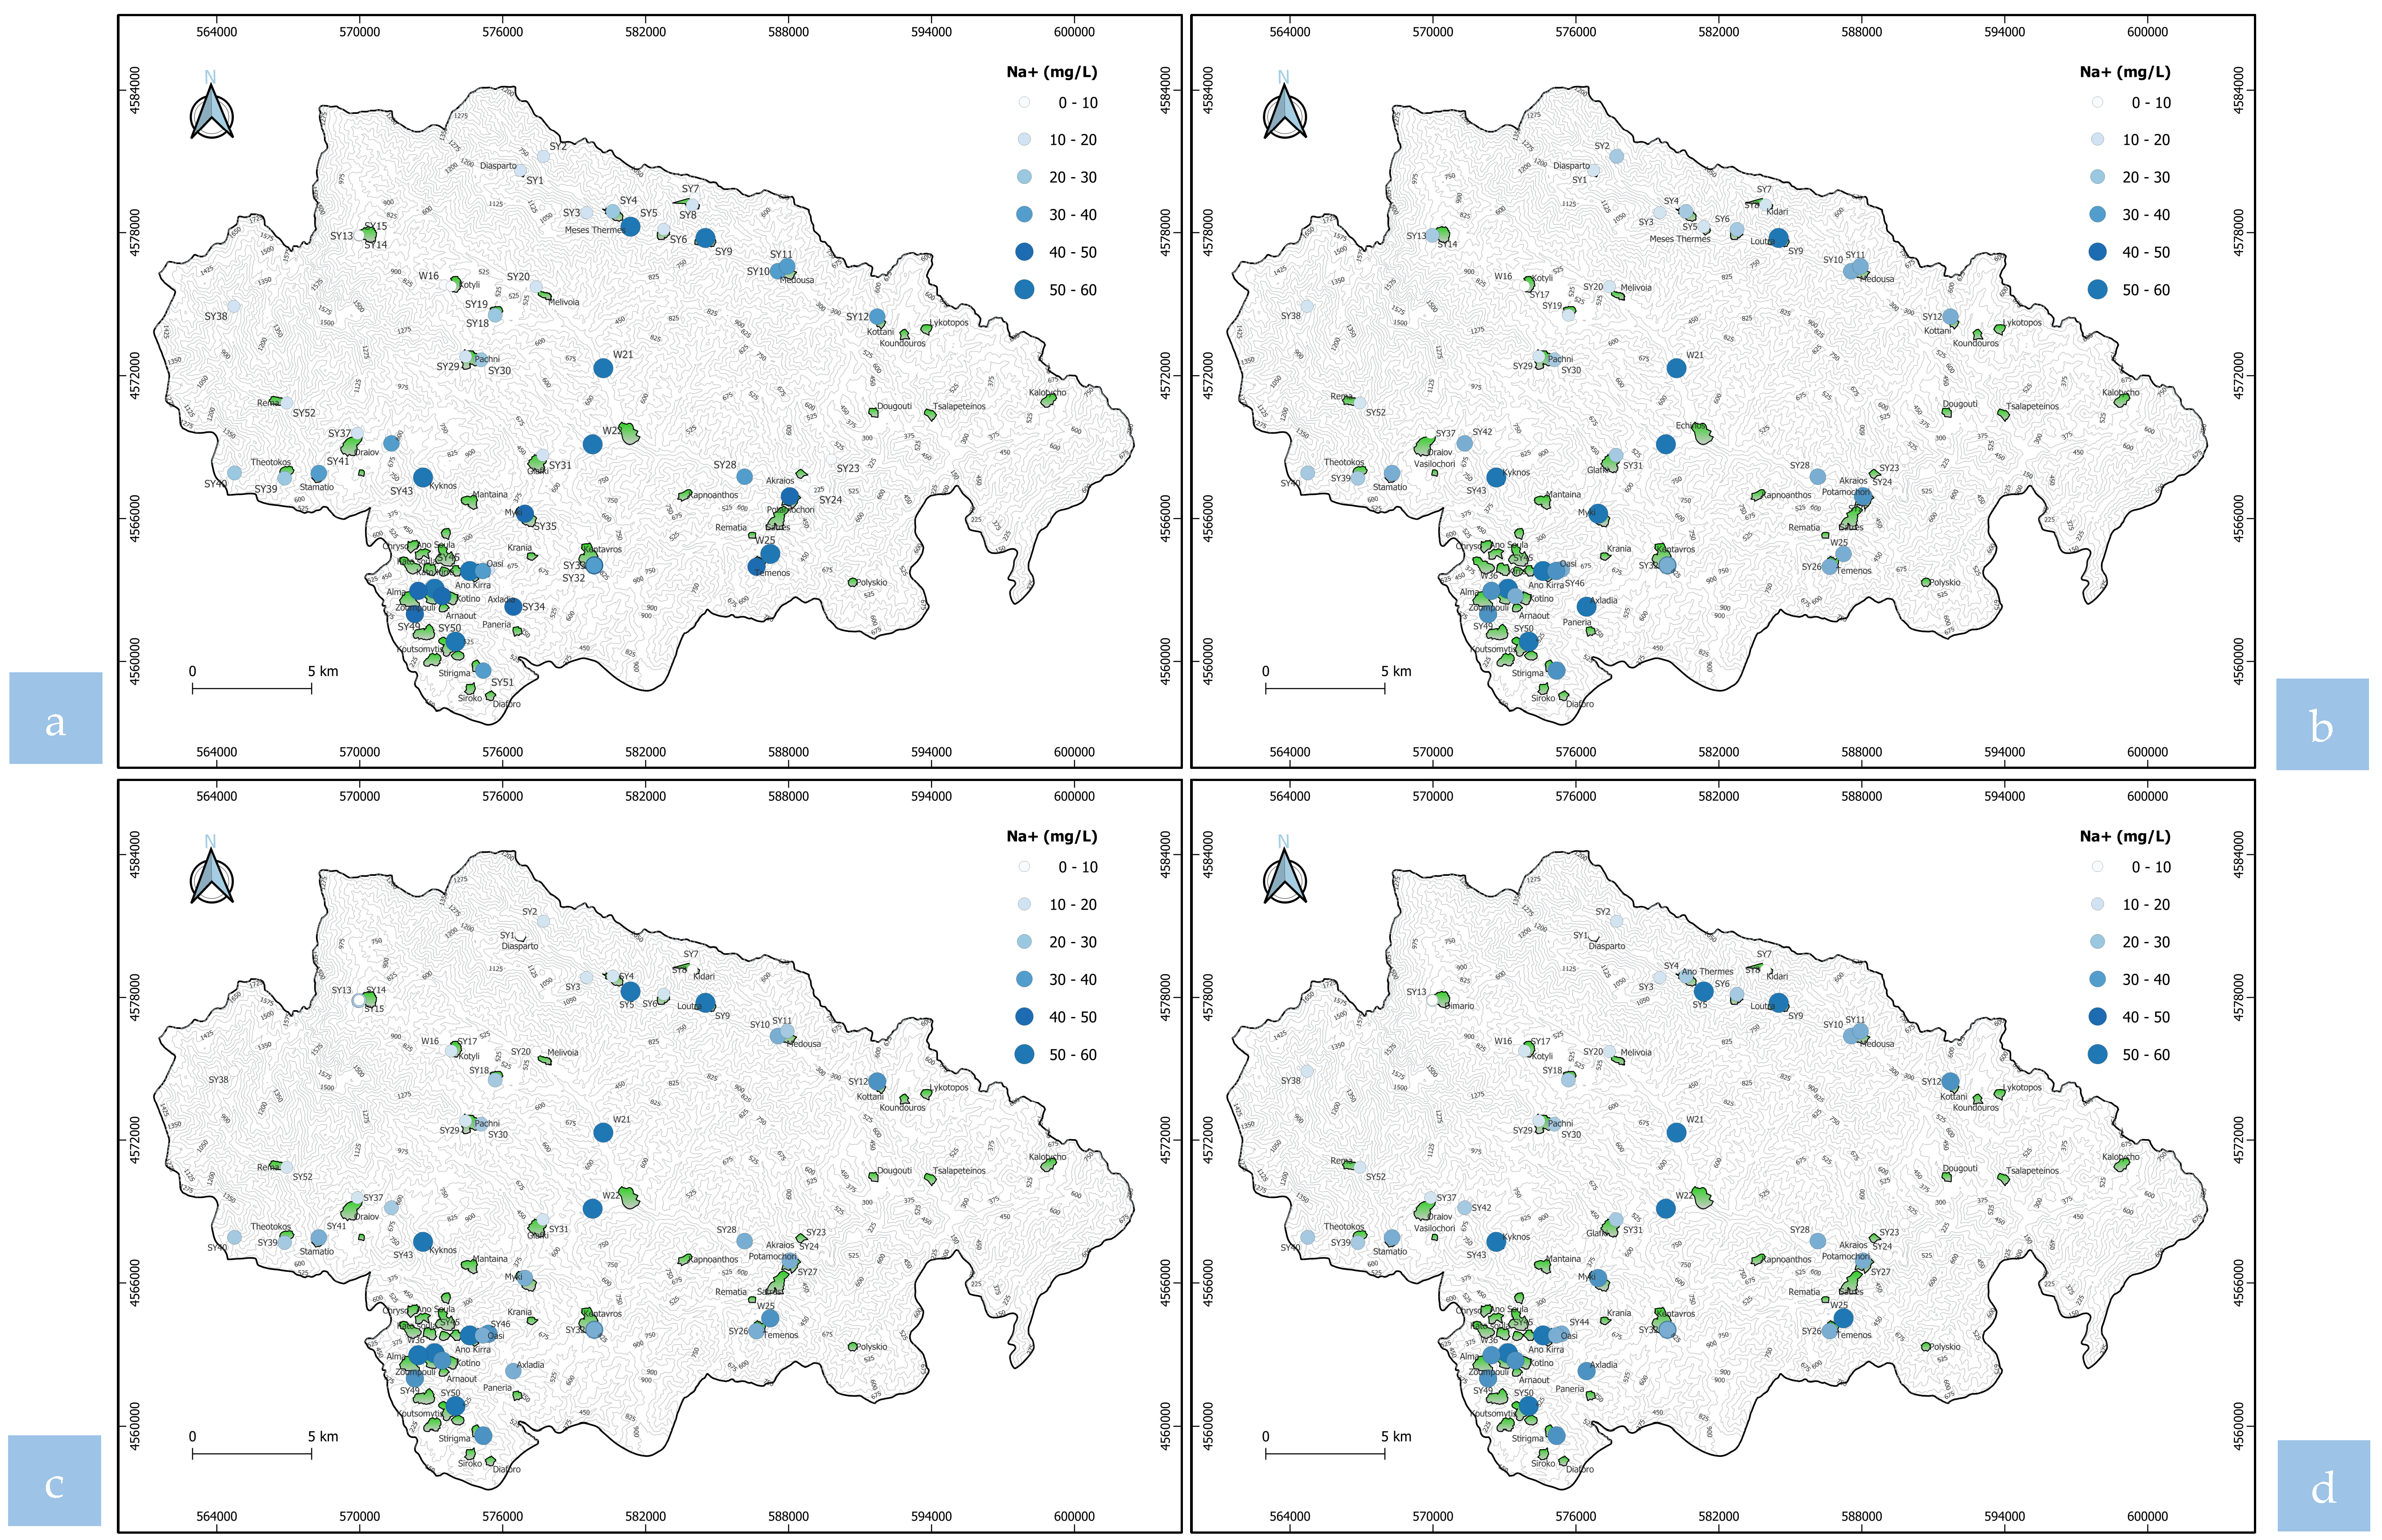
- The quality attributes of the other water samples analyzed fall within the acceptable limits as far as it concerns chloride concentrations ions (Cl−), nitrate ions (NO3−), nitrite ions (NO2−), sodium ions (Na+), potassium ions (K+), bicarbonate ions (HCO3−), and sulfate ions (SO42−) (Table 2).
4. Conclusions
- –
- Construction of projects to protect the narrow spaces of the springs;
- –
- Protection of the water supply system;
- –
- Gathering of separate springs inside a central network of springs;
- –
- Design and construction of new groundwater recovery systems at selected spring locations;
- –
- Inclusion of springs in the existing water supply network after relevant preparation;
- –
- Design and construction of suitable reservoirs as well as drilling wells in selected locations that will reinforce the existing water supply network;
- –
- Serious improvement of the road network to facilitate transport connections between settlements, water points, and relevant infrastructures;
- –
- Provision of measures and implementation of appropriate actions and arrangements to ensure, over time, a minimum environmental flow in parts of the research area, which is possible to achieve.
Author Contributions
Funding
Data Availability Statement
Acknowledgments
Conflicts of Interest
References
- Allen, D.M.; Whitfield, P.H.; Werner, A. Groundwater level responses in temperate mountainous terrain: Regime classification, and linkages to climate and streamflow. Hydrol. Process. 2010, 24, 3392–3412. [Google Scholar] [CrossRef]
- Freeze, R.A.; Witherspoon, P.A. Theoretical analysis of regional groundwater flow. 2. Effect of water-table configuration and subsurface permeability variation. Water Resour. Res. 1967, 3, 623–634. [Google Scholar] [CrossRef]
- Forster, C.; Smith, L. Groundwater flow systems in mountainous terrain 2. Controlling factors. Water Resour. Res. 1988, 24, 1011–1023. [Google Scholar] [CrossRef]
- Constantz, J. Interaction between stream temperature, streamflow, and groundwater exchanges in alpine streams. Water Resour. Res. 1998, 34, 1609–1615. [Google Scholar] [CrossRef]
- Winter, T.C.; Harvey, J.W.; Franke, O.L.; Alley, W.M. Groundwater and Surface Water a Single Resource. USGS Circular 1139. 1998. Available online: http://pubs.usgs.gov/circ/circ1139/ (accessed on 1 February 2025).
- Winter, T.C.; Rosenberry, D.O.; LaBaugh, J.W. Where does the groundwater in small watersheds come from? Groundwater 2003, 41, 989–1000. [Google Scholar] [CrossRef]
- Kimball, B.A.; Stolp, B.J. Detection of ground-water discharge to mountain streams through tracer-injection and synoptic sampling studies. Geol. Soc. Am. Abstr. Programs (GSA) 2004, 36, 538. [Google Scholar]
- Wilson, J.L.; Guan, H. Mountain-block hydrology and mountain-front recharge. In Groundwater Recharge in a Desert Environment: The southwestern United States; Hogan, J.F., Phillips, F.M., Scanlon, B.R., Eds.; Water Science and Application Series; American Geophysical Union: Washington, DC, USA, 2004; Volume 9, pp. 113–137. [Google Scholar] [CrossRef]
- Covino, T.P.; McGlynn, B.L. Stream gains and losses across a mountain-to-valley transition: Impacts on watershed hydrology and stream water chemistry. Water Resour. Res. 2007, 43, W10431. [Google Scholar] [CrossRef]
- Manning, A.H.; Solomon, D.K. Using noble gases to investigate mountain-front recharge. J. Hydrol. 2003, 275, 194–207. [Google Scholar] [CrossRef]
- Manning, A.H.; Solomon, D.K. An integrated environmental tracer approach to characterizing groundwater circulation in a mountain block. Water Resour. Res. 2005, 41, W12412. [Google Scholar] [CrossRef]
- Poeter, E.; Fan, Y.; Cherry, J.; Wood, W.; Mackay, D. Groundwater in Our Water Cycle—Getting to Know Earth’s Most Important Fresh Water Source; The Groundwater Project: Guelph, ON, Canada, 2020. [Google Scholar] [CrossRef]
- Betterle, A.; Bellin, A. Morphological and hydrogeological controls of groundwater flows and water age distribution in mountain aquifers and streams. Water Resour. Res. 2024, 60, e2024WR037407. [Google Scholar] [CrossRef]
- Silar, J. Surface water and groundwater interactions in mountainous areas. In Hydrology of Mountainous Areas (Proceedings of the Strbské Pleso Workshop, Czechoslovakia, June 1988); No. 190; IAHS Publication: Wallingford, UK, 1990; pp. 21–28. [Google Scholar]
- Chen, Z.; Lucianetti, G.; Hartmann, A. Understanding groundwater storage and drainage dynamics of a high mountain catchment with complex geology using a semi-distributed process-based modelling approach. J. Hydrol. 2023, 625, 130067. [Google Scholar] [CrossRef]
- Meybeck, M.; Green, P.; Vörösmarty, C. A New Typology for Mountains and Other Relief Classes: An Application to Global Continental Water Resources and Population Distribution. Mt. Res. Dev. 2001, 21, 34–45. [Google Scholar] [CrossRef]
- Aishlin, P.; McNamara, J.P. Bedrock infiltration and mountain block recharge accounting using chloride mass balance. Hydrol. Process. 2011, 25, 1934–1948. [Google Scholar] [CrossRef]
- Flerchinger, G.N.; Deng, Y.; Cooley, K.R. Groundwater response to snowmelt in a mountainous watershed: Testing of a conceptual model. J. Hydrol. 1993, 152, 201–214. [Google Scholar] [CrossRef]
- Katsuyama, M.; Ohte, N.; Kabeya, N. Effects of bedrock permeability on hillslope and riparian groundwater dynamics in a weathered granite catchment. Water Resour. Res. 2005, 41, W01010. [Google Scholar] [CrossRef]
- Marti, E.; Leray, S.; Villela, D.; Maringue, J.; Yáñez, G.; Salazar, E.; Poblete, F.; Jimenez, J.; Reyes, G.; Poblete, G.; et al. Unravelling geological controls on groundwater flow and surface water-groundwater interaction in mountain systems: A multi-disciplinary approach. J. Hydrol. 2023, 623, 129786. [Google Scholar] [CrossRef]
- Bishop, K.; Buffam, I.; Erlandsson, M.; Folster, J.; Laudon, H.; Seibert, J.; Temnerud, J. Aqua Incognita: The unknown headwaters. Hydrol. Process. 2008, 22, 1239–1242. [Google Scholar] [CrossRef]
- Condon, L.E.; Maxwell, R.M. Evaluating the relationship between topography and groundwater using outputs from a continental-scale integrated hydrology model. Water Resour. Res. 2015, 51, 6602–6621. [Google Scholar] [CrossRef]
- Gleeson, T.; Manning, A.H. Regional groundwater flow in mountainous terrain: Three-dimensional simulations of topographic and hydrogeologic controls. Water Resour. Res. 2008, 44, W10403. [Google Scholar] [CrossRef]
- Winter, T.C. The concept of hydrological landscapes. J. Am. Water Resour. Assoc. 2001, 37, 335–349. [Google Scholar] [CrossRef]
- Espinha Marques, J.; Duarte, L.; Queirós, M.; Melo, A.; Mansilha, C. Water supply to a mountain village (Drave, North Portugal): Historical overview, current scenario, and future perspectives. Environ. Earth Sci. 2023, 82, 90. [Google Scholar] [CrossRef]
- Kanji, N.; Sherbut, G.; Fararoon, R.; Hatcher, J. Improving Quality of Life in Remote Mountain Communities. Mt. Res. Dev. 2012, 32, 353–363. [Google Scholar] [CrossRef]
- Komatsu, S.; Yamamoto, Y.; Ito, Y.; Kaneko, S.; Dhital, R.P. Water for life: Ceaseless routine efforts for collecting drinking water in remote mountainous villages of Nepal. Environ. Dev. Sustain. 2020, 22, 7909–7925. [Google Scholar] [CrossRef]
- Kim, B.R.; Lee, S.-I.; Yu, S.M. Conjunctive operation of sand dam and groundwater well for reliable water supply during drought conditions. Water 2022, 14, 2249. [Google Scholar] [CrossRef]
- Cook, P.G. A Guide to Regional Groundwater Flow in Fractured Rock Aquifers; CSIRO: Canberra, Australia, 2003; ISBN 9781740082334. [Google Scholar]
- Diamantis, I.; Bellos, K.; Kallioras, A.; Diamantis, V. Investigation—Improvement of Water Supply Conditions of Myki Municipality; Technical Report to the East Macedonia and Thrace Region; Department of Civil Engineering, Democritus University of Thrace: Xanthi, Greece, 2003; p. 164. (In Greek) [Google Scholar]
- Empliouk, I.; Pliakas, F.; Kallioras, A.; Kaliampakos, D.; Tzevelekis, T. Research for the conceptual model development of a mountainous aquifer system in NE Greece. A first approach. In Proceedings of the 12th International Hydrogeological Conference, Nicosia, Cyprus, 20–22 March 2022; pp. 52–56. [Google Scholar]
- Empliouk, I.; Pliakas, F.-K.; Kallioras, A.; Kaliampakos, D.; Tzevelekis, T. Groundwater resources evaluation in a mountainous aquifer system in NE Greece. In Proceedings of the 12th World Congress on Water Resources and Environment (EWRA 2023) “Managing Water-Energy-Land-Food under Climatic, Environmental and Social Instability”, Thessaloniki, Greece, 27 June–1 July 2023; pp. 287–288. [Google Scholar]
- Empliouk, I.; Pliakas, F.-K.; Kallioras, A.; Kaliampakos, D.; Tzevelekis, T. Hydrogeological research on water supply conditions in a mountainous region of NE Greece. In Proceedings of the 18th International Conference on Environmental Science and Technology (CEST 2023)., Athens, Greece, 30 August–2 September 2023; Paper ID: cest2023_00132. Available online: https://cms.gnest.org/cest2023/p/cest202300132 (accessed on 1 February 2025).
- Dimadis, E.; Zachos, S. Geological map of Rhodope massif, 1986, scale: 1:200,000. Personal communication, unpublished work.
- Chebotarev, I.Ι. Metamorphism of natural waters in the crust of weathering. Geochim. Cosmochim. Acta 1955, 8, 137–170. [Google Scholar] [CrossRef]
- Zuecco, G.; Rinderer, M.; Penna, D.; Borga, M.; van Meerveld, H.J. Quantification of subsurface hydrologic connectivity in four headwater catchments using graph theory. Sci. Total Environ. 2019, 646, 1265–1280. [Google Scholar] [CrossRef]
- Schiavo, M. Quantile-Based Approach for Improving the Identification of Preferential Groundwater Networks. Water 2025, 17, 282. [Google Scholar] [CrossRef]
- Schiavo, M.; Riva, M.; Guadagnini, L.; Zehe, E.; Guadagnini, A. Probabilistic identification of Preferential Groundwater Networks. J. Hydrol. 2022, 610, 127906. [Google Scholar] [CrossRef]
- Piper, A.M. A Graphic Procedure in the Geochemical Interpretation of Water Analyses. Eos Trans. Am. Geophys. Union 1944, 25, 914–923. [Google Scholar] [CrossRef]


| Discharge (m3/h) | EC (μS/cm) | Temperature (°C) | pH | |
|---|---|---|---|---|
| October 2021 | ||||
| min | 0.16 | 71.40 | 12.20 | 6.02 |
| max | 30.00 | 627.00 | 18.30 | 8.27 |
| mean | 6.03 | 299.22 | 14.40 | 7.24 |
| SD | 7.59 | 163.18 | 1.24 | 0.41 |
| April 2022 | ||||
| min | 0.48 | 78.70 | 9.00 | 6.56 |
| max | 50.40 | 598.00 | 18.80 | 8.59 |
| mean | 7.69 | 270.03 | 12.39 | 7.48 |
| SD | 9.54 | 154.25 | 1.78 | 0.43 |
| October 2022 | ||||
| min | 0.20 | 90.00 | 12.10 | 6.35 |
| max | 30.00 | 618.00 | 16.50 | 8.44 |
| mean | 4.73 | 340.69 | 13.80 | 7.37 |
| SD | 6.50 | 151.62 | 0.99 | 0.42 |
| April 2023 | ||||
| min | 0.42 | 73.20 | 11.90 | 6.59 |
| max | 43.29 | 614.30 | 16.90 | 8.22 |
| mean | 7.13 | 300.39 | 13.53 | 7.36 |
| SD | 8.71 | 149.07 | 1.01 | 0.36 |
| Ca2+ | Mg2+ | SO42− | HCO3− | NO3− | Cl− | EC | pH | Temp. | Na+ | Fe2+ | K+ | NH4+ | |
|---|---|---|---|---|---|---|---|---|---|---|---|---|---|
| (mg/L) | (μS/cm) | (°C) | (mg/L) | ||||||||||
| October 2021 | |||||||||||||
| min | 4.41 | 0.24 | 1.00 | 7.32 | 0.00 | 0.00 | 71.40 | 6.02 | 12.20 | 3.02 | 0.00 | 0.00 | 0.00 |
| max | 83.37 | 53.46 | 90.00 | 336.72 | 41.80 | 16.67 | 627.00 | 8.43 | 18.30 | 91.00 | 0.47 | 8.00 | 0.82 |
| mean | 36.66 | 9.33 | 21.00 | 144.04 | 4.35 | 4.67 | 299.22 | 7.11 | 14.40 | 12.97 | 0.07 | 1.84 | 0.19 |
| SD | 22.79 | 8.91 | 17.31 | 95.97 | 8.24 | 4.42 | 163.18 | 0.59 | 1.24 | 15.95 | 0.12 | 1.58 | 0.17 |
| CV | 0.62 | 0.95 | 0.82 | 0.67 | 1.89 | 0.95 | 0.55 | 0.08 | 0.09 | 1.23 | 1.71 | 0.86 | 0.89 |
| April 2022 | |||||||||||||
| min | 0.32 | 0.00 | 1.00 | 0.98 | 0.00 | 0.00 | 78.70 | 5.53 | 9.00 | 3.34 | 0.00 | 0.27 | 0.00 |
| max | 73.75 | 44.47 | 60.00 | 301.34 | 21.10 | 21.28 | 598.00 | 8.20 | 18.80 | 40.00 | 0.28 | 8.00 | 0.80 |
| mean | 30.84 | 8.78 | 16.67 | 121.60 | 2.84 | 4.79 | 270.03 | 7.08 | 12.39 | 9.93 | 0.05 | 1.70 | 0.18 |
| SD | 19.96 | 10.85 | 13.47 | 86.37 | 4.28 | 5.49 | 154.25 | 0.51 | 1.78 | 8.07 | 0.07 | 1.56 | 0.21 |
| CV | 0.65 | 1.24 | 0.81 | 0.71 | 1.51 | 1.15 | 0.57 | 0.07 | 0.14 | 0.81 | 1.40 | 0.92 | 1.17 |
| October 2022 | |||||||||||||
| min | 4.81 | 0.00 | 0.00 | 6.10 | 0.00 | 0.00 | 90.00 | 6.35 | 12.10 | 3.24 | 0.00 | 0.25 | 0.00 |
| max | 87.37 | 60.75 | 61.00 | 326.96 | 39.30 | 35.46 | 618.00 | 8.44 | 16.50 | 56.25 | 0.60 | 9.10 | 0.75 |
| mean | 43.67 | 8.28 | 19.75 | 163.69 | 3.43 | 5.61 | 333.02 | 7.37 | 13.80 | 11.11 | 0.04 | 1.74 | 0.11 |
| SD | 24.46 | 10.77 | 15.64 | 92.27 | 6.38 | 5.69 | 153.54 | 0.42 | 0.99 | 9.73 | 0.08 | 1.77 | 0.12 |
| CV | 0.56 | 1.30 | 0.79 | 0.56 | 1.86 | 1.01 | 0.46 | 0.06 | 0.07 | 0.88 | 2.00 | 1.02 | 1.09 |
| April 2023 | |||||||||||||
| min | 3.31 | 0.49 | 0.67 | 4.80 | 0.00 | 0.35 | 84.47 | 5.96 | 11.90 | 3.20 | 0.00 | 0.17 | 0.01 |
| max | 73.21 | 52.81 | 60.33 | 306.63 | 34.07 | 18.56 | 614.33 | 8.14 | 16.90 | 46.53 | 0.21 | 5.78 | 0.72 |
| mean | 37.06 | 8.80 | 19.14 | 143.11 | 3.54 | 5.03 | 300.76 | 7.17 | 13.53 | 11.33 | 0.05 | 1.76 | 0.16 |
| SD | 20.50 | 9.35 | 13.31 | 87.27 | 5.82 | 4.24 | 148.54 | 0.47 | 1.01 | 9.81 | 0.05 | 1.37 | 0.14 |
| CV | 0.55 | 1.06 | 0.70 | 0.61 | 1.64 | 0.84 | 0.49 | 0.07 | 0.07 | 0.87 | 1.00 | 0.78 | 0.88 |
| October 2021 | April 2022 | ||||
|---|---|---|---|---|---|
| Settlement | Springs (S) and Wells (W) | Discharge (L/d/Resident) | Total Discharge per Settlement (L/Capita/Day) | Discharge (L/d/Resident) | Total Discharge per Settlement (L/Capita/Day) |
| Diasparto | S1 | 381.43 | +350.00 | 683.57 | +748.57 |
| Diasparto | S2 | 107.14 | 192.86 | ||
| Diasparto | S3 | 111.43 | 122.14 | ||
| Ano Thermes | S4 | 474.95 | +224.95 | 919.63 | +669.63 |
| Meses Thermes | S5 | 2582.17 | +2332.17 | 2530.12 | +2280.12 |
| Kato Thermes | S6 | 1349.22 | +1099.22 | 1432.54 | +1182.54 |
| Kidari | S7 | 288.98 | +788.37 | 1665.31 | +3521.43 |
| Kidari | S8 | 749.39 | 2106.12 | ||
| Loutra | S9 | 46,320.00 | +46,070.00 | 92,640.00 | +92,390.00 |
| Medousa | S10 | 325.66 | +145.11 | 565.66 | +578.04 |
| Medousa | S11 | 69.45 | 262.38 | ||
| Kottani | S12 | 89.30 | −160.70 | 396.28 | +146.28 |
| Dimario | S13 | 463.29 | +1475.57 | 546.84 | +2448.86 |
| Dimario | S14 | 1103.54 | 1913.92 | ||
| Dimario | S15 | 158.73 | 238.10 | ||
| Kotyli | W16 | 936.84 | +1523.16 | 936.84 | +1588.95 |
| Kotyli | S17 | 836.32 | 902.11 | ||
| Aimonio | S18 | 312.00 | +167.60 | 1032.00 | +908.40 |
| Aimonio | S19 | 105.60 | 126.40 | ||
| Melivia | S20 | 500.00 | +250.00 | 763.27 | +513.27 |
| Echinos | W21 | 162.09 | +74.18 | 162.09 | +74.18 |
| Echinos | W22 | 162.09 | 162.09 | ||
| Giannochori | S23 | 1015.38 | +765.38 | 1661.54 | +1411.54 |
| Kalotycho | S24 | 384.00 | +134.00 | 640.00 | +390.00 |
| Temenos | W25 | 995.85 | +840.46 | 995.85 | +894.23 |
| Temenos | S26 | 94.61 | 148.38 | ||
| Satres | S27 | 28.80 | −145.20 | 129.60 | −32.40 |
| Satres | S28 | 76.00 | 88.00 | ||
| Pachni | S29 | 232.31 | +154.90 | 364.50 | +242.96 |
| Pachni | S30 | 172.59 | 128.45 | ||
| Glafki | S31 | 168.06 | −81.94 | 365.79 | +115.79 |
| Kentavros | S32 | 3.94 | −220.53 | 6.23 | −232.36 |
| Kentavros | S33 | 25.53 | 11.41 | ||
| Achladia | S34 | 8208.00 | 7958.00 | 12,336.00 | +12,086.00 |
| Myki | S35 | 103.67 | −146.33 | 289.32 | +39.32 |
| Sminthi | W36 | 1983.47 | +1733.47 | 1983.47 | +1733.47 |
| Theotokos | S39 | 2632.26 | +2986.13 | 22,141.94 | +28,472.58 |
| Theotokos | S40 | 603.87 | 6580.65 | ||
| Oraion | S37 | 735.38 | +545.21 | 174.48 | −18.02 |
| Oraion | S41 | 18.38 | 31.09 | ||
| Oraion | S42 | 41.45 | 26.41 | ||
| Kyknos | S43 | 118.55 | −131.45 | 118.55 | −131.45 |
| Oasi | S44 | 119.07 | −130.93 | 323.72 | +73.72 |
| Kirra | S45 | 967.06 | +717.06 | 1327.06 | +1077.06 |
| Kotino | S46 | 100.84 | −36.22 | 629.24 | +548.66 |
| Kotino | S47 | 112.94 | 169.41 | ||
| Chysosminthi | S48 | 118.94 | −131.06 | 273.98 | +23.98 |
| Alma | S49 | 66.62 | −183.38 | 84.79 | −165.21 |
| Trigono | S50 | 286.03 | +36.03 | 302.47 | +52.47 |
| Siroko | S51 | 62.70 | −187.30 | 214.05 | −35.95 |
| Rema | S38 | 2105.90 | +4353.01 | 66.59 | +926.42 |
| Rema | S52 | 2497.11 | 1109.83 | ||
| October 2022 | April 2023 | ||||
|---|---|---|---|---|---|
| Settlement | Springs (S) and Wells (W) | Discharge (L/d/Resident) | Total Discharge per Settlement (L/Capita/Day) | Discharge (L/d/Resident) | Total Discharge per Settlement (L/Capita/Day) |
| Diasparto | S1 | 323.57 | +296.43 | 582.86 | +615.71 |
| Diasparto | S2 | 117.86 | 164.29 | ||
| Diasparto | S3 | 105.00 | 118.57 | ||
| Ano Thermes | S4 | 780.56 | +530.56 | 771.40 | +521.40 |
| Meses Thermes | S5 | 462.65 | +212.65 | 2547.47 | +2297.47 |
| Kato Thermes | S6 | 691.40 | +441.40 | 1404.77 | +1154.77 |
| Kidari | S7 | 97.96 | +514.08 | 1206.53 | +2610.41 |
| Kidari | S8 | 666.12 | 1653.88 | ||
| Loutra | S9 | 46,320.00 | +46,070.00 | 77,200.00 | +76,950.00 |
| Medousa | S10 | 283.22 | +164.41 | 485.66 | +433.73 |
| Medousa | S11 | 131.19 | 198.07 | ||
| Kottani | S12 | 128.37 | −122.00 | 293.95 | +43.95 |
| Dimario | S13 | 455.70 | +1206.71 | 518.99 | +2124.43 |
| Dimario | S14 | 773.16 | 1643.80 | ||
| Dimario | S15 | 227.85 | 211.65 | ||
| Kotyli | W16 | 936.84 | +928.95 | 936.84 | +1567.02 |
| Kotyli | S17 | 242.11 | 880.18 | ||
| Aimonio | S18 | 721.60 | +503.60 | 792.00 | +661.47 |
| Aimonio | S19 | 32.00 | 119.47 | ||
| Melivia | S20 | 454.29 | +204.29 | 675.51 | +425.51 |
| Echinos | W21 | 162.09 | +74.18 | 162.09 | +74.18 |
| Echinos | W22 | 162.09 | 162.09 | ||
| Giannochori | S23 | 516.92 | +266.92 | 1446.15 | +1196.15 |
| Kalotycho | S24 | 360.00 | +110.00 | 554.67 | +304.67 |
| Temenos | W25 | 995.85 | +820.54 | 995.85 | +876.31 |
| Temenos | S26 | 74.69 | 130.46 | ||
| Satres | S27 | 35.20 | −176.40 | 96.00 | −70.00 |
| Satres | S28 | 38.40 | 84.00 | ||
| Pachni | S29 | 294.24 | +103.52 | 320.44 | +213.60 |
| Pachni | S30 | 59.29 | 143.17 | ||
| Glafki | S31 | 175.78 | −74.22 | 299.88 | +49.88 |
| Kentavros | S32 | 4.25 | −237.13 | 5.46 | −228.42 |
| Kentavros | S33 | 8.61 | 16.12 | ||
| Achladia | S34 | 4128.00 | +3878.00 | 10,960.00 | +10,710.00 |
| Myki | S35 | 97.32 | −152.68 | 227.43 | −22.57 |
| Sminthi | W36 | 1983.47 | +1733.47 | 1983.47 | +1733.47 |
| Theotokos | S39 | 101,41.94 | +15,977.10 | 20,438.71 | +28,493.23 |
| Theotokos | S40 | 6085.16 | 8304.52 | ||
| Oraion | S37 | 21.73 | −199.86 | 154.21 | −42.65 |
| Oraion | S41 | 15.71 | 29.42 | ||
| Oraion | S42 | 12.70 | 23.73 | ||
| Kyknos | S43 | 109.88 | −140.12 | 118.88 | −131.12 |
| Oasi | S44 | 163.72 | −86.28 | 292.09 | +42.09 |
| Kirra | S45 | 515.29 | +265.29 | 1035.29 | +785.29 |
| Kotino | S46 | 231.93 | +66.64 | 511.60 | +408.15 |
| Kotino | S47 | 84.71 | 146.55 | ||
| Chysosminthi | S48 | 127.43 | −122.57 | 222.30 | −27.70 |
| Alma | S49 | 39.37 | −210.63 | 70.66 | −179.34 |
| Trigono | S50 | 164.38 | −85.62 | 298.08 | +48.08 |
| Siroko | S51 | 64.86 | −185.14 | 205.41 | −44.59 |
| Rema | S38 | 31.91 | +44.10 | 57.80 | +1380.06 |
| Rema | S52 | 262.20 | 1572.25 | ||
Disclaimer/Publisher’s Note: The statements, opinions and data contained in all publications are solely those of the individual author(s) and contributor(s) and not of MDPI and/or the editor(s). MDPI and/or the editor(s) disclaim responsibility for any injury to people or property resulting from any ideas, methods, instructions or products referred to in the content. |
© 2025 by the authors. Licensee MDPI, Basel, Switzerland. This article is an open access article distributed under the terms and conditions of the Creative Commons Attribution (CC BY) license (https://creativecommons.org/licenses/by/4.0/).
Share and Cite
Empliouk, I.; Gkiougkis, I.; Adamidis, A.; Siarkos, I.; Kallioras, A.; Kaliampakos, D.; Pliakas, F.-K. Groundwater Quantity and Quality Management in a Mountainous Aquifer System in NE Greece. Water 2025, 17, 1292. https://doi.org/10.3390/w17091292
Empliouk I, Gkiougkis I, Adamidis A, Siarkos I, Kallioras A, Kaliampakos D, Pliakas F-K. Groundwater Quantity and Quality Management in a Mountainous Aquifer System in NE Greece. Water. 2025; 17(9):1292. https://doi.org/10.3390/w17091292
Chicago/Turabian StyleEmpliouk, Ismail, Ioannis Gkiougkis, Adam Adamidis, Ilias Siarkos, Andreas Kallioras, Dimitrios Kaliampakos, and Fotios-Konstantinos Pliakas. 2025. "Groundwater Quantity and Quality Management in a Mountainous Aquifer System in NE Greece" Water 17, no. 9: 1292. https://doi.org/10.3390/w17091292
APA StyleEmpliouk, I., Gkiougkis, I., Adamidis, A., Siarkos, I., Kallioras, A., Kaliampakos, D., & Pliakas, F.-K. (2025). Groundwater Quantity and Quality Management in a Mountainous Aquifer System in NE Greece. Water, 17(9), 1292. https://doi.org/10.3390/w17091292