Article

Determination of Temporary Hubs Locations Along a River in Case of Flood

1
Department of Industrial Engineering, Near East University, Via Mersin 10, Nicosia 99138, Northern Cyprus, Turkey
2
Department for Methodology of Applied Economics Sciences, Edutus University, 2800 Tatabánya, Hungary
3
Institute of Agriculture and Food Economics, Hungarian University of Agriculture and Life Sciences, Páter Károly Street 1, 2100 Gödöllő, Hungary
4
Tashkent State Agrarian University, University Street 2 Kibray, Tashkent 111200, Uzbekistan
5
Department of Industrial Engineering, Eastern Mediterranean University, Via Mersin 10, Famagusta 99628, Northern Cyprus, Turkey
*
Author to whom correspondence should be addressed.
Water 2025, 17(9), 1268; https://doi.org/10.3390/w17091268
Submission received: 30 January 2025 / Revised: 20 March 2025 / Accepted: 25 March 2025 / Published: 24 April 2025

Abstract

:
Due to global climate change, the frequency and intensity of floods will be increasing in the decades to come. Under these conditions, there is an urgent need to develop such relatively simple and robust models and methods, which help the logistical preparatory and crisis management work in case of this natural disaster. In the crisis management phase, the integrated complex command centers and logistical hubs play an essential role. It is an open-ended question: how do we determine the optimal location of these hubs, and find an optimal compromise between their radius of supply and vulnerability? The current article presents a simple and fast method to determine the optimal position of hubs, minimizing their vulnerability, in cases when there is no chance to control the flood of the river (no dam), and in cases when there is a natural or artificial barrier, preventing the flow of water (dam scenario). Based on a system of equations, applying the Gumbel distribution of maximal water levels in various years, the article offers numerical examples to prove the simplicity and practical applicability of the method developed. This approach can supply a decision support system, based on AI. The paper concludes with policy implications.

1. Introduction

1.1. Background

Climate change causes a rapid increase in extreme weather conditions, and these lead to more and more frequent natural disasters. Most countries in the world do not pay attention to preparedness and response to natural disasters. The most frequent natural disasters are floods, leading to considerable losses in human life and property. According to the review of [1], the floods between 1980 and 2009 affected nearly three billion people, and caused more than half a million deaths and 360 thousand injuries. According to the data of the Centre for Research on the Epidemiology of Disasters [2], just in 2023, the number of floods was 164, causing 7.7 thousand deaths affecting 32.4 million people, and causing 20.4 billion losses. Due to climate change, the frequency and intensity of floods are expected to increase [3,4]. According to an estimation of [5] by 2050, the global flood frequency will be increasing by 20%.
Most of the floods occur along rivers; the place of these floods is known and there are periods of the year when the probability of flooding is higher. Assume for example that the river obtains its water partially from high mountains. When snow melts, the river obtains water and the occurrence of the flood is more likely. If there is a large amount of snow, then a flood can be expected. Notice that there is still time for the outbreak of the flood. In that case, the place and time of the flood are known. It makes it possible to carry out preparations in the pre-disaster period. Not all floods have this structure. A single rainfall that is exceptionally heavy can cause flooding in an area of a plain.
To protect the people in the areas of the world that are exposed to flooding, pre-disaster operations can contribute to saving more lives. The displaced victims need shelters to be evacuated. The distribution of humanitarian relief items among the affected people as fast as possible is essential. The relief items are pre-positioned in permanent hubs in the preparedness stage. Temporary hubs such as tents or wide areas such as schools, stadiums, churches, mosques, and sports lands are used as evacuation hubs. Furthermore, temporary hubs are used as warehouses to store the relief items close to the affected people but they should be located in a safe place and not damaged by the flood. These temporary hubs or warehouses are called relief centers and they can be wide areas or temporary tents. Perishable items should be stored in places that are temperature controlled. This paper aims to provide a tool for pre-disaster decision making and preparedness for the flood. Due to their scale, disaster management in the case of floods must be considered as complex logistical operations, however [6] highlighted, that “flood emergency preparedness lacks insight in logistical aspects”. One of the most important elements of the logistical decision making in the preparatory phase of the disaster is the determination of multimodal logistical centers. These centers could play a wide range of roles. The most important are as follows:
-
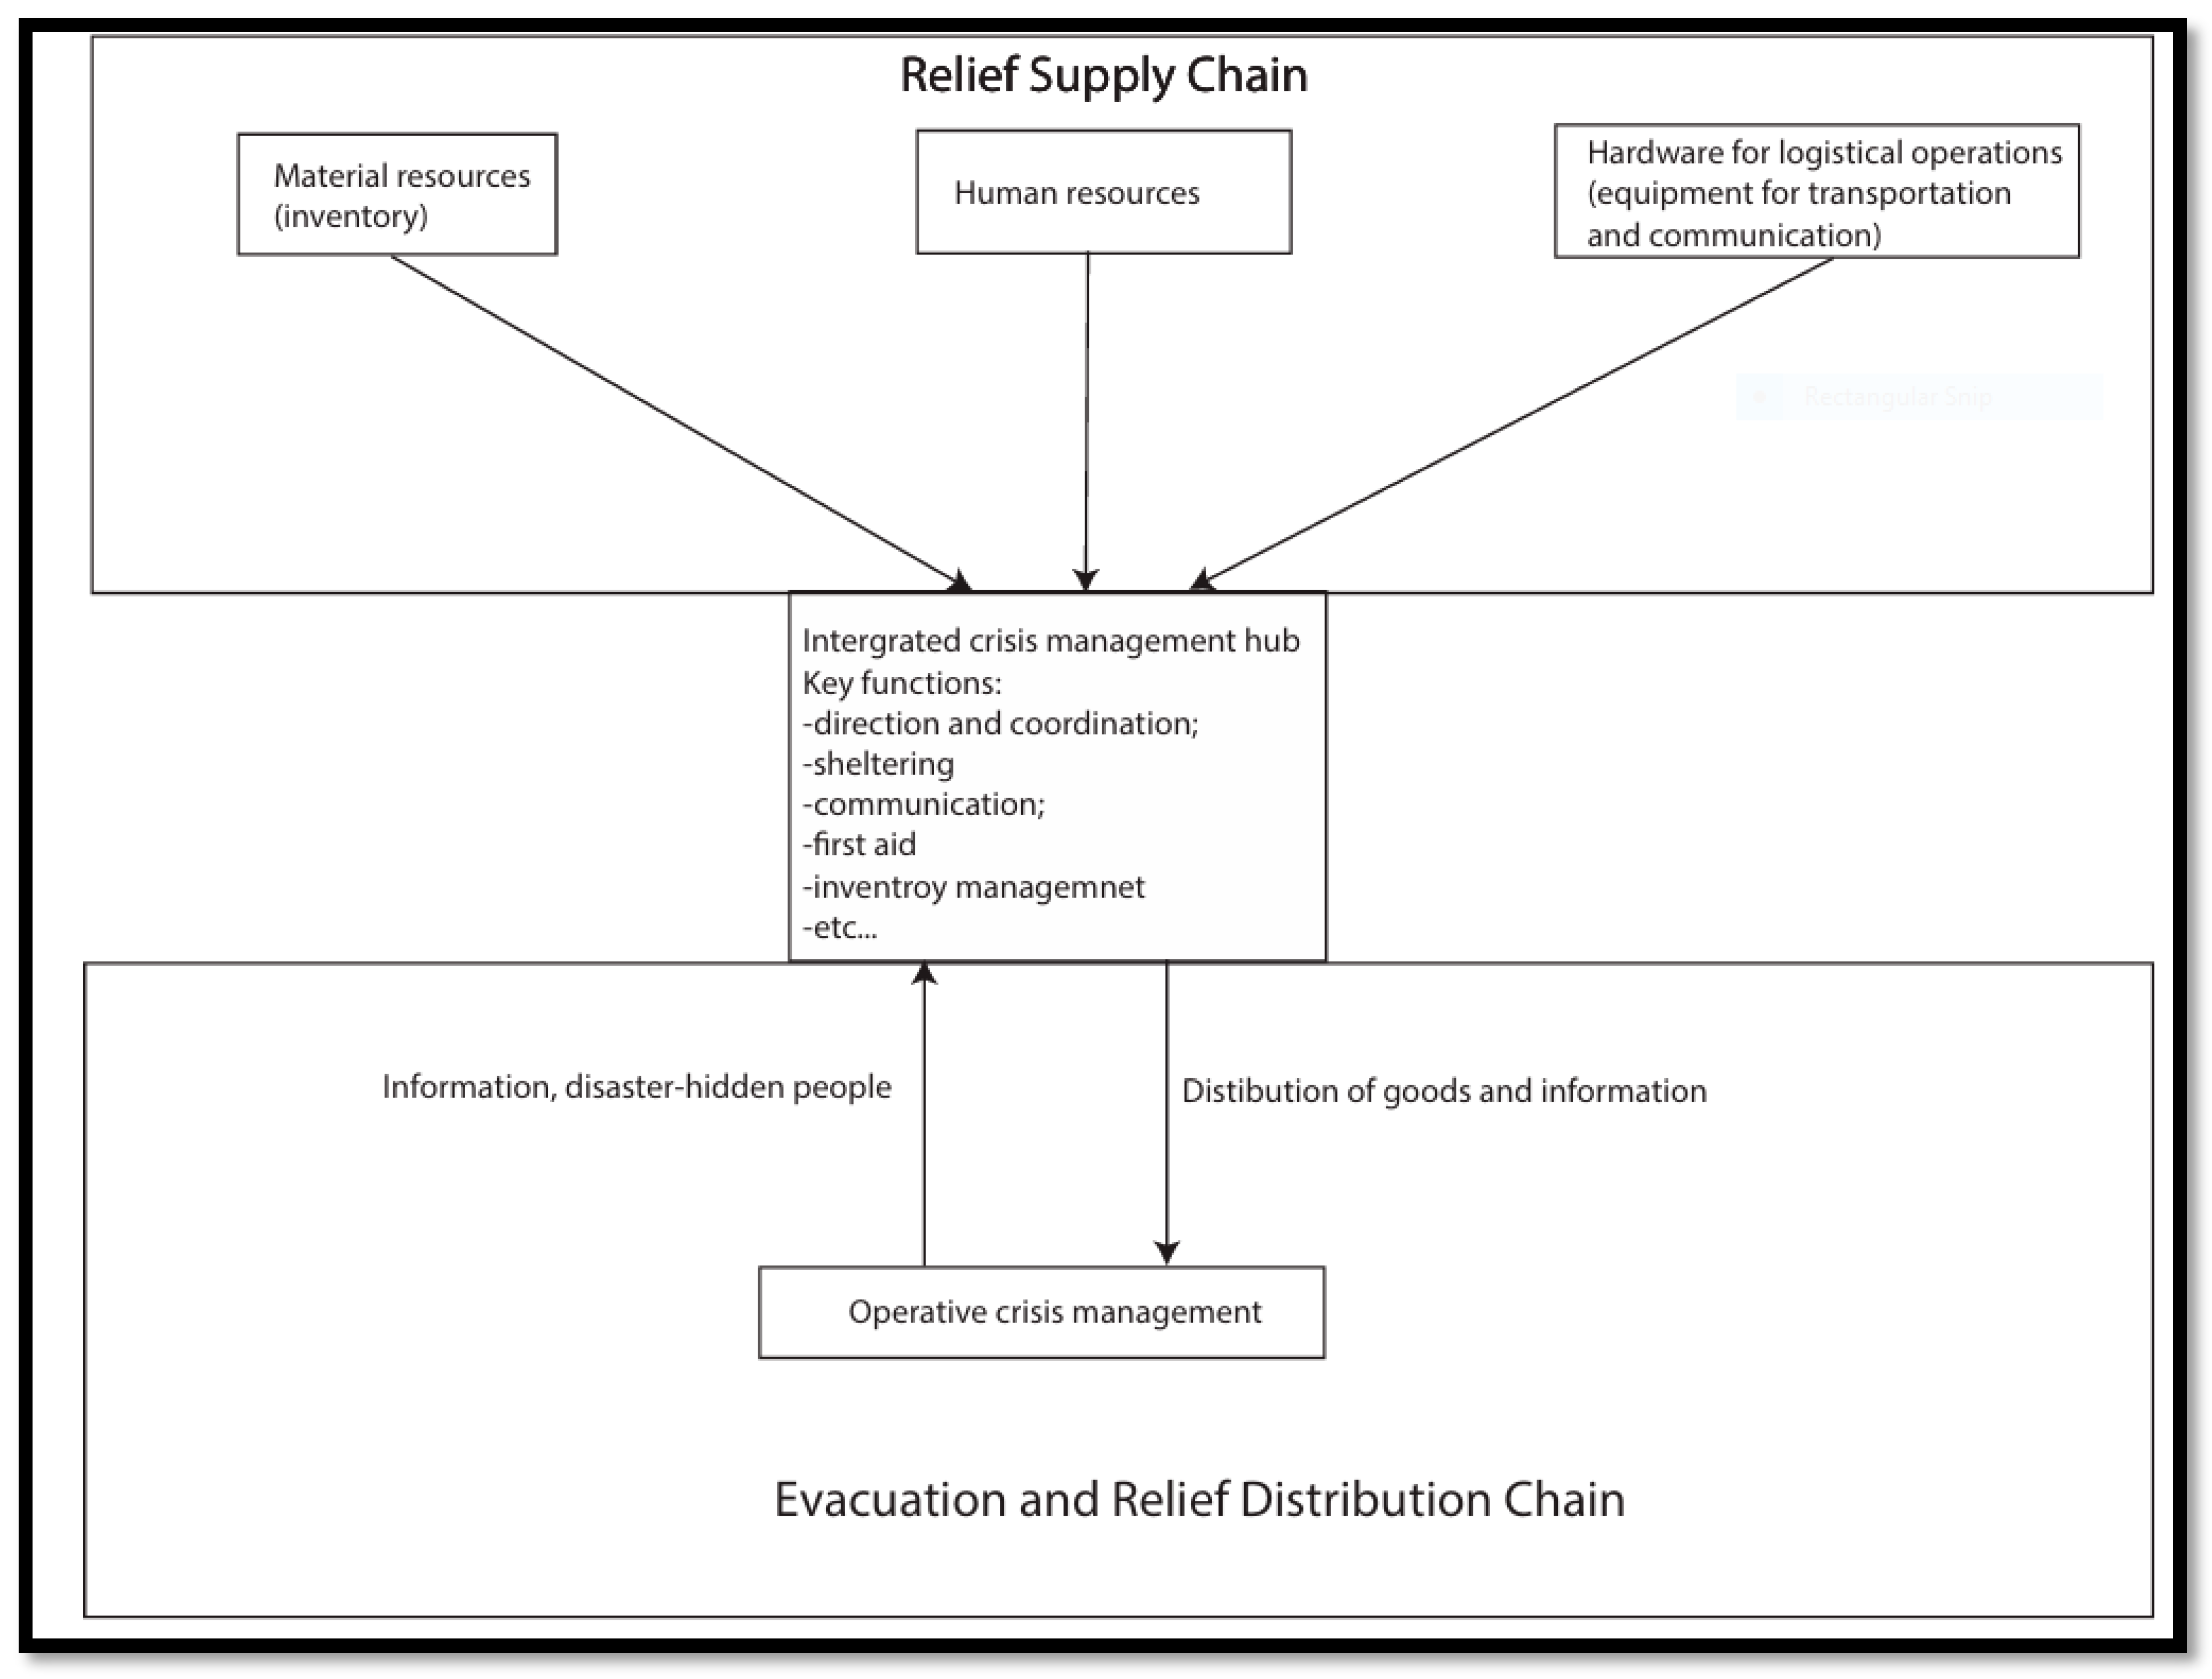
Shelter for the persons evacuated from the flooded area;
-
Direction and coordination of the fieldwork of the operative task forces;
-
Communication services;
-
Infrastructure for the public relations activities (e.g., press conferences);
-
Storage of inventory for the crisis response and recovery;
-
First-aid center for injured persons in the process of operations;
-
Center for public administration and jurisdiction.
A detailed summary of applications of operation research in humanitarian logistics is offered [7]. This study focuses mainly on network planning to satisfy the demands. The authors conclude that most models’ computational burden might prevent them from being used in actual disasters.
A wide-ranging overview of facility location optimization models and developed emergency humanitarian logistics is offered [8]. Based on their analysis of a wide range of literature, the authors highlight that the real question is not the optimization of a facility location in case of a disaster, but rather to find a suitable location “that we can commandeer and use”.
In summary, it can be stated that the careful planning of logistical operations must be an integrated part of the preparatory work to disasters. The last decades witnessed the mushrooming of various models with the purpose of optimal allocation of mobile logistical hubs, but in most cases, these models are hard to implement and often rather static.
The current paper presents a novel approach because to the best of our knowledge, no paper has proposed a simple mathematical model with reasonable parameters that can be obtained easily in real life. In the case of currently available models, some parameters are difficult to obtain or they are not accurate. Furthermore, these models are complex with several constraints which take time to solve them and define the locations of the temporary hubs. The time to respond to natural disasters is critical to save more lives and protect the victims from the bad consequences. To construct a reasonable model that takes little time to solve, and this is crucial in disaster operations, we propose two simple mathematical models to find the optimal location of temporary hubs (warehouses) in cases of river flooding with a dam and without a dam. With these simple mathematical models in the two cases, we achieve the aim of defining the best locations of the temporary hubs far from the flooding as fast as possible and saving more lives; on the contrary, in the case of the complex models, defining the locations of the temporary hubs will take time and the situation is urgent, so we may lose lives in this case.
The structure of the current paper is the following: the first part of the article offers a focused overview of various papers, dealing directly with the problems of the location of logistical hubs. The second part presents the methodology applied, the third part explains the results and discussions that describe the two models, and the fourth section is the summary, policy, and implications.

1.2. Literature Review

1.2.1. Optimization Modeling in Humanitarian Logistics and Disaster Management Related to Hubs

Optimization models became a powerful tool to tackle the problems of emergency logistics in both the preparedness and response stage. The most popular models are decision theory, stochastic models, probabilistic models, and fuzzy methods. Optimization modeling is used to solve the problems in both pre-disaster and post-disaster operations. The problems that are solved by optimization models are related to facility location, stock level and pre-positioning, transportation of casualties, and relief items distribution. Few models solve only location problems, on the contrary, most of the models of optimization modeling combine more than one problem [9].
The first optimization models in emergency logistics planning were created in the late 1970s following several maritime disasters that happened between the late 1960s and 1970s. Most of the early optimization models concentrated on maritime disasters and oil spills. From 1980 up to now, other fields of research have been explored since other large-scale emergencies have developed such as earthquakes, hurricanes, and floods [10].
A dynamic optimization model was proposed to solve the problem of distributing relief items after a flooding disaster [10]. This model considers dynamic demand and capacity constraints while prioritizing the response according to the level of urgency of the demand point.
The facilities that are used to serve the affected people in the aftermath of the disaster should be located as fast as possible. The location and the number of these facilities should be determined in the pre-disaster planning horizon for upgrading the effectiveness and efficiency of the disaster operations. The facilities that are used in disaster operations are temporary hubs and permanent hubs. The network structure of humanitarian relief distribution can contain multiple layers. Figure 1 illustrates the supply relief chain of humanitarian relief which contains the following different layers of relief supply chain: (1) supply points that represent the permanent warehouses and all points of entry to the impacted country by using different transportation modes such as land, sea, and air, (2) temporary logistic hubs (TLHs) that receive the relief item from global permanent hubs and then they are transferred to the points of demand (PODs), (3) PODs that represent the aggregate demands in a single district of disaster areas [11]. TLHs can be considered as distributed centers that could be located in public places such as hospitals, schools, and mosques. However, some of the existing public places can also be used as global or central warehouses [12].
The response operations of disaster management should take place in the first 72 h aftermath of large-scale disasters. The first 12 h period known as standard relief time is crucial to prevent the death of the affected people. In this context, pre- and post-disaster operations models are proposed with multi-objective models to provide the optimal locations of the warehouses and at the same time stock pre-positioning and transportation operations.
A stochastic programming model was offered in the case of flood emergency humanitarian logistics [13]. The model attempts to optimize the levels of inventory for emergency supplies and vehicle availability. It is solved with sample average approximation. The solved mathematical model shows large differences between the impacts of logistics parameters such as inventory capacity, number of periods and number of products, and the degree of demand fulfillment on the logistics time and cost.
A cost optimization model was proposed for solving the problem of shelter allocation and relief distribution in flood scenarios, keeping in mind the cost and time aspects [14].
Evacuation of the victims and displaced people in safe temporary shelters and distribution of the relief items as fast as possible is important to prevent the spread of diseases related to floods. Two methodologies were proposed based on mixed-integer programming technique and genetic algorithm. The heuristic approach achieves a better solution in the case of increasing the number of shelters and decreasing evacuation time.

1.2.2. Coverage Location Optimization Models

A coverage optimization problem can be considered as a set covering location problem (SCLP) and maximal coverage location problem (MCLP). Coverage problems are utilized for solving facility location problems in which the maximal demand is satisfied by a required amount of stock that is assigned in each facility. Coverage is a concept that signifies if the location of the demand is within a pre-specified radius which can be measured by using different metrics such as travel time and distance. The PODs are considered “covered” if they are located within a specified radius called “coverage distance” from the hub. It means that it is close to at least one facility. On the contrary, the uncovered PODs are located outside of the coverage distance. MCLP is more proper for planning the relief chain networks. In the MCLP models, the total demand that is covered within a maximal service distance is maximized due to a limited number of resources and facility constraints. On the contrary, the SCLP models minimize the number of facilities in which all PODs are covered. This means that the PODs must be within the specified response time of the hubs [15].
A methodology was proposed that combines quantitative and qualitative approaches to identify the optimal location of mobile-logistic hubs (MLHs) in different parts of the Nepal [15]. This study utilized a modified version of MCLP and focus group discussion (knowledge of experts) to select the first five priority locations of the MLHs in the preparedness stage. Disaster risk, level of human development, and transportation accessibility concepts were used and added as constraints. The integer programming method was used to solve the mathematical model. The objective function is the maximization of the number of served demand points.
During the response period, the operations revolve around uncertainty due to randomness. Uncertainty can be modeled in facility location problems by using stochastic or probabilistic models in which the probability distributions of the random variables or future scenarios for the uncertain parameters are considered. On the contrary, deterministic models are used to simplify the problems by forecasting with specific values.
Minimal coverage location problem (MinCLP) was proposed as a third type of location problem [16]. The objective of MinCLP is to cover a maximal number of locations with a pre-defined number of facilities and minimal distance among locations or demand point facilities. Furthermore, this paper mentioned other fields such that coverage location problems can be used to find the optimal location of various facilities such as emergency units, pharmacies, shops, schools, pollution sources, and antennas. This paper proposed a new model of the fuzzy maximal coverage location problem (FMCLP) with two types of fuzzy numbers for modeling uncertainty. The fuzzy numbers describe the distance between locations and the coverage radius (travel time). To solve this problem, the particle swarm optimization metaheuristic method (PSOM) was used.
A general medical supply facility location model was proposed; this model can be cast as a covering model, P-median model, and P-center model [17]. Coverage problems aimed to provide coverage to PODs by a facility that should be located within a defined area or distance limit. The objective function of P-median (minsum) models is the minimization of the average or sum distances between PODs and the nearest facilities, while P-center models (minimax) aim to minimize the travel time or the maximum distance between the facilities and the PODs; therefore, all demand points are served using the same number of available facilities (P). The model relies on scenarios with occurrence probabilities to consider the uncertain nature of the parameters. Finally, a proper comparison between the proposed models and the traditional models was conducted for the Los Angeles area. Integer programming was used to solve the mathematical models.
A probabilistic multi-objective model for relief supply and distribution under uncertainty in the response stage was proposed [11]. This model considered time-varying coverage due to impreciseness and time-varying parameters such as demand, costs, and available relief items. Fuzzy chance-constraint programming was used to solve the problem. The objective function is the maximization of total demand coverage and the minimization of total cost. Figure 2 illustrates the concept of time-varying coverage. The service is made within time s(t).
A capacitated LSCP and it was solved using Excel Solver to locate and allocate the victims of a flood disaster was proposed [18]. This model aims to minimize the number of facilities (evacuation hubs or relief centers) to cover all the evacuees within traveled distances which are 3 km, 5 km, and 10 km. Three new constraints were added: rainfall amount, elevation from sea level, and distance from the river. For the allocation process, split and non-split scenarios were tested for the allocation process utilizing a case study of a river flood. The proposed model can be considered for a better evacuation plan.
Heuristic algorithms are used to solve the set covering problems. A new solution for the set covering the problem based on coefficient and fitness values was proposed [19]. The proposed algorithm improves the solution of the set covering problem. The qualification of the subsets is evaluated in which the subset of the selected set has the lowest probability of being selected in the following iteration. The proposed method is compared with the simulated annealing algorithm (SA). The new methods are better than the SA algorithm in terms of quality and time, and they can be used to solve complex problems without conventional restrictions.
Hybrid coverage location problems can be used in one model to take advantage of both SCLP and MCLP. A hybrid mathematical model of the coverage location problem was offered [20]. The primary facilities are gradually located during the planning phases, ensuring full coverage for PODs. Furthermore, after being assured that all demand points are under full coverage of the facilities, a specific number of resources such as staff, equipment, food, trucks, and ambulances are assigned to the located facilities to optimize the PODs in operational periods.
A more realistic location problem with a network of high-density areas such as cities was proposed [21]. In this model, it is assumed that the demand is distributed along the network edges. Therefore, the expected demand which is covered is maximized. A mixed integer non-linear program (MINLP) with a branch and bound algorithm was utilized to solve the location problem for small values of the facilities. This problem has two parts: the first one is choosing the suitable edge to locate the facility, and this is called the combinatorial part; the other part is defining the optimal locations of the facilities in the chosen edges, and this is called the continuous global optimization part.
A set covering problem with side constraints can be used to model the problem of providing a UAV-based wireless network in the disaster response stage considering the operational constraint. An exact branch and price algorithm and two approximation models of the quadratic coverage radius constraints and linear-pairwise conflict constraint based on Jung’s problem were proposed. The results found that they are suitable to solve real-life problems and serve up to 100 demand points and 2000 m of coverage radius [22].
In this literature review, we can observe that many papers used multi-objective complex models to solve facility location problems with different parameters.

2. Methodology

2.1. Research Design

In this research, we used mathematical modeling to find the optimal locations of the temporary hubs; numerical examples were used to test the feasibility of the mathematical models. We solved the mathematical model in a very short time using LINGO software, (LINDO Systems, Chicago, IL, USA).

2.2. Methods Description

Firstly, we define the aim of the study which is to find the optimal locations of the temporary hubs in the two cases of the study: with a dam and without a dam using simple mathematical models, we define the scientific approach that we should follow that is the maximal coverage problem, then we construct the mathematical models. To test the feasibility of the mathematical models, we use numerical examples and implement the mathematical models using Lingo 12 software.

2.3. Mathematical Models Approach and Concept Description

To find the optimal location of the temporary hubs along the river, optimization modeling with a simple mathematical model was used. The concept of location coverage problem was introduced in the model using the coverage distance.
There are two cases of floods along the river as follows: the river with a dam and the river without a dam. There are two approaches to the optimization of the locations of temporary hubs. If the number of hubs is restricted, then the maximal coverage means the maximal percentage of the demand that can be covered. If all demands are to be covered, then the number of temporary hubs is to be minimized. In the two cases, we use the distance constraint in different ways to help in choosing the optimal locations of the temporary hubs. In the case of the river with the dam, we used logical constraints. The idea of the algorithm k out of n is used that is proposed by [23]. The objective of not having a large unsupplied area is achieved by using at least k positions from n consecutive positions. The general idea is applied in the particular case of this paper such that a certain number of consecutive locations has at least one intact hub. The decision process starts with the selection of potential, i.e., suitable, locations of hubs. The simplifying assumption to be used for the k out of n method is that the potential locations of the temporary hubs are in equidistant places along the river.
The potential locations of the temporary hubs are the locations along the river with a high probability that they are not exposed to be covered by water in the case of dam existence, and logical constraints are used in this case, thus, we give values of probabilities to each hub according to the experience of the decision maker and the historical data.
We use the concept of maximal coverage, which means that one intact hub will cover all places if the location of the place is within a pre-specified radius, in this case, the distances should be equal to determine the radius of the location which can be measured as distance or travel time. And in this case, we guarantee that all places will be served and each hub can serve the places within the specified radius. If they are not equal, some places for sure will not be covered by the hubs, the other places will be covered by more than one hub, and this does not comply with the aims of the research which is using the coverage concept to cover all the demand points and save more lives. Furthermore, the optimizing model will minimize the number of hubs due to the case of a restricted number of hubs.
In the proposed solution with dam existence, we used the concept of maximal coverage problem; it means that we can use one temporary hub to cover all the area around the hub that can be reached (the maximal coverage radius), and to cover all areas we should choose the locations to be considered for the hubs, we used the idea of consecutive-k-out-of-r-from-n to choose at least one intact hub to cover the area, for example, every 3 consecutive areas we can choose one to cover all 3 areas, in this case, we cover all areas and we use this concept from the paper that proposed by [24]. Furthermore, the reliability and robustness of the concept have been examined, and we need a reliable and robust system to solve the problem that will help save lives quickly and accurately, so the problem is to minimize the number of temporary hubs that will cover all demand areas to be served. If k > 1 and one hub fall out as it is covered by water, then still the whole area can be served by the remaining hubs.
In the case of the river without the dam, the potential locations of temporary hubs are safe if their places are higher than the flood. Thus, when choosing potential locations for warehouses, it is necessary to take into account what is the expected value of the height of the greatest flood in 100 years. It means that the extreme elevations of the flood can be determined from the historical data and the probability distributions. Moreover, the closest hub to any place of the river may not be a longer distance from the place than the safety distance. This constraint guarantees a maximal coverage of demand points within this distance which starts from an initial point along the river. The maximum level of the river should be observed to find the probability distribution of extreme values. The maximum levels of the river are considered as extreme values, and we should find the probability distribution of the extreme values to be a reference to find the maximum level of the flood in any coming year; therefore, we can plan for the temporary hub before happening the flood in pre-disaster operations period. The relevant distributions are mentioned in the next paragraph. If a distribution is selected, then the distribution function must be fitted to the observed data. The safe places to locate the temporary hubs are those above the highest level of flooding. The objective is to maximize the minimal height of the selected locations because the lowest hub is first submerged and becomes unusable. This solution complies with the objective of the paper which is to find safe temporary hubs to serve the victims that should be the highest places that cannot be covered by flooding.
The maximal value of the flood is observed every year. The weather has a lot of random factors: the weather occurs daily, and factors such as humidity, wind, temperature, air pressure, and clouds affect the current and future weather. These factors differ in different parts of the world and these factors influence the climate of a location or region. We do not know the exact weather conditions because the factors happen randomly with associated probabilities. Factors do not determine each other completely; it means the correlation is much less than 1. The exact forecast is not possible. Thus, the numerical values of factors depending on the weather are random as well. If the factors can be measured rarely, for example, only once in each year, then the values measured in different years are considered independent in the sense of probability theory. The maximal value of a factor should be understood as follows. A time series collects the values of the factor. The time series are divided into disjoint blocks of equal length, which means we collect data in a specific period, for example, all the collected data in a year. The blocks cover the whole time series. The maximal value in a block is a random variable. Its distribution is important in the case of statistical methods. It can be modeled by so-called extreme value distributions [25]. The three most important ones are the Fréchet, Weibull, and Gumbel distributions [24,26]. Each of them is a member of the Generalized Extreme Value Distribution family. Gumbel distribution was used in the numerical example discussed below. For Fréchet distribution, it is a special case of the generalized extreme value distribution. For example, in hydrology, it is applied to extreme events such as annual maximum one-day rainfalls and river discharges.
If a location is covered by water, then it cannot be used as a hub. In case of random events, it is not possible to select locations such that the whole area will be served from hubs on them for sure. However, it is possible to increase the probability of being served by the proper arrangement of the hubs as the probability depends on the arrangement.
Two cases must be distinguished. The first one is if no dam protects the area along the river. The maximal height of the flood determines which hubs can work in which locations. It is worth taking into account that the distribution of relief items should be finished even before the flood reaches its maximal height. Thus, the existence of hubs may make sense even if they cannot work during the whole-time frame of the flood. If a dam exists, then the probability that a location is covered by water is less, but it is not impossible. Sometimes, water moves under the dam and forms an abundant source on the protected side of the dam. Dams can even collapse causing a catastrophic event. One or more locations can be covered as a consequence of such events. Thus, it is necessary to estimate the probability that neighboring locations are covered by water. It is a problem of engineering and is beyond the scope of the paper. In what follows, different mathematical models are suggested for the cases without and with the dam.
An important aspect besides the scientific approach and engineering, the cooperation with the state and affected people plays a key role in avoiding the flood risks by working together to formulate their requirements to drive policy options [26]. General awareness at all levels of society, the public sector, and all related people, and the insurance industry about the driving factors of the flood risk can help reduce the flood risk. Precautions are cheaper in the long run than paying for the losses [27]. Furthermore, the scientific approach for protecting the population from flood risk supports the overall costs for public location problems such as emergency facilities when we use the maximal coverage location problem with mandatory closeness constraints [28].

3. Results and Discussion

Flooding on rivers belongs to the group of disasters where both the place of the disaster, that is, the area along the river, and its time are known. The latter is because the water needs time to arrive at the endangered place. This also means that there is a way to prepare for defense. This includes the designation of places where protective materials and equipment are temporarily stored. Large rivers rarely have floods that threaten the river’s environment. In the years between two major floods, many changes can occur in the environment, and therefore many places that were previously suitable for temporary floods may become unusable or, conversely, previously occupied places may become free. Therefore, it makes sense that places that can be used as local bases for defense are regularly reviewed.

3.1. Development of a Model for Optimal Distribution of Hubs for No-Dam Case

The selection still takes place in the pre-disaster period. It is part of preparedness. It also means that the necessary technical preparations can be carried out in the selected locations.
Dams along the river are saving the area behind the riverside. In the case of no dam, a place is safe from a flood only if it is higher than the flood. Therefore, the main criterion of the selection is to find potential locations of temporary hubs as high as possible. This principle still does not determine a unique criterion as it is discussed below. The selection also must fulfill another technical requirement. It is that every place that may need help from hubs during the flood is close to a hub. We can select safe places that are higher than the flood to locate the temporary hubs to serve the victims along the river. The general assumptions on the problem which are valid in this section and even in the next one discussing the case of the existence of a dam, are as follows:
  • In the case of a flood, passing the river with a large amount of relief items can be dangerous. Therefore, the methods and models discussed below concern the defense of one side of the river. However, if aerial transportation is possible with drones having a large transportation capacity, then the hubs can be on both sides of the river. A single system can also serve both sides in that case.
  • The part of the river where the defense takes place can be considered as a linear segment. It is 0 , L . Here the length of the segment is L .
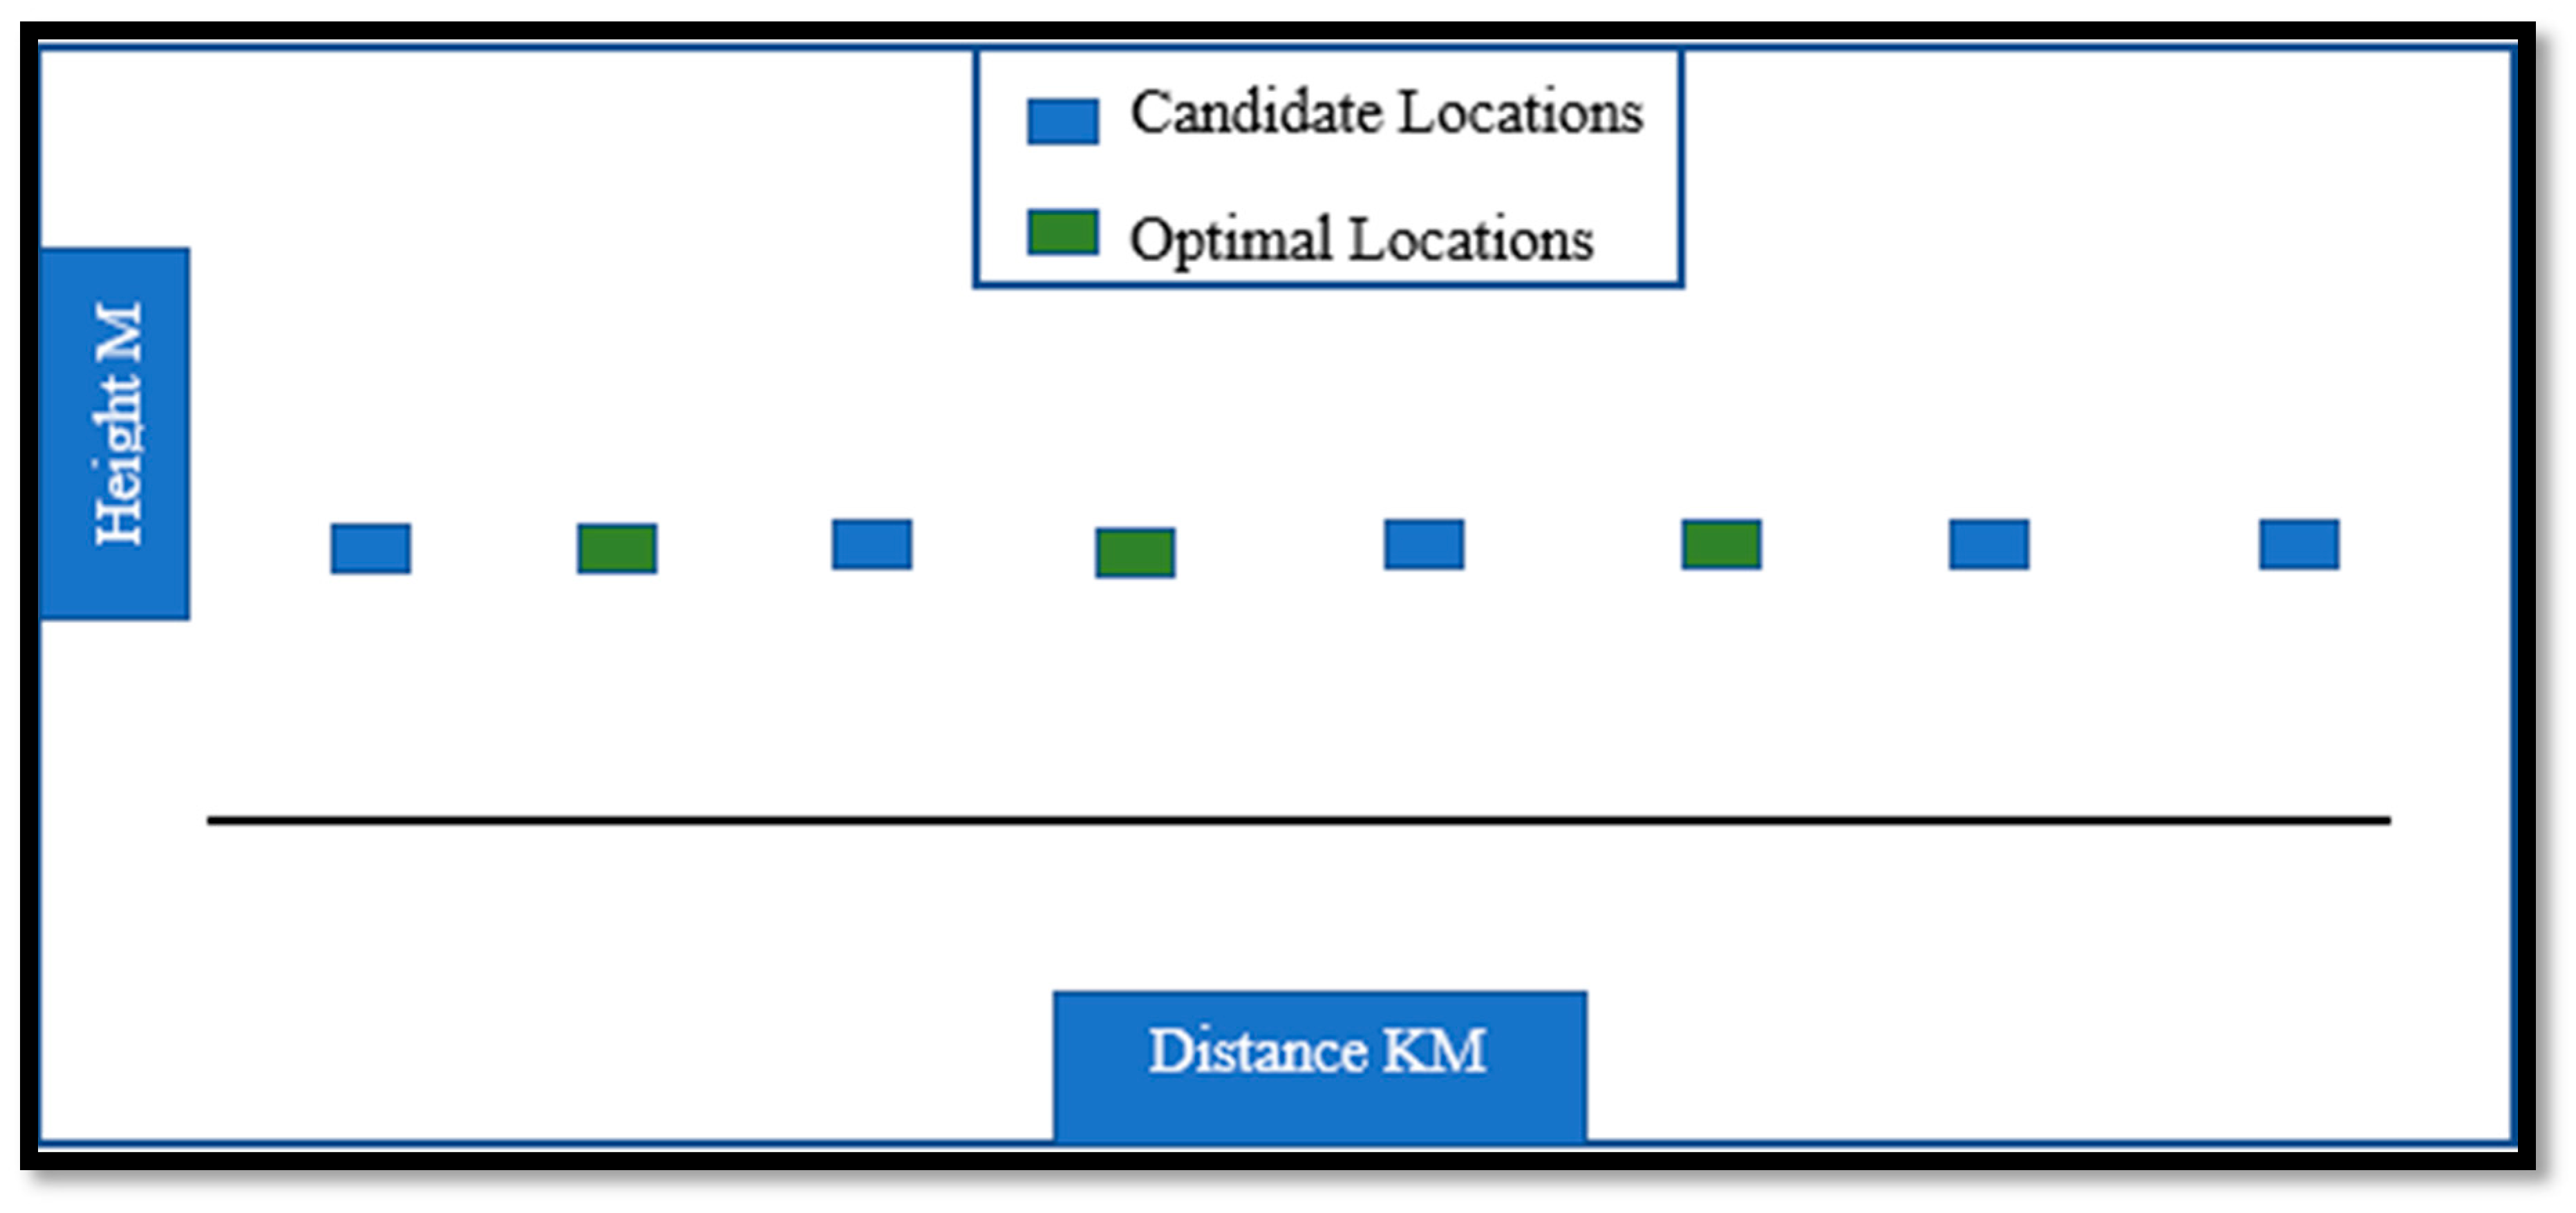
  • Positions of the potential locations are determined by two data. The first one is how far it is from the starting point 0 of the segment. The second one is the height.
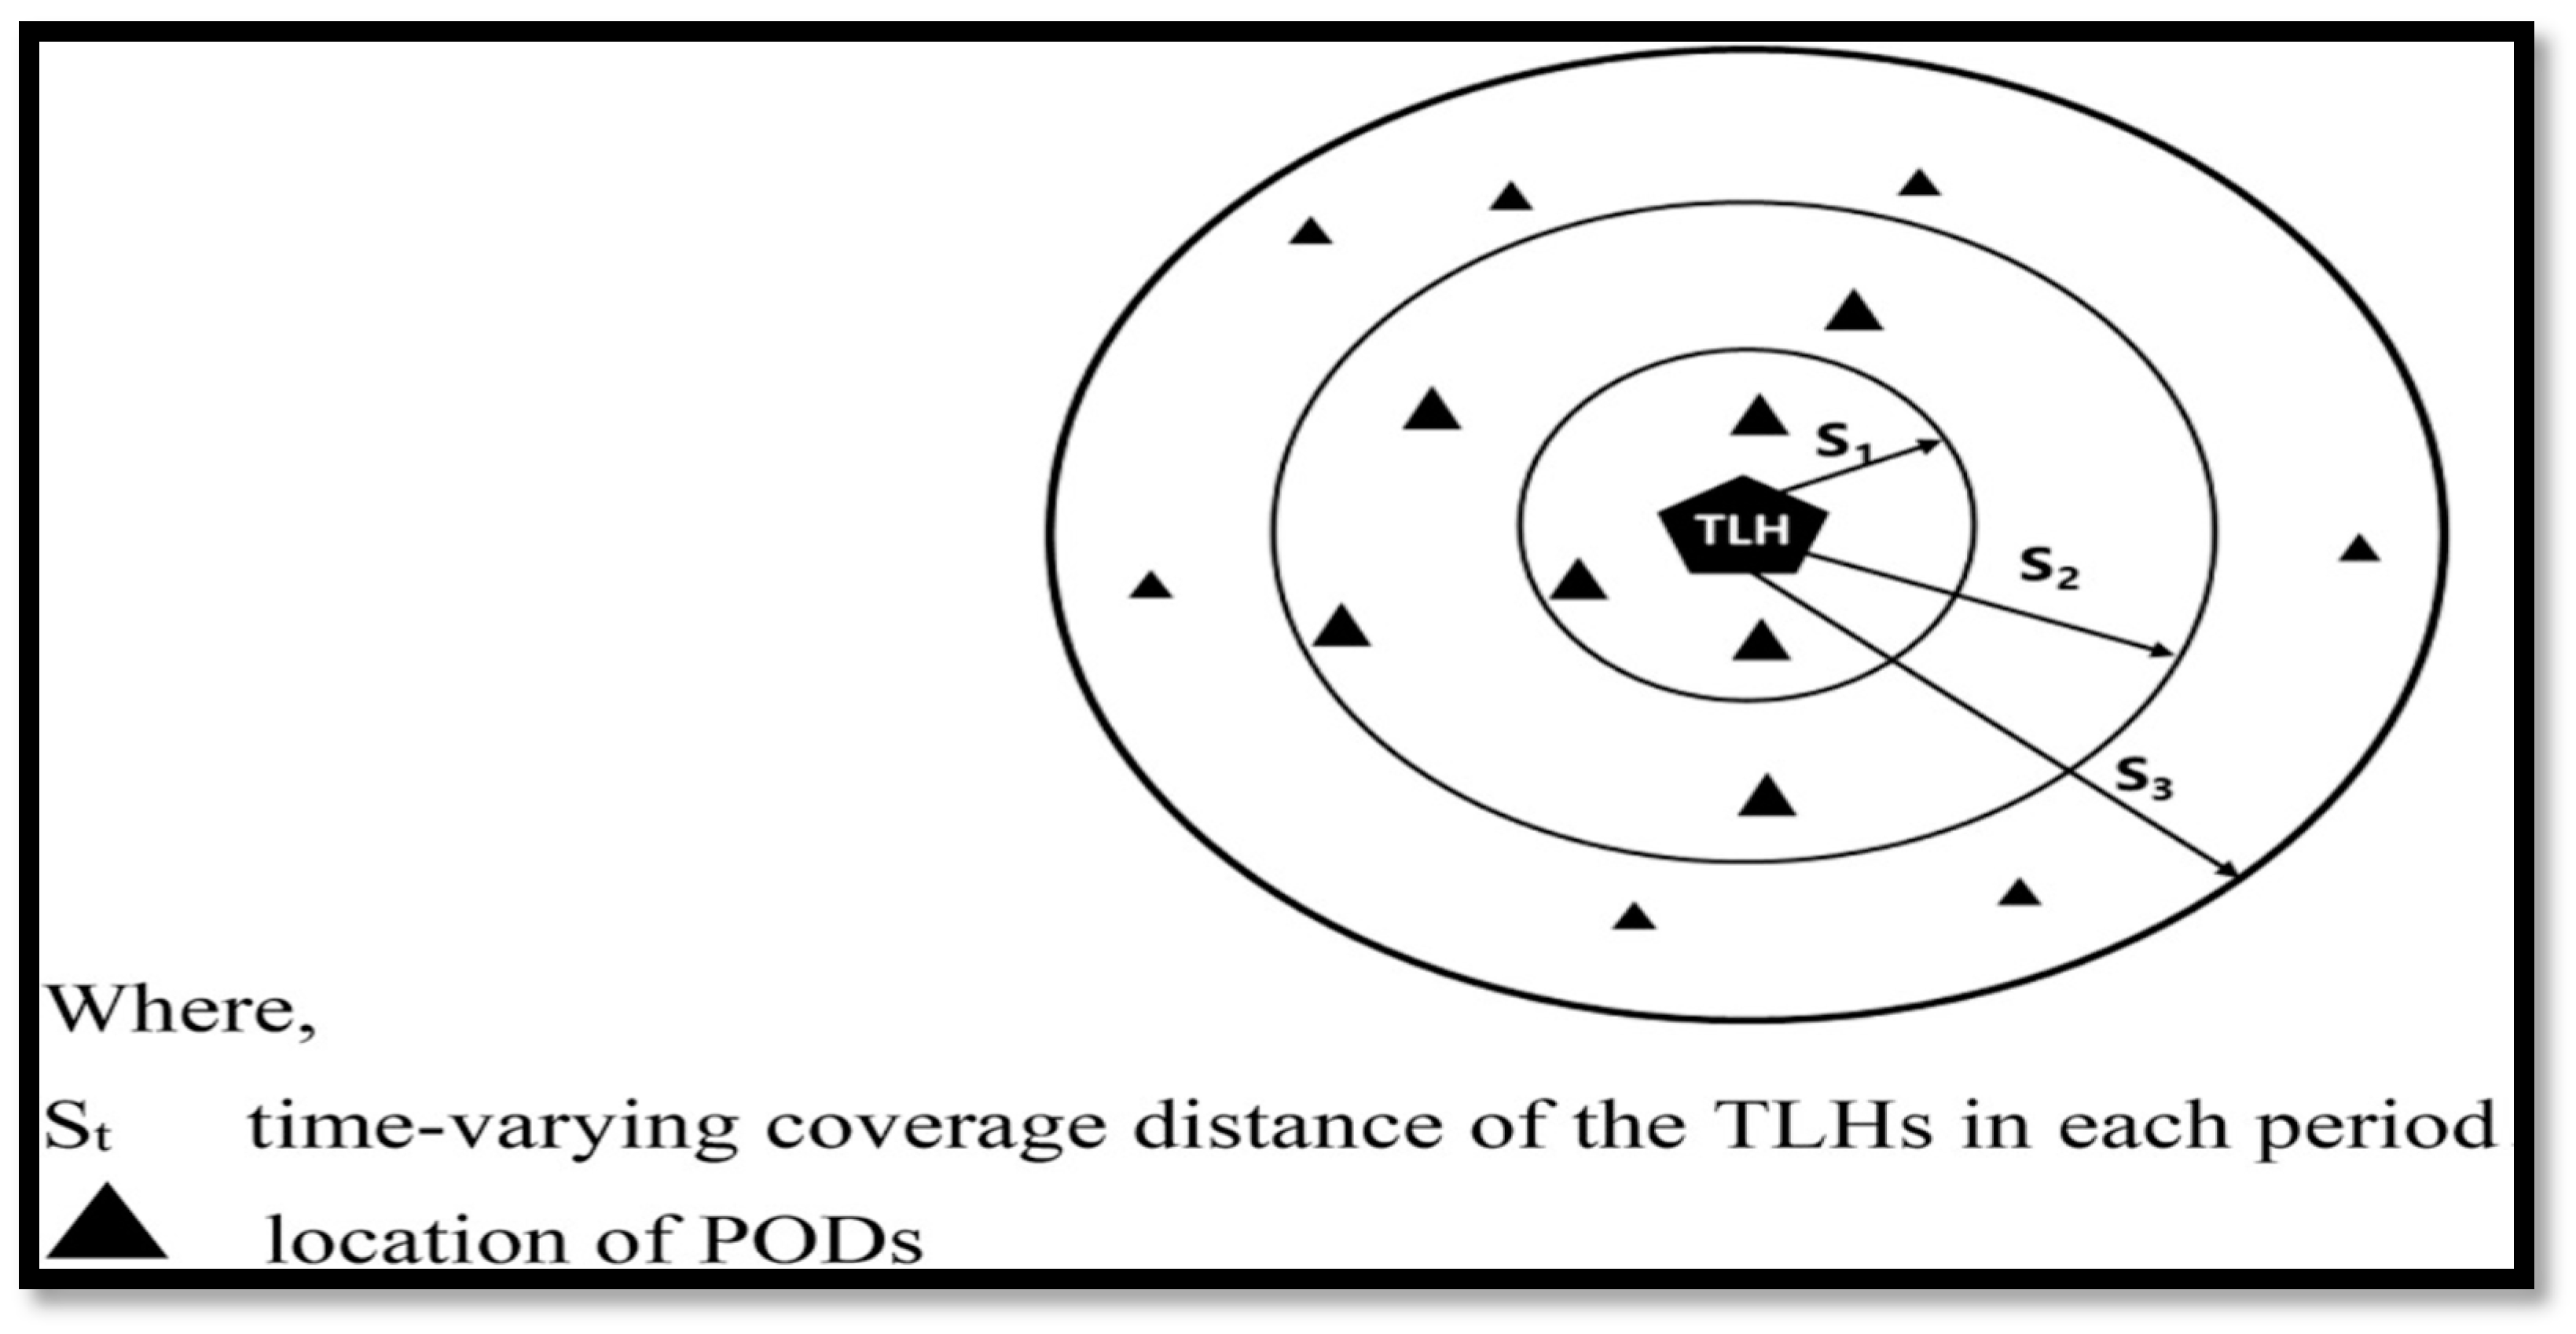
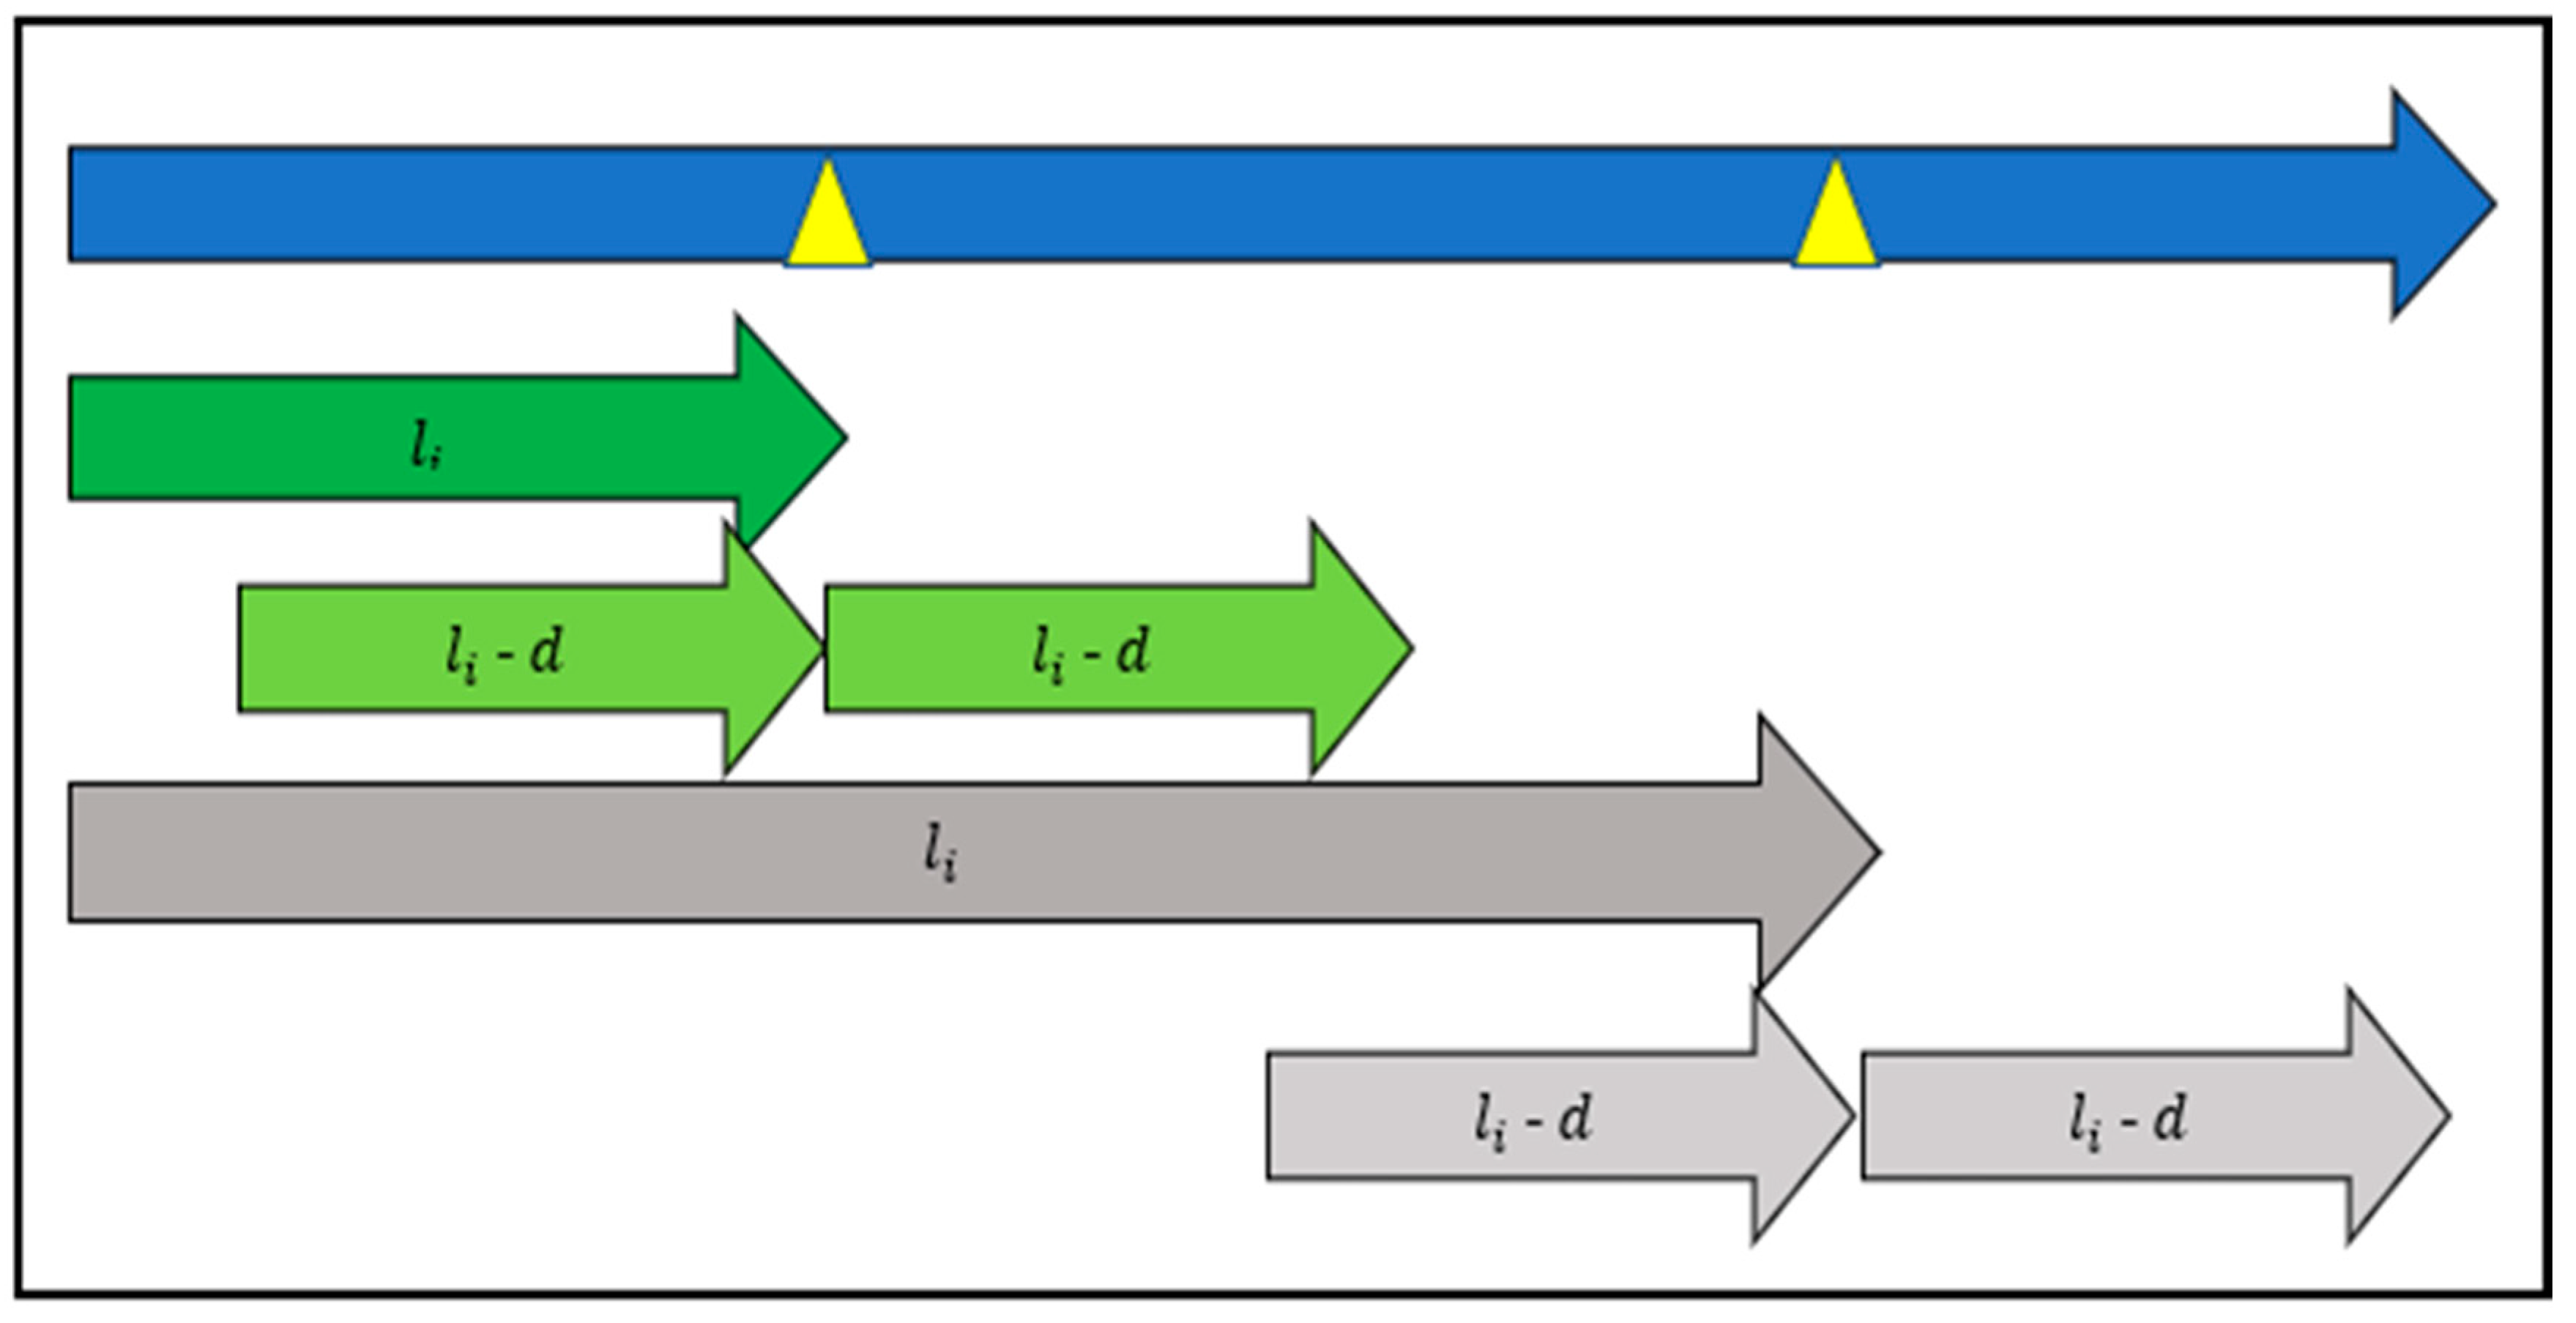
  • All places within the segment must have a hub within an a priori defined distance d .
  • A preliminary investigation selects a finite number of potential locations. Each one is a possible place for a temporary hub.
  • The number of the selected potential locations is fixed.
The necessary notations to the assumption are described in Table 1:
Before continuing the list of notations, some remarks must be made. It is assumed that
0 l 1 < l 2 < < l n L .
The restriction of the index order in this way does not affect the generality of the discussion. Let i and j be two indices such that i < j . Assume that both locations are selected as the location of the temporary hub; however, no location between them is selected. Locations i and j cover all the places along the river in the intervals l i d ,   l i + d and l j d , l j + d , respectively. Thus, if there is no uncovered place between the two intervals, the inequality
l i + d l j d
must hold as it follows from (1). The inequality
0 l j l i 2 d
is a consequence of (1) and (2). Moreover, if (1) holds, it is equivalent to (2). Thus, if a potential location is selected, then within distance 2 d on its right, another one must be selected unless its distance from the right end of the segment, i.e., from l i , is less than d. Figure 3 shows the riverside segment (the blue arrow) and two locations l i is the first location with the dark green color and l i is the second location with dark grey color, each location can serve the demand points within 2d (two identical distances for both locations: l i d with light green and light gray, l i + d with light green and light gray) and form the two directions: left and right-hand sides to guarantee that all demand points are covered. The yellow triangular represents the optimal location of the hub.
In formalizing the constraints, two more notations are needed as described in Table 2.
The set J i is in a more formal way as follows:
J i = j j / i , l j l i 2 d
The starting point of the segment, i.e., 0 is introduced as a potential location, if it is not a potential location in its own right. It is an element of the set I by definition.
Before discussing the constraints of the optimization problem, the variables are briefly described as mentioned in Table 3.
The variables of the optimization problem of the selection x i i = 1 , , n are 0–1 variables such that
x i = 1 i f   p o t e n t i a l   l o c a t i o n   i   i s   s e l e c t e d 0 i f   p o t e n t i a l   l o c a t i o n   i   i s   n o t   s e l e c t e d .
The constraints which claim that along the 0 , L segment all places have a selected location within distance d are as follows:
For   all   i I j J i x j 1
The restriction of selecting only a limited number of locations is expressed by the equation
i 1 n x j = p
To make the set of constraints complete, (5) is stated in a more formal way as
x i = 0   or   1 ,   i = 1 ,   ,   n
There are at least two suitable criteria for an objective function. The first one is that every location has as much safety as possible. The safety of the location i depends on the height. This fact implies that the height of the lowest selected position must be maximized. Let M be a large number. For example,
M = max h i i = 1 ,   2 , , n } min h i i = 1 ,   2 , , n + 1
is a proper choice. The minimal height of the selected locations is denoted by h. If a location is selected, then its height is at least as much as the minimal height; if a location is not selected, then the location does not affect the objective function. Thus, the selection is formalized by the inequalities
M 1 x i + h i h , i = 1 , , n
Notice that if the location i is not selected, then the value of the left-hand side is
M + h i = m a x h i i = 1 , n m i n h i i = 1 , n + h i + 1 m a x h i i = 1 , n + 1 ,
i.e., the constraint is automatically satisfied if p ≥ 1. If the location is selected, then the left-hand side is h i which a constant value is. It restricts h . Thus, the objective function of the problem is
m a x   h
The problem summarizes that the objective function (10) is to be optimized under the conditions (6)–(9).
Another objective is to maximize the total height of the selected location, it is
m a x i 1 n h i x i
That problem summarizes that the objective function (11) is to be optimized under the conditions (6)–(8).
The disadvantage of the first objective function is that it may have many optimal solutions. Some hubs might be moved to higher positions without violating the constraints. The disadvantage of the second objective function is that it is possible that some locations are selected in low positions. It is also possible that the problem (6)–(10) is solved first. Let h * be the optimal value. A second optimization is also possible. In addition to the condition (6)–(9), a new constraint is introduced which is
h h *
The objective function (11) is optimized under the conditions (6)–(9) and (12). This model is the lexicographic solution of the bi-objective problem (6)–(9) and objective functions (10) and (11). The lexicographic order concerns the objective functions.
The numerical solution to the problem is shown by an example. The data of the example can be found in Appendix A. Fifty potential locations must provide relief items along a 190+ kilometer-long segment of the river. It is supposed that it is possible to transport relief items for a distance not longer than 20 km in both directions along the river from every location. The model (6)–(10) of this numerical problem has 50 binary variables and one continuous variable. The number of constraints is 95. In principle, the model is NP complete. However, its structure is simple. Thus, the CPU time used by Lingo 12 software for optimization is negligible, i.e., less than 1 s. The computer had an Intel (R) Pentium (R) D 3.00 GHz processor and 2.00 G RAM.
Example: If p = 12 hubs are available to locate, then the optimal solution is shown in Table 4.
Figure 4 shows the locations of the candidate hubs and the optimal solutions that are presented in red color; we can observe that the optimal solutions are the highest locations. This solution guarantees that these locations of hubs are safe and far from any future flooding.
For sensitivity analysis purposes, we tested the mathematical model using different values of parameters to choose the proper solution in all cases as shown in Table 5.
According to Table 5, with 12 and 15 hubs available to locate, the objective function = 13.69 m, which means that the minimal height of the location will be 13.69 m to be chosen for locating the temporary hubs, lower than 13.96 m will not be considered as a location, and with 25 hubs, the objective function = 13.14 m. It means the minimal height decreased when increasing the number of available hubs to be located and this situation is not proper because we need to choose the location which is as high as possible to be far from the flood. If we choose 25 locations instead of 20 locations with the same safety distance, this means that we have more chances to choose more locations that might be of less height which is not proper. For the safety distance to locate the hub, with 20 km, the objective function value = 13.69 m, and with 25 km, the objective function = 14.63 m. It means that the minimal height increases if we increase the safety distance, since new locations are added to be chosen within 25 km and this gives more possible locations with better height.

3.2. Mathematical Model for the Case of Existing Dam

The task of dams is to keep the water in the inundation area and keep the populated area water free. The populated area is covered by water in two cases only. Either the flood is higher than the dam or there is bursting of a dam. The water can cover the whole populated area behind the dam in the first case. If bursting occurs, the water runs to the populated area at one point and it takes time to cover the whole populated area. Thus, the flood control has time to build a second line of defense and repair the collapsed part of the dam. Some hubs temporarily or permanently cannot work as they are covered by water. However, the larger part of the populated area remains safe. This section is devoted to the case of bursting. The option that the flood is higher than the dam is disregarded as a rare event.
A hub can be covered by water not only in the case that the dam collapses in front of the hub. If the dam collapses at one of its neighboring hubs, then the water can still flow to the hub and cover it, i.e., the hub becomes out of order for a while. A location is called intact if it is not covered by water. Similarly, a hub is intact if it exists and is not covered by water. The intact hubs can give support for areas such that the hub responsible for that area is not intact. It is not possible to claim that the whole area is supplied by relief items for sure as future events cannot be forecasted for sure. What can be claimed is that the probability of the continuous supply is high. Suppose that the potential locations of the temporary hubs are in equidistant places along the river. A possible constraint is that every three or four consecutive locations have at least one selected hub. A hub on a location is intact if the location is selected for a temporary hub, the hub is settled there and the location is not covered by water. The selection depends on the decision maker. Being in an intact location depends on nature. Figure 5 shows the riverside with candidate locations to locate the temporary hubs, and there are three consecutive locations here. At least one intact location should be selected from the three consecutive locations. The model gives an important tool for selecting the intact locations form a list of candidate locations.
The variables x i ’s of the previous section are used here as well for the description of the selection. Let A i be the event that the location i remains intact. The probability of the event is denoted by P A i . Hence,
P A i x i = 0 i f   x i = 0 ,   i . e . ,   l o c a t i o n   i   i s   n o t   s e l e c t e d P A i i f   x i = 1 ,   i . e . ,   l o c a t i o n   i   i s   s e l e c t e d .
The upper row of this equation says that if a location is not selected, then there is no intact hub on that location for sure. Formula (13) can be generalized. For example, if i j , then the event that at least one of the two locations is intact is denoted by A i + A j and the event that both locations are intact is A i A j . The probability of the event A i + A j is the well-known formula P A i + P A j P A i A j . Taking into account the decisions on the selections of the two locations, the probability that there is at least one intact hub on the two locations is
P A i x i + P A j x j P A i A j x i x j = 0 i f   x i = 0   a n d   x j = 0 P A i i f   x i = 1   a n d   x j = 0 P A j i f   x i = 0   a n d   x j = 1 P A i + P A j P A i A j i f   x i = 1   a n d   x j = 1
Further generalizations exist. Let S be a set of locations. Assume that S has m elements. Then the probability that there is at least one intact hub in the locations of S is
i S P A i x i i , j S i < j P A i A j x i x j + i , j , k S i < j < k P A i A j x i x j x k ( 1 ) m + 1 P i S A i i S x i
One possible mathematical model is that the value of (15) is at least a priori given threshold p ¯ probability for all consecutive m locations and the number of hubs is minimized. Let S l = l , l + 1 , , l + m 1 . Then the model is more formal:
m i n i = 1 n x i                                            
i S l P A i x i i , j S l i < j P A i A j x i x j + i , j , k S l i < j < k P A i A j x i x j x k ( 1 ) m + 1 P i S l A i i S l x i p ¯ l = 1,2 , , n m + 1
x i = 0   a n d   1   i = 1 , , n        
The problem (16)–(18) is non-linear as there are the products of the binary variables in (17). However, there is a linearization technique obtained in integer programming. It introduces new variables and constraints. The new problem which has an increased size becomes linear. Let again S be a set of locations and assume that S has m elements. Let
y S m = i S x i .
Notice that the value of y S m is either 1 if for all i S the equation x i = 1 and it is 0 in any other case. Suppose that y S m is introduced as a new 0-1 variable which must satisfy the constraints as follows:
i S x i y S m m 1
i S x i m y S m
Notice that (19) claims if all variables x i i S equal 1, then y S m must be 1. On the other hand, if any of the variables x i i S equal 0, then y S m must be 0 according to (20). Thus, by adding the proper variables and constraints to the problem (16)–(18), a linear integer programming problem is obtained.
Example 1.
Assume that  n = 4 , and  m = 3 . The target probability to be achieved at every consecutive three locations is 0.91 or more. The probabilities are as follows:
P A 1 = P A 2 = P A 3 = P A 4 = 0.9 ,   P A 1 A 2 = 0.8901 ,   P A 1 A 3 = 0.8891 , P A 2 A 3 = 0.8891 ,   P A 2 A 4 = 0.886 ,   P A 3 A 4 = 0.887 ,   P A 1 A 2 A 3 = 0.8801 ,   P A 2 A 3 A 4 = 0.885 .
The optimization problem (16)–(20) has the following form:
m i n   x 1 + x 2 + x 3 + x 4
0.9 x 1 + 0.9 x 2 + 0.9 x 3 0.8901 y 12 2 0.8891 y 23 2 0.8891 y 13 2 + 0.8801 y 123 3 0.91
0.9 x 2 + 0.9 x 3 + 0.9 x 4 0.8891 y 23 2 0.886 y 24 2 0.887 y 34 2 + 0.885 y 234 3 0.91
x 1 + x 2 y 12 2 1 ,   x 1 + x 3 y 13 2 1 ,   x 2 + x 3 y 23 2 1 ,   x 2 + x 4 y 24 2 1 ,
x 3 + x 4 y 34 2 1
x 1 + x 2 2 y 12 2 0 ,   x 1 + x 3 2 y 13 2 0 ,   x 2 + x 3 2 y 23 2 0 ,   x 2 + x 4 2 y 24 2 0 ,
x 3 + x 4 2 y 34 2 0
x 1 + x 2 + x 3 y 123 3 2 ,   x 1 + x 2 + x 3 3 y 123 3 0
x 2 + x 3 + x 4 y 234 3 2 ,   x 2 + x 3 + x 4 3 y 234 3 0
x 1 ,   x 2 ,   x 3 ,   x 4 ,   y 12 2 ,   y 13 2 ,   y 23 2 ,   y 24 2 ,   y 34 2 ,   y 123 3 ,   y 234 3 = 0   a n d   1
The optimal solution to the problem is   x 2 = x 3 = y 23 2 = 1 , all other variables are equal to 0.
Example 2.
If we have several candidate locations to locate the temporary hubs, let us say seven locations, for every three consecutive locations (every interval of three long, the probability of having an intact box ≥ 0.95. Figure 6 shows the probabilities of the three locations. We can calculate the other probabilities using Figure 6 according to the mathematical model.
For sensitivity analysis and in the case of dynamic data, we can test the optimal solution considering three consecutive locations as shown in Table 6, with probabilities equal to 0.9 for each event and target probability ≥ 0.95, no feasible solution for choosing from the candidate locations, but for probabilities equal to 0.95, the optimal solution = X1, if the probabilities are 0.88, the objective function = 2, and the optimal solution = X2, X3, and Y23. If we decrease the target probability to be less than 0.95, the objective function decreases to be equal to 1.
From the examples discussed previously, and with the use of the mathematical models, we can protect the population from the consequences of the flood by locating the temporary hubs in the proper locations as fast as possible. This model guarantees that all places will be served. Since the model finds the optimal locations from a limited number of consecutive locations, e.g., three or four consecutive locations. The decision maker can assume the probabilities of the intact locations from historical data since the time and place of the flood are known. The other probabilities can be calculated easily, then the model can be solved by using lingo 12. The results are displayed within less than one second.

4. Summary and Policy Implications

Floods always have played an important role in the history of humanity, demanding considerable causality, and causing important material losses. Their frequency and intensity have increased in the last decades, as a consequence of global warming. Governments of countries should prepare carefully before the occurrence of floods to avoid the extreme consequences that may happen to the population and the economy. Humanitarian logistics are essential to save lives. The relief items should be stored in safe places. Evacuation operations for the affected people should happen at a suitable time and place. Temporary hubs can be used to store the relief items and for evacuation of the evacuees. The optimal number and the location of the temporary hubs can be found using mathematical models of operation research. Recently, the application of various methods of operational research has increased intensively, but a considerable part of the sophisticated models cannot be applied in practice due to a lack of reliable data and high computational demand. We aimed to develop robust models for the determination of optimal dislocation of integrated logistic hubs. Two basic versions have been analyzed: in one case, we are not supposed to have the possibility of control of the flood (no dams or another artificial barrier), and in another case, we suppose the presence of a dam. The most important problem in the case of the determination of the logistical hubs is to find an optimal compromise between the requirement of stable (continuous) work of the base (minimizing the risk of flooding it), and maximizing the possibility of the continuous logistical service. The extreme character of the distribution of the highest water level in various years makes the optimization even more complex. Notwithstanding the problems, we have been able to present a simple and relatively low data-demanding solution, which offers a favourable possibility to maximize the stability of the continuous work of the hubs. In the case of dam existence, the locations of the hubs should be safe, and to achieve this, logical constraints were used. The potential locations of the temporary hubs are assumed to be equidistance along the river and at least one location will be intact to serve the demand points in that area. A simple mathematical model is used to solve the problem and it is coded using Lingo 12 optimization modeling software. The results of the example were produced in just a few seconds. In the case of no dam existence, the candidate locations for the temporary hubs should be far from flooding. In this case, the maximal height of the flood is important to define the safe locations for hubs. Each location has two parameters: how far from the starting point of the segment and the height. In this case, the number of temporary hubs is fixed and the optimal locations will cover all demand points. A simple mathematical model is used to solve the problem and it is coded using Lingo 12 optimization modeling software and the optimal solution is obtained in just a few seconds. The methods that are used to solve the problem in the two cases are feasible and simple. The decision maker can easily utilize it. All parameters and variables are easy to obtain in real life. The sensitivity analysis of the model offers the possibility for decision makers to strike an optimal compromise between safety and the size of the service area of one hub. We have to highlight that the current stage of the work must be considered as a preliminary approach. Further research needs to integrate our current results into the actual transportation and infrastructural networks.
Our results highlight the importance of a preparatory phase in crisis management: it is essential that the basic infrastructure must be prepared well before the beginning of the food, taking into consideration the hydrological data and the geographic position of various locations. This fact underlines the importance of data collection and wide range application of the simulations, results of which could be evaluated by artificial intelligence.

Author Contributions

Conceptualization, S.R.A.-N., G.K. and B.V.; data curation, S.R.A.-N., G.K. and B.V.; formal analysis, S.R.A.-N., G.K. and B.V.; investigation, S.R.A.-N., G.K. and B.V.; methodology, S.R.A.-N., G.K. and B.V.; project administration, G.K. and B.V.; resources, S.R.A.-N. and B.V.; software, S.R.A.-N. and B.V.; supervision, G.K. and B.V.; validation, S.R.A.-N., G.K., Z.L. and B.V.; visualization, S.R.A.-N. and B.V.; writing—original draft, S.R.A.-N.; writing—review and editing, S.R.A.-N., G.K., Z.L. and B.V. All authors have read and agreed to the published version of the manuscript.

Funding

This research received no external funding.

Data Availability Statement

The original contributions presented in this study are included in the article. Further inquiries can be directed to the corresponding author.

Conflicts of Interest

The authors declare no conflict of interest.

Appendix A

Table A1. Data of the example without dam.
LocationDistanceHeightLocationDistanceHeight
kmm kmm
13.0011.5726106.7412.87
25.7811.1927108.9014.00
311.5315.4428114.5615.36
415.0811.7829118.7211.13
519.6713.6630122.6913.18
622.9712.2431128.1611.17
729.2712.6332131.5013.28
831.2112.4533132.5913.69
933.9015.9434138.7514.63
1039.1111.7635140.7012.33
1140.7311.3936144.7512.74
1245.1215.6237148.7515.65
1347.6213.1438149.8515.62
1452.8911.5539156.4913.13
1559.8712.8840159.0812.18
1663.8411.2741163.2312.07
1766.2315.2742167.8812.77
1872.6915.9343171.4214.24
1978.9213.9344172.8915.99
2080.1314.0245175.7911.07
2181.3314.9646177.1614.25
2287.6212.1047178.4615.85
2394.0715.3148180.3712.69
24100.8011.1849182.5913.17
25102.7112.9650189.1114.33

References

  1. Doocy, S.; Daniels, A.; Murray, S.; Kirsch, T.D. The human impact of floods: A historical review of events 1980–2009 and systematic literature review. PLoS Curr. 2013, 5. [Google Scholar] [CrossRef] [PubMed]
  2. Centre for Research on the Epidemiology of Disasters (CRED). 2024. Available online: https://www.emdat.be/ (accessed on 1 January 2025).
  3. Kundzewicz, Z. Is the frequency and intensity of flooding changing in Europe? In Extreme Weather Events and Public Health Responses; Springer: Berlin/Heidelberg, Germany, 2005; pp. 25–32. [Google Scholar]
  4. Breinl, K.; Lun, D.; Müller-Thomy, H.; Blöschl, G. Understanding the relationship between rainfall and flood probabilities through combined intensity-duration-frequency analysis. J. Hydrol. 2021, 602, 126759. [Google Scholar] [CrossRef]
  5. The Organization of Economic Cooperation and Development (OECD). 2019. Available online: https://www.oecd.org/ (accessed on 1 January 2015).
  6. De Leeuw, S.; Vis, I.F.; Jonkman, S.N. Exploring logistics aspects of flood emergency measures. J. Contingencies Crisis Manag. 2012, 20, 166–179. [Google Scholar] [CrossRef]
  7. Özdamar, L.; Ertem, M.A. Models, Solutions and enabling technologies in humanitarian logistics. Eur. J. Oper. Res. 2015, 244, 55–65. [Google Scholar] [CrossRef]
  8. Boonmee, C.; Arimura, A.; Asada, T. Facility location optimization model for emergency humanitarian logistics. Int. J. Disaster Risk Reduct. 2017, 24, 485–498. [Google Scholar] [CrossRef]
  9. Caunhye, A.M.; Nie, X.; Pokharel, S. Optimization models in emergency logistics: A literature review. Socio-Econ. Plan. Sci. 2012, 46, 4–13. [Google Scholar] [CrossRef]
  10. Rivera-Royero, D.; Galindo, G.; Yie-Pinedo, R. A dynamic model for disaster response considering prioritized demand points. Socio-Econ. Plan. Sci. 2016, 55, 59–75. [Google Scholar] [CrossRef]
  11. Maharjan, R.; Hanaoka, S. A credibility-based multi-objective temporary logistics hub location-allocation model for relief supply and distribution under uncertainty. Int. J. Environ. Res. 2020, 70, 100727. [Google Scholar] [CrossRef]
  12. Tavana, M.; Abtahi, A.-R.; Di Caprio, D.; Hashemi, R.; Yousefi-Zenouz, R. An integrated location-inventory-routing humanitarian supply chain network with pre- and post-disaster management considerations. Socio-Econ. Plan. Sci. 2018, 64, 21–37. [Google Scholar] [CrossRef]
  13. Garrido, R.A.; Lamas, P.; Pino, F.J. A stochastic programming approach for floods emergency logistics. Transp. Res. Part E Logist. Transp. Rev. 2015, 75, 18–31. [Google Scholar] [CrossRef]
  14. Mollah, A.K.; Sadhukhan, S.; Das, P.; Anis, M.Z. A cost optimization model and solutions for shelter allocation and relief distribution in flood scenario. Int. J. Disaster Risk Reduct. 2018, 31, 1187–1198. [Google Scholar] [CrossRef]
  15. Maharjan, R.; Shrestha, Y.; Rakhal, B.; Suman, S.; Hulst, J.; Hanaoka, S.; Management, S.C. Mobile logistics hubs prepositioning for emergency preparedness and response in Nepal. Int. J. Prod. Econ. 2020, 10, 555–572. [Google Scholar] [CrossRef]
  16. Drakulić, D.; Takači, A.; Marić, M. New model of maximal covering location problem with fuzzy conditions. Comput. Inform. 2016, 35, 635–652. [Google Scholar]
  17. Jia, H.; Ordóñez, F.; Dessouky, M. A modeling framework for facility location of medical services for large-scale emergencies. IIE Trans. 2007, 39, 41–55. [Google Scholar] [CrossRef]
  18. Hashim, N.I.M.; Shariff, S.S.R.; Deni, S.M. Allocation of Relief Centre for Flood Victims Using Location Set Covering Problem (LSCP). J. Phys. Conf. Ser. 2021, 2084, 012016. [Google Scholar] [CrossRef]
  19. Hashemi, A.; Gholami, H.; Venkatadri, U.; Sattarpanah Karganroudi, S.; Khouri, S.; Wojciechowski, A.; Streimikiene, D. A New Direct Coefficient-Based Heuristic Algorithm for Set Covering Problems. Int. J. Fuzzy Syst. 2022, 24, 1131–1147. [Google Scholar] [CrossRef]
  20. Alizadeh, R.; Nishi, T. Hybrid Covering Location Problem: Set Covering and Modular Maximal Covering Location Problem. In Proceedings of the 2019 IEEE International Conference on Industrial Engineering and Engineering Management (IEEM), Macao, China, 15–18 December 2019. [Google Scholar]
  21. Blanquero, R.; Carrizosa, E.; Gazdag-Tóth, B. Maximal covering location problems on networks with regional demand. Omega 2016, 64, 77–85. [Google Scholar] [CrossRef]
  22. Park, Y.; Nielsen, P.; Moon, I. Unmanned aerial vehicle set covering problem considering fixed-radius coverage constraint. Comput. Oper. Res. 2020, 119, 104936. [Google Scholar] [CrossRef]
  23. Habib, A.; Szantai, T. New bounds on the reliability on the consecutive k-out-of-r-from-n: F system. Reliab. Eng. Syst. Saf. 2000, 68, 97–104. [Google Scholar] [CrossRef]
  24. Dimitrova, Z.I.; Vitanov, N.K. Analysis of extreme water levels of Indus, Ganges, and Brahmaputra rivers. Comptes Rendus L’académie Bulg. Sci. 2020, 73, 1729–1735. [Google Scholar]
  25. Chowdhury, J.U.; Stedinger, J.R.; Lu, L.H. Goodness-of-fit tests for regional generalized extreme value flood distributions. Water Resour. Res. 1991, 27, 1765–1776. [Google Scholar] [CrossRef]
  26. Berz, G. Flood disasters: Lessons from the past—Worries for the future. Proc. Inst. Civ. Eng.-Water Marit. Eng. 2000, 142, 3–8. [Google Scholar] [CrossRef]
  27. Kron, W. Flood disasters—A global perspective. Water Policy 2015, 17, 6–24. [Google Scholar] [CrossRef]
  28. Church, R.; Revelle, C. The maximal covering location problem. Pap. Reg. Sci. Assoc. 1974, 32, 101–118. [Google Scholar] [CrossRef]
Figure 1. Network of humanitarian relief distribution [11].
Water 17 01268 g001
Figure 2. Time-varying coverage concept [11].
Water 17 01268 g002
Figure 3. River side segment and the optimal locations.
Water 17 01268 g003
Figure 4. The candidate locations and the optimal solution (red spots are optimal locations, green spots are not optimal).
Water 17 01268 g004
Figure 5. The riverside as a segment with candidate and optimal locations.
Water 17 01268 g005
Figure 6. Probability calculations for having an intact box of 3 consecutive locations.
Water 17 01268 g006
Table 1. The notations of the assumption for Group 1.
Description
L The length of the segment 0 , L to be defended.
n The number of potential locations selected is preliminary.
p The number of hubs to be selected in the final solution.
d The safety coverage distance, i.e., the closest hub to any place of the river may not be to a longer distance from the place than d .
l i , h i The position of a potential location where l i is the distance from the initial point of the segment, and h i is the height of the location.
Table 2. The notations of the assumption for Group 2.
NotationDescription
I The set of potential locations such that i I implies that L l i > d .
J i The set of potential locations such that they are right from i and their distance from i is not greater than 2d.
M A large positive number; see below how to choose it.
Table 3. Decision variables of no dam case.
NotationDescription
x i The decision variable on the selection of potential location i.
h The objective function variable.
Table 4. The optimal solution of the mathematical model without dam.
The Available Hubs to LocateDistance (km)Objective Function Value (M)The Selected Locations to Locate the Hubs (Optimal Solution)
122013.693, 9, 12, 17, 18, 19, 20, 23, 27, 33,38, 44
Table 5. The sensitivity analysis of the mathematical model without dam.
The Available Hubs to LocateDistance (km)Objective Function Value
(M)
122013.69
152013.69
252013.14
122514.63
152514.25
202513.69
252513.14
Table 6. Sensitivity analysis of the model with dam.
EventsA1A2A3A1A2A1A3A2A3A1A2A3MObj.F.ValueOptimal Solution
Probabilities0.900.900.900.890.87110.890.87010.95-No feasible solution
0.900.900.900.890.87110.890.87010.98-No feasible solution
0.950.900.900.890.87110.890.87010.951X1
0.950.900.900.890.87110.890.87010.801X1
0.880.880.880.700.700.700.900.952X2, X3, Y23
0.880.880.880.700.700.700.900.92X2, X3
0.880.880.880.700.700.700.900.81X3
0.880.880.880.700.700.700.900.71X3
Disclaimer/Publisher’s Note: The statements, opinions and data contained in all publications are solely those of the individual author(s) and contributor(s) and not of MDPI and/or the editor(s). MDPI and/or the editor(s) disclaim responsibility for any injury to people or property resulting from any ideas, methods, instructions or products referred to in the content.

