
Research on Dynamic Trend Prediction Method for Flow Discharge Through Harbor Gates in Tidal Reaches


Abstract
1. Introduction
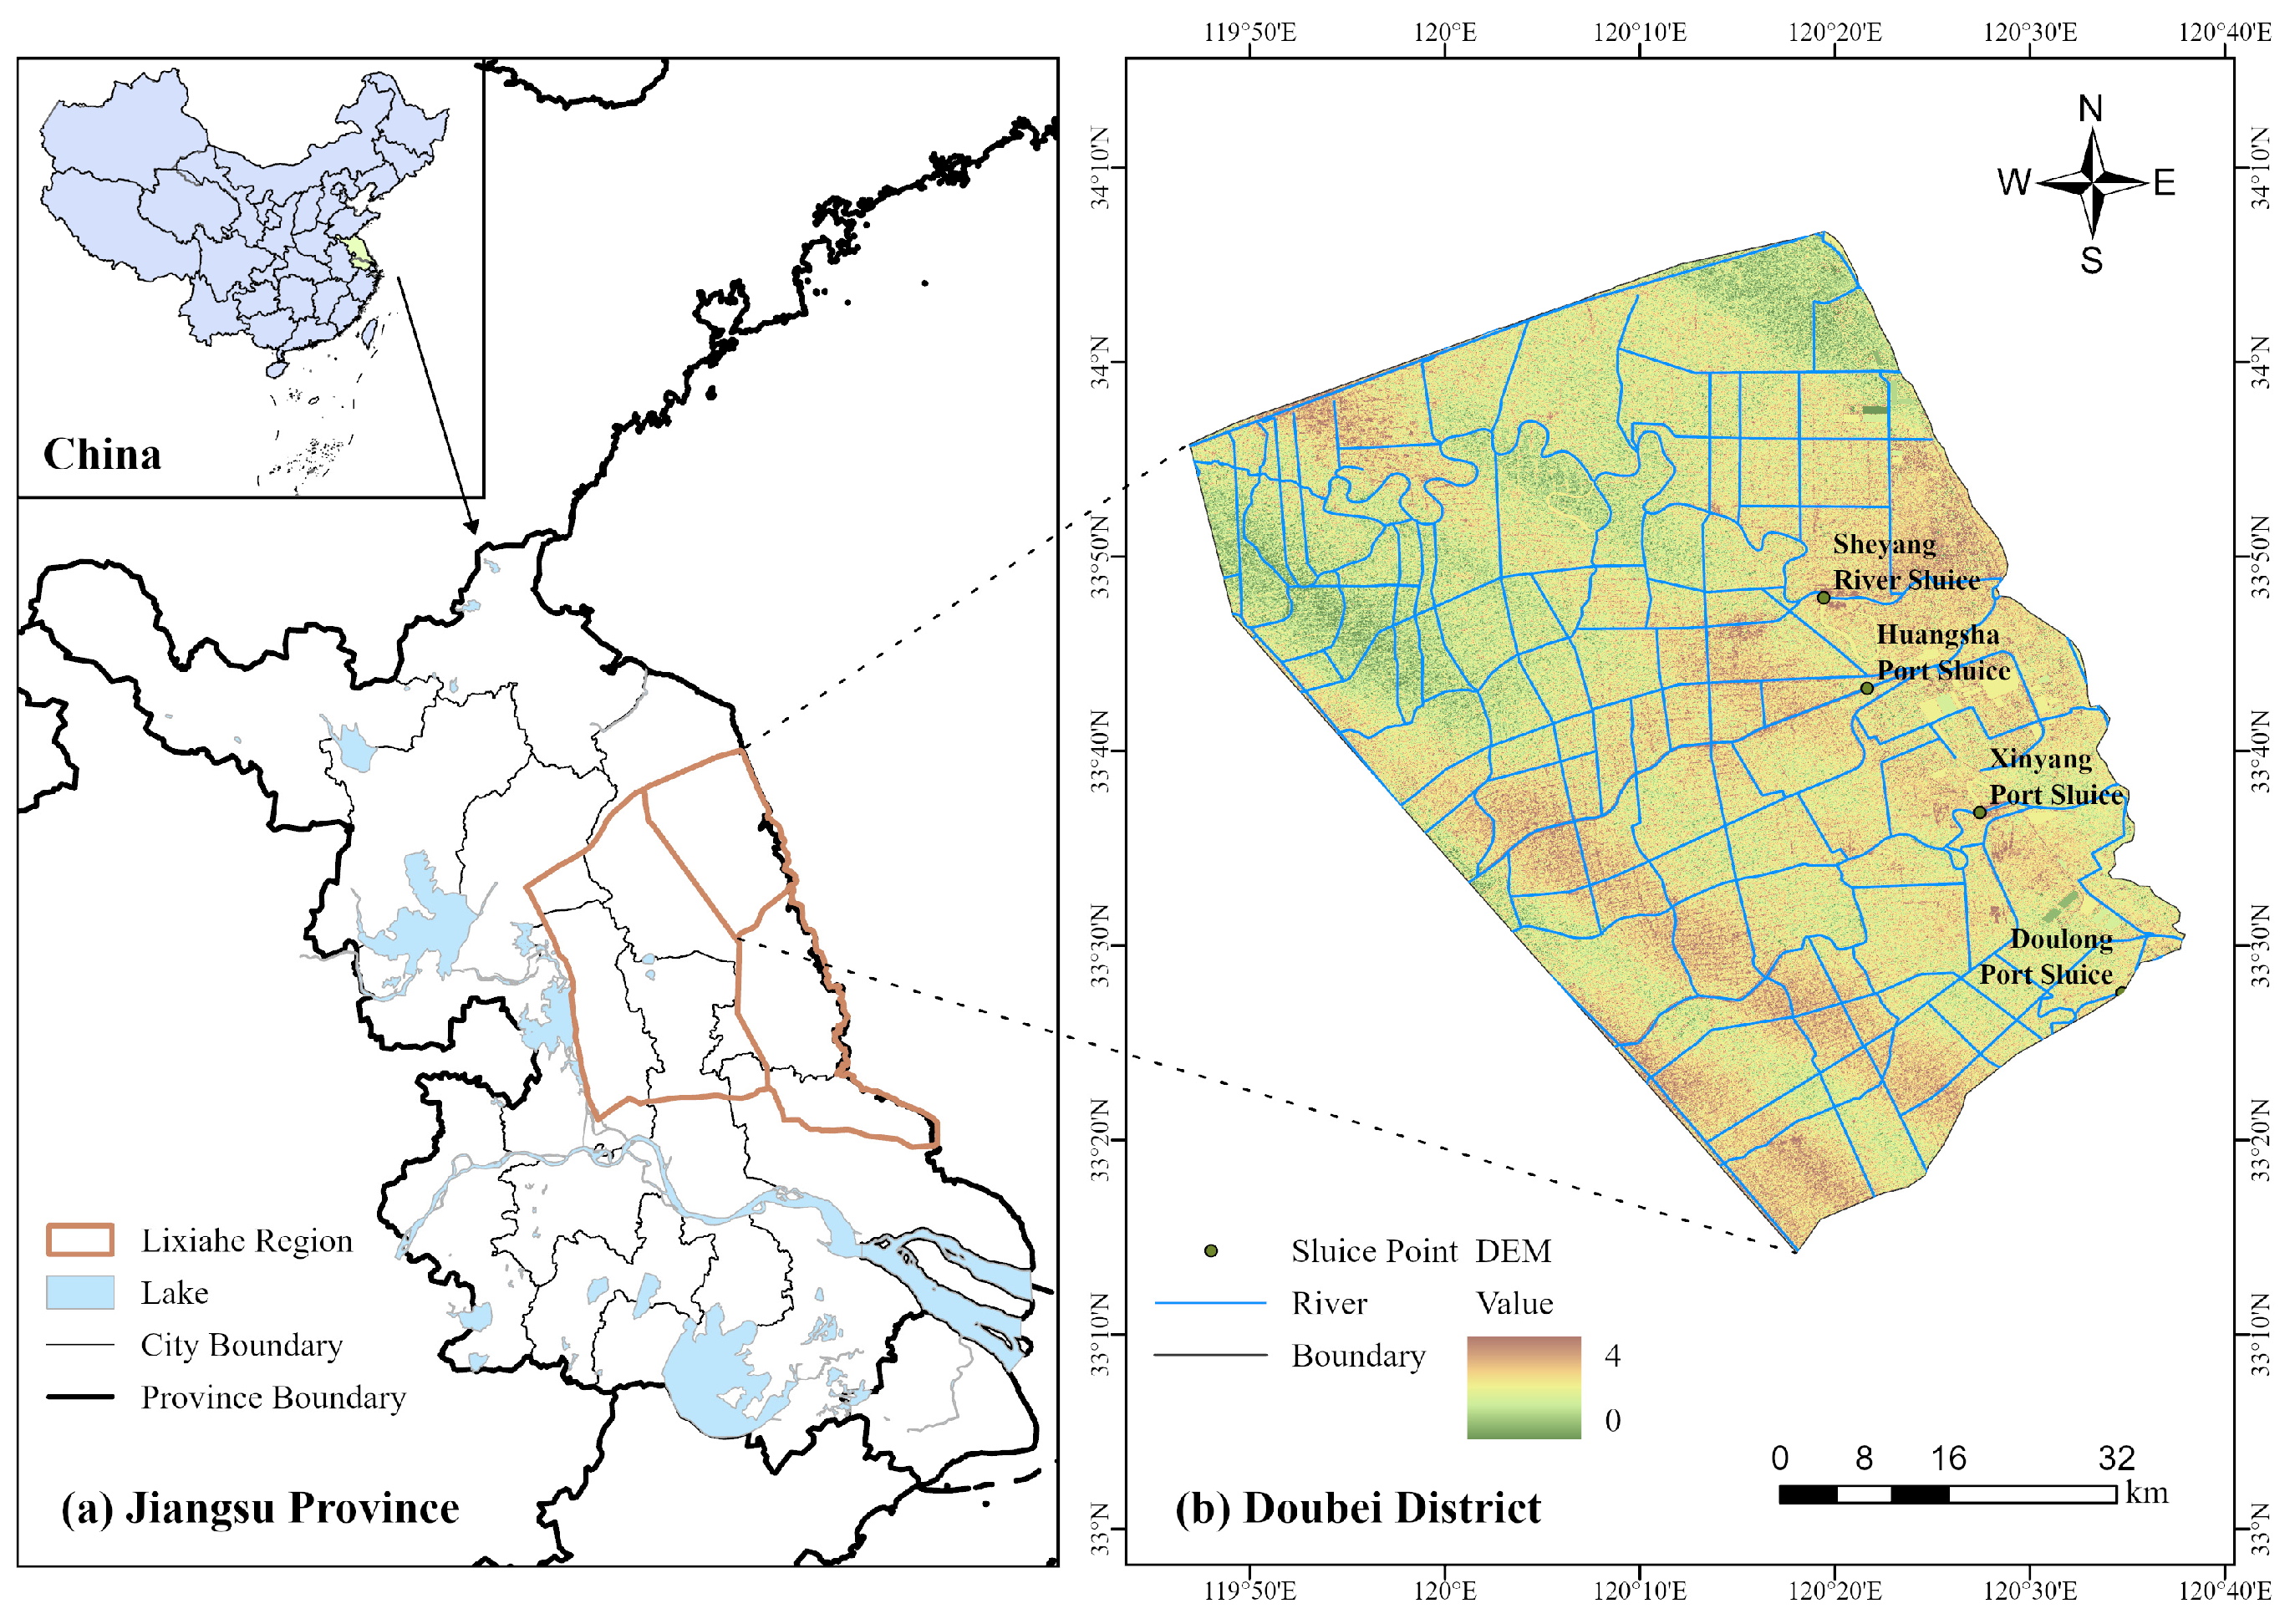
2. Study Area
3. Methods and Principles
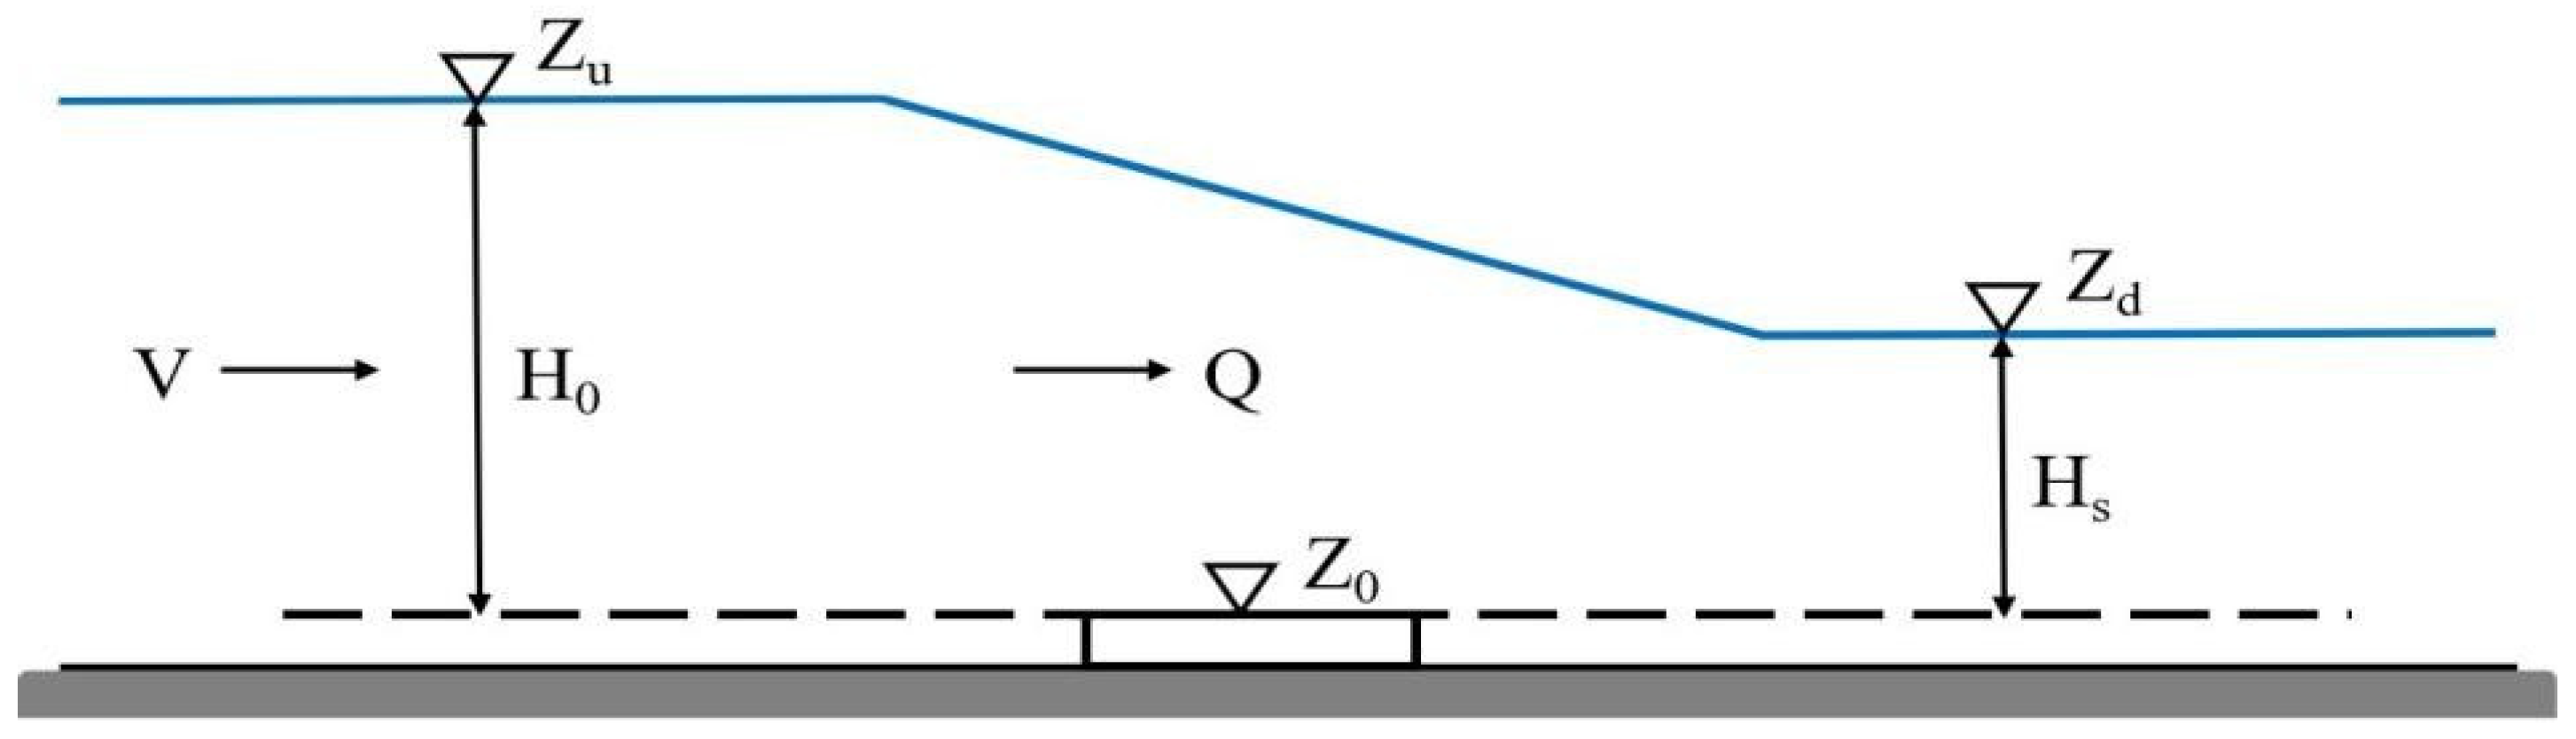
3.1. Traditional Weir Gate Flow Formulas
3.2. Dynamic Trends Calculation of Flow Discharge Through Weir Gate Structures
4. Results
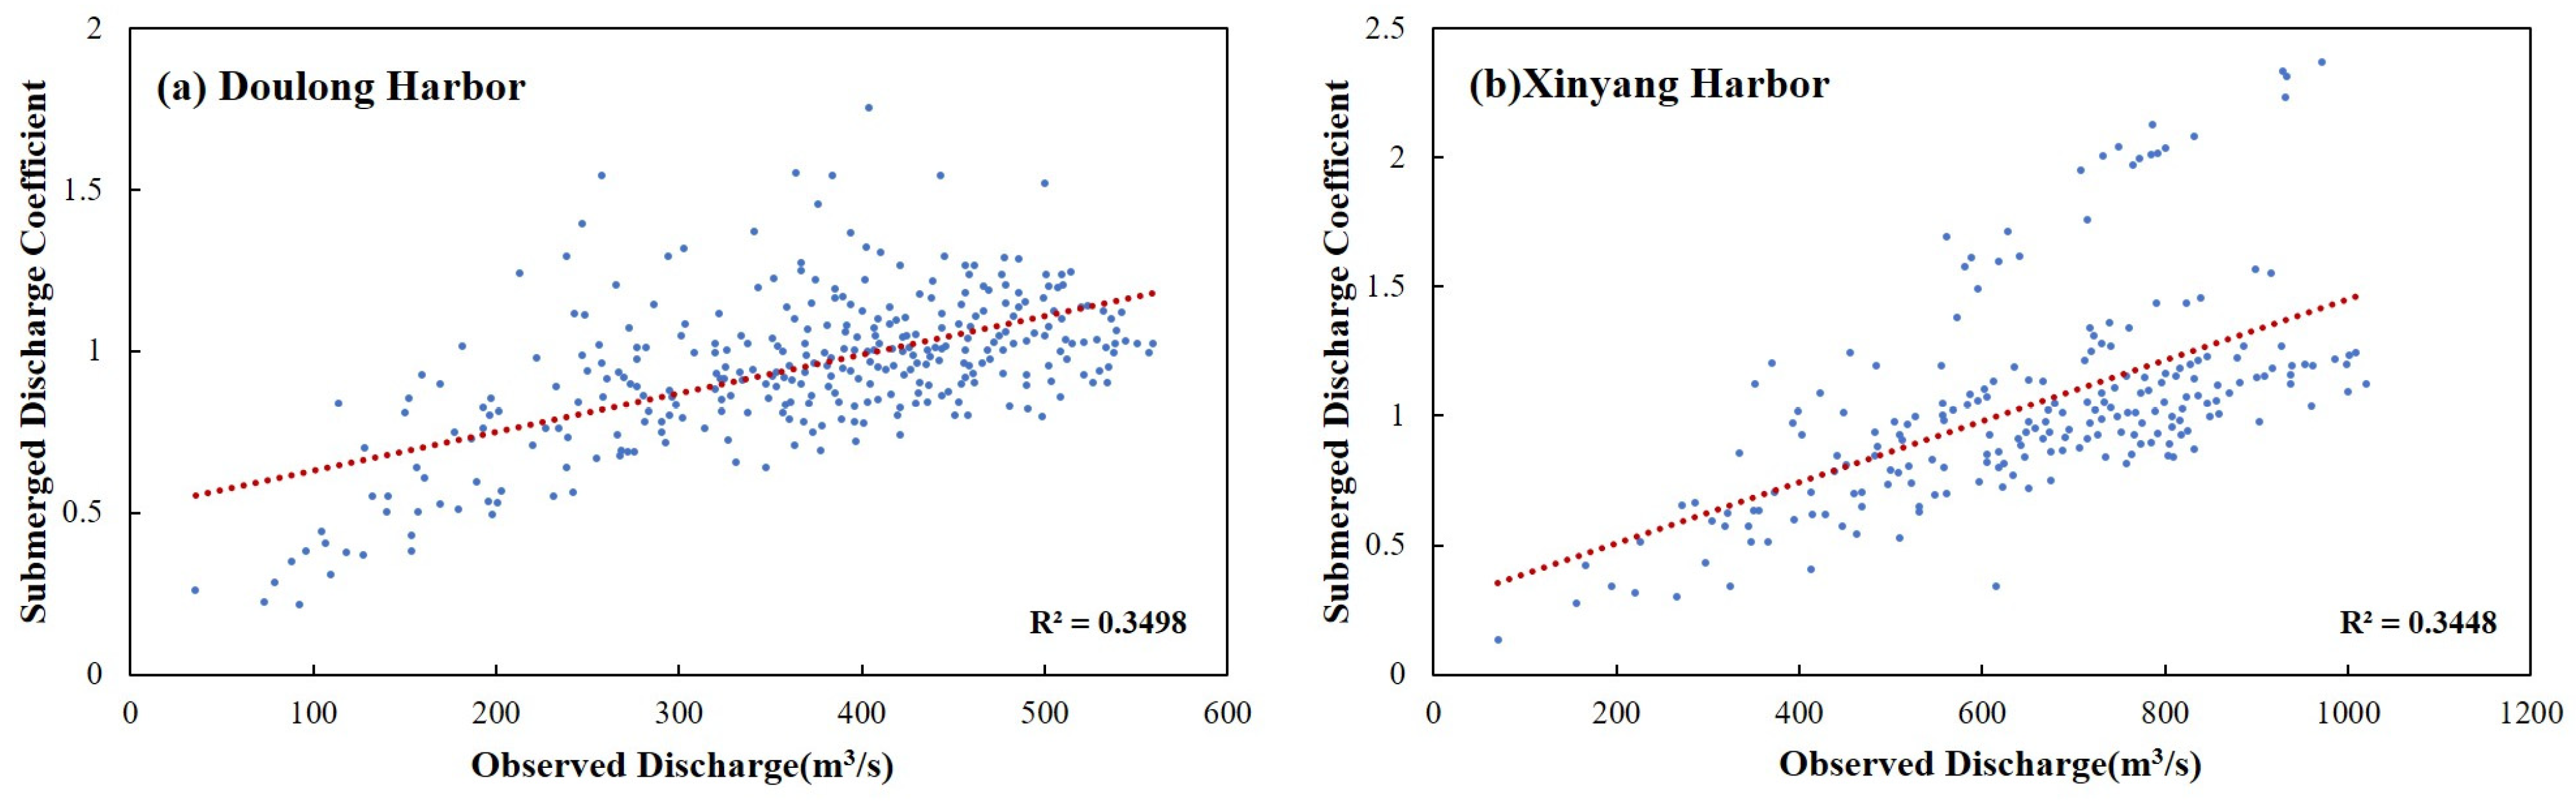
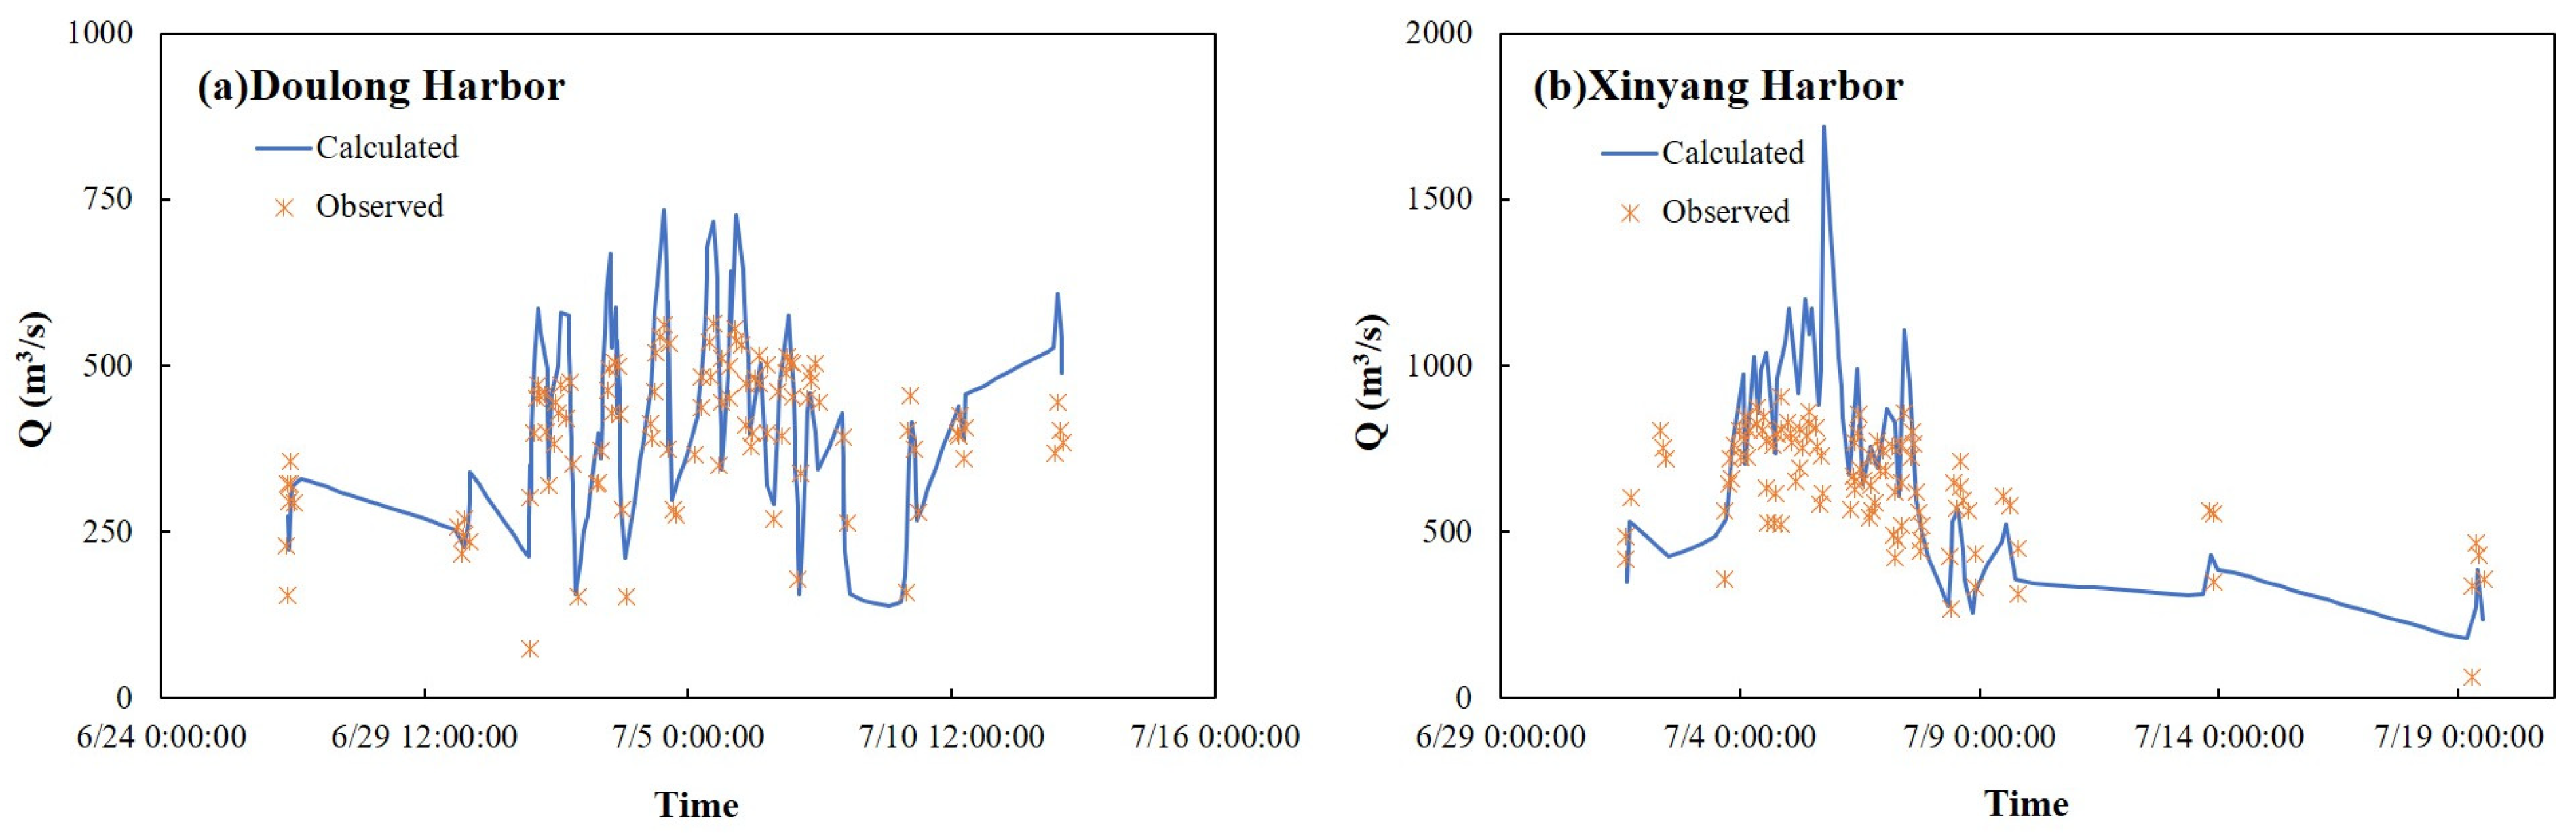
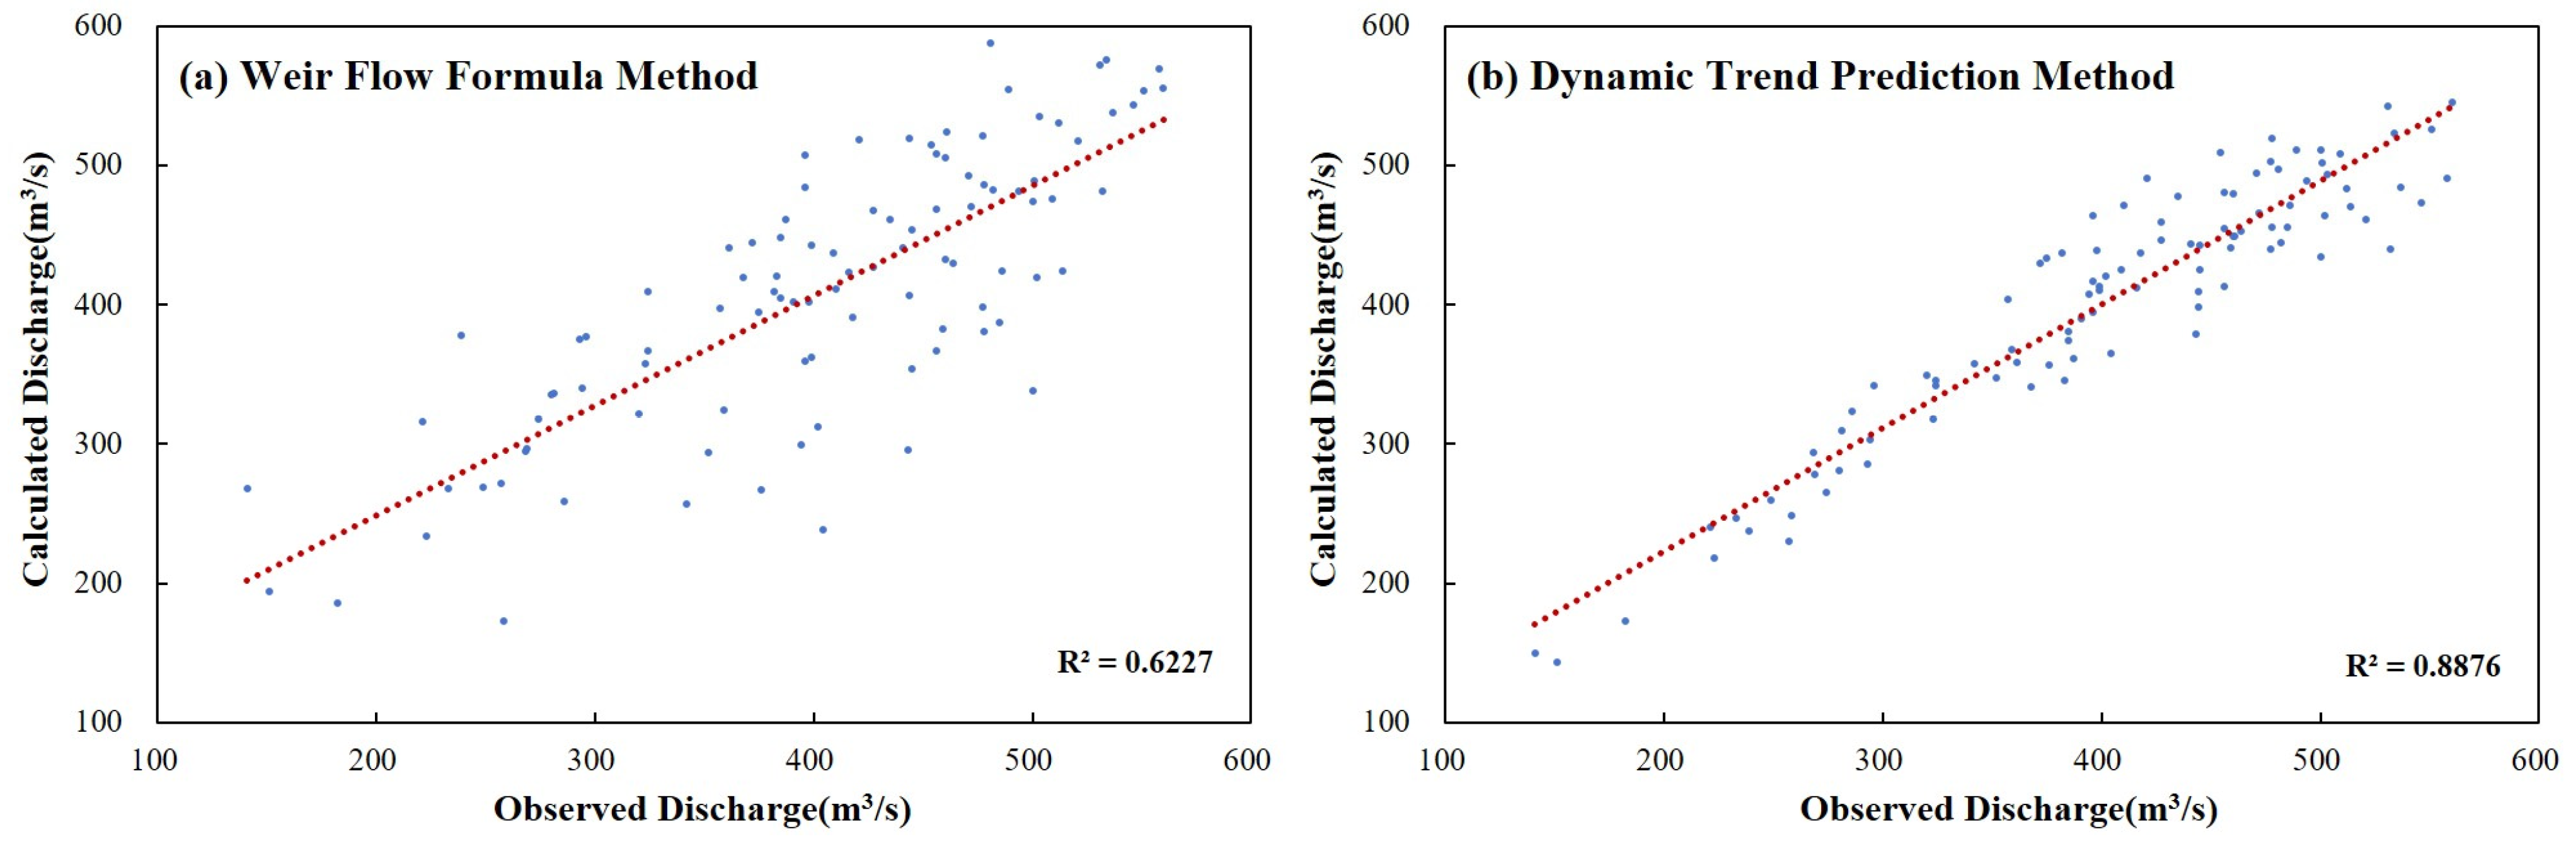
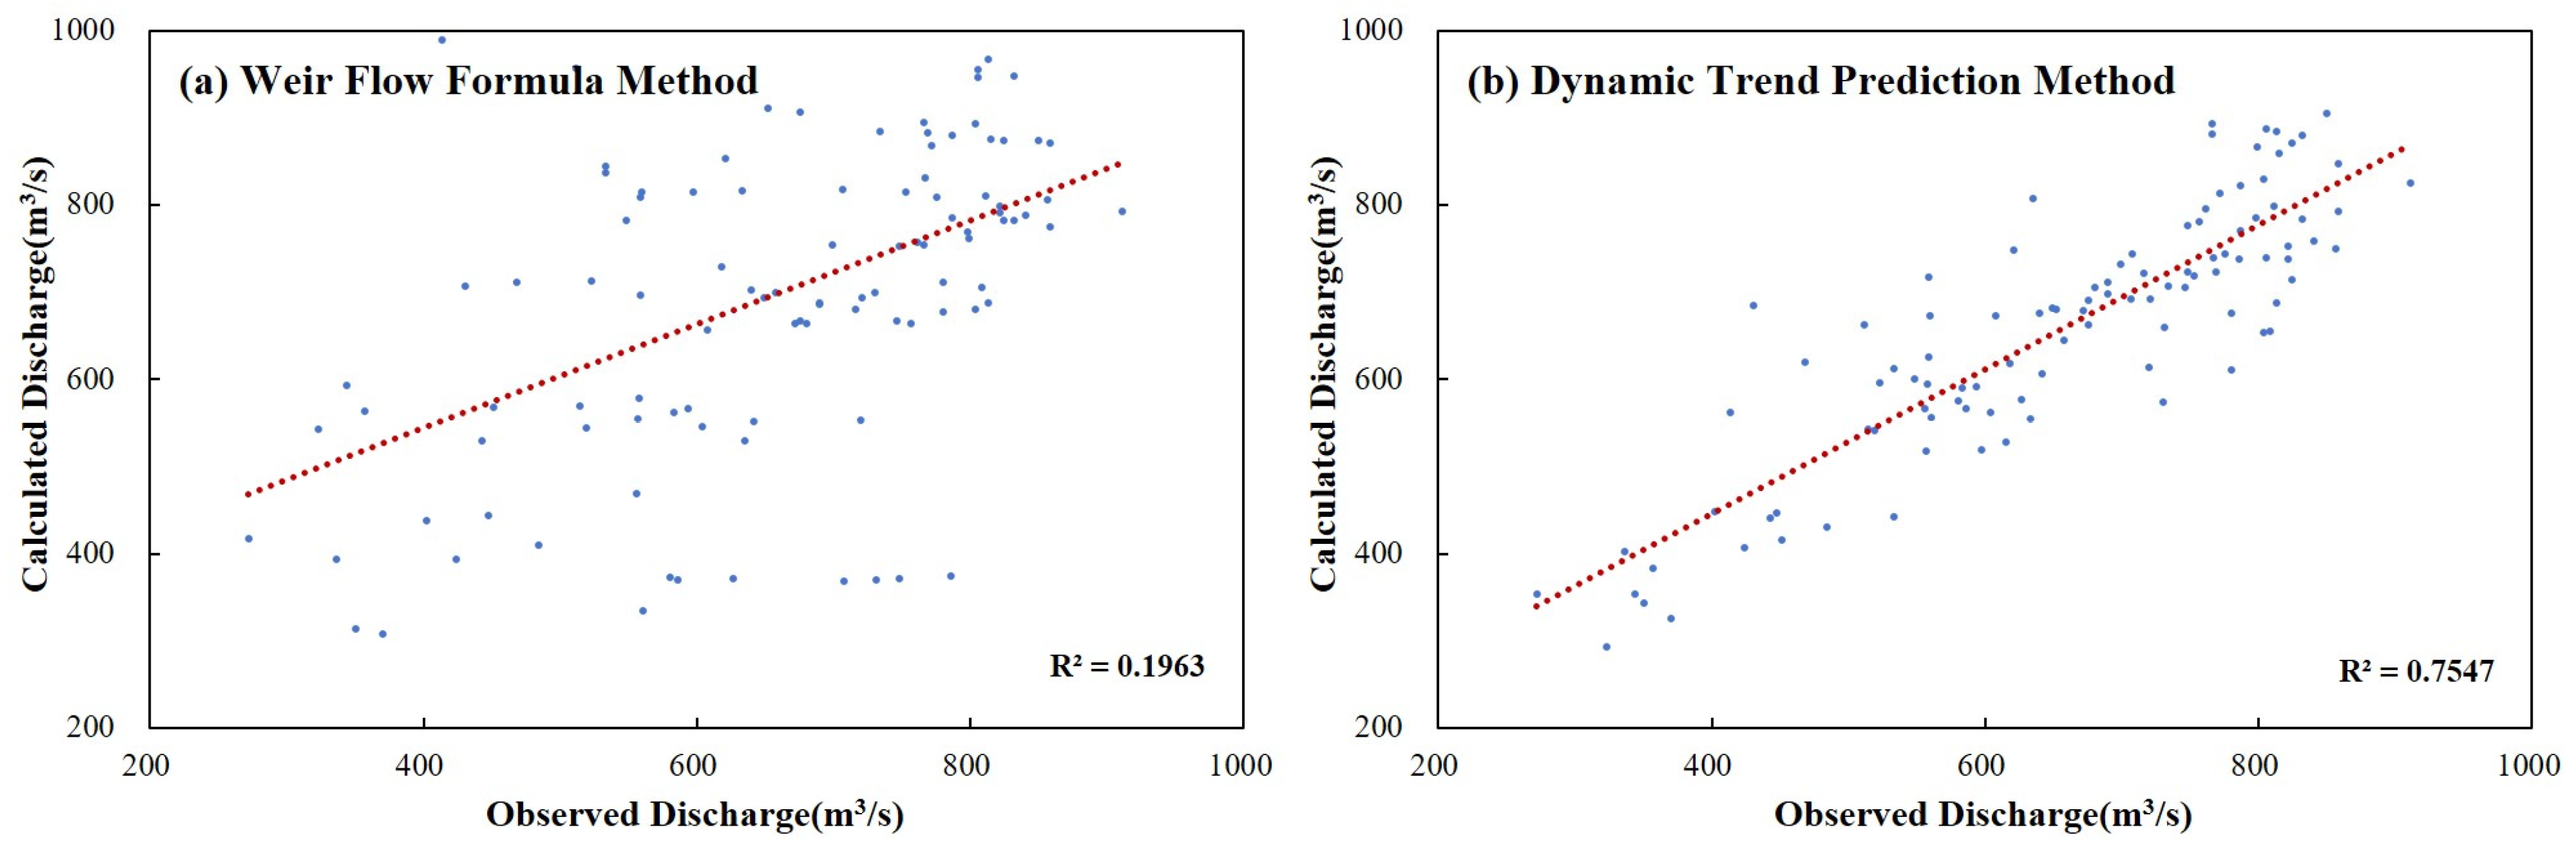
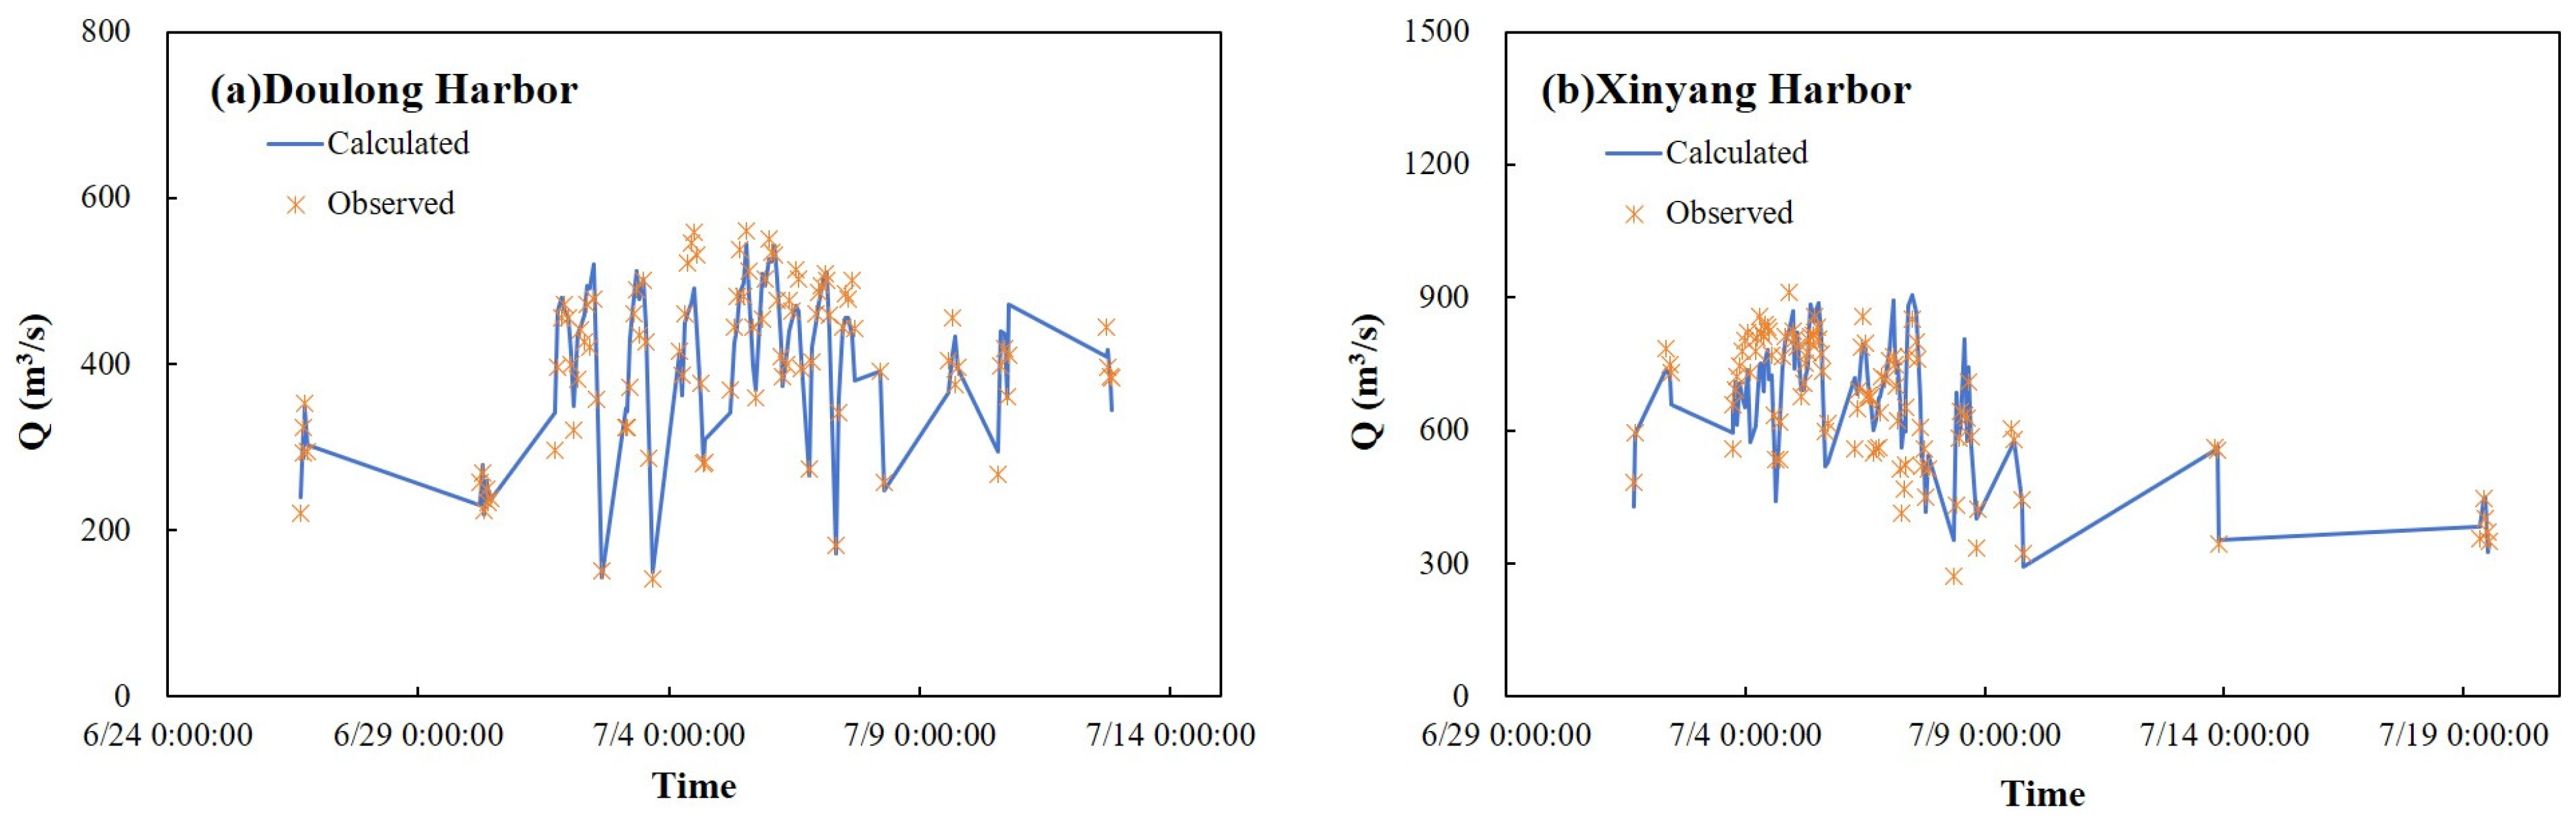
4.1. Traditional Static Weir Flow Formula Method
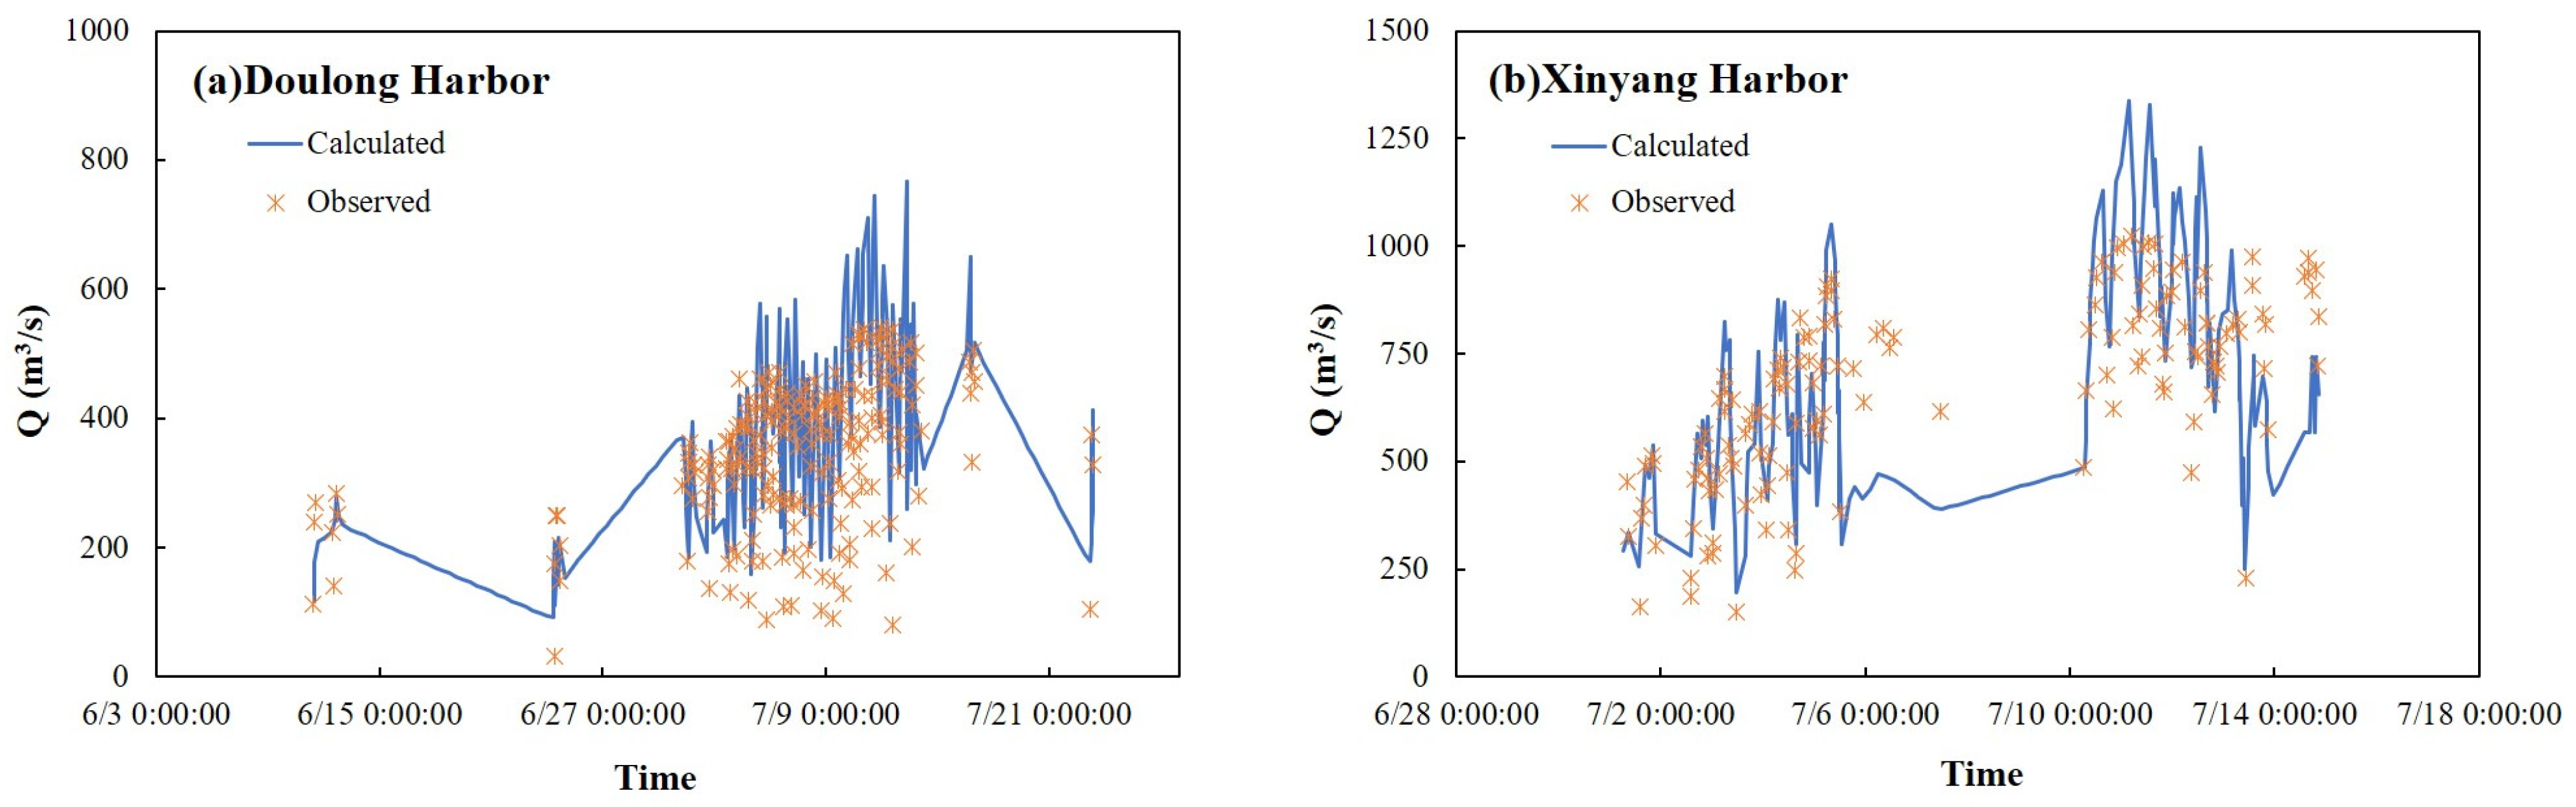
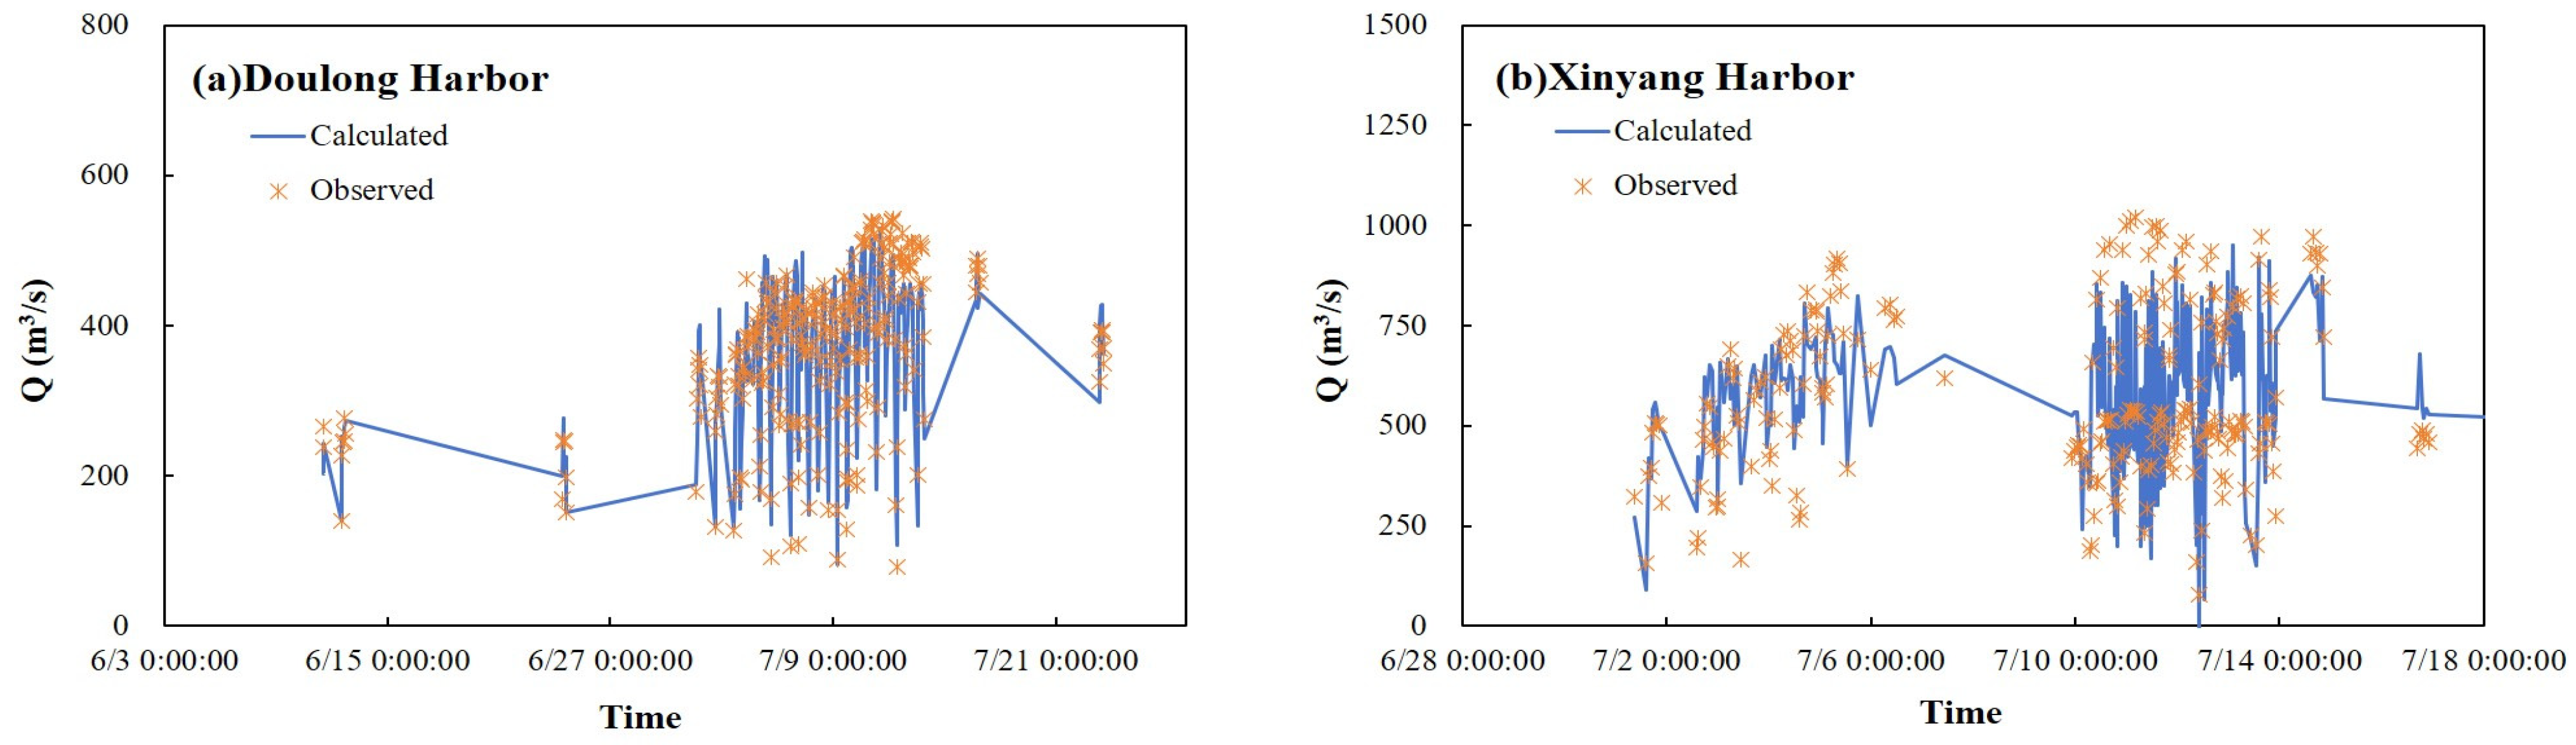
4.2. BP Neural Network-Based Dynamic Trend Prediction Method (DTPM)
4.3. Calculation Results of Gate Opening and Closing Moments
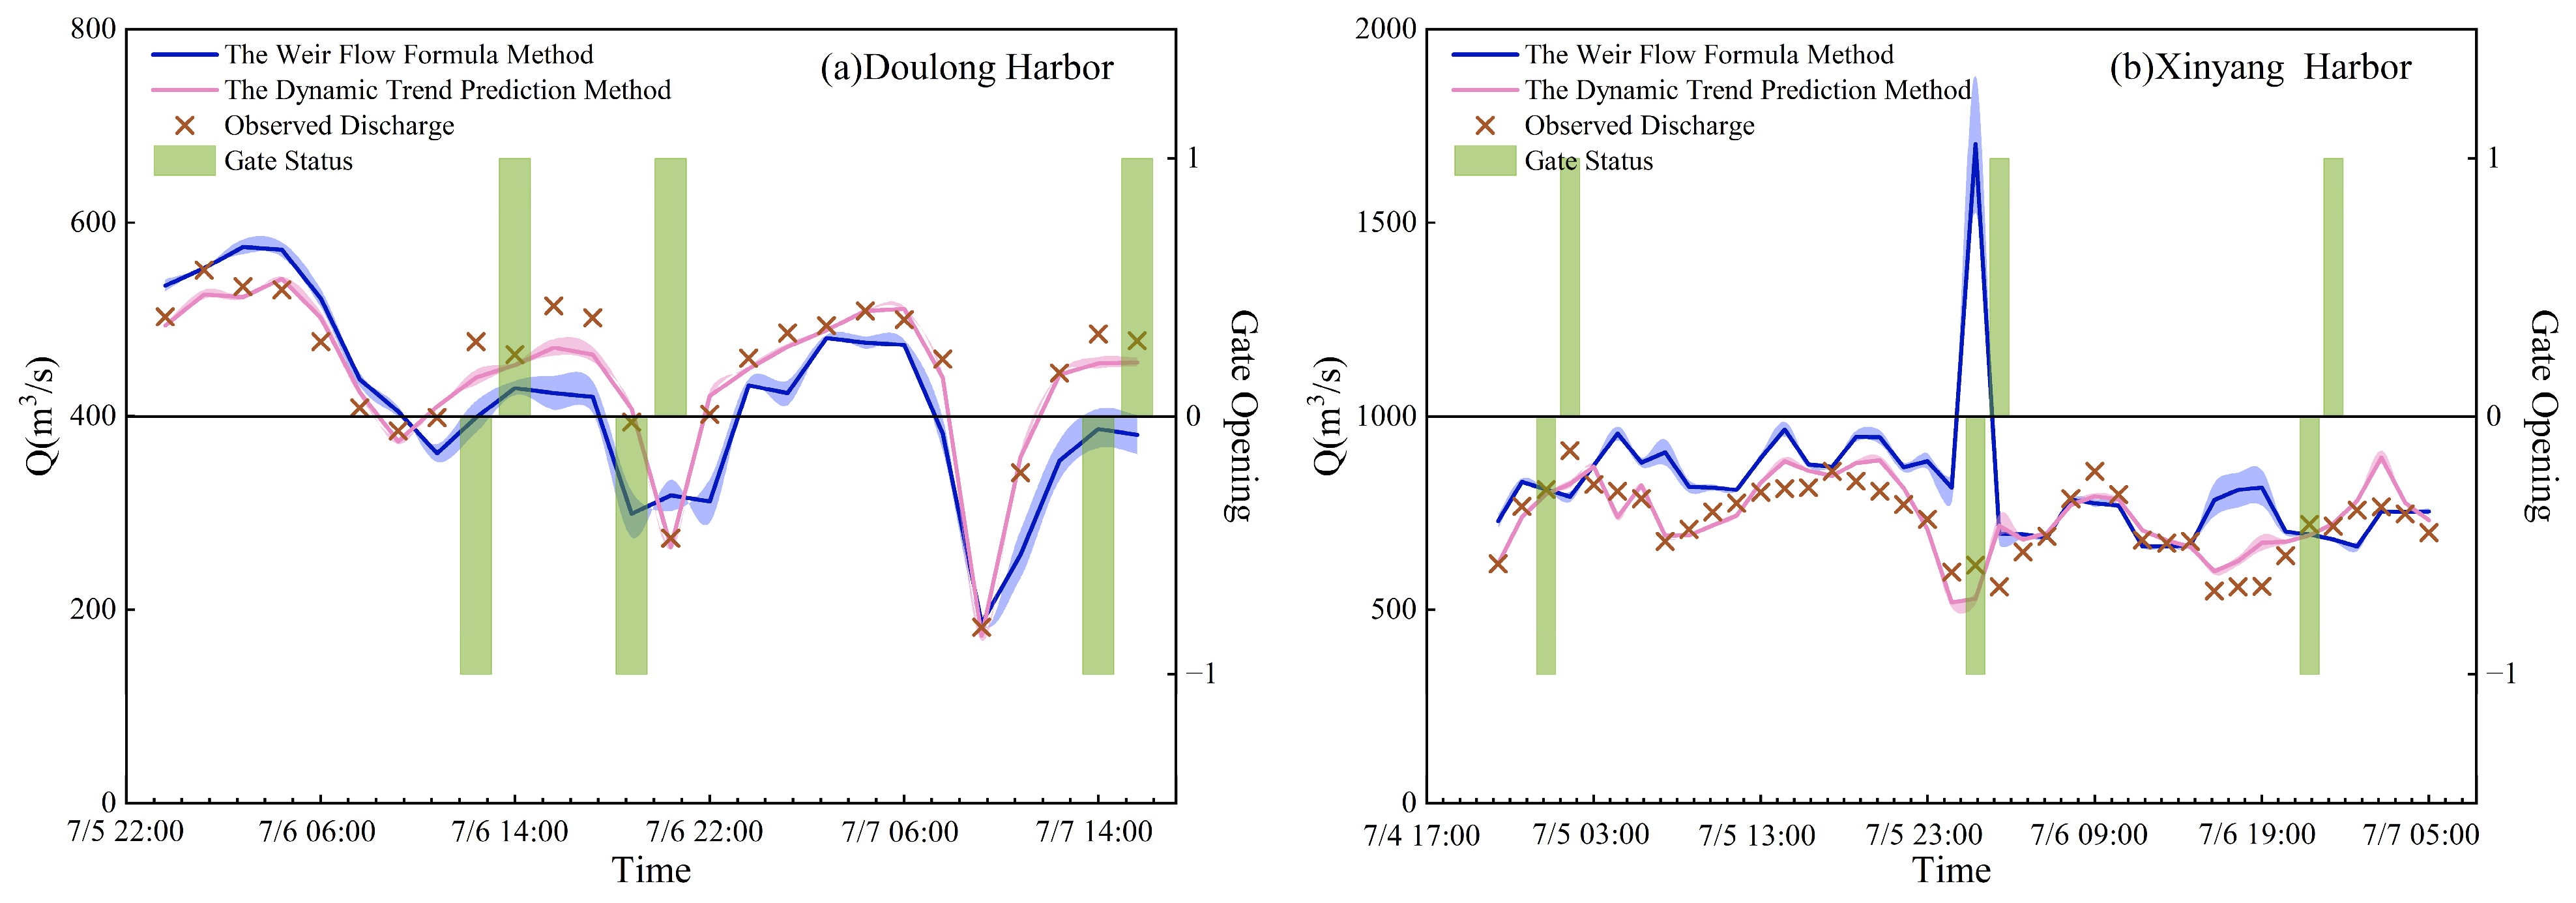
4.4. Comparative Analysis of Computational Results Under Defined Operational Scenarios
5. Discussion
6. Conclusions
Author Contributions
Funding
Data Availability Statement
Conflicts of Interest
Abbreviations
| DTPM | Dynamic trend prediction method |
References
- Wang, W.; Li, Y.; Du, W.; Zeng, W.; Xu, Y. Tidal variation features of tidal reach of Changjiang River. Water Resour. Prot. 2017, 33, 121–124. [Google Scholar] [CrossRef]
- Gu, S.; Li, Q. Study on layout of hydrologic network in the Changjiang estuary. J. East China Norm. Univ. (Nat. Sci.) 2015, 4, 1–6. [Google Scholar] [CrossRef]
- Scarlatos, P.D.; Ansar, M.; Chen, Z. Flow estimations through spillways under submerged tidal conditions. In Proceedings of the Computational Methods and Experimental Measurements XIII, Prague, Czech Republic, 2–4 July 2007; pp. 137–146. [Google Scholar]
- Gu, Z.; Li, R. Study on calculation model of tidal sluice discharge based on ANN. Ocean Eng. 2007, 25, 109–114. [Google Scholar] [CrossRef]
- Salmasi, F.; Abraham, J. Prediction of discharge coefficients for sluice gates equipped with different geometric sills under the gate using multiple non-linear regression (MNLR). J. Hydrol. 2021, 597, 125728. [Google Scholar] [CrossRef]
- Sadan, P.; Ghare, A.D.; Lade, A.D.; Vasudeo, A.D. Discharge prediction model for flow through differential weir-gate structures. Flow Meas. Instrum. 2025, 102, 102798. [Google Scholar] [CrossRef]
- Yousif, A.A.; Sulaiman, S.O.; Diop, L.; Ehteram, M.; Shahid, S.; Al-Ansari, N.; Yaseen, Z.M. Open Channel Sluice Gate Scouring Parameters Prediction: Different Scenarios of Dimensional and Non-Dimensional Input Parameters. Water 2019, 11, 353. [Google Scholar] [CrossRef]
- Maxwell, R.M.; Condon, L.E.; Melchior, P. A physics-informed, machine learning emulator of a 2d surface water model: What temporal networks and simulation-based inference can help us learn about hydrologic processes. Water 2021, 13, 3633. [Google Scholar] [CrossRef]
- Wang, Y.; Wang, C.; Wang, N.; Chen, J.; Xu, Q. Application of BP Neural Network in Tidal River Hydrodynamic Flood Forecasting. Water Power 2016, 42, 21–25. [Google Scholar] [CrossRef]
- Zhang, Z.; Zhang, L.; Yue, S.; Wu, J.; Guo, F. Correction of nonstationary tidal prediction using deep-learning neural network models in tidal estuaries and rivers. J. Hydrol. 2023, 622, 129686. [Google Scholar] [CrossRef]
- Wang, H.; Grisouard, N.; Salehipour, H.; Nuz, A.; Poon, M.; Ponte, A.L. A Deep Learning Approach to Extract Internal Tides Scattered by Geostrophic Turbulence. Geophys. Res. Lett. 2022, 49, e2022GL099400. [Google Scholar] [CrossRef]
- Zhang, Y.; Zhou, Z.; Deng, Y.; Pan, D.; Van Griensven The, J.; Yang, S.X.; Gharabaghi, B. Daily Streamflow Forecasting Using Networks of Real-Time Monitoring Stations and Hybrid Machine Learning Methods. Water 2024, 16, 1284. [Google Scholar] [CrossRef]
- Li, B.; Sun, T.; Tian, F.; Ni, G. Enhancing process-based hydrological models with embedded neural networks: A hybrid approach. J. Hydrol. 2023, 625, 130107. [Google Scholar] [CrossRef]
- Wang, Z.; Lyu, H.; Fu, G.; Zhang, C. Time-guided convolutional neural networks for spatiotemporal urban flood modelling. J. Hydrol. 2024, 645, 132250. [Google Scholar] [CrossRef]
- Feinstein, J.; Ploussard, Q.; Veselka, T.; Yan, E. Using Data-Driven Prediction of Downstream 1D River Flow to Overcome the Challenges of Hydrologic River Modeling. Water 2023, 15, 3843. [Google Scholar] [CrossRef]
- Majchrzak, M.; Marciniak-Lukasiak, K.; Lukasiak, P. A Survey on the Application of Machine Learning in Turbulent Flow Simulations. Energies 2023, 16, 1755. [Google Scholar] [CrossRef]
- Mei, X.; Smith, P.K. A comparison of in-sample and out-of-sample model selection approaches for artificial neural network (Ann) daily streamflow simulation. Water 2021, 13, 2525. [Google Scholar] [CrossRef]
- Yang, K.; Yuan, W.; Zhao, J.; Xu, S. Stream Structure Characteristics and Its Urbanization Responses to Tidal River System. Acta Geogr. Sin. 2004, 4, 557–564. [Google Scholar] [CrossRef]
- Liang, Y.; Liao, W.; Zhang, Z.; Li, H.; Wang, H. Using a multiphysics coupling-oriented flood modelling approach to assess urban flooding under various regulation scenarios combined with rainstorms and tidal effects. J. Hydrol. 2024, 645, 132189. [Google Scholar] [CrossRef]
- Su, C.; Wang, P.; Yuan, W.; Cheng, C.; Zhang, T.; Yan, D.; Wu, Z. An MILP based optimization model for reservoir flood control operation considering spillway gate scheduling. J. Hydrol. 2022, 613, 128483. [Google Scholar] [CrossRef]
- Martinez, S.I.; Merwade, V.; Maidment, D. Linking GIS, hydraulic modeling, and tabu search for optimizing a water level-monitoring network in South Florida. J. Water Resour. Plan. Manag. 2010, 136, 167–176. [Google Scholar] [CrossRef]
- Zhang, Y.; Mao, Y.; Huang, H.; Lan, L.; Lu, N. Water Quality Simulation and Improvement under the Combined Scheduling of Sluice Gates and Pumps in the Lixia River Area. In Proceedings of the 7th International Conference on Hydraulic and Civil Engineering and Smart Water Conservancy and Intelligent Disaster Reduction Forum, ICHCE and SWIDR 2021, Nanjing, China, 6–8 November 2021; pp. 1801–1805. [Google Scholar]
- Sheikhi, S.; Kostakos, P. A Novel Anomaly-Based Intrusion Detection Model Using PSOGWO-Optimized BP Neural Network and GA-Based Feature Selection. Sensors 2022, 22, 9318. [Google Scholar] [CrossRef] [PubMed]
- Kerebih, M.S.; Keshari, A.K. Prediction of groundwater level using artificial neural network as an alternative approach: A comparison assessment with numerical groundwater flow model. Hydrol. Sci. J. 2024, 69, 1691–1701. [Google Scholar] [CrossRef]
- Ge, J.; Lei, G.; Chen, H.; Zhang, B.; Chen, L.; Bai, M.; Su, N.; Yu, Z. Irrigation district channel dispatch flow prediction based on SHAP importance ranking and machine learning algorithm. Nongye Gongcheng Xuebao/Trans. Chin. Soc. Agric. Eng. 2023, 39, 113–122. [Google Scholar] [CrossRef]

| The Doulong Harbor | The Xinyang Harbor | ||
|---|---|---|---|
| Submerged Discharge Coefficients | Observed Discharge /(m3/s) | Submerged Discharge Coefficients | Observed Discharge /(m3/s) |
| 0.64 | 100 | 0.69 | 350 |
| 0.7 | 150 | 0.75 | 400 |
| 0.76 | 200 | 0.81 | 450 |
| 0.82 | 250 | 0.87 | 500 |
| 0.88 | 300 | 0.93 | 550 |
| 0.94 | 350 | 0.99 | 600 |
| 1 | 400 | 1.05 | 650 |
| 1.06 | 450 | 1.11 | 700 |
| 1.12 | 500 | 1.17 | 750 |
| 1.18 | 550 | 1.23 | 800 |
| 1.24 | 600 | 1.29 | 850 |
| 1.3 | 650 | 1.35 | 900 |
| 1.36 | 700 | 1.41 | 950 |
| 1.42 | 750 | 1.47 | 1000 |
| 1.48 | 800 | 1.53 | 1050 |
| Time | Q (m3/s) | Zu(m) | Zd(m) | φ0 |
|---|---|---|---|---|
| 2003/6/11 11:41 | 114 | 0.8 | 0.79 | 0.8493 |
| 2003/6/11 12:41 | 239 | 0.67 | 0.65 | 1.3073 |
| 2003/6/11 13:41 | 266 | 0.58 | 0.55 | 1.2214 |
| 2003/6/12 12:45 | 140 | 0.89 | 0.85 | 0.5134 |
| 2003/6/12 13:31 | 227 | 0.75 | 0.7 | 0.7747 |
| 2003/6/12 14:31 | 245 | 0.65 | 0.6 | 0.8593 |
| 2003/6/12 15:31 | 277 | 0.58 | 0.53 | 0.9908 |
| 2003/6/12 16:40 | 247 | 0.53 | 0.49 | 0.9991 |
| 2003/6/12 17:31 | 256 | 0.51 | 0.47 | 1.0415 |
| Time | Zu/m | Zd/m | /(m/s) | /(m/s) | /(m/s) | /(m3/s2) |
|---|---|---|---|---|---|---|
| 2003/6/11 12:41 | 0.67 | 0.65 | −3.12 | −3.36 | 0.72 | 3000.00 |
| 2003/6/11 13:41 | 0.58 | 0.55 | −2.16 | −2.40 | 1.20 | 648.00 |
| 2003/6/12 12:45 | 0.89 | 0.85 | 0.32 | 0.31 | 0.07 | −131.10 |
| 2003/6/12 13:31 | 0.75 | 0.7 | −4.38 | −4.70 | 2.82 | 2723.48 |
| 2003/6/12 14:31 | 0.65 | 0.6 | −2.40 | −2.40 | 2.40 | 432.00 |
| 2003/6/12 15:31 | 0.58 | 0.53 | −1.68 | −1.68 | 2.40 | 768.00 |
| 2003/6/12 16:40 | 0.53 | 0.49 | −1.04 | −0.83 | 1.88 | −626.09 |
| 2003/6/12 17:31 | 0.51 | 0.47 | −0.56 | −0.56 | 2.26 | 254.12 |
| Parameter | Value |
|---|---|
| Input/Output Layer Activation Function | Double Sigmoid Cutoff Function |
| Training Method | High-Precision Processing Method |
| Hidden Layer Neuron Count | 5 |
| Network Connection Rate | 1.0 |
| Learning Rate | 0.7 |
| Training Coefficient Precision | 0.001 |
| Maximum Training Iterations | 10,000 |
| Momentum Factor | 0.5 |
| Harbor | Average | Standard Deviation (m3/s) |
|---|---|---|
| Doulong Harbor | 5.96% | 0.052 |
| Huangsha Harbor | 6.43% | 0.074 |
| Sheyang River | 13.95% | 0.146 |
| Xinyang Harbor | 9.57% | 0.089 |
| Statistical Results | The Sheyang River Gate | The Huangsha Harbor Gate | The Doulong Harbor Gate | The Xinyang Harbor Gate |
|---|---|---|---|---|
| Observed Average Discharge/(m3/s) | 971 | 379 | 372 | 662 |
| Standard Deviation of Discharge/(m3/s) | 235 | 101 | 71 | 178 |
| the Relative Error of the Maximum Discharge | 47% | 75% | 37% | 70% |
| the Relative Error of the Average Discharge | 9% | 5% | 16% | 8% |
| Station Name | 2003 | 2006 | ||||||
|---|---|---|---|---|---|---|---|---|
| Correlation Coefficient | Relative Error | Correlation Coefficient | Relative Error | |||||
| (a) | (b) | (a) | (b) | (a) | (b) | (a) | (b) | |
| The Sheyang River Gate | 0.48 | 0.83 | 9.71% | 2.61% | 0.06 | 0.91 | 19.77% | 2.43% |
| The Huangsha Harbor Gate | −0.05 | 0.77 | 11.82% | 1.70% | 0.11 | 0.56 | 6.53% | 1.03% |
| The Xinyang Harbor Gate | −0.26 | 0.75 | 36.00% | 5.69% | 0.44 | 0.87 | 9.24% | 1.33% |
| The Doulong Harbor Gate | 0.72 | 0.90 | 8.15% | 2.02% | 0.79 | 0.94 | 3.39% | 0.51% |
| Average | 0.22 | 0.81 | 16.42% | 3.00% | 0.35 | 0.82 | 9.73% | 1.32% |
| Station Name | Juncture | Gate Operation | Observed Discharge /(m3/s) | Weir Flow Formula Method | Dynamic Trend Prediction Method | ||
|---|---|---|---|---|---|---|---|
| Calculated Discharge /(m3/s) | Relative Error | Calculated Discharge /(m3/s) | Relative Error | ||||
| The Doulong Harbor | 2006/7/6 12:35 | close | 477 | 399 | −16.43% | 440 | −7.80% |
| 2006/7/6 14:07 | open | 464 | 429 | −7.45% | 453 | −2.38% | |
| 2006/7/6 19:35 | close | 394 | 299 | −24.06% | 408 | 3.53% | |
| 2006/7/6 21:34 | open | 274 | 318 | 16.18% | 265 | −3.11% | |
| 2006/7/7 14:00 | close | 485 | 387 | −20.19% | 455 | −6.09% | |
| 2006/7/7 15:02 | open | 478 | 381 | −20.40% | 456 | −4.59% | |
| The Xinyang Harbor | 2006/7/5 00:40 | close | 811 | 811 | −0.05% | 799 | −1.51% |
| 2006/7/5 02:00 | open | 911 | 792 | −13.04% | 825 | −9.45% | |
| 2006/7/5 02:10 | close | 615 | 1703 | 176.88% | 529 | −14.06% | |
| 2006/7/6 05:40 | open | 559 | 697 | 24.63% | 717 | 28.28% | |
| 2006/7/6 22:30 | close | 721 | 694 | −3.74% | 692 | −4.04% | |
| 2006/7/6 23:14 | open | 716 | 681 | −4.92% | 722 | 0.87% | |
| Scenario | Doulong Harbor | Xinyang Harbor | ||||||
|---|---|---|---|---|---|---|---|---|
| DTPM | Weir Flow Formula Method | DTPM | Weir Flow Formula Method | |||||
| Mean Relative Error | Standard Deviation/m | Mean Relative Error | Standard Deviation/m | Mean Relative Error | Standard Deviation/m | Mean Relative Error | Standard Deviation/m | |
| High Water Level | 8.98% | 0.04 | 15.27% | 0.09 | 4.80% | 0.03 | 13.18% | 0.09 |
| Low Water Level | 6.03% | 0.04 | 17.90% | 0.08 | 4.86% | 0.05 | 27.95% | 0.26 |
| Rapid Gate Opening | 5.66% | 0.03 | 11.95% | 0.11 | 6.64% | 0.02 | 8.42% | 0.09 |
| Slow Gate Opening | 2.68% | 0.01 | 12.49% | 0.08 | 11.50% | 0.10 | 28.89% | 0.15 |
| Station Name | Z0/(m) | B/(m) | Number of Gate Openings | Average of Zu/(m) |
|---|---|---|---|---|
| The Doulong Harbor Gate | 3 | 80 | 8 | 1.71 |
| The Xinyang Harbor Gate | 3.5 | 170 | 17 | 1.60 |
| Station Name | 2003 | 2006 | ||
|---|---|---|---|---|
| DTPM | Weir Flow Formula Method | DTPM | Weir Flow Formula Method | |
| The Doulong Harbor Gate | [0.495, 0.525]% | [3.353, 3.427]% | [2.000, 2.040]% | [8.101, 8.199]% |
| The Xinyang Harbor Gate | [1.305, 1.355]% | [9.174, 9.306]% | [5.645, 5.735]% | [35.904, 36.096]% |
Disclaimer/Publisher’s Note: The statements, opinions and data contained in all publications are solely those of the individual author(s) and contributor(s) and not of MDPI and/or the editor(s). MDPI and/or the editor(s) disclaim responsibility for any injury to people or property resulting from any ideas, methods, instructions or products referred to in the content. |
© 2025 by the authors. Licensee MDPI, Basel, Switzerland. This article is an open access article distributed under the terms and conditions of the Creative Commons Attribution (CC BY) license (https://creativecommons.org/licenses/by/4.0/).
Share and Cite
Zhang, T.; Jin, J.; Qian, Y.; Wang, C.; Chen, G. Research on Dynamic Trend Prediction Method for Flow Discharge Through Harbor Gates in Tidal Reaches. Water 2025, 17, 1248. https://doi.org/10.3390/w17091248
Zhang T, Jin J, Qian Y, Wang C, Chen G. Research on Dynamic Trend Prediction Method for Flow Discharge Through Harbor Gates in Tidal Reaches. Water. 2025; 17(9):1248. https://doi.org/10.3390/w17091248
Chicago/Turabian StyleZhang, Tianshu, Jie Jin, Yixiao Qian, Chuanhai Wang, and Gang Chen. 2025. "Research on Dynamic Trend Prediction Method for Flow Discharge Through Harbor Gates in Tidal Reaches" Water 17, no. 9: 1248. https://doi.org/10.3390/w17091248
APA StyleZhang, T., Jin, J., Qian, Y., Wang, C., & Chen, G. (2025). Research on Dynamic Trend Prediction Method for Flow Discharge Through Harbor Gates in Tidal Reaches. Water, 17(9), 1248. https://doi.org/10.3390/w17091248