
A Five-Dimensional Comprehensive Evaluation of the Yellow River Basin’s Water Environment Using Entropy–Catastrophe Progression Method: Implications for Differentiated Governance Strategies

Abstract
1. Introduction
2. Research Materials
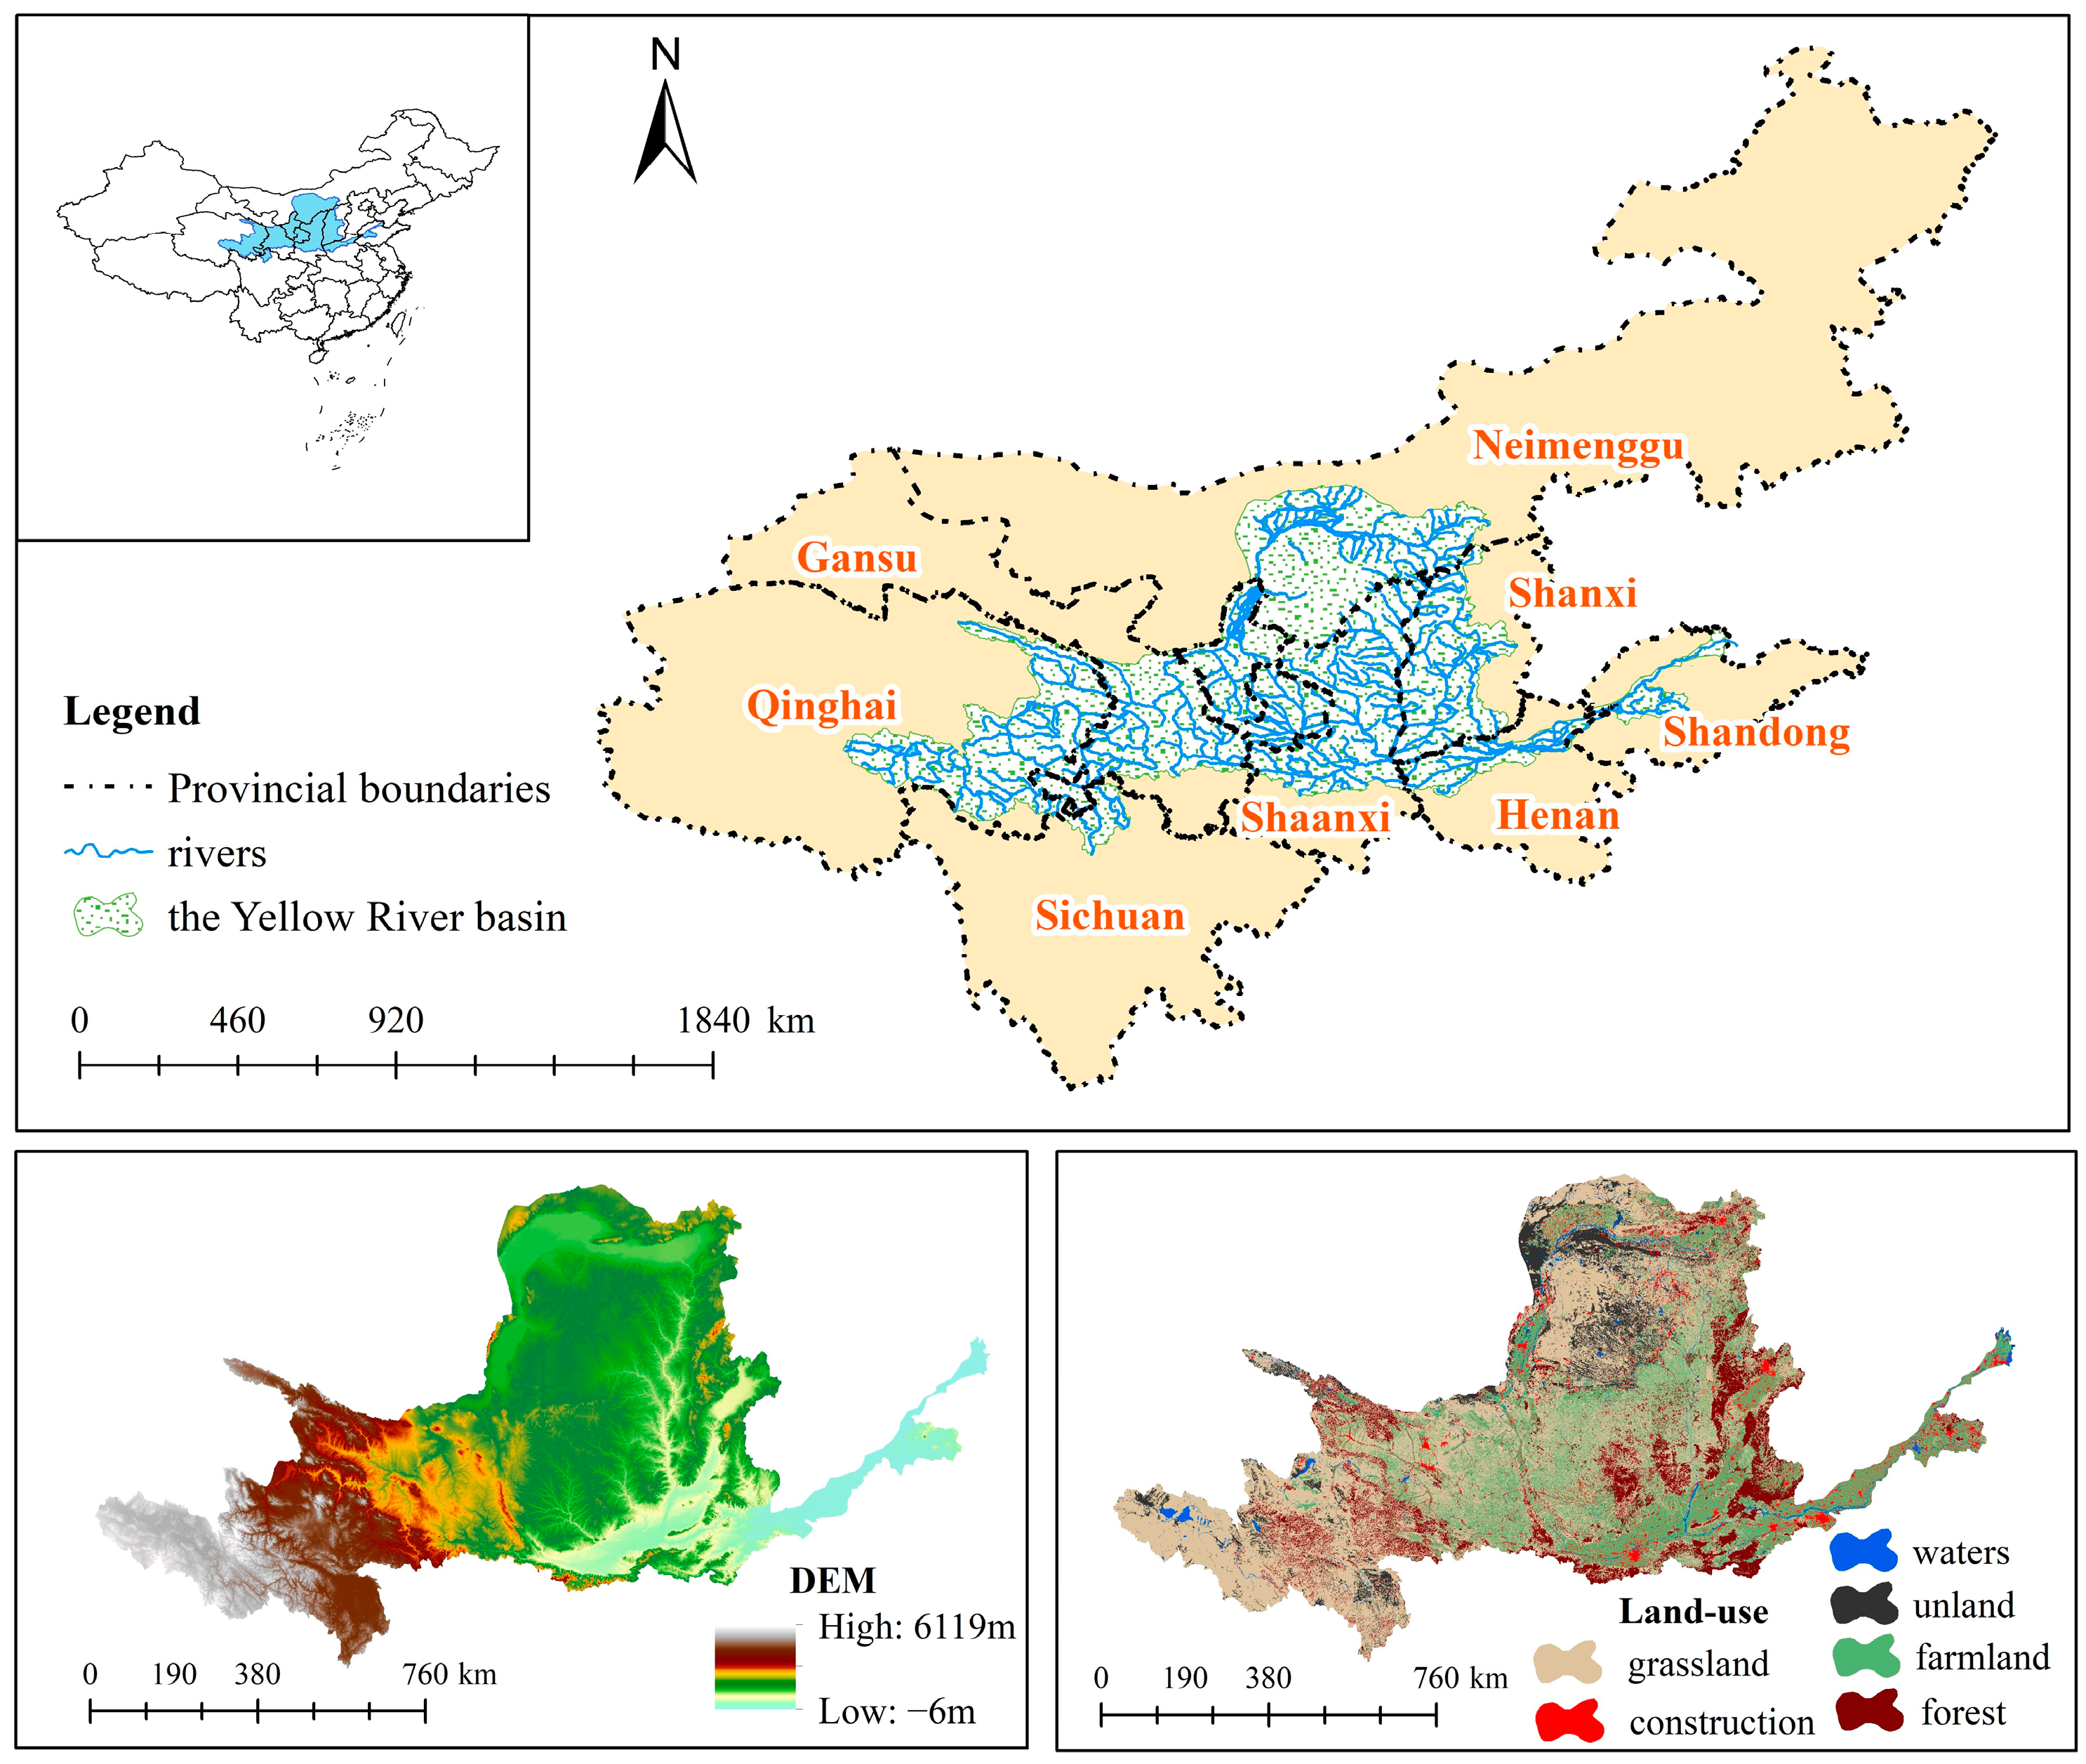
Study Area
3. Research Methods
3.1. Construction of the Comprehensive Water Environment Evaluation System
3.2. Calculation of the Comprehensive Evaluation Index
3.3. Catastrophe Progression Method
3.4. Natural Breaks Classification Method
3.5. Data Sources
4. Research Results
4.1. Comprehensive Evaluation Index Calculation Based on the Entropy–Catastrophe Progression Method
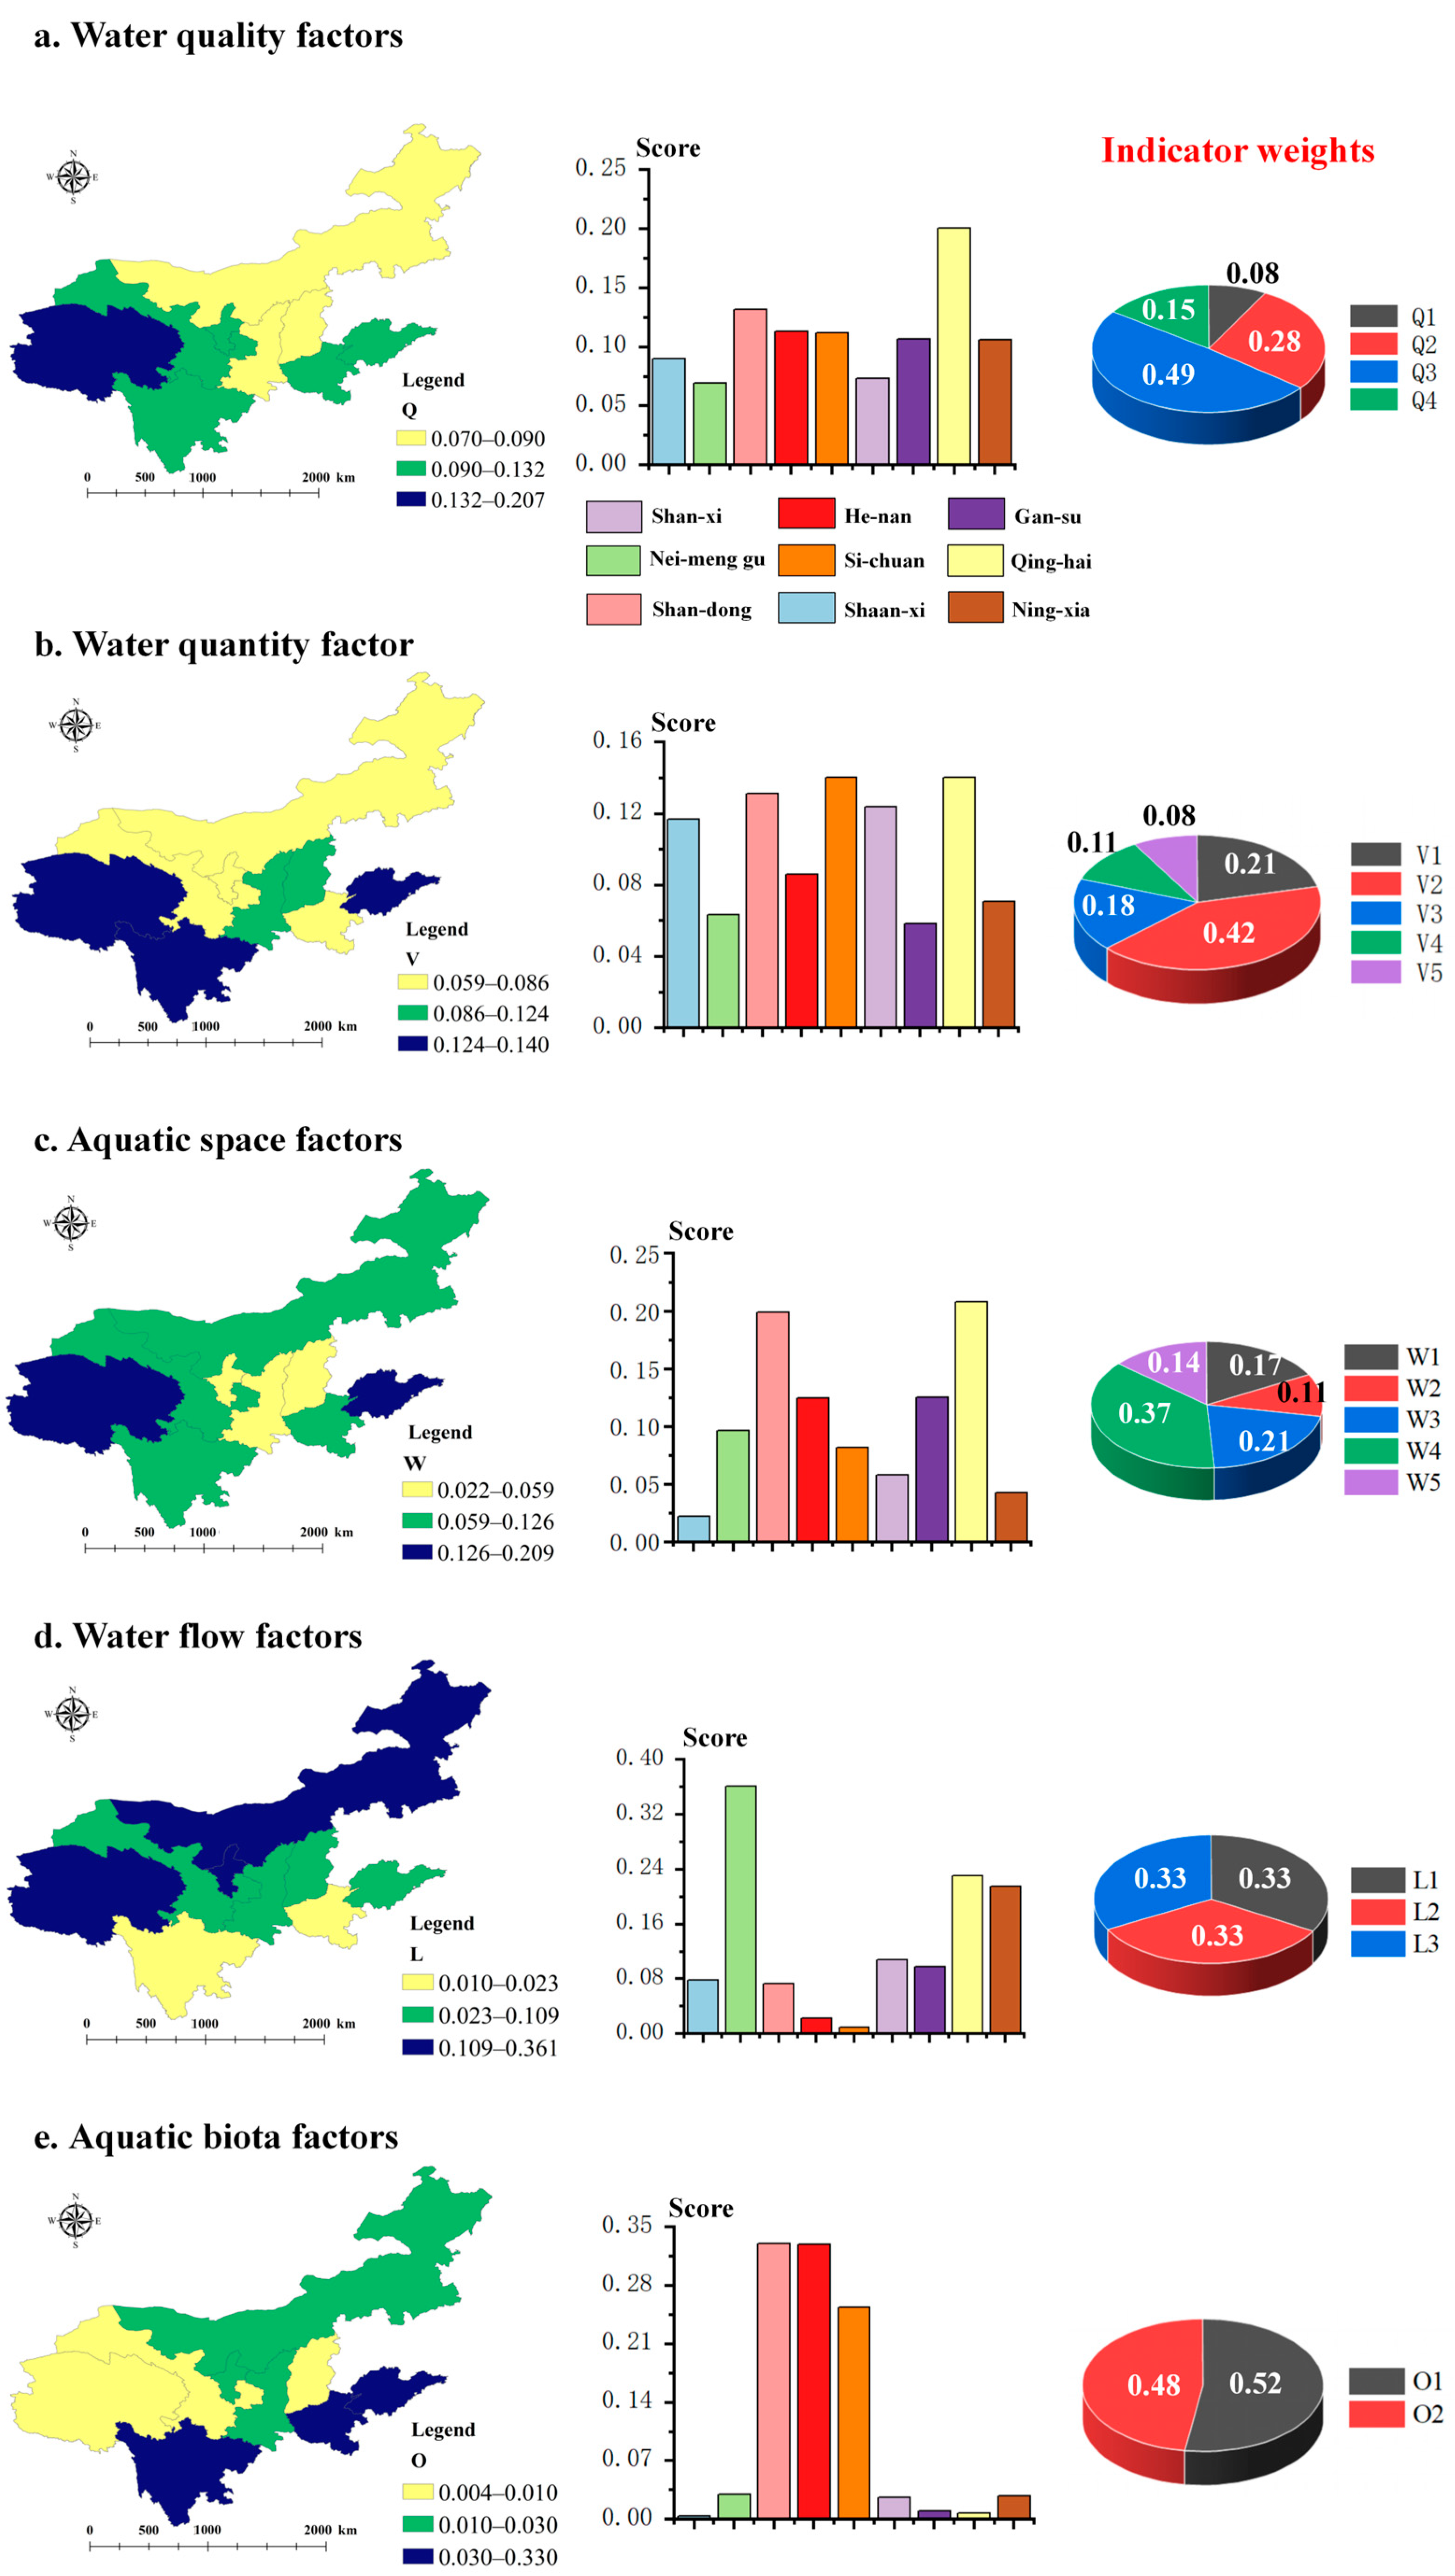
4.2. Evaluation Results of Each Water Environment Dimension
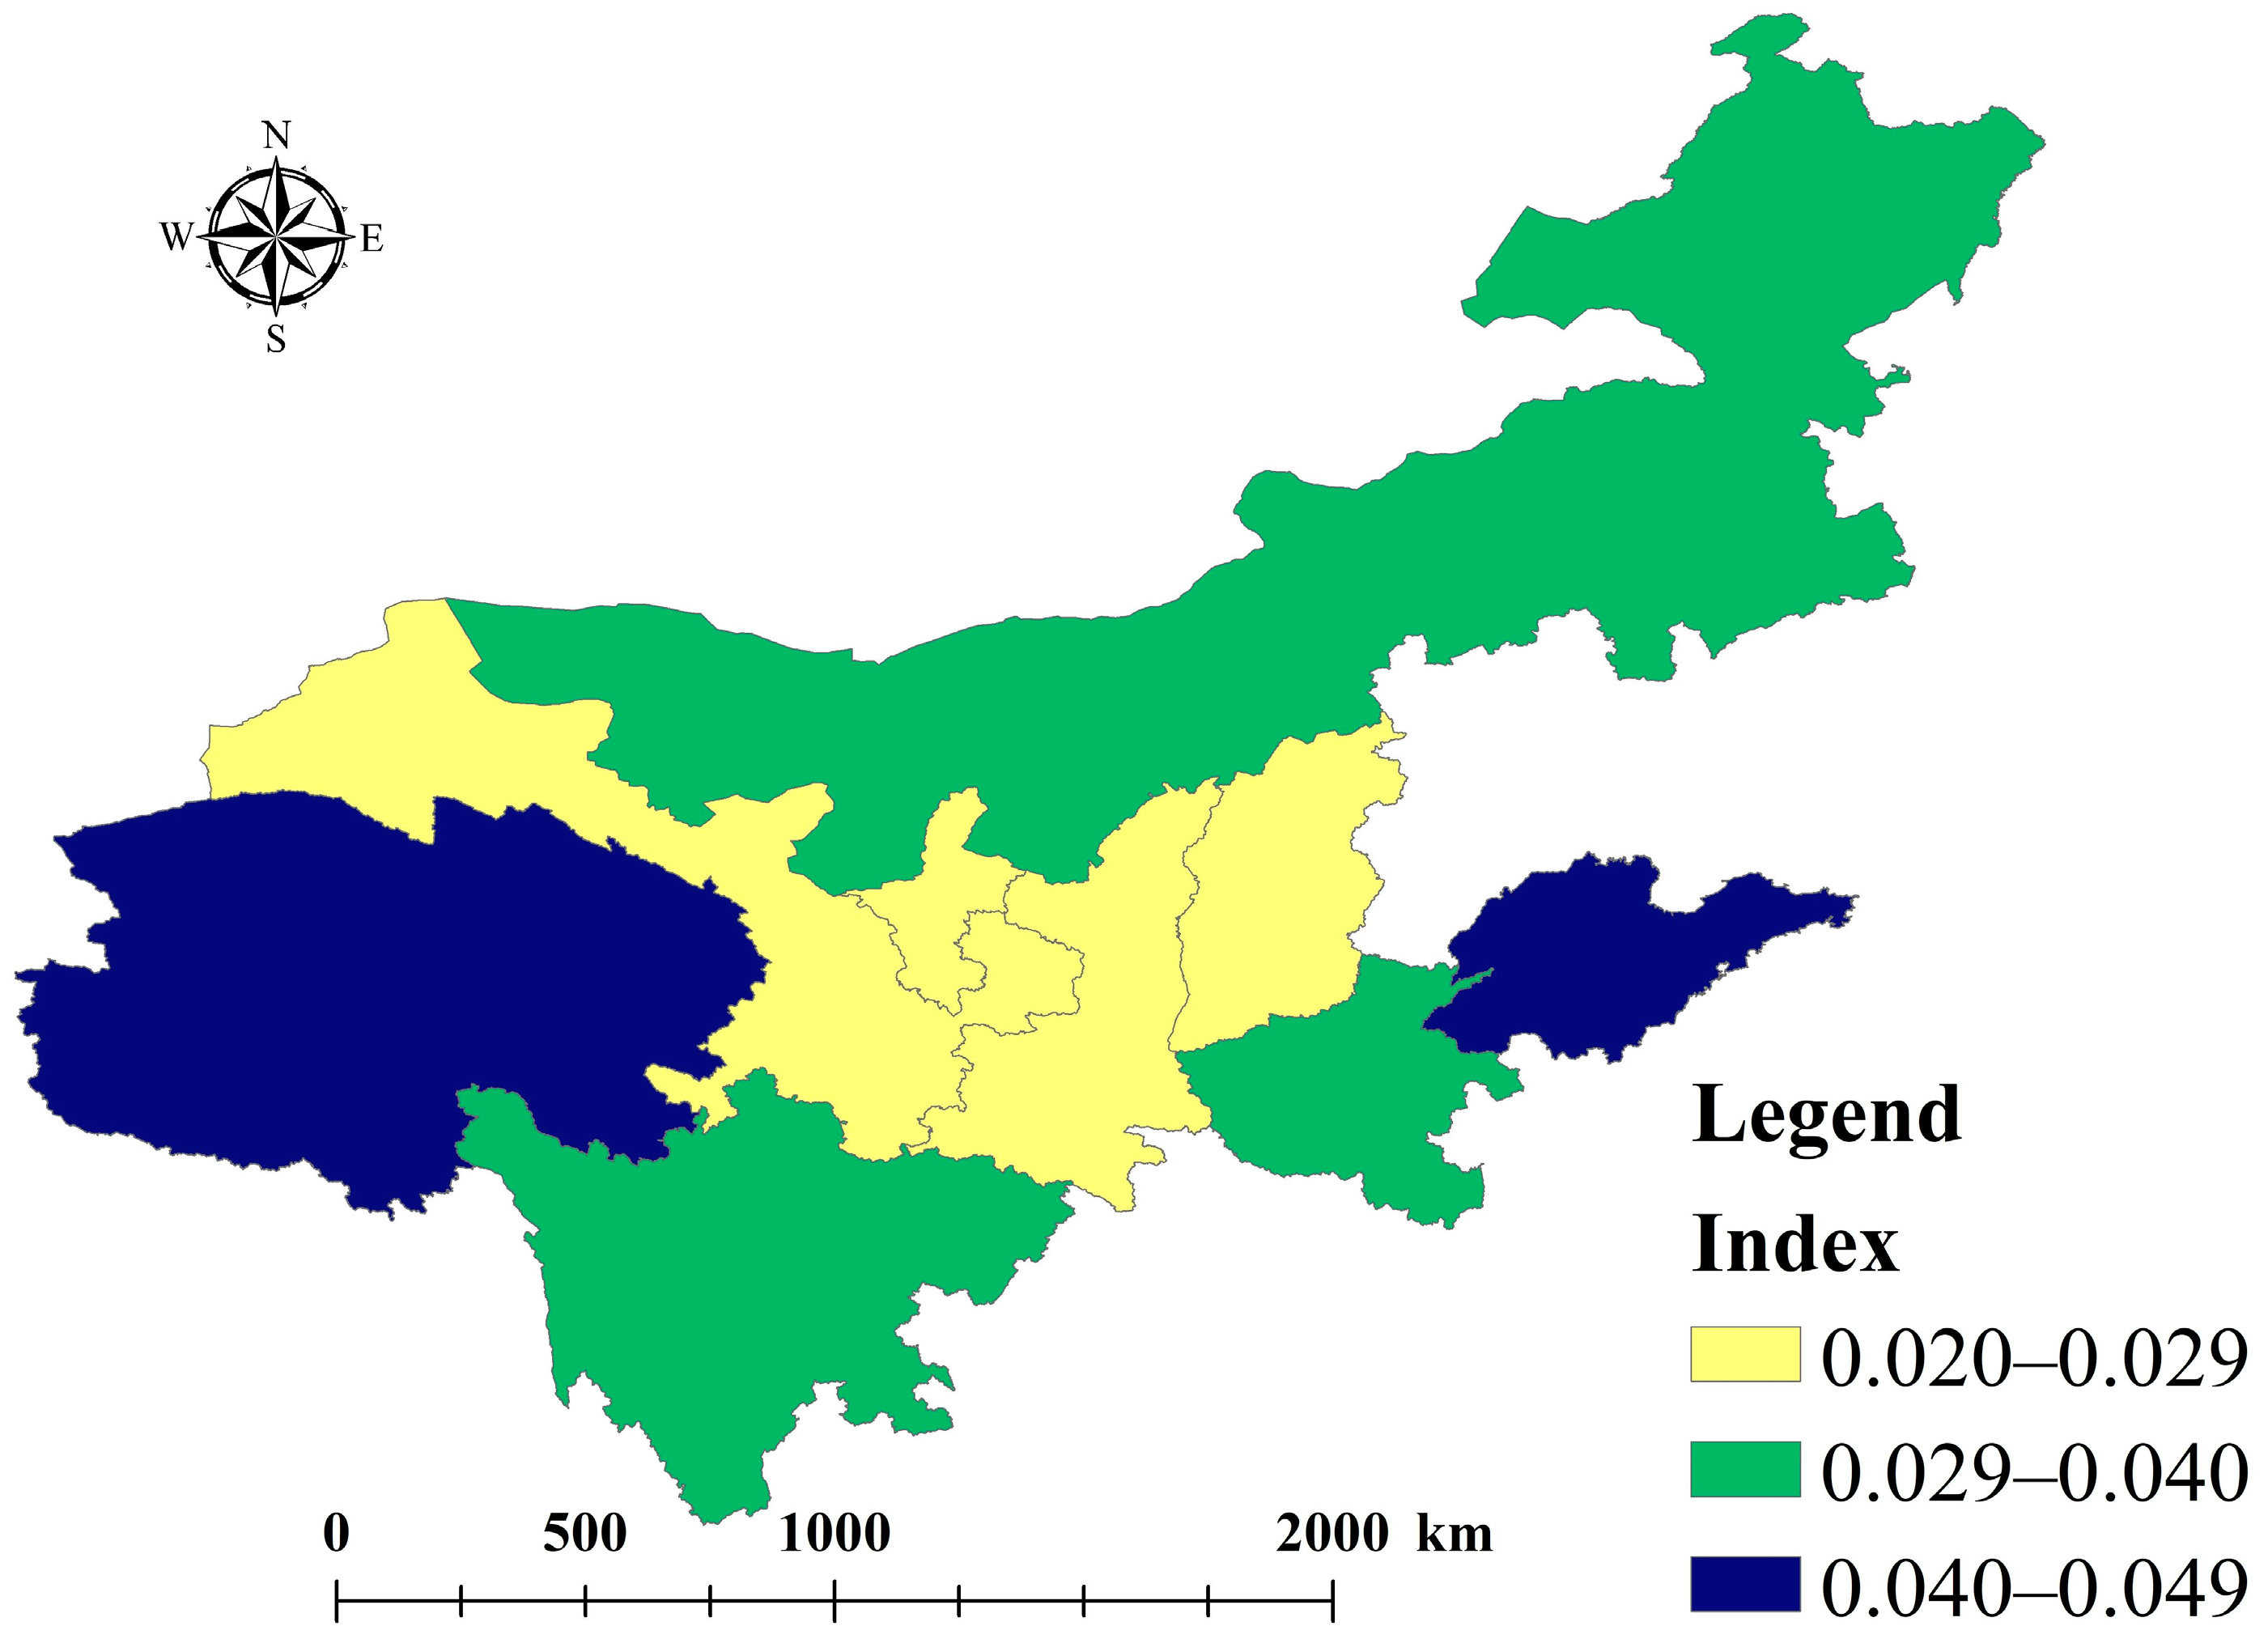
4.3. Comprehensive Evaluation Results of the Water Environment
4.4. Issues and Governance Recommendations for the Water Environment in the Yellow River Basin
4.4.1. Aquatic Space Dimension
4.4.2. Water Quality Dimension
4.4.3. Water Quantity Dimension
5. Discussion
- Systemic Advantages of the Multidimensional Framework in Aquatic Ecological Evaluation
- 2.
- Enhanced Dynamicity and Objectivity via the Entropy–Catastrophe Progression Method
6. Conclusions
- The five-dimensional framework integrates water quality (four indicators), water quantity (five indicators), aquatic space (five indicators), water flow (three indicators), and aquatic biota (two indicators), comprehensively depicting the complex interactions within the water environment system. The spatial heterogeneity results are closely related to the geographical characteristics of the Yellow River basin, such as the ecological barrier in the upstream regions, the soil erosion belt in the midstream regions, and the alluvial plain in the downstream regions. Compared with traditional linear models, the entropy–catastrophe progression method is more suitable for describing nonlinear mutation processes in water environment systems. When the indicator of a specific dimension is lower than the critical threshold, the comprehensive evaluation index will gradually decrease, verifying the application value of catastrophe theory.
- The spatial heterogeneity of the water environment in the Yellow River basin is significant. Provinces with an “excellent” comprehensive evaluation grade, such as Qinghai Province (0.041) and Shandong Province (0.049), are located in the source area and estuary area of the Yellow River basin, respectively; while the midstream provinces, such as Shanxi Province (0.020) and Shaanxi Province (0.024), are key governance provinces due to deficiencies in multiple dimensions such as water quantity, water quality, and aquatic space.
- For provinces with a “poor” comprehensive water environment assessment, it is recommended to adopt differentiated governance measures: (1) Gansu and Ningxia should focus on promoting water-saving irrigation and virtual water trade. (2) Shaanxi and Shanxi should focus on promoting the deep treatment of industrial wastewater and the control of non-point source pollution. (3) Establish a three-level water space management system of “red line-buffer zone-restoration area” for the entire river basin.
Author Contributions
Funding
Data Availability Statement
Conflicts of Interest
References
- Zhang, C.; Wang, G. Thoughts on Ecological Protection and High-Quality Development in the Yellow River Basin. Yellow River 2024, 46, 1–7. [Google Scholar]
- Wohlfart, C.; Kuenzer, C.; Chen, C.; Liu, G. Social–ecological challenges in the Yellow River basin (China): A review. Environ. Earth Sci. 2016, 75, 1066. [Google Scholar] [CrossRef]
- Han, J.C.; Huang, Y.; Zhang, H.; Wu, X. Characterization of elevation and land cover dependent trends of NDVI variations in the Hexi region, northwest China. J. Environ. Manag. 2019, 232, 1037–1048. [Google Scholar] [CrossRef]
- Chen, J.; Gao, Y.; Qian, H.; Jia, H.; Zhang, Q. Insights into water sustainability from a grey water footprint perspective in an irrigated region of the Yellow River Basin. J. Clean. Prod. 2021, 316, 128329. [Google Scholar] [CrossRef]
- Geng, W.; Li, Y.; Zhang, P.; Yang, D.; Jing, W.; Rong, T. Analyzing spatio-temporal changes and trade-offs/synergies among ecosystem services in the Yellow River Basin, China. Ecol. Indic. 2022, 138, 108825. [Google Scholar] [CrossRef]
- Chen, G.; Zuo, D.; Xu, Z.; Wang, G.; Han, Y.; Peng, D.; Pang, B.; Abbaspour, K.C.; Yang, H. Changes in water conservation and possible causes in the Yellow River Basin of China during the recent four decades. J. Hydrol. 2024, 637, 131314. [Google Scholar] [CrossRef]
- Ma, W.; Li, X.; Kou, J.; Li, C. Spatial Heterogeneity of Embedded Water Consumption from the Perspective of Virtual Water Surplus and Deficit in the Yellow River Basin, China. Chin. Geogr. Sci. 2024, 34, 311–326. [Google Scholar] [CrossRef]
- Qin, H.; Shi, H.; Gai, Y.; Qiao, S.; Li, Q. Sensitivity Analysis of Runoff and Wind with Respect to Yellow River Estuary Salinity Plume Based on FVCOM. Water 2023, 15, 1378. [Google Scholar] [CrossRef]
- Fu, X.Q.; Zou, Z.H. Water Quality Evaluation of the Yellow River Basin Based on Gray Clustering Method. IOP Conf. Ser. Earth Environ. Sci. 2018, 128, 012139. [Google Scholar] [CrossRef]
- Hou, W.; Sun, S.; Wang, M.; Li, X.; Zhang, N.; Xin, X.; Sun, L.; Li, W.; Jia, R. Assessing water quality of five typical reservoirs in lower reaches of Yellow River, China: Using a water quality index method. Ecol. Indic. 2016, 61, 309–316. [Google Scholar] [CrossRef]
- Sun, Y.; Chen, X.; Luo, Y.; Cao, D.; Feng, H.; Zhang, X.; Yao, R. Agricultural Water Quality Assessment and Application in the Yellow River Delta. Agronomy 2023, 13, 1495. [Google Scholar] [CrossRef]
- Kong, D.; Miao, C.; Li, J.; Zheng, H. Full-stream erosion in the lower Yellow River: Feasibility, sustainability and opportunity. Sci. Total Environ. 2022, 807, 150810. [Google Scholar] [CrossRef] [PubMed]
- Ma, L.; Liu, Z.; Zhao, B.; Lyu, J.; Zheng, F.; Xu, W.; Gan, X. Variations of runoff and sediment and their response to human activities in the source region of the Yellow River, China. Environ. Earth Sci. 2021, 80, 552. [Google Scholar] [CrossRef]
- Gao, P.; Wang, Y.; Li, P.; Zhao, G.; Sun, W.; Mu, X. Land degradation changes in the Yellow River Delta and its response to the streamflow-sediment fluxes since 1976. Land Degrad. Dev. 2018, 29, 3212–3220. [Google Scholar] [CrossRef]
- Xu, G.; Zhang, J.; Li, P.; Li, Z.; Lu, K.; Wang, X.; Wang, F.; Cheng, Y.; Wang, B. Vegetation restoration projects and their influence on runoff and sediment in China. Ecol. Indic. 2018, 95, 233–241. [Google Scholar] [CrossRef]
- Liu, C.; Zhang, X.; Wang, T.; Chen, G.; Zhu, K.; Wang, Q.; Wang, J. Detection of vegetation coverage changes in the Yellow River Basin from 2003 to 2020. Ecol. Indic. 2022, 138, 108818. [Google Scholar] [CrossRef]
- Jian, S.; Zhang, Q.; Wang, H. Spatial–Temporal Trends in and Attribution Analysis of Vegetation Change in the Yellow River Basin, China. Remote Sens. 2022, 14, 4607. [Google Scholar] [CrossRef]
- Wei, S.; Dong, Y.; Qiu, Y.; Li, B.; Li, S.; Dong, C. Temporal and spatial analysis of vegetation cover change in the Yellow River Delta based on Landsat and MODIS time series data. Environ. Monit. Assess. 2023, 195, 1057. [Google Scholar] [CrossRef]
- Sun, L.; Li, X.; Dong, G.; Cong, X. Taxonomic Diversity of Fish Species in the Lower Reaches of the Yellow River. Fishes 2023, 8, 503. [Google Scholar] [CrossRef]
- Yi, Y.; Gao, Y.; Zhang, S. The impact of dams on the river connectivity of the two largest river basins in China. River Res. Appl. 2022, 38, 185–193. [Google Scholar]
- Wang, L.; Shu, Z.; Wang, G.; Sun, Z.; Yan, H.; Bao, Z. Analysis of Future Meteorological Drought Changes in the Yellow River Basin under Climate Change. Water 2022, 14, 1896. [Google Scholar] [CrossRef]
- Wu, Q.; Zuo, Q.; Han, C.; Ma, J. Integrated assessment of variation characteristics and driving forces in precipitation and temperature under climate change: A case study of Upper Yellow River basin, China. Atmos. Res. 2022, 272, 106156. [Google Scholar] [CrossRef]
- Wu, P.; Liu, D.; Ma, J.; Gu, L.; Tong, J. Reconstructing the man-made Yellow River flood of Kaifeng City in 1642 AD using documentary sources. Int. J. Disaster Risk Reduct. 2019, 41, 101289. [Google Scholar] [CrossRef]
- Zhao, J.; Xiu, H.; Wang, M.; Zhang, X. Construction of Evaluation Index System of Green Development in the Yellow River Basin Based on DPSIR Model. IOP Conf. Ser. Earth Environ. Sci. 2020, 510, 032033. [Google Scholar] [CrossRef]
- Wang, A.; Wang, S.; Liang, S.; Yang, R.; Yang, M.; Yang, J. Research on Ecological Protection and High-Quality Development of the Lower Yellow River Based on System Dynamics. Water 2023, 15, 3046. [Google Scholar] [CrossRef]
- Wang, C.; Gong, W.; Zhao, M.; Zhou, Y.; Zhao, Y. Spatio-temporal evolution characteristics of eco-efficiency in the Yellow River Basin of China based on the super-efficient SBM model. Environ. Sci. Pollut. Res. 2023, 30, 72236–72247. [Google Scholar] [CrossRef] [PubMed]
- Gu, D.; Guo, J.; Fan, Y.; Zuo, Q.; Yu, L. Evaluating water-energy-food system of Yellow River basin based on type-2 fuzzy sets and Pressure-State-Response model. Agric. Water Manag. 2022, 267, 107607. [Google Scholar] [CrossRef]
- Qiu, M.; Yang, Z.; Zuo, Q.; Wu, Q.; Jiang, L.; Zhang, Z.; Zhang, J. Evaluation on the relevance of regional urbanization and ecological security in the nine provinces along the Yellow River, China. Ecol. Indic. 2021, 132, 108346. [Google Scholar] [CrossRef]
- Yan, Q.; Hu, P.; Wang, J.; Liu, H.; Zeng, Q.; Yang, Z.; Yan, L. Comprehensive Evaluation of Water Resources Collaborative Protection Status in the Beijing-Tianjin-Hebei Region Based on “Quantity-Quality-Domain-Connectivity-Biology”. Water Resour. Prot. 2024, 41, 114–122. [Google Scholar]
- Jianhua, W.; Zeru, J.; Huan, L.; Peng, H. Architecture and strategies for total elements protection of water resources in “quantity-quality-domain-connectivity-biology”. Water Resour. Hydropower Eng. 2024, 55, 51–58. [Google Scholar]
- Wang, H.; Wang, J.; Hu, P. New connotation of water resources protection: “Quantity-quality-domain-connectivity-biology” coordinated protection and restoration. Water Resour. Prot. 2021, 37, 1–9. [Google Scholar]
- Tian, Z.; Chen, K.; Pan, J.; Feng, X. Evaluation of ecological security of land in the Yellow River Basin based on catastrophe theory. J. Econ. Water Resour. 2021, 39, 13–19, 37, 79–80. [Google Scholar]
- Chen, Q.; Mei, K.; Dahlgren, R.A.; Wang, T.; Gong, J.; Zhang, M. Impacts of land use and population density on seasonal surface water quality using a modified geographically weighted regression. Sci. Total Environ. 2016, 572, 450–466. [Google Scholar] [CrossRef]
- Wang, Y.; Zhao, J.; Fu, J.; Wei, W. Effects of the Grain for Green Program on the water ecosystem services in an arid area of China—Using the Shiyang River Basin as an example. Ecol. Indic. 2019, 104, 659–668. [Google Scholar] [CrossRef]
- Barbarossa, V.; Schmitt, R.J.P.; Huijbregts, M.A.J.; Zarfl, C.; King, H.; Schipper, A.M. Impacts of current and future large dams on the geographic range connectivity of freshwater fish worldwide. Proc. Natl. Acad. Sci. USA 2020, 117, 3648–3655. [Google Scholar] [CrossRef]
- Czyzyk, K.; Mirossi, D.; Abdoulhak, A.; Hassani, S.; Niemann, J.D.; Gironás, J. Impacts of Channel Network Type on the Unit Hydrograph. Water 2020, 12, 669. [Google Scholar] [CrossRef]
- Labat, F.; Piscart, C.; Thiébaut, G. Invertebrates in small shallow lakes and ponds: A new sampling method to study the influence of environmental factors on their communities. Aquat. Ecol. 2022, 56, 585–603. [Google Scholar] [CrossRef]
- Gui, J.; Guo, B.; Cheng, J.; Deng, X.; Wu, F. Layout optimization and support system of territorial space: Ananalysis framework based on resource efficiency. Acta Geogr. Sin. 2022, 77, 534–546. [Google Scholar]
- Ma, W.; Li, X.; Kou, J.; Li, C. How feasible is regional integration for reconciling land use conflicts across the urban–rural interface? Evidence from Beijing–Tianjin–Hebei metropolitan region in China. Land Use Policy 2020, 92, 104433. [Google Scholar] [CrossRef]
- Zhou, D.; Lin, Z.; Lim, S.H. Spatial characteristics and risk factor identification for land use spatial conflicts in a rapid urbanization region in China. Environ. Monit. Assess. 2019, 191, 677. [Google Scholar] [CrossRef]
- Bai, L.; Sun, Y.; Zhao, X.; Qiao, Q.; Li, X.; Zhou, X. Discharge Characteristics and Pollution Aggregation Pattern of Water Pollution in Yellow River Basin. Res. Environ. Sci. 2020, 33, 2683–2694. [Google Scholar]
- Ramos, M.C.; Benito, C.; Martínez-Casasnovas, J.A. Simulating soil conservation measures to control soil and nutrient losses in a small, vineyard dominated, basin. Agric. Ecosyst. Environ. 2015, 213, 194–208. [Google Scholar] [CrossRef]
- Yang, Q.; Meng, F.R.; Zhao, Z.; Chow, T.L.; Benoy, G.; Rees, H.W.; Bourque, C.P.A. Assessing the impacts of flow diversion terraces on stream water and sediment yields at a watershed level using SWAT model. Agriculture, Ecosystems & Environment. 2009, 132, 23–31. [Google Scholar]
- Jin, W.; Chang, J.; Wang, Y.; Bai, T. Long-term water-sediment multi-objectives regulation of cascade reservoirs: A case study in the Upper Yellow River, China. J. Hydrol. 2019, 577, 123978. [Google Scholar] [CrossRef]

| Dimension | Evaluation Indicator | Indicator Description |
|---|---|---|
| Water Quantity (V) | Precipitation (V1) | Average annual precipitation in the region |
| Per Capita Water Resources (V2) | Available water resources per capita in the region | |
| Proportion of Water-Saving Irrigation Area (V3) | Area of water-saving irrigated farmland/Total area | |
| Proportion of Newly Added Soil Erosion Control Area (V4) | Newly added soil erosion control area/Total area | |
| Proportion of Grassland, Forest, and Wetland Area (V5) | Area of grassland, forest, and wetland/Total area | |
| Water Quality (Q) | Urban Sewage Treatment Rate (Q1) | Urban sewage generated/Urban sewage treated by treatment plants |
| Number of Industrial Wastewater Treatment Facilities (Q2) | Number of industrial wastewater treatment facilities in the region | |
| Proportion of Environmental Pollution Control Investment (Q3) | Investment in pollution control/GDP | |
| Proportion of Class I–III Water Quality Monitoring Stations (Q4) | Number of Class I–III water quality monitoring stations/Total number of monitoring stations | |
| Aquatic Space (W) | Rate of Change in Aquatic Area (W1) | Change in aquatic area/Initial aquatic area |
| Retention Rate of Aquatic Area (W2) | Retained aquatic area/Initial aquatic area | |
| Protection Rate of Aquatic Space (W3) | Protected aquatic area/Total aquatic area | |
| Aggregation Degree of Aquatic Space (W4) | Adjacent aquatic area/Largest patch area | |
| Largest Patch Index (W5) | Area of the largest connected patch/Total aquatic area | |
| Water Flow (L) | α Index (L1) | Reflects the actual loop level of the river network |
| β Index (L2) | Reflects the connectivity strength of each node in the river network | |
| γ Index (L3) | Reflects the connectivity strength between river network corridors | |
| Aquatic Biota (O) | Freshwater Aquaculture Production (O1) | Production of freshwater aquatic organisms through aquaculture |
| Freshwater Fishing Production (O2) | Production of freshwater aquatic organisms through fishing |
| Type | Mathematical Expression | Bifurcation Set Equation | Normalization Equation |
|---|---|---|---|
| Cusp Catastrophe | |||
| Swallowtail Catastrophe | |||
| Butterfly Catastrophe | | ||
| Wigwam Catastrophe | | |
| Province | Water Environment Evaluation of All Dimensions | Comprehensive Evaluation | |||||
|---|---|---|---|---|---|---|---|
| Water Quality | Water Quantity | Aquatic Space | Aquatic Biota | Water Flow | |||
| Shanxi | 0.090 | 0.117 | 0.078 | 0.004 | 0.022 | 0.020 | poor |
| Neimenggu | 0.070 | 0.063 | 0.361 | 0.030 | 0.097 | 0.030 | good |
| Shandong | 0.132 | 0.131 | 0.073 | 0.330 | 0.199 | 0.049 | excellent |
| Henan | 0.113 | 0.086 | 0.023 | 0.330 | 0.125 | 0.037 | good |
| Sichuan | 0.112 | 0.140 | 0.001 | 0.254 | 0.082 | 0.035 | good |
| Shaanxi | 0.073 | 0.124 | 0.109 | 0.026 | 0.059 | 0.024 | poor |
| Gansu | 0.107 | 0.059 | 0.098 | 0.001 | 0.126 | 0.028 | poor |
| Qinghai | 0.200 | 0.140 | 0.230 | 0.008 | 0.209 | 0.041 | excellent |
| Ningxia | 0.106 | 0.071 | 0.215 | 0.029 | 0.043 | 0.026 | poor |
| Total | 0.112 | 0.104 | 0.132 | 0.112 | 0.107 | 0.032 | good |
Disclaimer/Publisher’s Note: The statements, opinions and data contained in all publications are solely those of the individual author(s) and contributor(s) and not of MDPI and/or the editor(s). MDPI and/or the editor(s) disclaim responsibility for any injury to people or property resulting from any ideas, methods, instructions or products referred to in the content. |
© 2025 by the authors. Licensee MDPI, Basel, Switzerland. This article is an open access article distributed under the terms and conditions of the Creative Commons Attribution (CC BY) license (https://creativecommons.org/licenses/by/4.0/).
Share and Cite
Zhang, Y.; Ren, Y. A Five-Dimensional Comprehensive Evaluation of the Yellow River Basin’s Water Environment Using Entropy–Catastrophe Progression Method: Implications for Differentiated Governance Strategies. Water 2025, 17, 1228. https://doi.org/10.3390/w17081228
Zhang Y, Ren Y. A Five-Dimensional Comprehensive Evaluation of the Yellow River Basin’s Water Environment Using Entropy–Catastrophe Progression Method: Implications for Differentiated Governance Strategies. Water. 2025; 17(8):1228. https://doi.org/10.3390/w17081228
Chicago/Turabian StyleZhang, Yaqun, and Yangan Ren. 2025. "A Five-Dimensional Comprehensive Evaluation of the Yellow River Basin’s Water Environment Using Entropy–Catastrophe Progression Method: Implications for Differentiated Governance Strategies" Water 17, no. 8: 1228. https://doi.org/10.3390/w17081228
APA StyleZhang, Y., & Ren, Y. (2025). A Five-Dimensional Comprehensive Evaluation of the Yellow River Basin’s Water Environment Using Entropy–Catastrophe Progression Method: Implications for Differentiated Governance Strategies. Water, 17(8), 1228. https://doi.org/10.3390/w17081228