Article

Trends in Coral Reef Habitats over Two Decades: Lessons Learned from Nha Trang Bay Marine Protected Area, Vietnam

1
Coastal Branch of Joint Vietnam—Russia Tropical Science and Technology Research Center, Nha Trang City 57000, Vietnam
2
Laboratory of Environmental Sciences and Climate Change, Institute for Computational Science and Artificial Intelligence, Van Lang University, Ho Chi Minh City 70000, Vietnam
3
Faculty of Environment, School of Technology, Van Lang University, Ho Chi Minh City 70000, Vietnam
4
Department of Academic Affairs, Thai Binh Duong University, Nha Trang City 57000, Vietnam
5
Independent Researcher, Nha Trang 650000, Vietnam
6
Biofluids and Biosystems Modelling Laboratory (BBML), Dalhousie University, DAC, Truro, NS B2N 5E3, Canada
7
Faculty of Fisheries, University of Agriculture and Forestry, Hue University, Hue City 530000, Vietnam
*
Author to whom correspondence should be addressed.
Water 2025, 17(8), 1224; https://doi.org/10.3390/w17081224
Submission received: 10 March 2025 / Revised: 13 April 2025 / Accepted: 16 April 2025 / Published: 19 April 2025

Abstract

:
Coral reefs are well known for their diversity and value, providing habitats for a third of marine species within just 0.2% of the ocean. However, these natural habitats face significant threats and degradation, leading to unresolved issues related to coral loss inventory, coral protection, and the implementation of long-term conservation policies. In this study, we examined two decades of changes in coral spatial distribution within the Nha Trang Bay Marine Protected Area (MPA) using remote sensing and machine learning (ML) approaches. We identified various factors contributing to coral reef loss and analyzed the effectiveness of management policies over the past 20 years. By employing the Light Gradient Boosting Machine (LGBM) and Deep Forest (DF) models on Landsat (2002, κ = 0.83, F1 = 0.85) and Planet (2016, κ = 0.89, F1 = 0.82; 2024, κ = 0.92, F1 = 0.86) images, we achieved high confidence in our inventory of coral changes. Our findings revealed that 191.38 hectares of coral disappeared from Nha Trang Bay MPA between 2002 and 2024. The 8-year period from 2016 to 2024 saw a loss of 66.32 hectares, which is in linear approximation to the 125.06 hectares lost during the 14-year period from 2002 to 2016. It is concluded that the key factors contributing to coral loss include land-use dynamics, global warming, and the impact of starfish. To address these challenges, we propose next a modern community-based management paradigm to enhance the conservation of existing coral reefs and protect potential habitats within Nha Trang Bay MPA.

Graphical Abstract

1. Introduction

Over the past few decades, rapid population growth and infrastructure expansion have driven an exponential rise in global demand for natural resources. This, coupled with unsustainable pressures on marine ecosystems and climate change, has marked the onset of the Anthropocene era, a geological epoch defined by human influence on the planet [1]. Marine ecosystems, particularly coral reefs, have experienced unprecedented stress over the last 30 years due to both natural and human-induced factors. Overfishing, coastal development, sedimentation, excessive tourism, climate change, and ocean acidification have led to severe degradation, with more than two-thirds of coral reefs worldwide declining by over 80% [2,3].
Coastal marine ecosystems, including coral reefs and seagrass beds, host high biodiversity, provide critical habitats, and offer essential ecosystem services. These include sustaining nearshore fisheries, generating economic benefits through tourism, and serving as breeding grounds for seabirds and turtles [4]. Coral reefs alone support over 450 million people living within 100 km of their shores [5]. However, coral reefs worldwide are facing impacts from climate change, overfishing, habitat destruction, and pollution, with global coverage of living coral declining by half from 1957 to 2007, and the average decadal rate of loss in coral coverage during the study period ranging from 4.7% to 6.8% [6]. Recognizing the growing threats to these ecosystems, scientists and policymakers increasingly advocate for ecosystem-based management approaches that emphasize the often overlooked role of human behavior in conservation [7]. Coastal habitat mapping is essential for effective management strategies, with coral reefs demanding particular attention as they face mounting threats from human activities and climate change-induced disturbances [8,9].
Effective management and protection of coral reefs, particularly within marine protected areas (MPAs), require accurate knowledge of reef distribution and health. Understanding the extent of coral reefs enables targeted conservation efforts, particularly when resources are limited. However, acquiring such data is labor-intensive, time-consuming, and often constrained by funding [8]. Various methods, including transect-based survey (e.g., Reef Check) and remote sensing, are used to assess coral reef structural complexity at different scales. Remote sensing, in particular, offers a viable solution for large-scale monitoring of coral reefs [9,10,11,12,13]. It typically employs computer algorithms to classify satellite or airborne imagery, assigning map classes to pixels based on specific characteristics [14]. Although high-resolution habitat maps are essential for conservation planning, many coastal habitats remain mapped at coarse resolutions [15]. The details and accuracy of map classification and spatial representation directly influence management decisions, affecting cost-effectiveness and conservation outcomes.
Recently, advancements in remote sensing and machine learning (ML) have improved coral reef mapping across diverse coastal regions, though with varying success [16]. Traditional ML algorithms such as Maximum Likelihood (MLH) [17], Support Vector Machine (SVM) [18,19], and Random Forest (RF) [20] have been widely used. However, challenges such as the lack of localized environmental data for water column correction and limited access to very-high-resolution (VHR) satellite imagery have hindered mapping accuracy and consistency [16].
Nha Trang Bay Marine Protected Area (MPA), established in 2002 as a pilot initiative, aims to conserve biodiversity—particularly coral reef ecosystems—while enhancing local livelihoods [21,22]. Despite these efforts, reef degradation has persisted, especially near the mainland, due to overfishing, sedimentation, crown-of-thorns starfish outbreaks, climate change, and tourism [23]. A point-based re-assessment of data collected during the 2002 baseline survey and subsequent inventories reveals a decline in hard coral cover, with anthropogenic activities, such as resort expansion, dredging, mariculture, and overfishing, contributing to the degradation of over half of the bay’s coral reefs by the early 2010s [3]. In general, global-scale anthropogenic warming due to greenhouse gas emissions causes coral mortality and population declines through coral bleaching and infectious diseases [24]. Between 1994 and 2015, hard coral cover declined by 13%, with the highest losses recorded from 1994 to 2000 (16.3%), followed by slower declines from 2000 to 2006 (2.6%) and 2006 to 2015 (0.9%) [25,26]. Global climate-driven threats, including coral bleaching events (1998 and 2010) and ocean acidification, have further exacerbated coral mortality. By the end of 2019, a very high percentage of corals in Nha Trang Bay had disappeared [27], highlighting the urgent need for cost-effective monitoring solutions to support reef management.
Clearly, understanding spatial and temporal variations in coral reefs is crucial for effective coastal management, including resource monitoring, habitat rehabilitation, conservation, tourism, and fisheries. In response to these pressing threats, this study aims to develop a systematic approach for assessing coral reef conditions after two decades of change and for enhancing coastal resource management in Nha Trang Bay MPA. Given the lack of region-based mapping in previous studies [27] and outdated ecosystem maps [28], our research focuses on mapping spatial coral distribution using both medium-resolution Landsat imagery (30 m) and very-high-resolution PlanetScope imagery (3 m, with a 1-day revisit time). These datasets are integrated with state-of-the-art machine learning techniques (Light Gradient Boosting Machine—LGBM, and Deep Forest—DF) to analyze long-term coral reef changes. This research is expected to serve as a valuable reference for government agencies, conservationists, and stakeholders by demonstrating the utility of remote sensing for coastal monitoring and resource management. Additionally, this study proposes targeted countermeasures to improve the management of coral reefs and other marine habitats within Nha Trang Bay MPA.

2. Materials and Methods
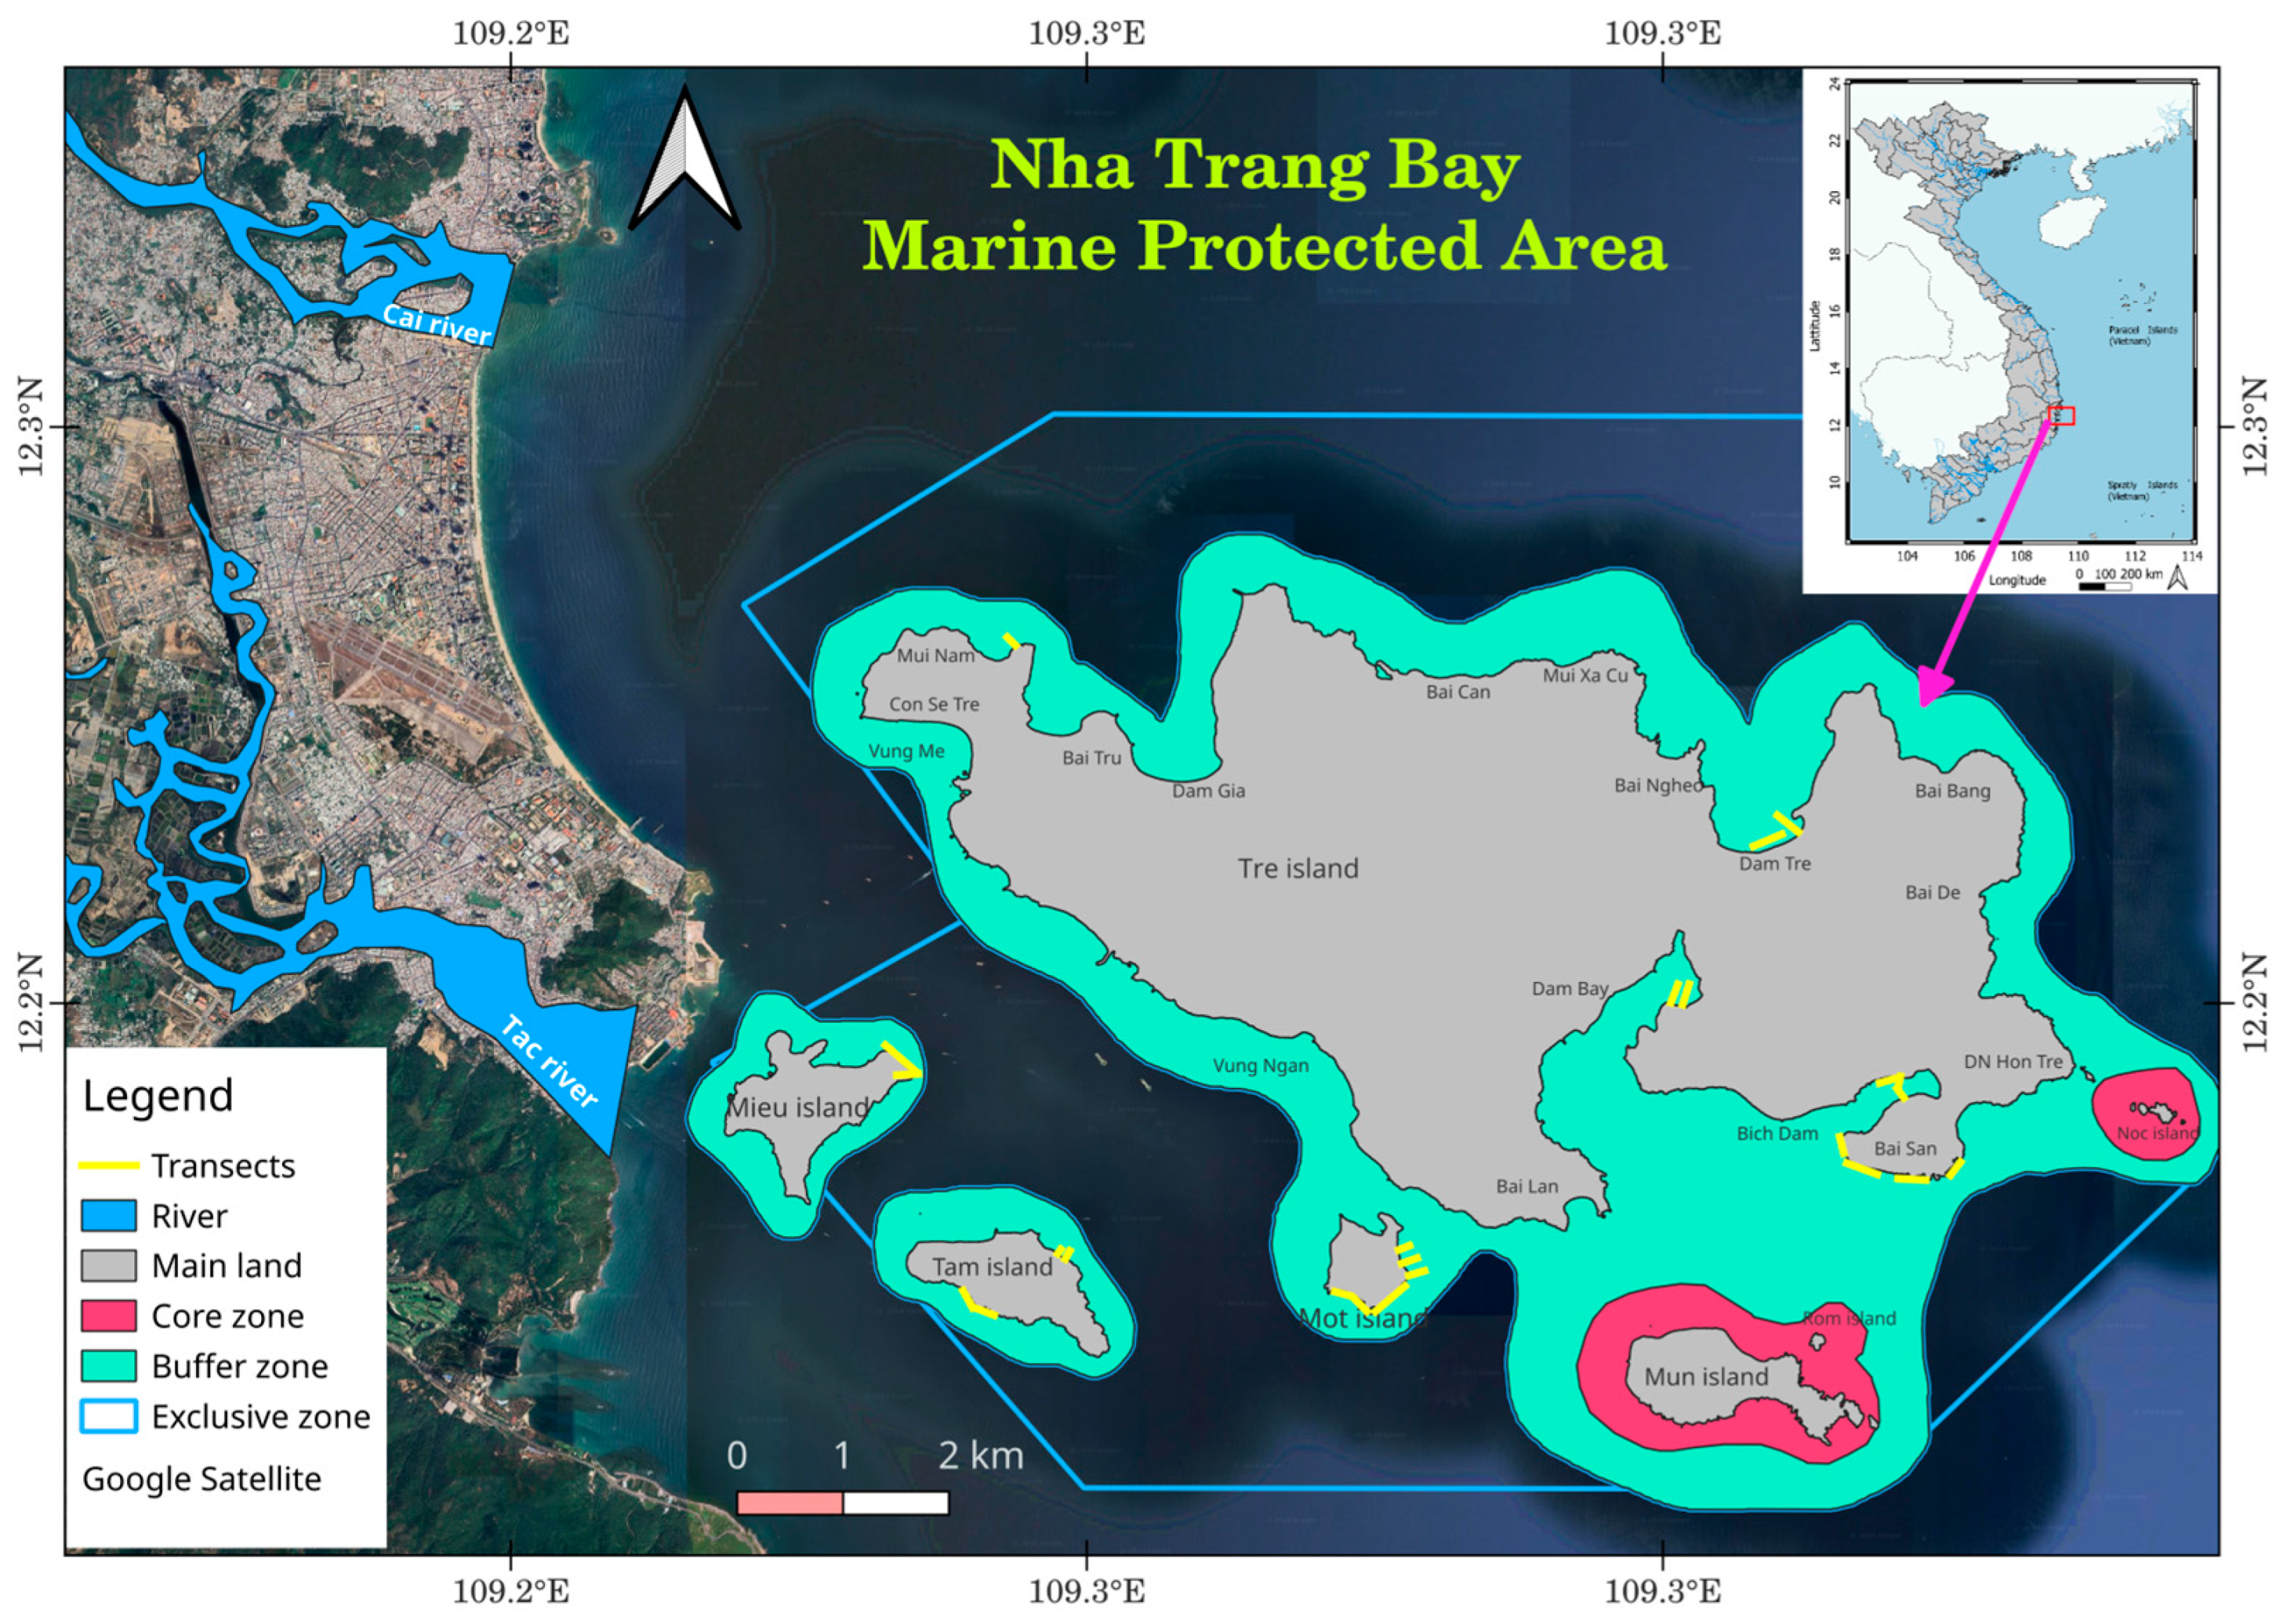
2.1. Study Area

This study was conducted in Nha Trang Bay MPA, the largest multiple-use coastal area in Vietnam. Established in 2002 and covering approximately 160 km2, the MPA aims to conserve coral reefs and other benthic ecosystems within Nha Trang Bay (Figure 1). Located in the East Sea and part of Khanh Hoa Province, the bay is characterized by extensive fringing coral reefs.
Nha Trang Bay comprises nine islands, seven of which are part of this study site. Hon Tre, the largest island, serves as a natural divider, splitting the bay into northern and southern sections. Until the mid-1990s, the bay was regarded as one of Vietnam’s most biodiverse marine ecosystems, hosting 250 species of Scleractinia corals from 60 genera. It is considered part of the Western Pacific Coral Triangle, a biodiversity hotspot and the origin center for Indo-Pacific coral fauna [29,30]. As Vietnam’s first MPA, it plays a crucial role in marine biodiversity conservation, resource management, and serves as a pilot model for other protected areas in the country [22].

2.2. Mapping Coral Reef Habitat

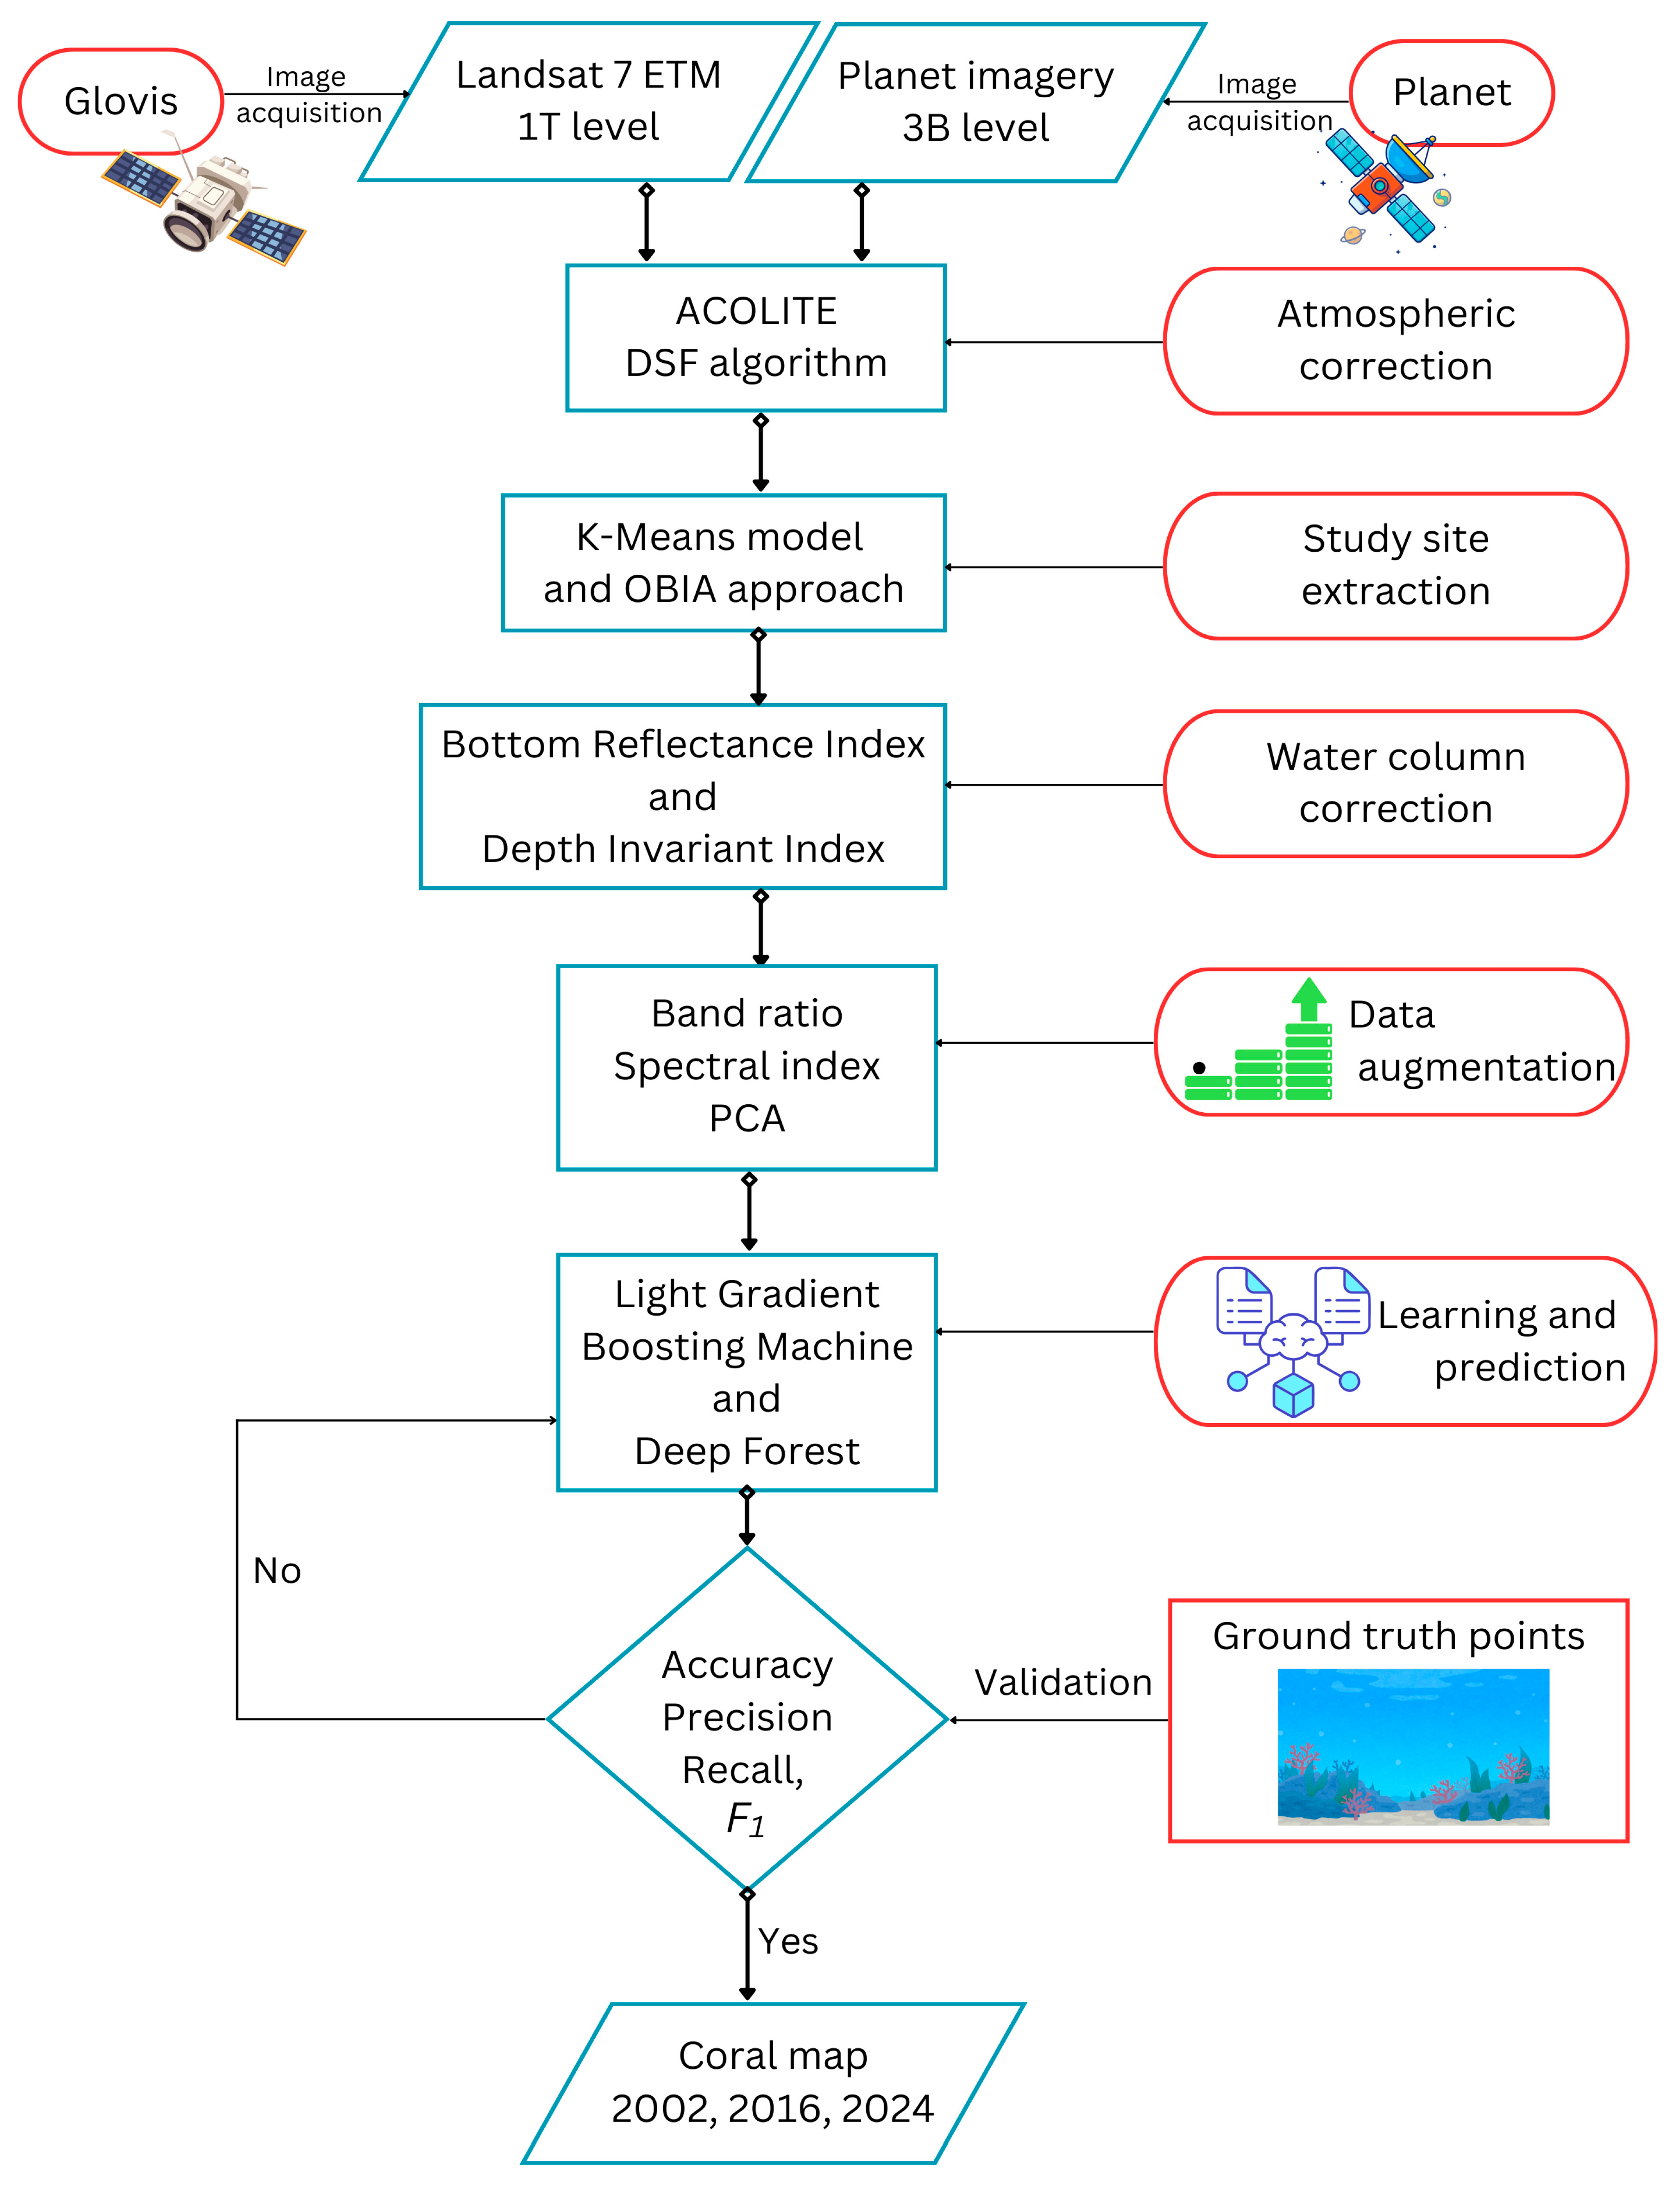
2.2.1. Working Flow and Field Data Collection

Working process
Coral reef changes were tracked through a series of image processing steps (Figure 2), including image acquisition, atmospheric correction (AC), study site extraction, water column correction (WCC), data augmentation, mapping, and model validation. The ACOLITE processor was used for advanced AC, converting image pixels to water surface reflectance. Various WCC techniques and machine learning (ML) models were then applied to satellite images from 2002, 2016, and 2024, depending on the availability of local environmental data.
Field data collection
Field observations were conducted to collect ground truth points (GTPs) and to investigate the current status of coral reefs and other substratum. Two surveys were carried out in March 2024 (from 1 March to 15 March) and April 2024 (from 1 April to 15 April) using a modified Reef Check method—a standardized global survey approach for coral reef assessment [31].
Following pre-designed transects (Figure 1), SCUBA and snorkeling divers recorded the spatial positions of live coral, rock/dead coral, and other deep water reference points in 2024 using a handheld GPS device (accuracy ± 2 m) to a water depth of approximately 20 m. A team of two trained coral experts conducted substratum observation and GPS recording. When snorkeling was feasible, teams recorded the substratum simultaneously with diving. In deeper waters, one member conducted SCUBA diving, signaling different substratum types using a float rope, while the other members recorded GPS positions and documented the signals. This benthic information aligns with the data that coral reef scientists and managers frequently request from remote-sensing scientists for habitat mapping. A total of approximately 680 GTPs were collected for rock/dead coral, 1180 for live coral, and 50 for deep-water reference points.
Additionally, we collected coral reference points from both published research papers [28] and grey documents around the years 2002 and 2015 to quantify seabed habitat changes in Nha Trang MPA.

2.2.2. Remote Sensing of Coral Change Detection

Remote sensing technology enhances fieldwork efficiency, improves data processing, and increases the quality of final map products [4]. It has been widely and successfully applied to mapping coral reefs and other coastal marine habitats, providing scalable and reliable information on coral reef distribution. The following sections outline the key steps for extracting information from satellite data to generate coral change maps from 2002 and 2024.
Satellite image acquisition
To track coral reef changes, we used PlanetScope imagery for 2016 and 2024, while Landsat was used for mapping coral distribution in 2002 due to the unavailability of Planet data for that year. Planet imagery has a higher spatial resolution (3 m); however, this satellite imagery is constrained by the temporal resolution, with a first retrieved image in 2016 in the Nha Trang MPA. Landsat imagery, on the other hand, presented a very long history of Earth observation since 1972, and hence provided an invaluable dataset for the monitoring of ecosystems worldwide. The use of these two data sources alternatively enabled an accurate mapping of current complex patterns of coral reefs while ensuring the observation of its dynamics in the past. Planet data were retrieved through the Planet Explorer platform (https://www.planet.com/explorer/, accessed on 15 January 2024) under the Education and Research Planet program (Table 1), while Landsat 7 Enhanced Thematic Mapper (ETM+) imagery was downloaded from the United States Geological Survey (USGS) Glovis platform (https://glovis.usgs.gov/, accessed on 22 January 2024) (Table 2). Both datasets were projected to the WGS 84 UTM 49N coordinate system, with PlanetScope images at 3 m spatial resolution and Landsat images at a 30 m spatial resolution.
Atmospheric correction
We employed the Dark Spectrum Fitting (DSF) algorithm integrated within ACOLITE [32], a well-known application for advanced atmospheric correction of satellite images in coastal and open sea regions. ACOLITE has the capability of significantly reducing the noise introduced by the atmosphere path during the retrieval of an image. In this study, a command-line interface was adapted to perform advanced atmospheric correction on Planet and Landsat imagery from 2002, 2016, and 2024.
This method converts top-of-atmosphere into remote sensing reflectance at the water surface, effectively mitigating atmospheric interference and enhancing the accuracy of pixel-level reflectance values. The images were not impacted by clouds and sun glint was not observed during the acquisition of selected satellite scenes; therefore, the sun glint correction was set to False and we did not apply the cloud masking during the processing of atmospheric correction. Table 3 presents the parameters used for this process.
Due to the strong attenuation of light above 700 nm and the availability of retrieved attenuation coefficients (Kd) during atmospheric correction (Kd at 492 nm, 566 nm, and 666 nm), we selected surface reflectance at the blue, green, and red spectral bands corresponding to these wavelengths. This selection ensures consistency across Planet and Landsat images from different years.
Land and water masking
To isolate the study area from land, we applied an unsupervised image classification method (K-Means) to distinguish water and land classes. GIS techniques were then used to create a 500 m buffer zone, defining the study area as extending 500 m from the land boundary (Figure 3). The extent and shape of the study area varied across 2002, 2016, and 2024 due to significant land-use changes. The 500 m limitation was chosen based on coral distribution observed in field surveys, published research [27,28], and the maximum light penetration depth (approximately 20 m), allowing for effective use of multispectral bands in coral mapping.
In addition, we applied the object-based image analysis (OBIA) method to exclude wake patterns and aquaculture cages from the study area. This step was necessary to account for disturbances from human activities (e.g., cruise ship wakes) and aquaculture operations.
Water column correction
We applied the method of the Bottom Reflectance Index (BRI) for PlanetScope images in 2024 and the Depth Invariant Index (DII) for Planet and Landsat images in 2016 and 2002, respectively. The use of the DII method for 2002 and 2016 images was due to the unavailability of bathymetry datasets, since this meant that we could not calibrate the BRI in the corresponding years.
Bottom Reflectance Index (BRI):
The BRI was formulated as follows:
B R I = S R i e k j × g × z
of which
S R i : surface reflectance at band i
k j : attenuation coefficient at band j
g : geometric factor
z : water depth
g was calculated using the following expression:
g = 1 s e c ( S o l a r   Z e n i t h   A n g l e ) + s e c ( S a t e l l i t e   N a d i r   A n g l e )
of which
s e c ( S o l a r   Z e n i t h   A n g l e ) = 1 c o s ( S o l a r   Z e n i t h   A n g l e )
s e c ( S a t e l l i t e   N a d i r   A n g l e ) = 1 c o s ( S a t e l l i t e   N a d i r   A n g l e )
Using the angles extracted from the metadata file, g factor was estimated as 1.8369 for the study site.
The maps of attenuation coefficient ( K d ) were automatically retrieved from the atmospheric correction process using the ACOLITE processor at the wavelengths of 492 nm, 566 nm, and 666 nm. Using the field dataset collected during the field survey in March and April 2024, we modeled the water depth from the same PlanetScope imagery (Figure 4) with high confidence (R2 = 0.84, RMSE = 2.57 m, MAE = 1.92 m, and MedAE = 1.45 m).
We applied Formula (1) to generate the BRI images at 492 nm, 566 nm, and 666 nm (Figure 5).
Depth Invariant Index (DII):
The DII was generated using the following formula:
D I I = L n ( R r s i ) k i k j × L n ( R r s j )
of which
R r s i and R r s j : surface reflectance at band i and band j
k i k j : attenuation coefficient
Of which
k i k j = a + a 2 + 1
a = σ i   σ j 2 σ i j
in which
σ i : variance at band i
σ j : variance at band j
σ i j : co-variance at band i band j
We extracted homogeneous sand areas from Planet (2016) and Landsat (2002) images to create the ROIs and calculated the required parameters for generating the DII at the study site (Table 4 and Table 5).
Of which
D I I b D I I g : DII between blue and green bands
D I I g D I I r : DII between green and red bands
D I I b D I I r : DII between blue and red bands
k b k g   :   the slope in Equation (5) for the pair band D I I b D I I g
k g k r   :   the slope in Equation (5) for the pair band D I I g D I I r
k b k r : the slope in Equation (5) for the pair band D I I b D I I r
Finally, Formula (5) was applied to create the DII images at the 492 nm, 566 nm, and 666 nm bands in the years 2016 and 2002 (Figure 6 and Figure 7).
The water corrected image bands were used to generate an additional input dataset, which is presented in the next section.
Data augmentation
We used a number of band transformations to generate a new input dataset to improve the capacity of object recognition in the mapping of coral reefs in the study site (Table 6).
The band ratios included the pairs of blue (492) over green (566), blue (492) over red (666), green (566) over blue (492), green (566) over red (666), red (666) over blue (492), and red (666) over green (566), whilst the first component of PCA was selected for the second transformation, resulting in 10 input bands (3 original, 6 band ratio, and 1 PCA bands) of Landsat 7 ETM (2002) and Planet (2016). Due to the degradation of coral in 2024, we applied additional spectral indexes (Table 7) to the Planet image, deriving 12 input bands in 2024.

2.3. Machine Learning Approach

A range of different machine learning models, including Light Gradient Boosting Machine (LGBM) and Deep Forest (DF), were deployed to map live coral reefs in Nha Trang Bay MPA.

2.3.1. Introduction of LGBM and DF Models

Light Gradient Boosting Machine (LGBM)
Light Gradient Boosting Machine (LGBM) is a high-performance gradient boosting framework developed by Microsoft. It is designed for speed and efficiency, making it well-suited for large-scale datasets. Unlike traditional gradient boosting methods, LGBM uses a histogram-based learning approach and leaf-wise tree growth, which significantly enhances training speed while maintaining high accuracy [35].
LGBM follows the principle of gradient boosting decision trees (GBDTs), where a series of weak learners (decision trees) are trained sequentially to minimize a loss function. LGBM is well-recognized for the novel leaf-wise tree growth and histogram-based binning. Unlike level-wise growth, LGBM expands the leaf with the largest loss reduction and hence helps to improve the learning efficiency, while the second strategy reduces memory consumption and speeds up the learning computation. Due to these optimizations, LightGBM is widely used in applications such as ranking, classification, and regression tasks.
Deep Forest (DF)
Deep Forest, also known as gcForest (Multi-Grained Cascade Forest), is a machine learning model based on Random Forests but designed with a cascade structure to learn complex features from data. Introduced in [36], DF combines the robustness of ensemble algorithms with deep learning ideas to solve classification and regression problems without requiring complex neural networks or powerful graphical processing units (GPUs).
DF operates the learning and prediction in two main phases of multi-grained scanning and cascade forest learning. The output from the previous layer (both the original features and extracted features) is fed into the next layer with the random forest as a base learner. The model stops training when the validation error does not decrease or when reaching a predefined maximum number of layers.
One of the major advantages of DF is that it does not require large datasets or parallel GPU processing. Despite its complex architecture, DF remains effective for small- to medium-sized datasets. More importantly, the model’s output remains interpretable due to its tree-based structure. Therefore, DF is a viable option, especially when deep learning solutions are needed but computational resources are limited.

2.3.2. Model Hyper-Parameter Optimization

We employed a five-fold cross validation (CV) grid search procedure in scikit-learn [37], coupled with trial-and-error to find the optimal hyper-parameter combination for the LGBM and DF models (Table 8).

2.3.3. Model Implementation

We randomly split the input dataset into 50% for training and 50% for validation using the scikit-learn library (Table 9).
The LGBM model was used to analyze data from Landsat 7 ETM (2002) and Planet (2016), while the DF model was applied to Planet (2024) images. Although DF has a higher learning potential than LGBM, it requires a denser, more accurate input dataset and incurs higher computational costs. Given data availability across 2002, 2016, and 2024, as well as the scattered distribution of coral reefs in 2024, we selected DF for Planet imagery in 2024 while opting for LGBM in 2002 and 2016 to maintain a balanced computational cost.
Based on the 2024 field survey and published documents from 2002 and 2016, we defined four habitat classes: deep water 1, deep water 2, rock/dead coral, and (live) coral. Regions of interest (ROIs) were identified using field survey data for 2024, published research [28] for 2002 and 2016, and additional grey literature from around 2002.

2.3.4. Model Evaluation

To assess model performance in coral mapping for Nha Trang MPA, we used standard evaluation metrics, involving overall accuracy ( O A ), Kappa coefficient ( κ ), precision ( P ), recall ( R ), and F 1 scores (Equations (8)–(12)).
O A y , y ^ = 1 n s a m p l e s i = 0 n s a m p l e s 1 y ^ i = y i
in which
y ^ i : predicted value
y i : corresponding true value
n s a m p l e s : the total number of validation samples
κ = p o p e 1 p e
in which
p o : the observed agreement; p e : the expected agreement
P = T P T P + F P
R = T P T P + F N
F 1 = 2 × P × R P + R
in which
T P : true positive
F P : false positive
F N : false negative

3. Results

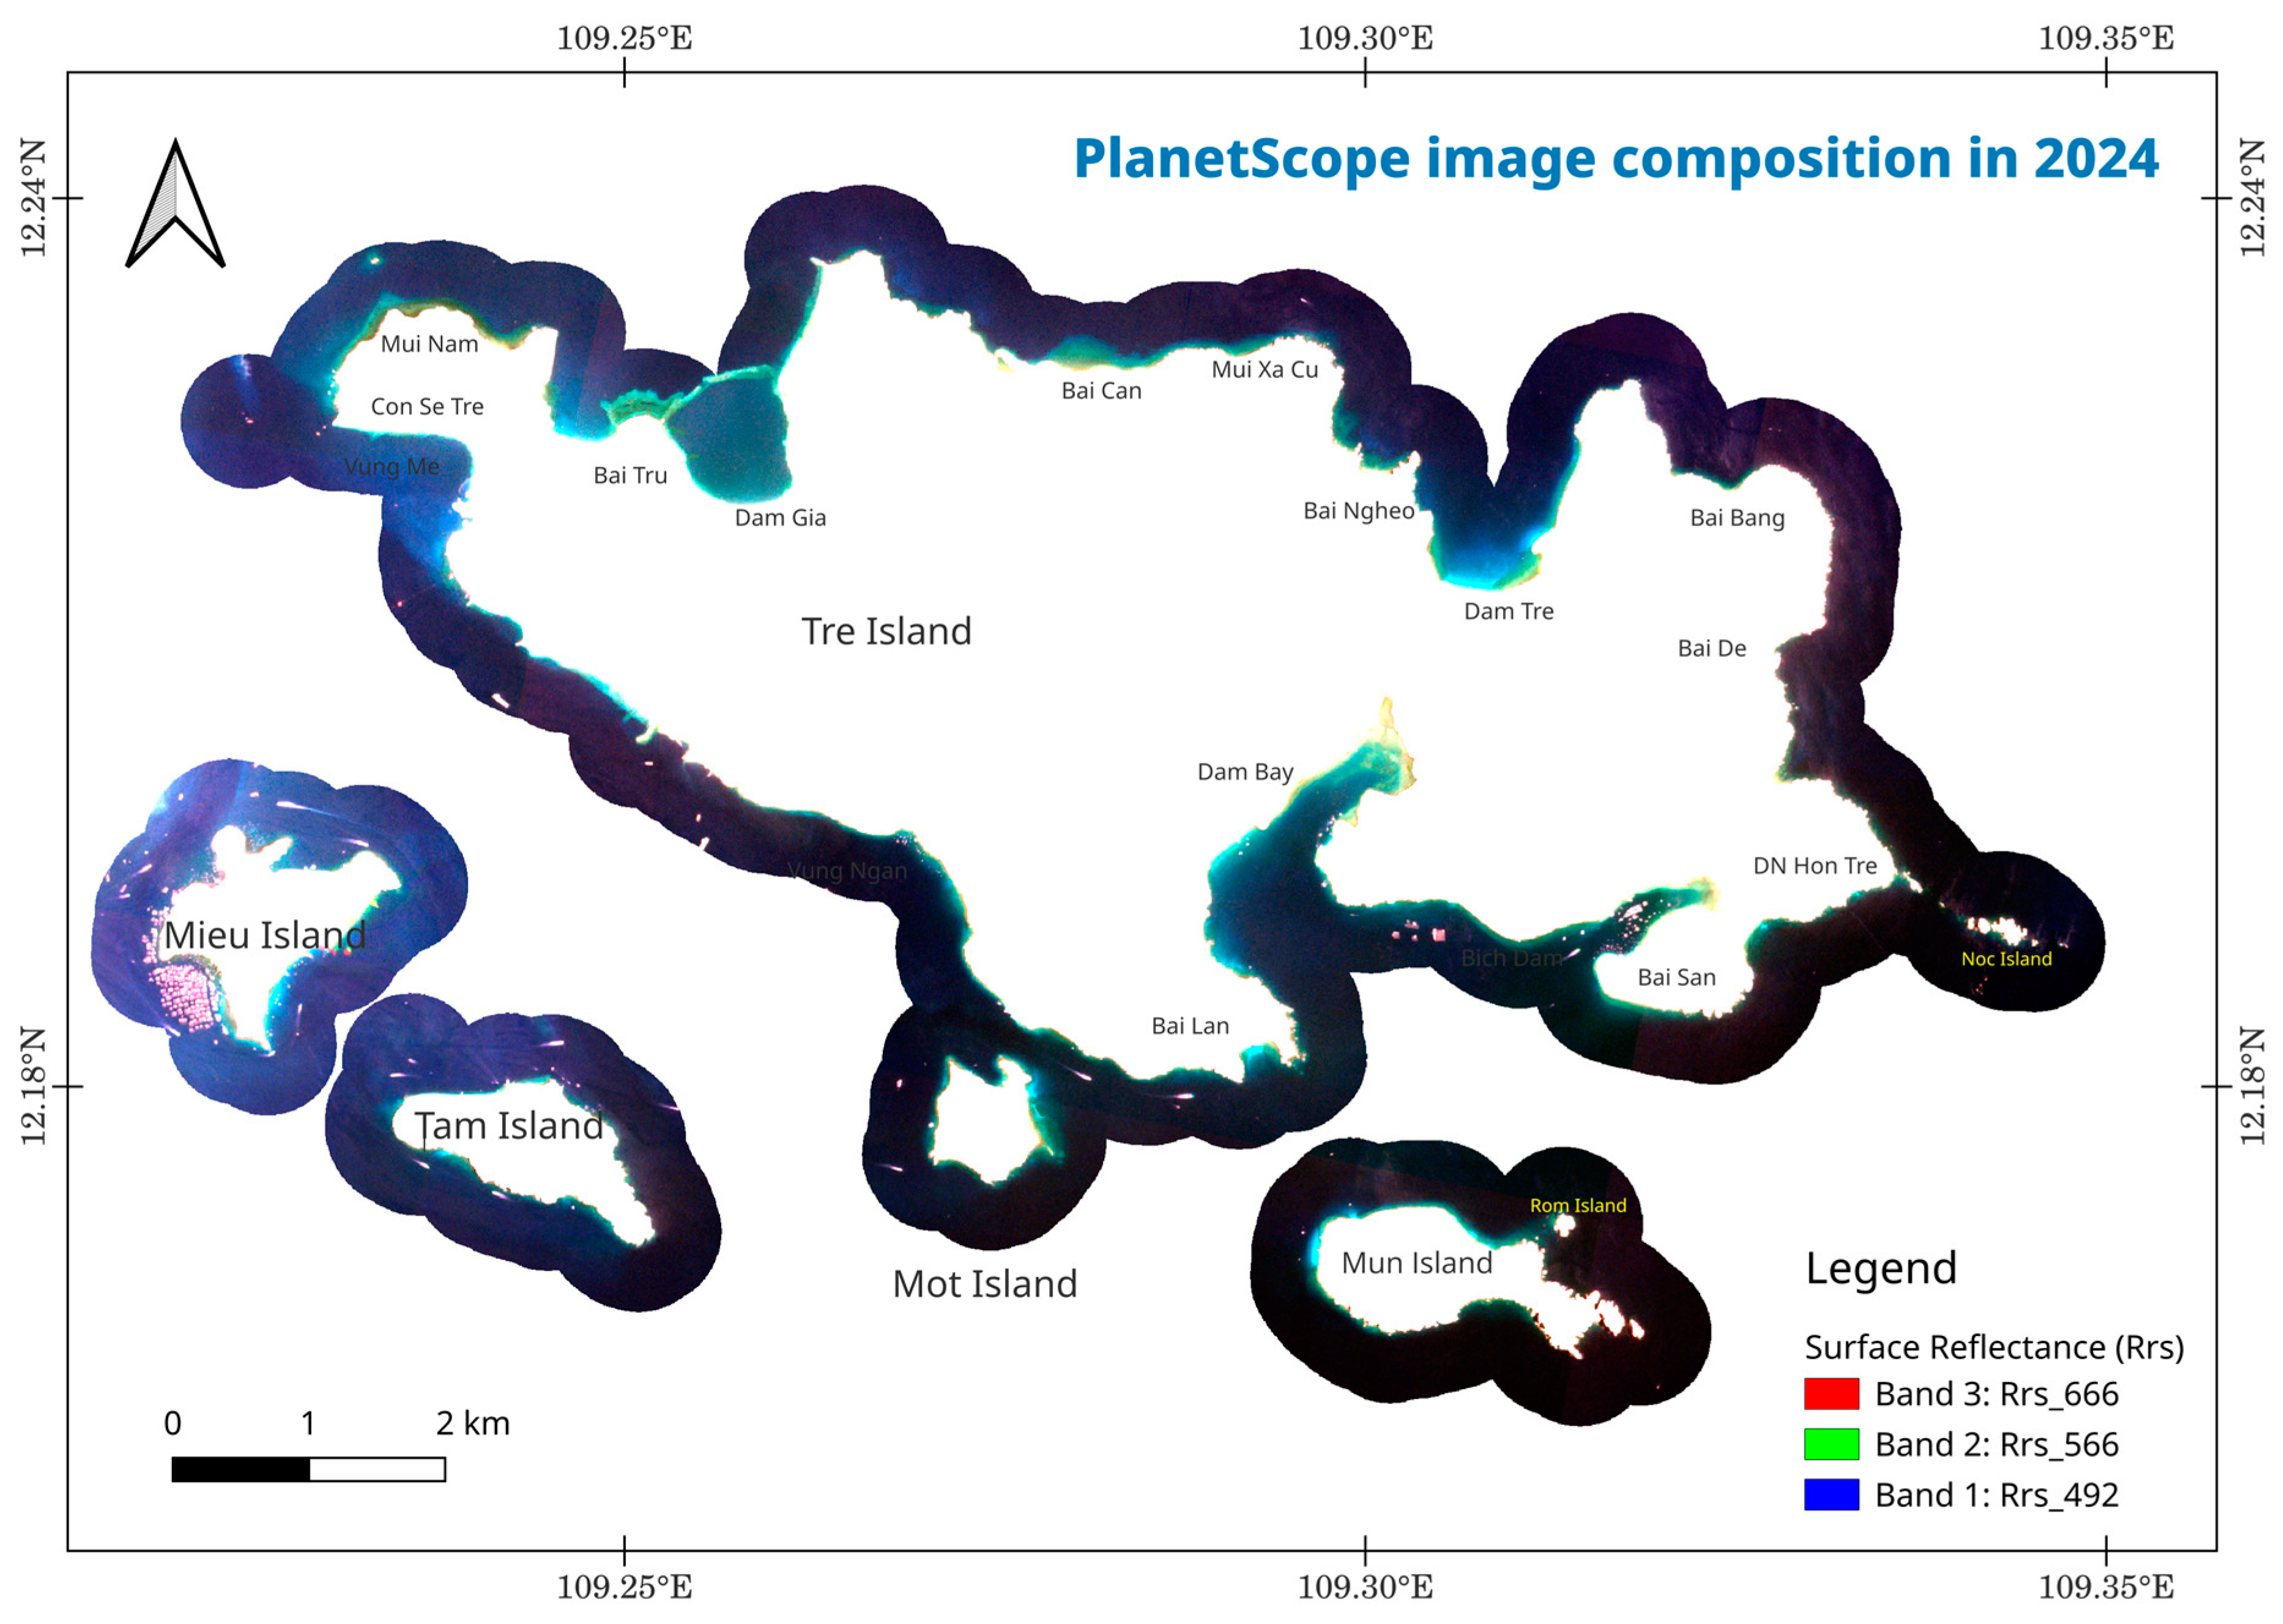
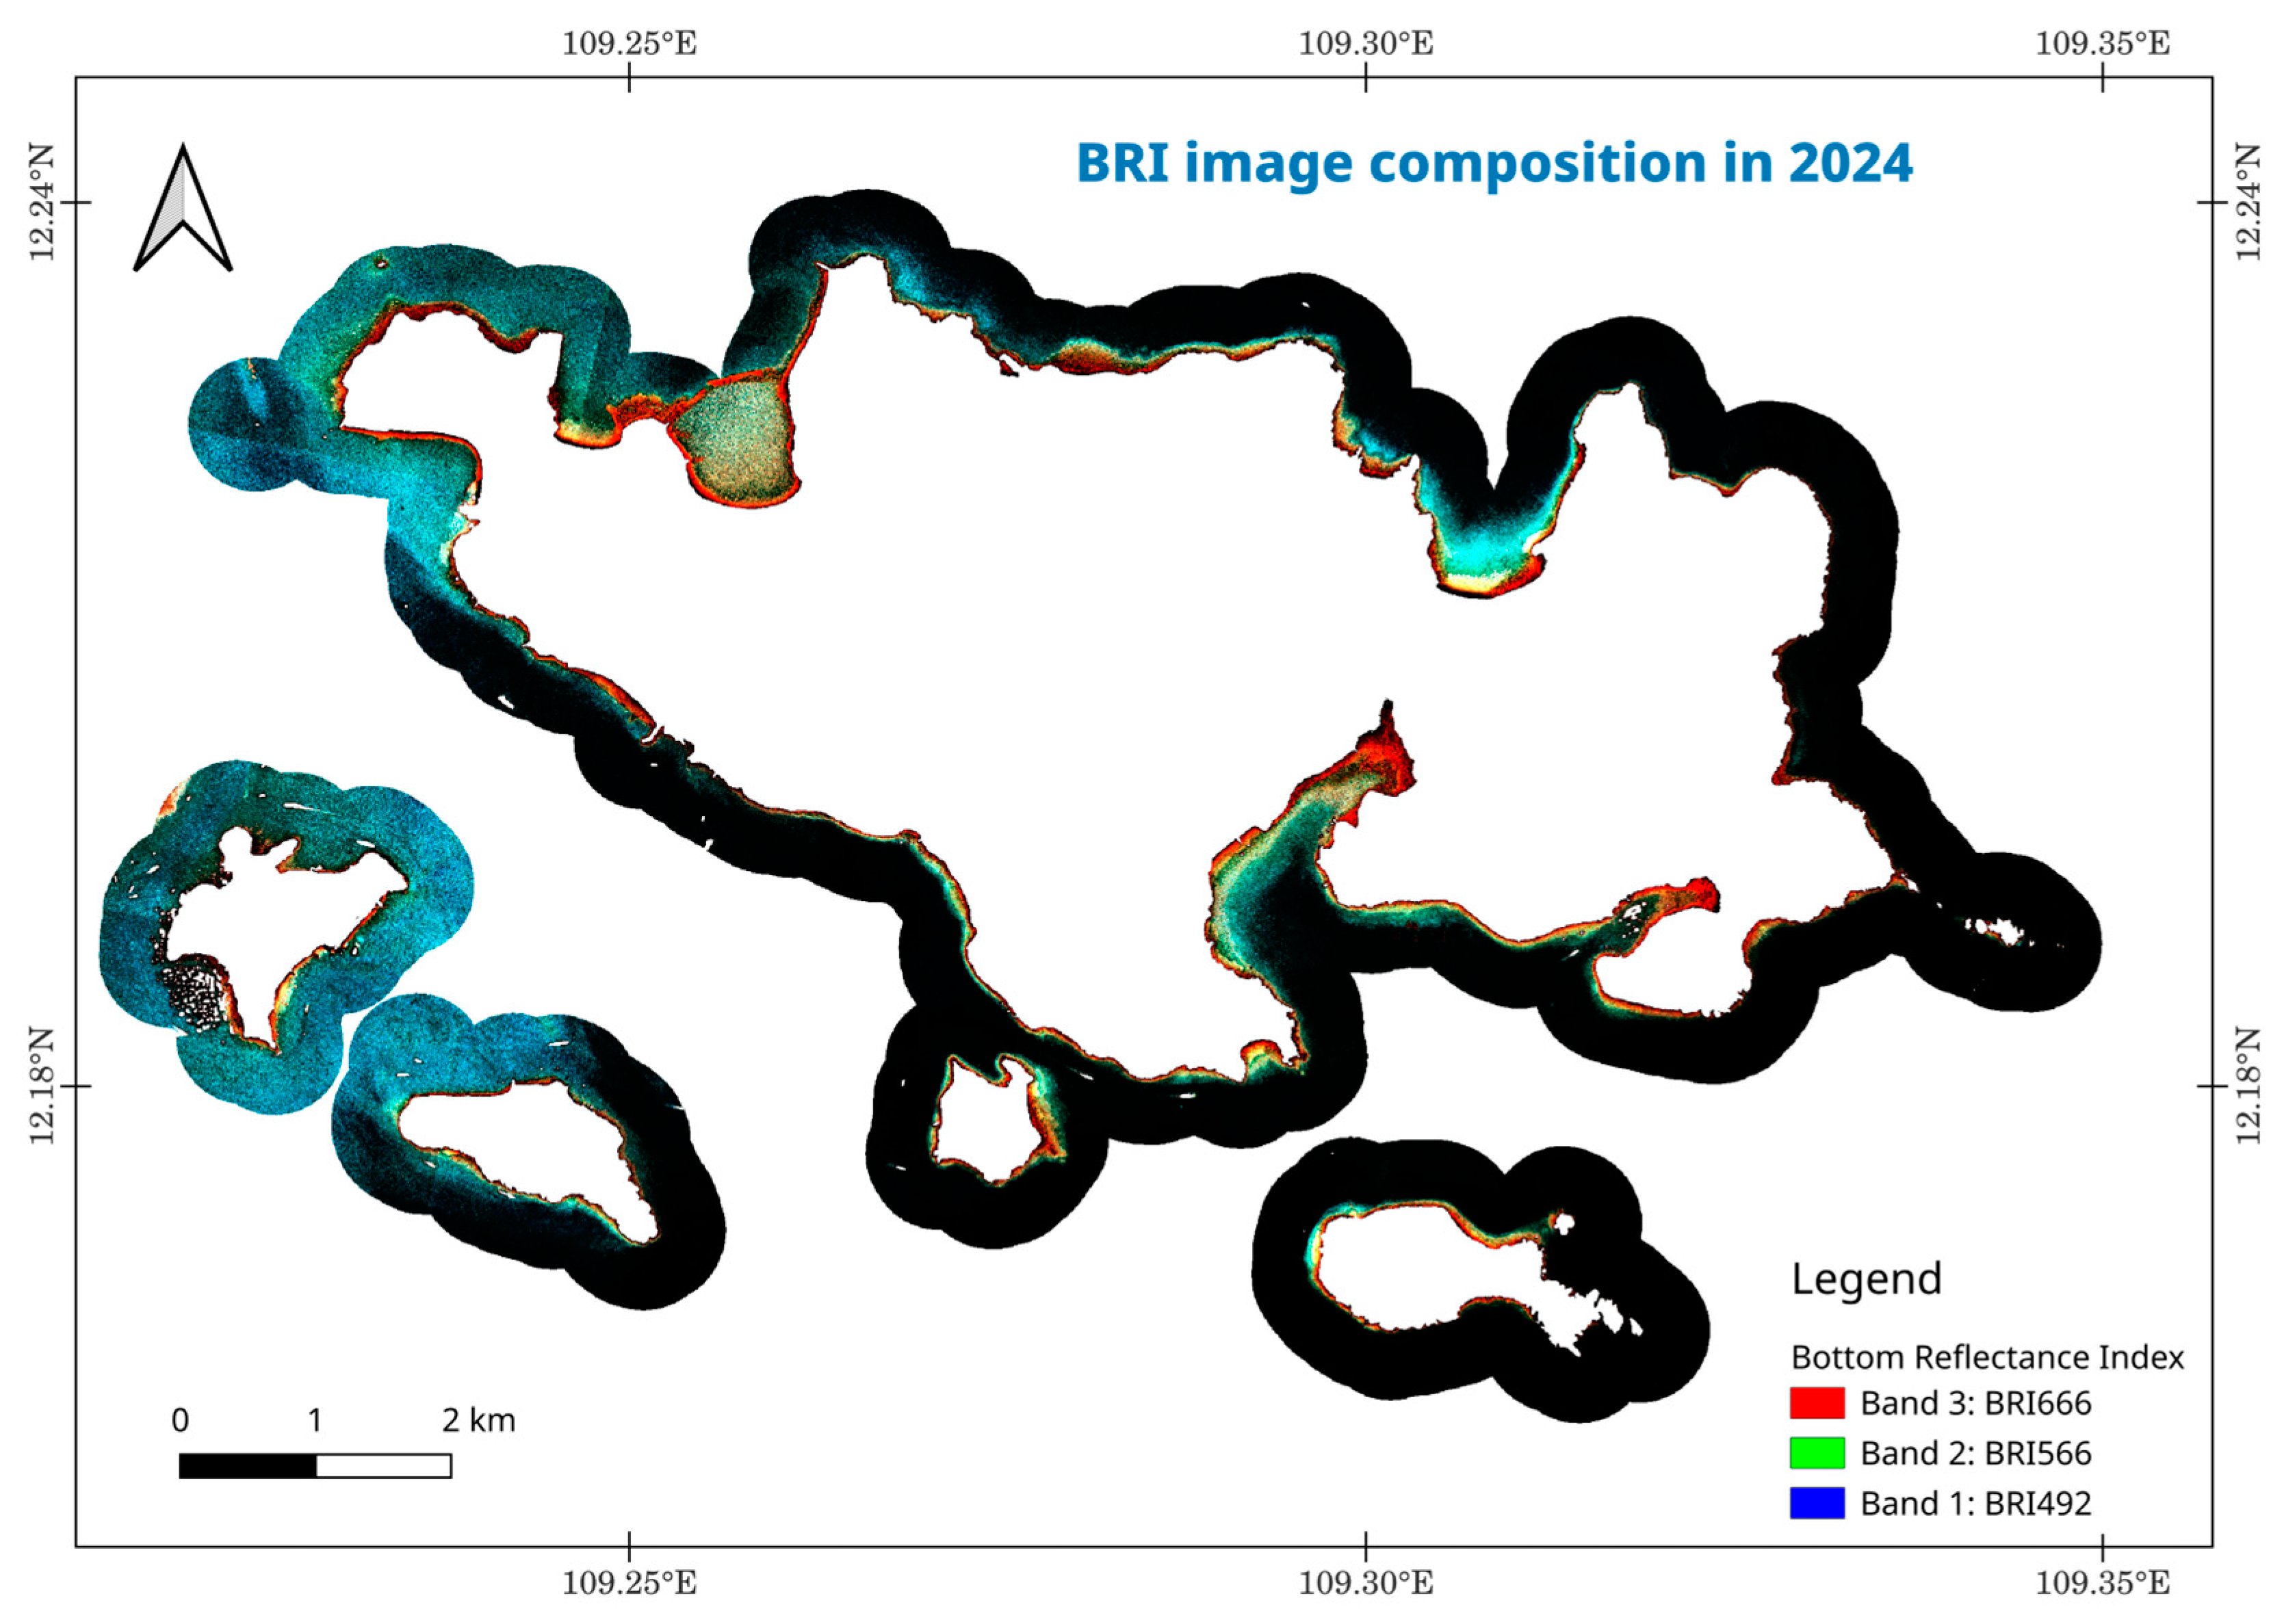
3.1. Current Status of the Coral Reef Habitat in Nha Trang MPA

The DF model derived the coral spatial distribution at a high confidence of κ = 0.92 and F 1 score = 0.86 (Table 10).
Given the complex environmental conditions with diverse anthropogenic activities around Nha Trang MPA, the DF is capable of discovering approximately 84% of input pixels as potential coral, which improves the accuracy of coral classification up to 88%. The coral area was estimated as 84.34 ha, deriving from the DF model and Planet image in 2024 (Figure 8), which approximately coincided with the ~70 ha reported in 2019 [27].
Despite general agreement with the coral distribution map from 2015 [28], coral reefs have disappeared in several areas across Nha Trang MPA (Figure 8). Coral distribution varies among islands, with Tre, Mot, and Mun having larger and denser coral coverage compared to Tam and Mieu. Coral is observed only on the western and northern sides of Mun Island and the eastern side of Mot Island. Tre Island, previously reported to have widespread coral coverage [28], now shows coral presence primarily in specific regions, including Mui Nam, Bich Dam, Bai Lan, and Vung Ngan (Figure 8).

3.2. Coral Reef Area Changed over Two Decades

Using the same methodology, the LGBM was deployed to map the coral reefs in 2016 (Table 10) and 2002 (Table 11). Coral was detected with high confidence, achieving an accuracy of κ = 0.89 and F 1 = 0.82 using PlanetScope imagery in 2016, and κ = 0.83 and F 1 = 0.85 using Landsat 7 ETM+ imagery in 2002.
The LGBM model was capable of discriminating coral from other substrata with a minimum precision of 0.82 in 2016 and a highest precision of 0.84 in 2002. The accuracy assessment indicated higher values of both precision ( P ) and recall ( R ) in 2002 than those in 2016 for the coral class (Table 11 and Table 12).
Following the maps derived from the LGBM model, coral areas were estimated as 150.66 ha and 275.72 ha in 2016 and 2002, respectively (Figure 9a,b).
Coral was not observed at the tail of Mun Island but was widespread around Tre, Tam, Mot, and Mieu Islands. Coral density was particularly high in Dam Bay and Dam Tre on Tre Island, as well as around Mot, Tam, and Mieu Islands. A significant difference in coral distribution was observed across all islands between 2002 and 2016, likely due to land-use changes.

3.2.1. Coral Changes Between 2002 and 2016

We visualized coral reef loss and gain between 2002 and 2016 by overlaying the 2016 coral map onto the 2002 map and conducting change detection analysis (Figure 10a,b).
During this period, a substantial decline in coral cover occurred across most of Tre Island (Figure 10), while Mun and Tam Islands experienced significant coral loss in their northern and western regions. Mot and Mieu Islands exhibited mixed patterns of coral loss and gain. Some coral reappeared along the southern side of Tam Island and between its northern and southern sections. Overall, coral loss was estimated at approximately 125.06 ha between 2002 and 2016 in Nha Trang MPA.

3.2.2. Coral Changes Between 2016 and 2024

Between 2016 and 2024, both coral loss and recovery were observed. Figure 11 highlights extensive reef loss along the shorelines of Tre, Mun, Mot, Tam, and Mieu Islands. Coral loss hotspots were identified at Vung Me, Mui Nam, Bai Tru, Bai Can, Bai Ngheo, and Dam Bay. Mot, Tam, and Mieu Islands experienced more loss than gain, whereas Mun Island showed signs of coral recovery. Notably, newly gained coral areas emerged slightly farther out from previously lost reefs.
In total, 66.32 ha of coral disappeared from Nha Trang MPA between 2016 and 2024. This rate of loss is comparable to the 125.06 ha decline recorded over the longer period from 2002 to 2016, indicating a continuing trend of coral degradation.

3.2.3. Coral Changes Between 2002 and 2024

A similar pattern of coral loss and gain was observed over the 22-year period from 2002 to 2024 in Nha Trang MPA (Figure 12). Statistically, 191.38 ha of coral reefs have disappeared across all islands, with significant losses recorded at Mui Nam, Bai Can, Bai Ngheo, Bai San, and Dam Bay on Tre Island. During this period, coral restoration was observed on the eastern sides of Mieu and Mot Islands, as well as the western and northern parts of Mun Island. In contrast, coral cover declined on other sides of Mieu, Mot, and Tam Islands. Mun Island exhibited a dynamic pattern, with a mix of both coral loss and recovery over the 22-year timeframe.

4. Discussion

4.1. Coral Reef Detection Using Remote Sensing and ML

In this study, we present an advanced approach for detecting spatial changes in coral reefs over two decades (2002–2024) using refined satellite image processing techniques and state-of-the-art machine learning (ML) models. Our methodology integrates atmospheric and water column corrections with ML-based analysis to accurately track coral reef variations within the Nha Trang Marine Protected Area (MPA).
A locally retrieved dataset was used to validate detection accuracy for 2002, 2016, and 2024. The results reveal a significant decline in coral cover, with losses of 44.02% between 2016 and 2024 and 69.41% between 2002 and 2024. Compared to conventional coral mapping approaches, our study pioneers the use of LightGBM (LGBM) and Deep Forest (DF) models, outperforming traditional methods such as Maximum Likelihood (MLH), Support Vector Machine (SVM), and Random Forest (RF). Our methodology achieves superior reliability in complex aquatic environments, surpassing reported accuracy ranges from previous studies (0.67–0.90 [18], 0.75 [17], 0.41–0.90 [16], and 0.72–0.78 [19]) with a Kappa coefficient exceeding 0.6 [20].
Furthermore, we recommend Landsat imagery for long-term change detection and PlanetScope imagery for current mapping as cost-effective alternatives to high-resolution commercial satellites like IKONOS, QuickBird, and WorldView [16,18]. This approach, validated in Nha Trang MPA, offers a scalable and efficient solution for coral reef monitoring worldwide.
Even though remote sensing combined with ML models can improve the accuracy of results, this approach still has several limitations. As a remote sensing method, it remains constrained by the inherent optical properties of the aquatic system, particularly when observing turbid benthic habitats [38]. Additionally, in this study, the use of Landsat imagery with a 30 m spatial resolution introduces uncertainty in areas where coral reefs are distributed in small, patchy formations. Another limitation arises from the uncertainty in bathymetric data, which is a critical input for the water column correction process [39]. Lastly, the ML models themselves must be carefully selected, ideally through sensitivity analyses or comprehensive evaluations, to ensure reliability and robustness.

4.2. Major Factors Governing Changes in Coral Reef Habitat

There are a number of threats contributing to coral reef mortality, ranging from local factors such as fishing and pollution to global drivers like ocean warming [24]. While local impacts may seem minimal, they are often overshadowed or exacerbated by global-scale stressors. In the case of the Nha Trang Bay MPA, various factors govern the degradation of the coral reef ecosystem [30]. However, it is not always clear which of these drivers are from human activities and which are the result of natural processes. For example, crown-of-thorns starfish (COTS) feed on coral and are generally considered a natural cause of coral loss. Yet, human activities such as overfishing can lead to the decline of their natural enemies (biological control agents), while water pollution creates favorable conditions for their population to grow. Therefore, in this study, we did not distinguish between natural and anthropogenic causes of coral degradation. Instead, we focused on identifying and discussing the major contributing factors observed within the Nha Trang Bay MPA.

4.2.1. Local Resident Activities

The Nha Trang Bay MPA encompasses nine islands (Figure 1) and hosts an international port capable of accommodating hundreds of ships and tens of thousands of tourists annually [40]. The daily lives of local fishermen and residents are deeply intertwined with the marine habitats in Nha Trang Bay MPA. Studies indicate that a 1% increase in fishing effort results in a 0.259% decline in coral coverage [22]. Additionally, the proliferation of floating aquaculture farms has contributed to eutrophication, further degrading the bay’s marine environment. Harmful fishing practices, including dynamite and cyanide fishing and the overharvesting of commercial invertebrates, exacerbate coral reef destruction [30].
Eutrophication, combined with increased suspended sediments from islands near Nha Trang City, has severely impacted coral communities, particularly around Mieu Island [41]. This process is driven by pollution from terrigenous runoff and the activities of floating aquaculture farms [41]. A 14-year record of rare earth element proxies for marine pollution in Nha Trang Bay MPA, along with other trace metals, reveals a dramatic increase in terrestrial trace metal concentrations [40]. This surge corresponds with the rise in coastal development projects such as road, port, and resort construction, as well as port and river dredging and dumping activities since 2000 [40].
The construction of large tourist complexes, such as Diamond Bay and Vinpearl, has drastically altered the coastline, leading to significant coral reef destruction, particularly on Hon Tre Island, the largest in the bay [3]. Figure 13 showcases the expansion of the tourist complex between 2002 and 2022, indicating significant changes in land use in Nha Trang MPA. Between 2003 and 2004, 50 ha of coral reefs were destroyed due to backfilling in the inner part of Dam Gia Bay on the northwest coast of Hon Tre Island [3]. Further losses occurred between 2002 and 2016, totaling 125.06 ha of coral reefs as discovered in this study.
A preliminary survey in July 2022 revealed that 65% of nearshore corals were broken and washed ashore [42]. At Mun Island (Figure 1), numerous 50–70 kg coral blocks were found along the west, southwest, and north coasts, primarily due to tourism activities, waste discharge, and climate change effects [42].

4.2.2. Crown-of-Thorns Starfish

Crown-of-thorns starfish (COTS) are large marine invertebrates widely distributed across tropical regions. As major coral predators, COTS (Acanthaster spp.) remain a significant driver of extensive coral loss throughout Indo-Pacific reefs. COTS outbreaks have ecosystem-wide impacts, altering the composition of coral communities and dominant coral genera, which leads to changes in coral cover, coral composition, community structure, and associated organisms [43]. For example, more than 90% of the remaining relatively healthy reefs in Nha Trang Bay MPA died off between 2017 and 2019 due to an outbreak of the COTS, exacerbated by sea surface temperature anomalies [3]. By 2019, the mean abundance of Acanthaster planci in Nha Trang Bay MPA had reached 4.2 starfish per 100 m2 [27]. By 2019, the mean abundance of Acanthaster planci had reached 4.2 starfish per 100 m2, an eight-fold increase beyond the sustainable threshold for coral communities [27]. Coral surveys at 10 target sites over a three-year period documented an average coral cover decline of 64.4%, with losses ranging from 43% to 95%. The severity of the outbreak was likely exacerbated by ineffective COTS removal, primarily due to overfishing of natural predators and nutrient enrichment from local seasonal upwelling. Figure 14 presents an example of two COTS individuals recorded at Hon Mot in March 2024.

4.2.3. Pollution Discharged from Mainland

The bay is hydrologically connected to the mainland by two major rivers, the Cai River and the Tac (Lo) River (Figure 1), with catchment areas of 1900 km2 and 120 km2, respectively [40]. The Cai River, located in the north, has a basin area of approximately 3000 km2, discharging 5.6 m3/s during the dry season and 78 m3/s in the rainy season. In contrast, the Tac River, in the south, has a smaller basin (120 km2), with discharges of 0.6 m3/s in the dry season and 2.6 m3/s in the rainy season [44].
Annually, these rivers contribute approximately 916.41 km³ of freshwater and 80.64 tons of sediment to the bay, with the Cai River accounting for the majority due to its larger watershed and branching network [3]. Eroded materials from recent resort and port infrastructure construction, urbanization, and industrial zone expansion are transported into the bay via these rivers or as localized runoff from urban areas. This has led to the alarming degradation of the bay’s environment and ecosystems, particularly the coral reefs. These ecosystems face complex anthropogenic impacts, including bottom dredging in the Tac River estuary and Nha Trang harbor, with dredged materials being dumped in neighboring waters; the establishment of resorts and tourist centers along the coastline; increased terrigenous runoff resulting from land development and mangrove deforestation in the estuaries of the Cai and Tac Rivers; and the input of toxic sediments with mutagenic effects from the Cai River [30].
River and urban runoff have resulted in high concentrations of dissolved nutrients, with peak values observed in river estuaries. In the Cai River estuary, phosphate concentrations reach up to 423.87 mg/m3, and nitrate concentrations reach up to 184.02 mg/m3. Similarly, in the Lo River estuary, phosphate and nitrate concentrations reach up to 48.53 mg/m3 and 198.45 mg/m3, respectively. The concentration of total suspended solids (TSSs) in the bay averages 1.80 ± 1.07 g/m3 during the dry season and 9.73 ± 7.08 g/m3 during the rainy season. In estuaries, TSS concentrations during the rainy season can reach 60–70 g/m3 [3,45].
Additionally, Chlorophyll-a (Chl-a), an indicator of aquatic ecological health, shows elevated levels in the Cai and Tac rivers, with higher concentrations in the Cai River (Figure 15). Its spatial distribution declines from estuaries toward offshore areas, suggesting that river discharges play a dominant role in shaping Chl-a concentrations in Nha Trang Bay [46].

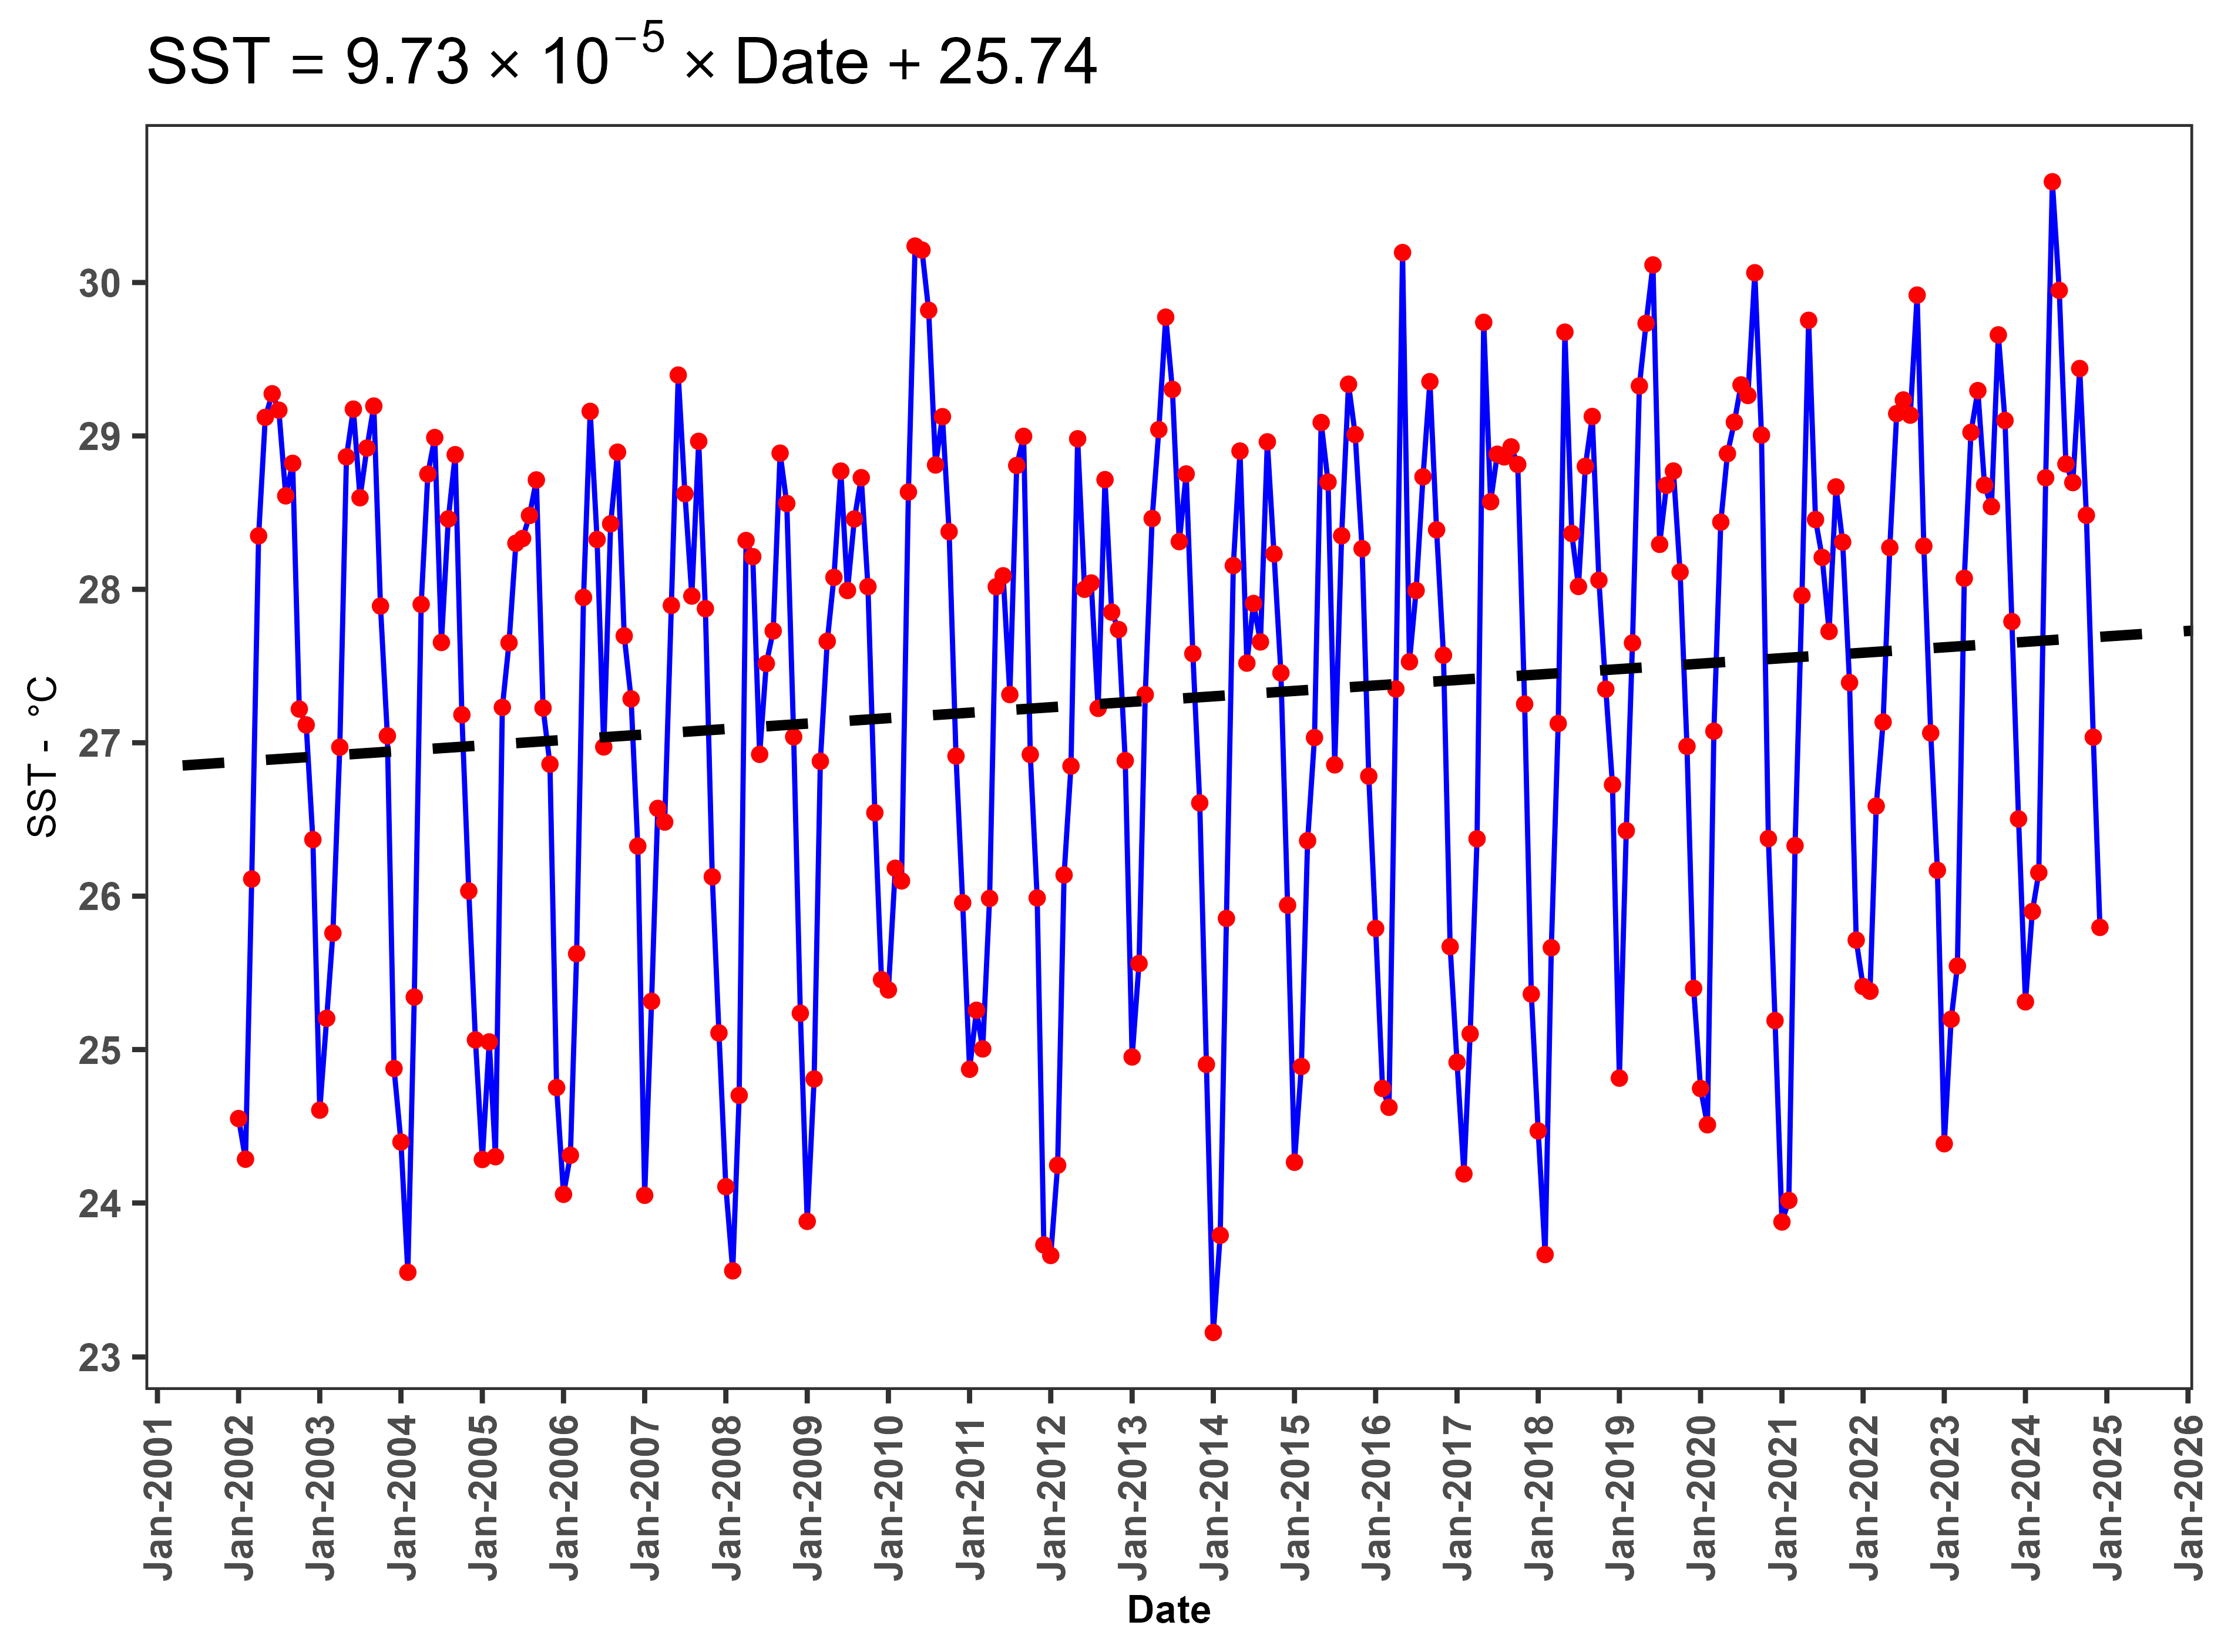
4.2.4. Global Warming

The coral–zooxanthellae symbiosis is highly sensitive to rising sea surface temperatures (SSTs), which trigger the expulsion of symbiotic algae, leading to coral bleaching [5]. It is estimated that coral coverage declines by 2.49% for every 1% increase in SSTs [22].
The monthly average SST data in Nha Trang Bay from January 2002 to December 2024 indicates that the SST reached its highest value in May 2024 and its lowest in January 2014, with corresponding values of 30.66 °C and 23.16 °C, respectively. Figure 16 shows that SSTs typically peak in May and September each year. Notably, SST values exceeded the threshold of 30 °C at the following times: May 2010 (30.24 °C), June 2010 (30.21 °C), May 2016 (30.20 °C), June 2019 (30.11 °C), September 2020 (30.06 °C), and May 2024 (30.66 °C) (Figure 16). Figure 16 illustrates the linear relationship between SST and time (Date) from 2002 to 2024. The results indicate a positive linear correlation between SST and Date, expressed by the equation SST = 9.73 × 10⁻⁵ × Date + 25.74. Since the slope coefficient is greater than zero, SST shows an increasing tendency over time. This trend is further supported by linear regression analysis (represented by the black line in Figure 16), which highlights a consistent long-term rise in SSTs throughout the study period. Previous studies indicate that in the waters of Khanh Hoa, SSTs exceeding 29.6 °C induce thermal stress in coral reefs, making them more susceptible to bleaching and degradation [47].

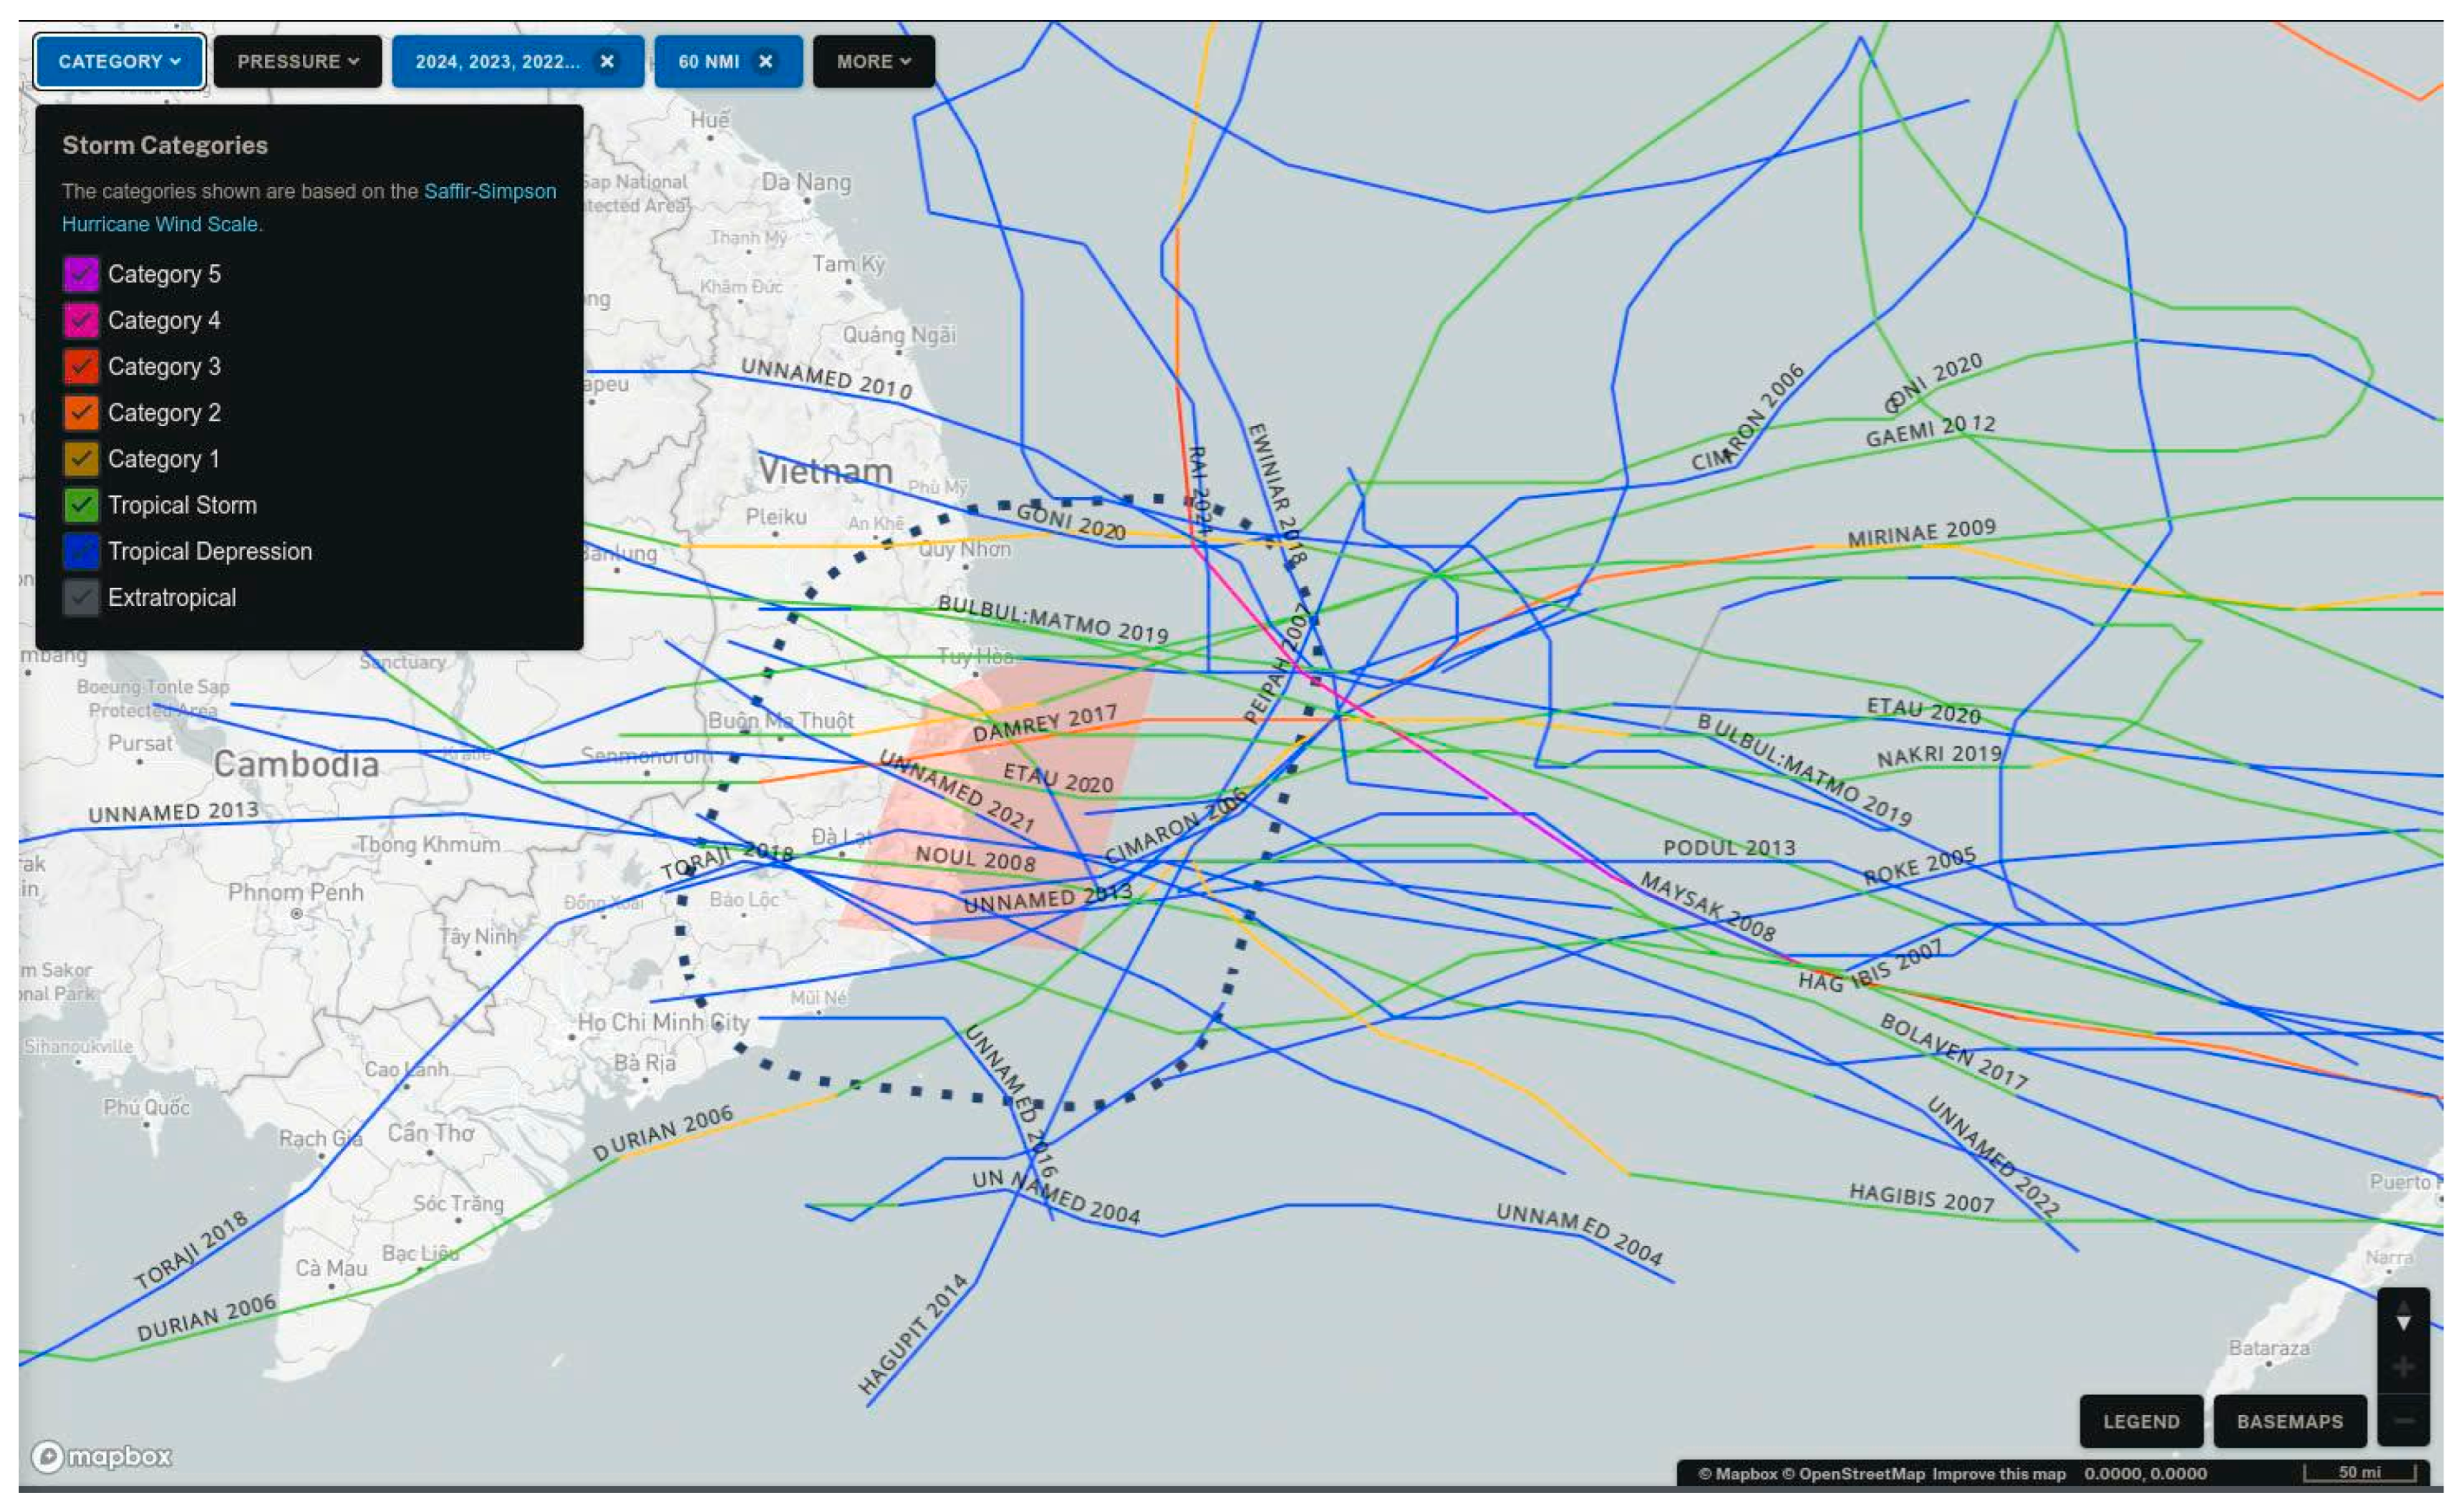
4.2.5. Climate Change, an Increase in Tropical Storms and Cyclones

The degradation of coral reefs in Nha Trang Bay is the result of cumulative impacts over the years, driven by both natural and anthropogenic factors [48]. Among the natural stressors, climate change and extreme weather events, such as Typhoon Damrey (2017) and Typhoon No. 9 (2021), have significantly contributed to coral loss [48]. According to Historical Hurricane Tracks data from [49], a total of 32 hurricanes have affected the waters of Khanh Hoa between 2002 and 2022 (Figure 17), further exacerbating coral reef degradation.

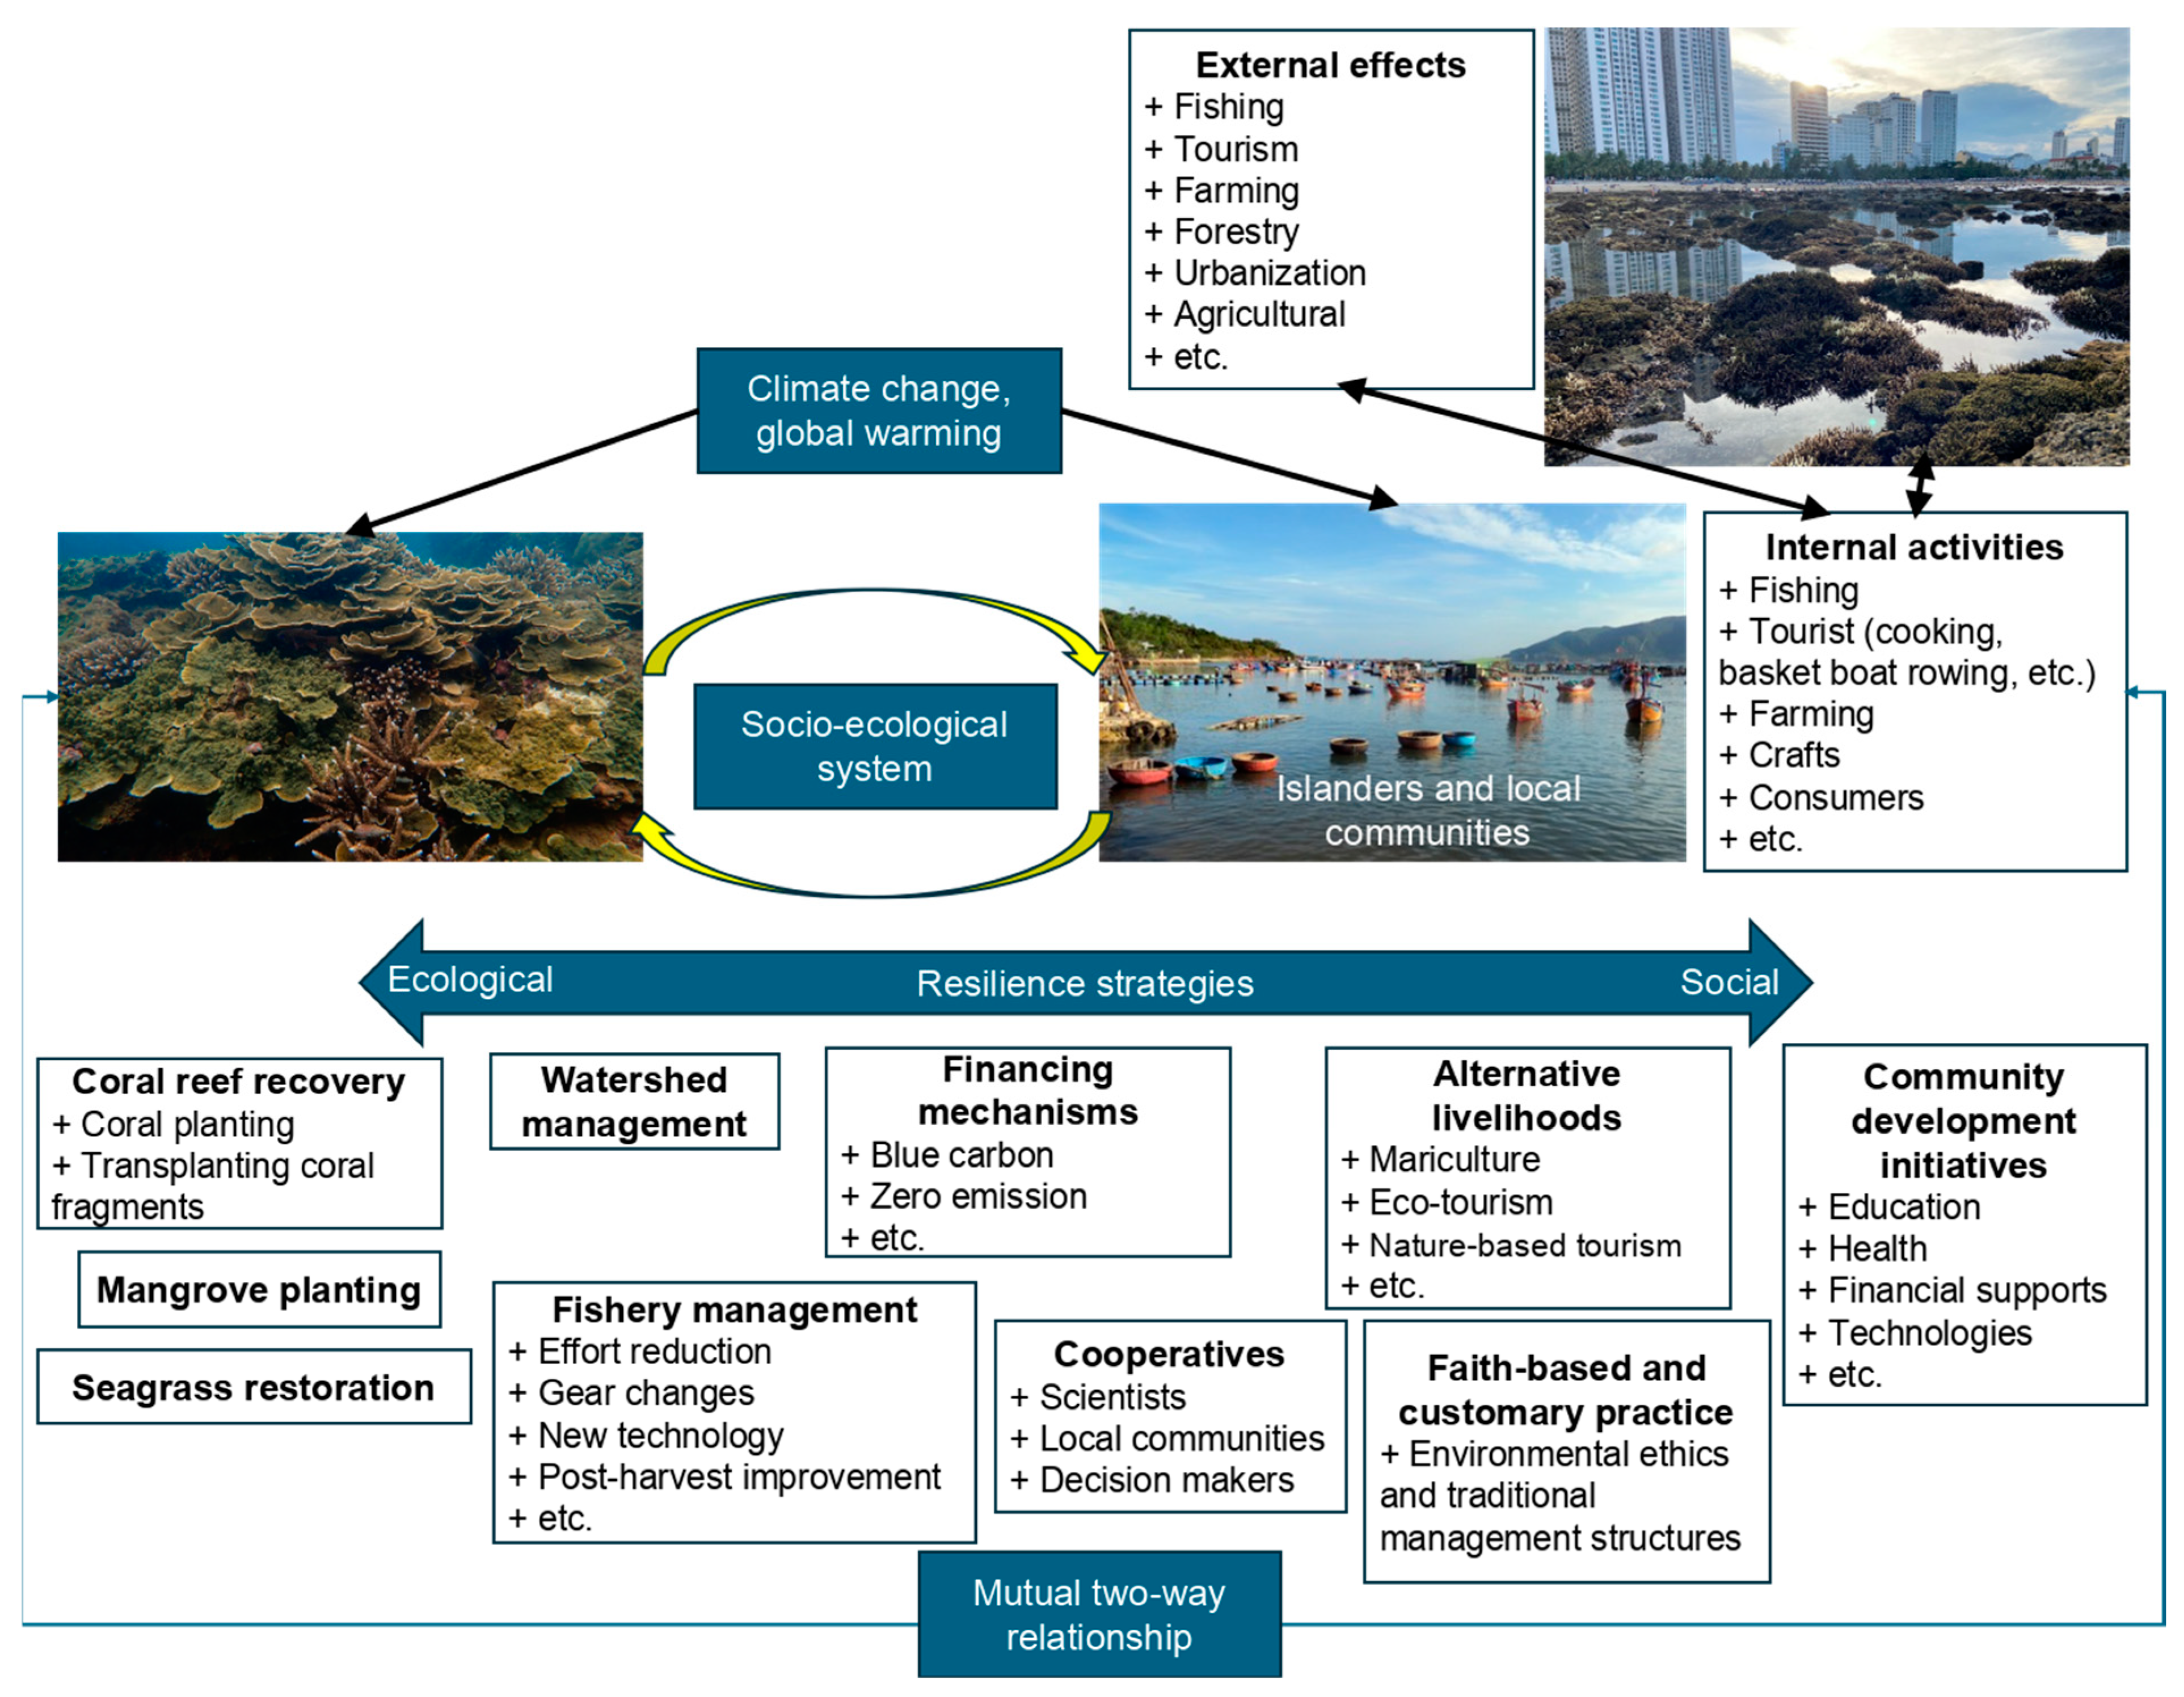
4.3. Proposed Approach for Better Management

4.3.1. Community-Based Management (CBM) and Community-Based Tourism (CBT)

Local communities are the primary focus of sustainable development goals, as they play an essential role in the success of destination development and CBT programs. Community participation is therefore critical, significantly influencing the success or failure of both sustainable CBM and CBT models, as well as coral reef ecosystem conservation strategies [50]. For instance, a case study at Nhon Ly coastal village (about 250 km to the north of Nha Trang Bay MPA) showed that tourism positively impacts various aspects of the local community. In addition, communities are strongly aware of the importance of marine resources for ensuring their livelihoods in tourism development. Therefore, most community members actively participate in conservation activities to protect the marine environment. Another case study is Ran Trao, located about 70 km north of the Nha Trang Bay MPA, where community-based management has evolved into an effective approach for managing natural resources and addressing environmental challenges. To promote and enhance stakeholder participation, awareness-raising activities have been conducted in various innovative forms, including Core Groups, Capacity Building for Officers and the Community, Regular Community Dialogues, Public Campaigns, Communication Visual Aids, Social Events, School Activities, and the establishment of a Community Environmental Education Center. As a result, these efforts have contributed to improved marine resource management and ecosystem health, while also supporting more sustainable livelihoods and lifestyles [51].
Based on lessons learned from several successful projects that applied community-based management for marine ecosystem conservation, the Khanh Hoa Provincial People’s Committee has recently issued a master plan to preserve and restore coral reefs in Nha Trang Bay. The plan outlines specific tasks and solutions, including raising awareness and changing the behaviors of individuals, communities, and businesses. To mitigate further damage, SCUBA diving tourism at degraded reef sites around Mun Island and other affected locations will be suspended. Additionally, activities harmful to coral habitats in the Mun Island sea area and other core zones of Nha Trang Bay will be restricted. Provincial authorities will strengthen regulations on aquaculture, enhance patrols, and strictly protect the Mun Conservation Area, ensuring that violations of environmental laws in Nha Trang Bay are promptly detected and addressed. A notable aspect of this initiative is the mobilization of support from the Bich Dam residential community and both domestic and international organizations, creating a sustainable financial mechanism for coral reef management and conservation. The Bich Dam community has also developed an eco-tourism model, emphasizing a green, clean, and sustainable island lifestyle, which is helping local fishermen transition to alternative livelihoods [52].
Based on the current status of the coral reef ecosystem in the Nha Trang Bay MPA, we propose a detailed framework for community-based management, as illustrated in Figure 18.
Moreover, several urgent activities need to be implemented in the Nha Trang Bay MPA to recover the coral reef ecosystems:
-
Reducing local anthropogenic impacts may increase coral reefs’ resilience to climate change.
-
Reducing local stressors also provides time for coral reef species to adapt or acclimate [5].
-
Reducing dependence on fishing is crucial for protecting coral reefs.
-
Alternative fishing restrictions, such as controlling the species caught, fishing gear, access, and seasonal closures of breeding sites, can successfully sustain fish biomass while maintaining key ecosystem functions, such as herbivory.
-
Improving water quality by minimizing sedimentation and nutrient enrichment could enhance ecosystem health.
-
Coral reef conservation is a multi-scale objective that requires support from various stakeholders and organizations, from local, rights-based management to regional and national marine planning and international laws and regulations on trade.

4.3.2. Ecosystem-Based Management (EBM)

In addition to community-based management and community-based tourism, we propose adopting ecosystem-based management (EBM) to enhance the protection of coral reefs and other benthic habitats within Nha Trang Bay MPA. By integrating the primary pressures affecting coral reefs into an ecosystem model, EBM allows for the evaluation of alternative management strategies and their effectiveness in improving ecosystem functions and services [54]. Even under severe climate change scenarios, localized management can play a vital role in enhancing ecosystem resilience and services.
From a dive tourism perspective, coral reefs with high fish biomass, biodiversity, and the presence of charismatic species are particularly attractive to divers. However, the popularity of such reefs may lead to negative consequences, such as overuse and overcrowding, which may harm resident marine communities. On the other hand, dive tourism can provide alternative livelihoods for coastal communities, helping to reduce pressure on fisheries by supporting businesses such as dive and snorkel operations.
In Nha Trang Bay MPA, understanding both current and future drivers of ecosystem change—including coral disease outbreaks, land-use shifts, trade patterns, and fishing practices—is crucial for prioritizing and adapting management actions that sustain ecosystems and human well-being. This includes identifying and prioritizing actions that enhance system resilience, such as protecting processes and species that support the system’s ability to withstand and recover from disturbances. Key actions include mitigating threats (e.g., controlling pollution, sedimentation, and overfishing), supporting ecosystem processes (e.g., recruitment and recovery) by managing herbivore populations and improving water quality, and fostering alternative livelihoods to reduce pressure on reef resources [55]. We recommend the following points to ensure the long-term resilience of social-ecological systems amid climate change:
(i)
Minimize local stressors to reduce additional environmental pressure.
(ii)
Redesign the Nha Trang Bay MPA (e.g., through zoning and rezoning) to address both local pressures and global environmental changes.
(iii)
Implement active management approaches, such as human-assisted evolution and reef restoration, to support ecosystem recovery.
(iv)
Develop coordinated management and governance systems at multiple levels, incorporating local customary tenure and community participation.
Despite the novel contributions of this study in developing mapping and change detection frameworks, as well as the valuable insights gained from linking coral dynamics with external drivers (e.g., climate change and anthropogenic activities), this study comes with unavoidable limitations. The application of state-of-the-art machine learning (ML) models necessitates extensive field data for effective model training and prediction, along with advanced water column correction techniques—both of which were limited under the conditions of the Nha Trang MPA. These constraints may have hindered the optimal performance of the ML models. Ongoing research aims to address these limitations through the collection of additional field data on coral distribution (i.e., to improve the temporal resolution of the maps and to identify the shifting phase coral reefs) and the inherent optical properties of the water column, as well as more robust quantitative analyses of the relationships between coral dynamics and environmental factors.

5. Conclusions

This study examined the spatiotemporal dynamics of coral distribution over a 22-year period (2002–2024) in the Nha Trang MPA, one of Vietnam’s most important marine conservation sites. High-resolution coral mapping was conducted using advanced machine learning models—Light Gradient Boosting Machine (LGBM) and Deep Forest (DF)—applied to Landsat (30 m) and PlanetScope (3 m) satellite imagery. The classification results demonstrated high accuracy, with κ = 0.83 and F1 = 0.85 in 2002, κ = 0.89 and F1 = 0.82 in 2016, and κ = 0.92 and F1 = 0.86 in 2024.
Change detection analysis revealed a total coral loss of 191.38 hectares from 2002 to 2024, with major declines observed around Tre, Mun, Mot, Tam, and Mieu Islands. Notably, 125.06 hectares were lost between 2002 and 2016—nearly double the 66.32 hectares lost during 2016–2024.
Coral distribution changes were influenced by various factors, including anthropogenic pressures, land-use change, water quality degradation (e.g., sedimentation and nutrient enrichment), rising sea temperatures, and crown-of-thorns starfish outbreaks. Among these, land-use change—particularly from long-term landfill activities—emerged as the dominant driver of coral loss. For the purpose of supporting coral reef conservation and recovery, this study proposes a community-based management framework focused on protecting existing coral habitats and restoring degraded areas through targeted, site-specific interventions.
To build long-term resilience of the coral reefs under climate change and anthropogenic activities, we suggest that policymakers reduce local stressors, redesign the Nha Trang MPA through adaptive zoning, and apply active ecosystem recovery methods like reef protection and ecological restoration. Equally important is establishing coordinated, multi-level governance that incorporates community participation and respects local customary tenure.

Author Contributions

Conceptualization, N.H.Q., H.N.T. and N.T.D.H.; data curation, T.D.D., V.T.H. and N.D.H.T.; formal analysis, N.H.Q., H.N.T. and N.T.D.H.; methodology, N.H.Q., H.N.T. and N.T.D.H.; resources, N.T.D.H.; supervision, H.N.T.; visualization, T.P.H.S., T.N.-Q. and T.T.T.H.; writing—original draft, N.H.Q., H.N.T. and N.T.D.H.; writing—review and editing, T.D.D., V.T.H., N.D.H.T., T.P.H.S., T.N.-Q. and T.T.T.H. All authors have read and agreed to the published version of the manuscript.

Funding

This research was funded by the Joint Vietnam—Russia Tropical Science and Technology Research Center under grant number 5416/QĐ-TTNĐVN (project code: VB.Đ1.11/24).

Data Availability Statement

The raw data supporting the conclusions of this article will be made available by the authors on request.

Acknowledgments

This study is part of a research project conducted by the Joint Vietnam—Russia Tropical Science and Technology Research Center, under project code VB.Đ1.11/24. The research team sincerely appreciates the support of colleagues at the Coastal Branch of the Joint Vietnam—Russia Tropical Science and Technology Research Center in helping us complete this study.

Conflicts of Interest

The authors declare no conflicts of interest.

References

  1. Andréfouët, S.; Bionaz, O. Lessons from a global remote sensing mapping project. A review of the impact of the Millennium Coral Reef Mapping Project for science and management. Sci. Total. Environ. 2021, 776, 145987. [Google Scholar] [CrossRef]
  2. Souter, D.; Planes, S.; Wicquart, J.; Logan, M.; Obura, D.; Staub, F. Status of Coral Reefs of the World: 2020 Report. Global Coral Reef Monitoring Network (GCRMN) and International Coral Reef Initiative (ICRI). 2021. Available online: https://bvearmb.do/handle/123456789/3189 (accessed on 15 April 2025).
  3. Tkachenko, K. Degradation of coral reefs under complex impact of natural and anthropogenic factors with Nha Trang Bay (Vietnam) as an example. Biol. Bull. Rev. 2023, 13, 442–459. [Google Scholar] [CrossRef]
  4. Hamylton, S.M. Mapping coral reef environments: A review of historical methods, recent advances and future opportunities. Prog. Phys. Geogr. 2017, 41, 803–833. [Google Scholar] [CrossRef]
  5. Harvey, B.J.; Nash, K.L.; Blanchard, J.L.; Edwards, D.P. Ecosystem-based management of coral reefs under climate change. Ecol. Evol. 2018, 8, 6354–6368. [Google Scholar] [CrossRef]
  6. Eddy, T.D.; Lam, V.W.; Reygondeau, G.; Cisneros-Montemayor, A.M.; Greer, K.; Palomares, M.L.D.; Bruno, J.F.; Ota, Y.; Cheung, W.W. Global decline in capacity of coral reefs to provide ecosystem services. One Earth 2021, 4, 1278–1285. [Google Scholar] [CrossRef]
  7. Levine, A.S.; Feinholz, C.L. Participatory GIS to inform coral reef ecosystem management: Mapping human coastal and ocean uses in Hawaii. Appl. Geogr. 2015, 59, 60–69. [Google Scholar] [CrossRef]
  8. Lau, C.M.; Kee-Alfian, A.A.; Affendi, Y.A.; Hyde, J.; Chelliah, A.; Leong, Y.S.; Low, Y.L.; Megat Yusop, P.A.; Leong, V.T.; Mohd Halimi, A. Tracing coral reefs: A citizen science approach in mapping coral reefs to enhance marine park management strategies. Front. Mar. Sci. 2019, 6, 539. [Google Scholar] [CrossRef]
  9. Araujo, J.C.; Seoane, J.C.S.; Lima, G.V.; da Silva, E.G.; França, L.G.; de Souza Santos, E.E.; de Oliveira, I.M.; Pereira, P.H.C. High-resolution optical remote sensing geomorphological mapping of coral reef: Supporting conservation and management of marine protected áreas. J. Sea Res. 2023, 196, 102453. [Google Scholar] [CrossRef]
  10. Quang, N.H.; Van Thanh, L.; Duan, H.D. Study on spatial distribution of coral reefs in Ly Son Island using GIS and remote sensing technique. Vietnam. J. Mar. Sci. Technol. 2015, 15, 264–272. [Google Scholar] [CrossRef]
  11. Hedley, J.D.; Roelfsema, C.M.; Chollett, I.; Harborne, A.R.; Heron, S.F.; Weeks, S.J.; Skirving, W.J.; Strong, A.E.; Eakin, C.M.; Christensen, T.R. Remote sensing of coral reefs for monitoring and management: A review. Remote Sens. 2016, 8, 118. [Google Scholar] [CrossRef]
  12. Kabiri, K.; Rezai, H.; Moradi, M. Mapping of the corals around Hendorabi Island (Persian Gulf), using Worldview-2 standard imagery coupled with field observations. Mar. Pollut. Bull. 2018, 129, 266–274. [Google Scholar] [CrossRef] [PubMed]
  13. Mumby, P.J.; Skirving, W.; Strong, A.E.; Hardy, J.T.; LeDrew, E.F.; Hochberg, E.J.; Stumpf, R.P.; David, L.T. Remote sensing of coral reefs and their physical environment. Mar. Pollut. Bull. 2004, 48, 219–228. [Google Scholar] [CrossRef] [PubMed]
  14. Ha, N.T.; Manley-Harris, M.; Pham, T.D.; Hawes, I. The use of radar and optical satellite imagery combined with advanced machine learning and metaheuristic optimization techniques to detect and quantify above ground biomass of intertidal seagrass in a New Zealand estuary. Int. J. Remote Sens. 2021, 42, 4712–4738. [Google Scholar] [CrossRef]
  15. Selgrath, J.C.; Roelfsema, C.; Gergel, S.E.; Vincent, A.C. Mapping for coral reef conservation: Comparing the value of participatory and remote sensing approaches. Ecosphere 2016, 7, e01325. [Google Scholar] [CrossRef]
  16. Burns, C.; Bollard, B.; Narayanan, A. Machine-learning for mapping and monitoring shallow coral reef habitats. Remote Sens. 2022, 14, 2666. [Google Scholar] [CrossRef]
  17. White, E.; Amani, M.; Mohseni, F. Coral reef mapping using remote sensing techniques and a supervised classification algorithm. Adv. Environ. Eng. Res. 2021, 2, 028. [Google Scholar] [CrossRef]
  18. Da Silveira, C.B.L.; Strenzel, G.M.R.; Maida, M.; Gaspar, A.L.B.; Ferreira, B.P. Coral reef mapping with remote sensing and machine learning: A nurture and nature analysis in marine protected areas. Remote Sens. 2021, 13, 2907. [Google Scholar] [CrossRef]
  19. Gapper, J.J.; Maharjan, S.; Li, W.; Linstead, E.; Tiwari, S.P.; Qurban, M.A.; El-Askary, H. A generalized machine learning model for long-term coral reef monitoring in the Red Sea. Heliyon 2024, 10, 13. [Google Scholar] [CrossRef]
  20. Radford, B.; Puotinen, M.; Sahin, D.; Boutros, N.; Wyatt, M.; Gilmour, J. A remote sensing model for coral recruitment habitat. Remote Sens. Environ. 2024, 311, 114231. [Google Scholar] [CrossRef]
  21. Dung, L.D. Nha Trang Bay marine protected area, Vietnam: Initial trends in coral structure and some preliminary linkages between these trends and human activities (2002–2005). Aquat. Ecosyst. Health Manag. 2009, 12, 249–257. [Google Scholar] [CrossRef]
  22. Ngoc, Q.T.K. Assessing the value of coral reefs in the face of climate change: The evidence from Nha Trang Bay, Vietnam. Ecosyst. Serv. 2019, 35, 99–108. [Google Scholar] [CrossRef]
  23. Vo, T.S.; Long, N.V.; Hoang, P.K.; Ben, H.X.; DeVantier, L. Ecological monitoring of Nha Trang Bay Marine Protected Area, Nha Trang, Khanh Hoa, Vietnam. In Reassessment 2002–2005 (No. 15); Biodiversity Report; Institute of Oceanography: Nha Trang, Vietnam, 2005. [Google Scholar]
  24. Bruno, J.F.; Valdivia, A. Coral reef degradation is not correlated with local human population density. Sci. Rep. 2016, 6, 29778. [Google Scholar] [CrossRef]
  25. Long, N.V.; Tuan, V.S. Status of coral reefs in Southeast Asia. In Status of Coral Reefs in East Asian Seas Region: 2014; Tadashi, K., Karenne, T., Ming, C.L., Eds.; Ministry of the Environment: Tokyo, Japan, 2014. [Google Scholar]
  26. Van Nguyen, L.; Kim Phan, H. Distribution and factors influencing on structure of reef fish communities in Nha Trang Bay Marine Protected Area, South-Central Vietnam. Environ. Biol. Fishes. 2008, 82, 309–324. [Google Scholar] [CrossRef]
  27. Tkachenko, K.S.; Huan, N.H.; Thanh, N.H.; Britayev, T.A. Extensive coral reef decline in Nha Trang Bay, Vietnam: Acanthaster planci outbreak: The final event in a sequence of chronic disturbances. Mar. Freshw. Res. 2020, 72, 186–199. [Google Scholar] [CrossRef]
  28. Van Long, N.; Son, T.P.H. Status and trends of change in distribution of marine habitats in Nha Trang bay. Vietnam. J. Mar. Sci. Technol. 2017, 17, 469–479. [Google Scholar] [CrossRef]
  29. Tuan, V.; Nguyen, V.; Ben, H. Coral Reef Monitoring of Hon Mun MPA, Nha Trang Bay, Vietnam: Baseline Assessment and Training of the Community-based Monitoring Team; Biodiversity Report 2; Institute of Oceanography: Nha Trang, Vietnam, 2002; Volume 2. [Google Scholar]
  30. Tkachenko, K.S.; Britayev, T.A.; Huan, N.H.; Pereladov, M.V.; Latypov, Y.Y. Influence of anthropogenic pressure and seasonal upwelling on coral reefs in Nha Trang Bay (Central Vietnam). Mar. Ecol. 2016, 37, 1131–1146. [Google Scholar] [CrossRef]
  31. Hodgson, G.; Hill, J.; Kiene, W.; Maun, L.; Mihaly, J.; Liebeler, J.; Shuman, C.; Torres, R. Reef Check Instruction Manual: A Guide to Reef Check Coral Reef Monitoring; Reef Check Foundation: Pacific Palisades, CA, USA, 2006; p. 93. [Google Scholar]
  32. Quinten, V. ACOLITE. Available online: https://github.com/acolite/acolite (accessed on 1 December 2024).
  33. Gamon, J.; Surfus, J. Assessing leaf pigment content and activity with a reflectometer. New Phytol. 1999, 143, 105–117. [Google Scholar] [CrossRef]
  34. Woebbecke, D.M.; Meyer, G.E.; Von Bargen, K.; Mortensen, D.A. Color indices for weed identification under various soil, residue, and lighting conditions. Trans. ASAE 1995, 38, 259–269. [Google Scholar] [CrossRef]
  35. Ke, G.; Meng, Q.; Finley, T.; Wang, T.; Chen, W.; Ma, W.; Ye, Q.; Liu, T.-Y. Lightgbm: A highly efficient gradient boosting decision tree. Adv. Neural Inf. Process. Syst. 2017, 30, 3149–3157. [Google Scholar]
  36. Zhou, Z.-H.; Feng, J. Deep forest. Natl. Sci. Rev. 2019, 6, 74–86. [Google Scholar] [CrossRef]
  37. Pedregosa, F.; Varoquaux, G.; Gramfort, A.; Michel, V.; Thirion, B.; Grisel, O.; Blondel, M.; Prettenhofer, P.; Weiss, R.; Dubourg, V. Scikit-learn: Machine learning in Python. Ournal Mach. Learn. Res. 2011, 12, 2825–2830. [Google Scholar]
  38. Chirayath, V.; Instrella, R. Fluid lensing and machine learning for centimeter-resolution airborne assessment of coral reefs in American Samoa. Remote Sens. Environ. 2019, 235, 111475. [Google Scholar] [CrossRef]
  39. David, C.G.; Kohl, N.; Casella, E.; Rovere, A.; Ballesteros, P.; Schlurmann, T. Structure-from-Motion on shallow reefs and beaches: Potential and limitations of consumer-grade drones to reconstruct topography and bathymetry. Coral Reefs 2021, 40, 835–851. [Google Scholar] [CrossRef]
  40. Nguyen, A.; Zhao, J.; Feng, Y.; Hu, W.; Yu, K.; Gasparon, M.; Pham, T.; Clark, T. Impact of recent coastal development and human activities on Nha Trang Bay, Vietnam: Evidence from a Porites lutea geochemical record. Coral Reefs 2013, 32, 181–193. [Google Scholar] [CrossRef]
  41. Tkachenko, K. Ecological status of coral communities in the island area of the Nha Trang Bay (Vietnam). Russ. J. Ecol. 2015, 46, 456–462. [Google Scholar] [CrossRef]
  42. Quang Ninh online. Measures Needed to Preserve Nha Trang Bay Corals. 2022. Available online: https://english.baoquangninh.vn/measures-needed-to-preserve-nha-trang-bay-corals-3196808.html (accessed on 1 January 2025).
  43. Foo, S.A.; Millican, H.R.; Byrne, M. Crown-of-thorns seastar (Acanthaster spp. ) Feed. Ecol. Across Species Regions. Sci. Total Environ. 2024, 930, 172691. [Google Scholar]
  44. Linh, V.T.T.; Kiem, D.T.; Ngoc, P.H.; Phu, L.H.; Tam, P.H.; Vinh, L.T. Coastal sea water quality of Nha Trang bay, Khanh Hoa, Viet Nam. J. Shipp. Ocean. Eng. 2015, 5, 123–130. [Google Scholar]
  45. Thu, P.M.; Huan, N.H.; Hieu, N.T.D.; Hieu, N.M.; Hanh, N.K.; Dung, L.T.; Du, H.T.; Mien, P.T.; Dung, L.T.; Thi, V.H. Features of organic matter biodegradation in coastal waters of Nha Trang city. Mar. Res. Collect. 2016, 22, 10. [Google Scholar]
  46. Hieu, N.T.D.; Tri, N.-Q.; Huan, N.H.; Dien, T.D.; Tran, N.D.H.; Lien, N.P.; Van, T.T. Estimating the Chlorophyll-a in the Nha Trang Bay using Landsat-8 OLI data. IOP Conf. Ser. Earth Environ. Sci. 2023, 1226, 012010. [Google Scholar] [CrossRef]
  47. Van, T.T.; Hieu, N.T.D.; Huan, N.H.; Lien, N.P. Investigating sea surface temperature and coral bleaching in the coastal area of Khanh Hoa province. IOP Conf. Ser. Earth Environ. Sci. 2022, 964, 012004. [Google Scholar] [CrossRef]
  48. Khanh Hoa online. Nha Trang Bay Coral Reef Ecosystem: Proposed Comprehensive Restoration Solutions. 2022. Available online: https://baokhanhhoa.vn/xa-hoi/moitruong-dothi/202208/he-sinh-thai-ran-san-ho-vinh-nha-trang-de-xuat-giai-phap-tong-the-phuc-hoi-8261030/ (accessed on 1 January 2025).
  49. NOAA. Historical Hurricane Track 2024. Available online: https://coast.noaa.gov/hurricanes/ (accessed on 1 January 2025).
  50. Quang, T.D.; Nguyen, Q.X.T.; Nguyen, H.V.; Dang, V.Q.; Tang, N.T. Toward sustainable community-based tourism development: Perspectives from local people in Nhon Ly coastal community, Binh Dinh province, Vietnam. PLoS ONE 2023, 18, e0287522. [Google Scholar] [CrossRef] [PubMed]
  51. Tran, H.T.M.; Chou, L.M.; Nguyen, H.T. Increasing public participation through awareness raising activities: A case study in Trao Reef Marine Reserve, Vietnam. Environ. Nat. Resour. Res. 2013, 3, 24. [Google Scholar] [CrossRef]
  52. Viet Nam News. Khánh Hoà Issues Master Plan for Nha Trang Bay Restoration 2022. Available online: https://vietnamnews.vn/environment/1395873/khanh-hoa-issues-master-plan-for-nha-trang-bay-restoration.html (accessed on 1 January 2025).
  53. Hattam, C.; Evans, L.; Morrissey, K.; Hooper, T.; Young, K.; Khalid, F.; Bryant, M.; Thani, A.; Slade, L.; Perry, C. Building resilience in practice to support coral communities in the Western Indian Ocean. Environ. Sci. Policy 2020, 106, 182–190. [Google Scholar] [CrossRef]
  54. Weijerman, M.; Gove, J.M.; Williams, I.D.; Walsh, W.J.; Minton, D.; Polovina, J.J. Evaluating management strategies to optimise coral reef ecosystem services. J. Appl. Ecol. 2018, 55, 1823–1833. [Google Scholar] [CrossRef]
  55. Mcleod, E.; Anthony, K.R.; Mumby, P.J.; Maynard, J.; Beeden, R.; Graham, N.A.; Heron, S.F.; Hoegh-Guldberg, O.; Jupiter, S.; MacGowan, P. The future of resilience-based management in coral reef ecosystems. J. Environ. Manag. 2019, 233, 291–301. [Google Scholar] [CrossRef]
Figure 1. Nha Trang Bay MPA and its functional zones.
Water 17 01224 g001
Figure 2. Flowchart of the combination of ML and remote sensing in mapping coral reef distribution.
Water 17 01224 g002
Figure 3. An example of study boundaries generated using the K-Means classification and OBIA methods for PlanetScope scene in 2024.
Water 17 01224 g003
Figure 4. Bathymetry map at Nha Trang MPA in 2024.
Water 17 01224 g004
Figure 5. BRI image at Nha Trang MPA in 2024.
Water 17 01224 g005
Figure 6. Depth Invariant Index (DII) 3-band (DII_3–DII_2–DII_1) composited image derived from Planet image in 2016. Inside parentheses, numbers indicate DII values for DII_3, DII_2, and DII_1 bands. DII_3 (−1.37–−0.03)).
Water 17 01224 g006
Figure 7. Depth Invariant Index (DII) 3-band (DII3–DII2–DII1) composited image derived from Landsat image in 2002. Inside parentheses, numbers indicate DII values for DII_3, DII_2, and DII_1 bands.
Water 17 01224 g007
Figure 8. Spatial distribution of coral reef in Nha Trang MPA derived from DF model in 2024.
Water 17 01224 g008
Figure 9. Spatial distribution of coral reef in Nha Trang MPA derived from LGBM model in (a) 2016 and (b) 2002.
Water 17 01224 g009aWater 17 01224 g009b
Figure 10. Spatial changes of coral reef during the period of 2002 and 2016: (a) overlapping of coral distribution in 2002 and 2016; and (b) change detection of coral distribution between 2002 and 2016.
Water 17 01224 g010
Figure 11. Spatial changes of coral reef during the period of 2016 and 2024: (a) overlapping of coral distribution in 2016 and 2024; and (b) change detection of coral distribution between 2016 and 2024.
Water 17 01224 g011aWater 17 01224 g011b
Figure 12. Spatial changes of coral reef during the period of 2002 and 2024: (a) overlapping of coral distribution in 2002 and 2024; and (b) change detection of coral distribution between 2002 and 2024.
Water 17 01224 g012
Figure 13. Expanding tourist areas (red rectangles) on islands in Nha Trang Bay, especially Hon Tre from 2003 to 2023 (photo: Google Earth).
Water 17 01224 g013aWater 17 01224 g013b
Figure 14. The crown-of-thorns starfish was found in the southwest of Hon Mot (photo: N.T.D.H).
Water 17 01224 g014
Figure 15. Chlorophyll-a distribution in Nha Trang Bay influenced by Cai and Tac Rivers [46].
Water 17 01224 g015
Figure 16. SST trend over time from 2002 to 2024.
Water 17 01224 g016
Figure 17. Statistics of storms in the Nha Trang Bay area and nearby regions from 2002 to 2022 [49].
Water 17 01224 g017
Figure 18. Proposed framework for community-based coral reef management in the Nha Trang Bay MPA (adopted to [53]).
Water 17 01224 g018
Table 1. PlanetScope imagery profile.
Scene IDDate of AcquisitionProcessing LevelCloud CoverageSpectral Bands
Year 201620160831_022110_0e3031 August 20163B04 (Blue, Green, Red, NIR)
20160831_022111_0e30
20160831_022119_0e0e
20160831_022120_0e0e
Year 202420240424_022649_77_24d024 April 20243B08 (Coastal, Blue, Green 1, Green 2, Yellow, Red, RedEdge, NIR)
Table 2. Landsat 7 ETM+ imagery profile.
Scene IDDate of AcquisitionProcessing LevelCloud CoverageSpectral Bands
Year 2002LE07_L1TP_123052_20020114_20200917_02_T114 January 20021T76 (Blue, Green, Red, NIR, SWIR 1, SWIR 2)
Note: NIR—Near Infrared, SWIR—Shortwave Infrared.
Table 3. Model parameters used for atmospheric correction.
ParameterValue
aerosol_correctiondark_spectrum
dsf_interface_reflectanceTrue
min_tgas_aot0.85
min_tgas_rho0.70
dsf_residual_glint_correctionFalse
dsf_aot_computemin
dsf_aot_estimatefixed
OutputSurface reflectance at blue, green, and red channels
Table 4. Linear transformation and attenuation coefficients in 2016.
R2 k b k g k g k r k b k r
D I I b D I I g 0.930.94
D I I g D I I r 0.87 0.80
D I I b D I I r 0.73 1.00
Table 5. Linear transformation and DII coefficients in 2002.
R2 k b k g k g k r k b k r
D I I b D I I g 0.900.84
D I I g D I I r 0.94 0.46
D I I b D I I r 0.76 0.36
Table 6. Band transformation for images in 2002, 2016, and 2024.
Band RatioPrincipal Component Analysis (PCA)Spectral Index
Landsat 7 ETM (2002)YesYesNo
Planet (2016)YesYesNo
Planet (2024)YesYesYes
Table 7. Spectral index used for Planet in 2024.
IndexAbbreviationFormulaReference
1Red–green Ratio indexIRGr/g[33]
2Excess green indexExG2 × g r b[34]
Note: b, g, and r indicated the blue, green, and red spectral bands, respectively.
Table 8. Hyper-parameters for the Light Gradient Boosting Machine (LGBM), and Deep Forest (DF) models.
LGBM
boosting_typedartn_estimators90
learning_rate0.19num_leave10
max_depth−1
DF
max_layers20n_estimators6
use_predictorTruepredictorlightgbm
back_endsklearnPredictor_kwargs (lightgbm)
max_depth−1
min_sample_split4
min_sample_leaf4
n_estimators100
learining_rate0.09
Table 9. Input data for ML model learning.
Number of Input BandsNumber of Training PixelsNumber of Validation Pixels
Landsat 7 ETM (2002)10341341
Planet (2016)1015,91815,918
Planet (2024)1278507850
Table 10. Accuracy evaluation for coral mapping in 2024 using DF model.
O A κ P R F 1
Planet (2024)0.940.920.880.840.86
Table 11. Accuracy evaluation for coral mapping in 2016 using LGBM model.
O A κ P R F 1
Planet (2016)0.920.890.820.830.82
Table 12. Accuracy evaluation for coral mapping in 2002 using LGBM model.
O A κ P R F 1
Landsat 7 ETM+ (2002)0.880.830.840.850.85
Disclaimer/Publisher’s Note: The statements, opinions and data contained in all publications are solely those of the individual author(s) and contributor(s) and not of MDPI and/or the editor(s). MDPI and/or the editor(s) disclaim responsibility for any injury to people or property resulting from any ideas, methods, instructions or products referred to in the content.

