
Per- and Polyfluoroalkyl Substances in Surface Water of Fuyang River (Handan Section): Occurrence, Source Apportionment, and Risk Assessment


Abstract
1. Introduction
2. Materials and Methods
2.1. Experimental Reagents and Instruments
2.2. Sample Collection and Preservation
2.3. Sample Extraction
2.4. Instrument Analysis
2.5. Risk Assessment
3. Results and Discussion
3.1. Occurrence Characteristics and Composition Structure
3.2. Spatial Distribution and Source Analysis
3.3. Risk Assessment
4. Conclusions
- (1)
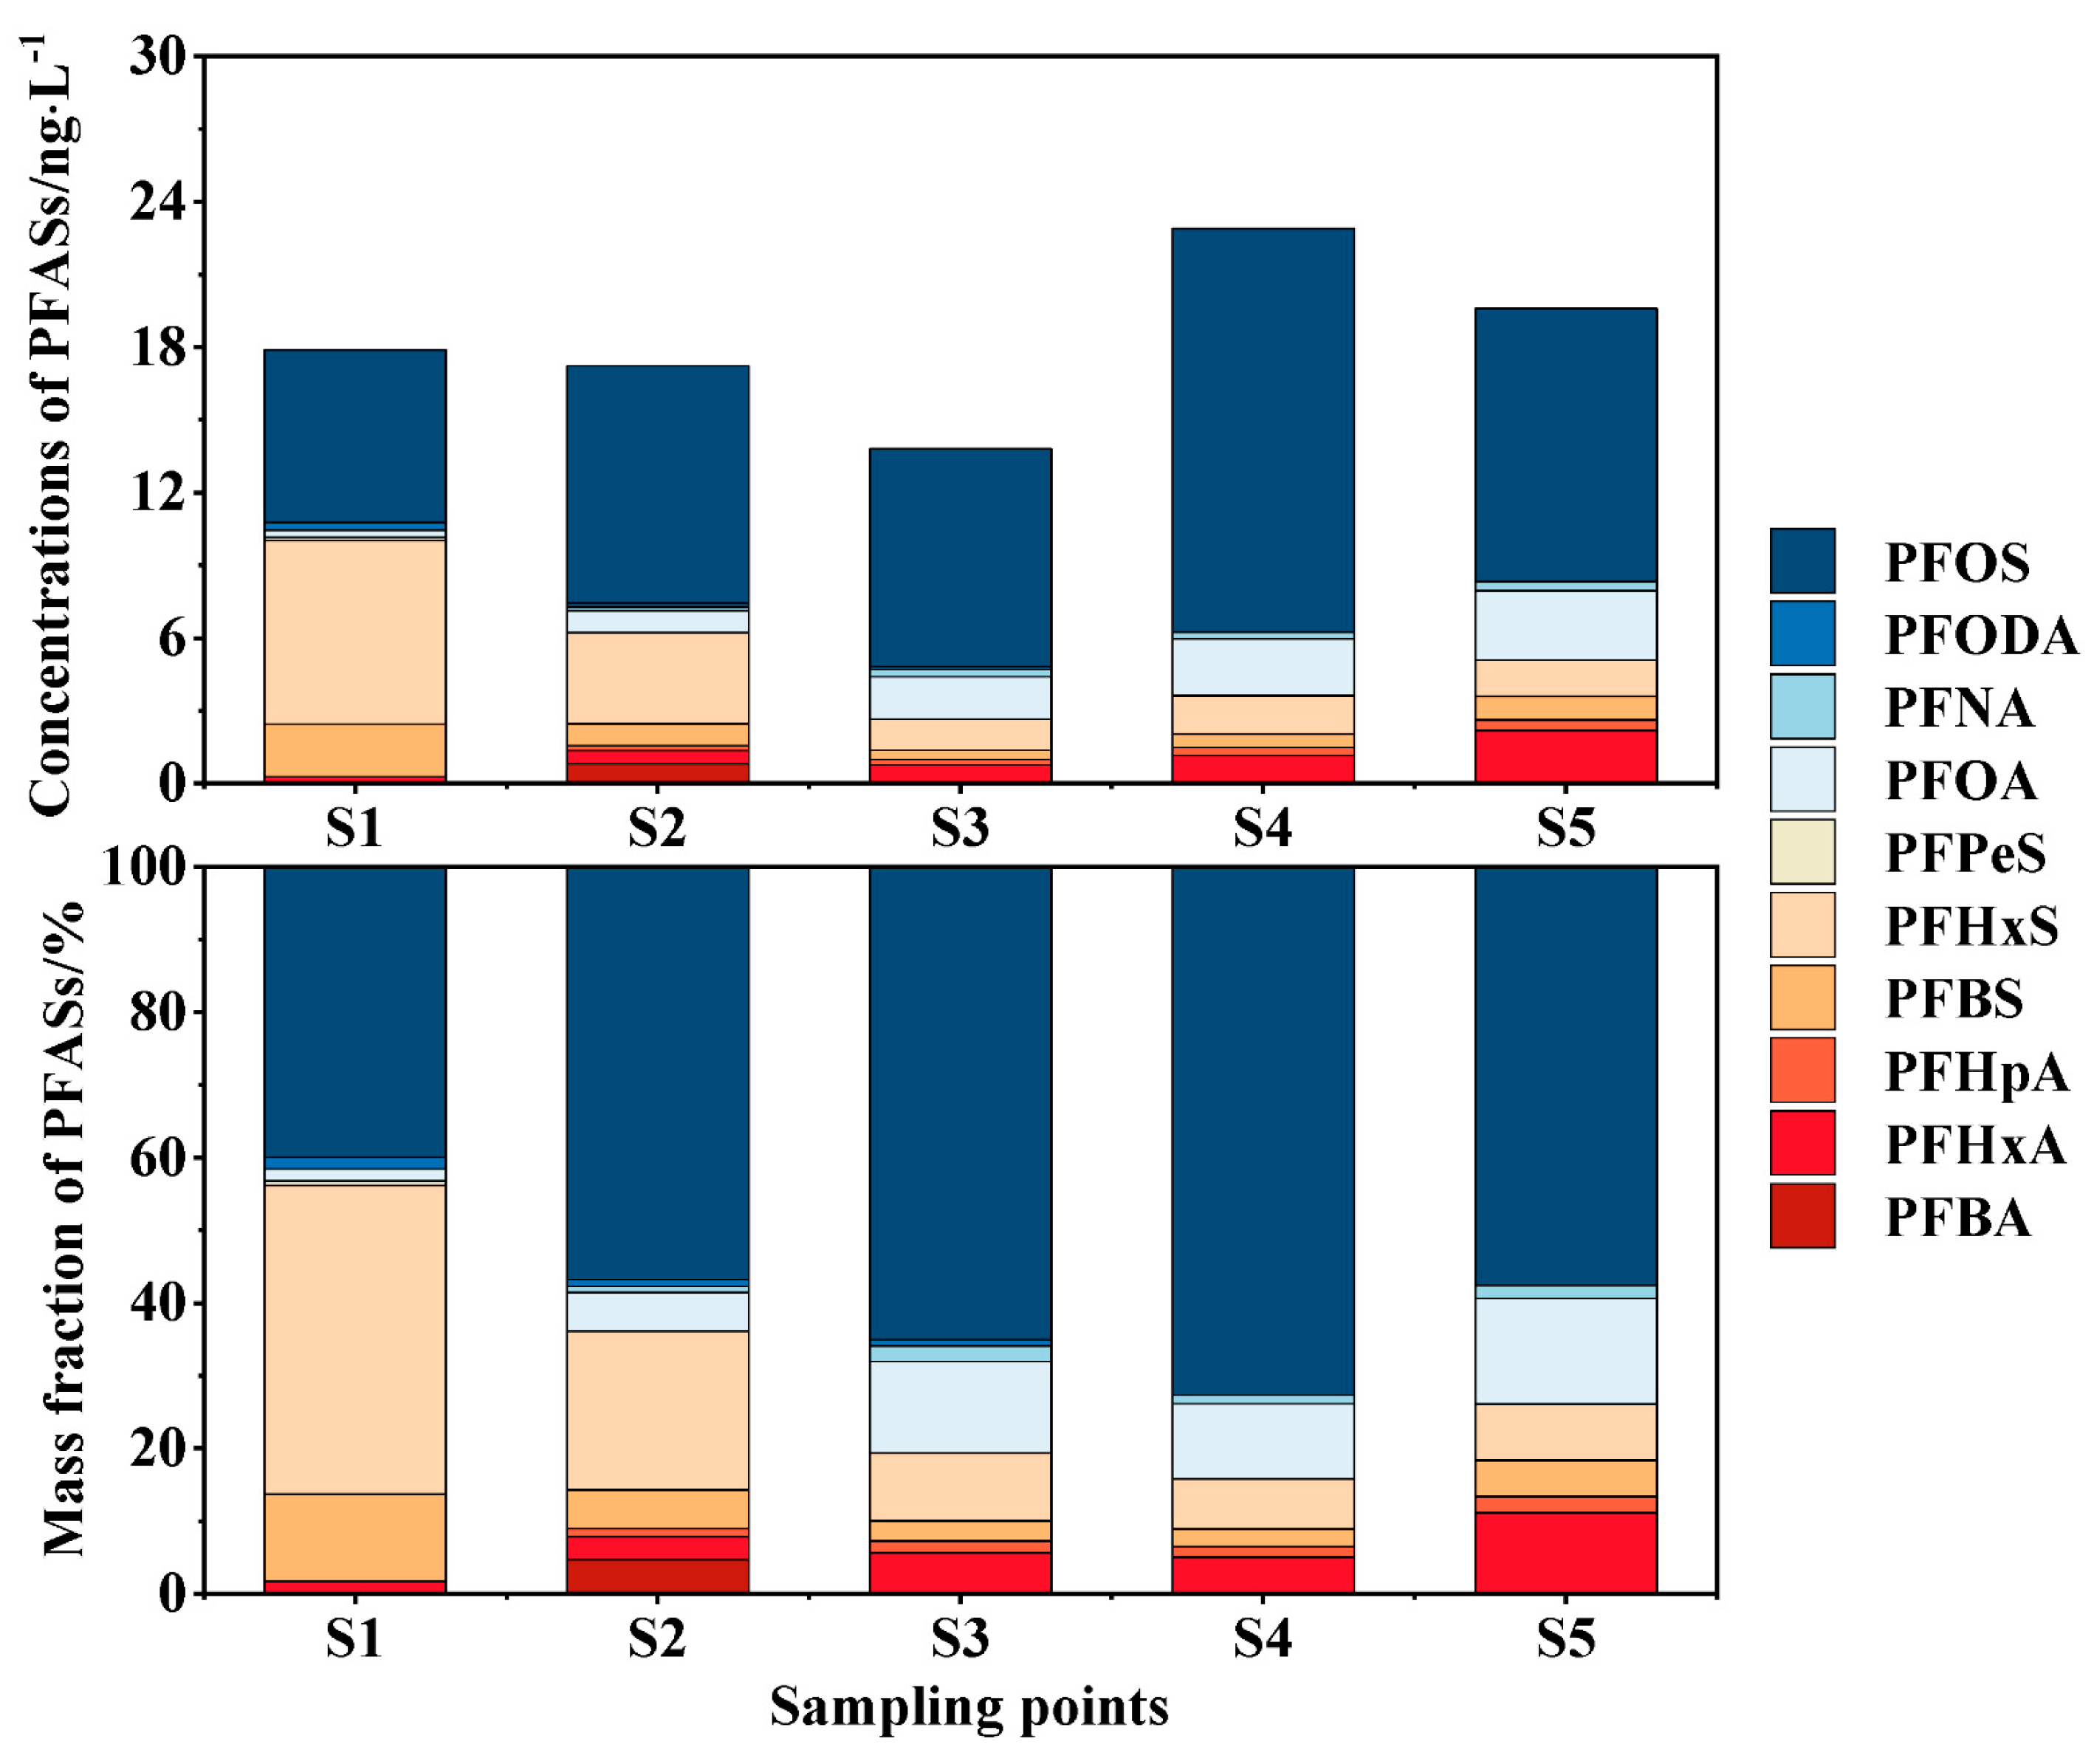
- There are 10 types of PFASs higher than the limit of quantitation in the surface water of the Fuyang River, with at least 7 types at each point. The surface water (∑PFASs) ranges from 13.797 to 22.880 . PFCAs are mainly composed of PFOA and PFHxA. PFSAs are mainly based on PFOS. The main component in the surface water is PFOS (mass fraction of 59.40%). The main pollutants in the surface water are long-chain PFASs. The short-chain substitution effect is not significant. The surface water PFASs of the Fuyang River are at a low-concentration pollution level.
- (2)
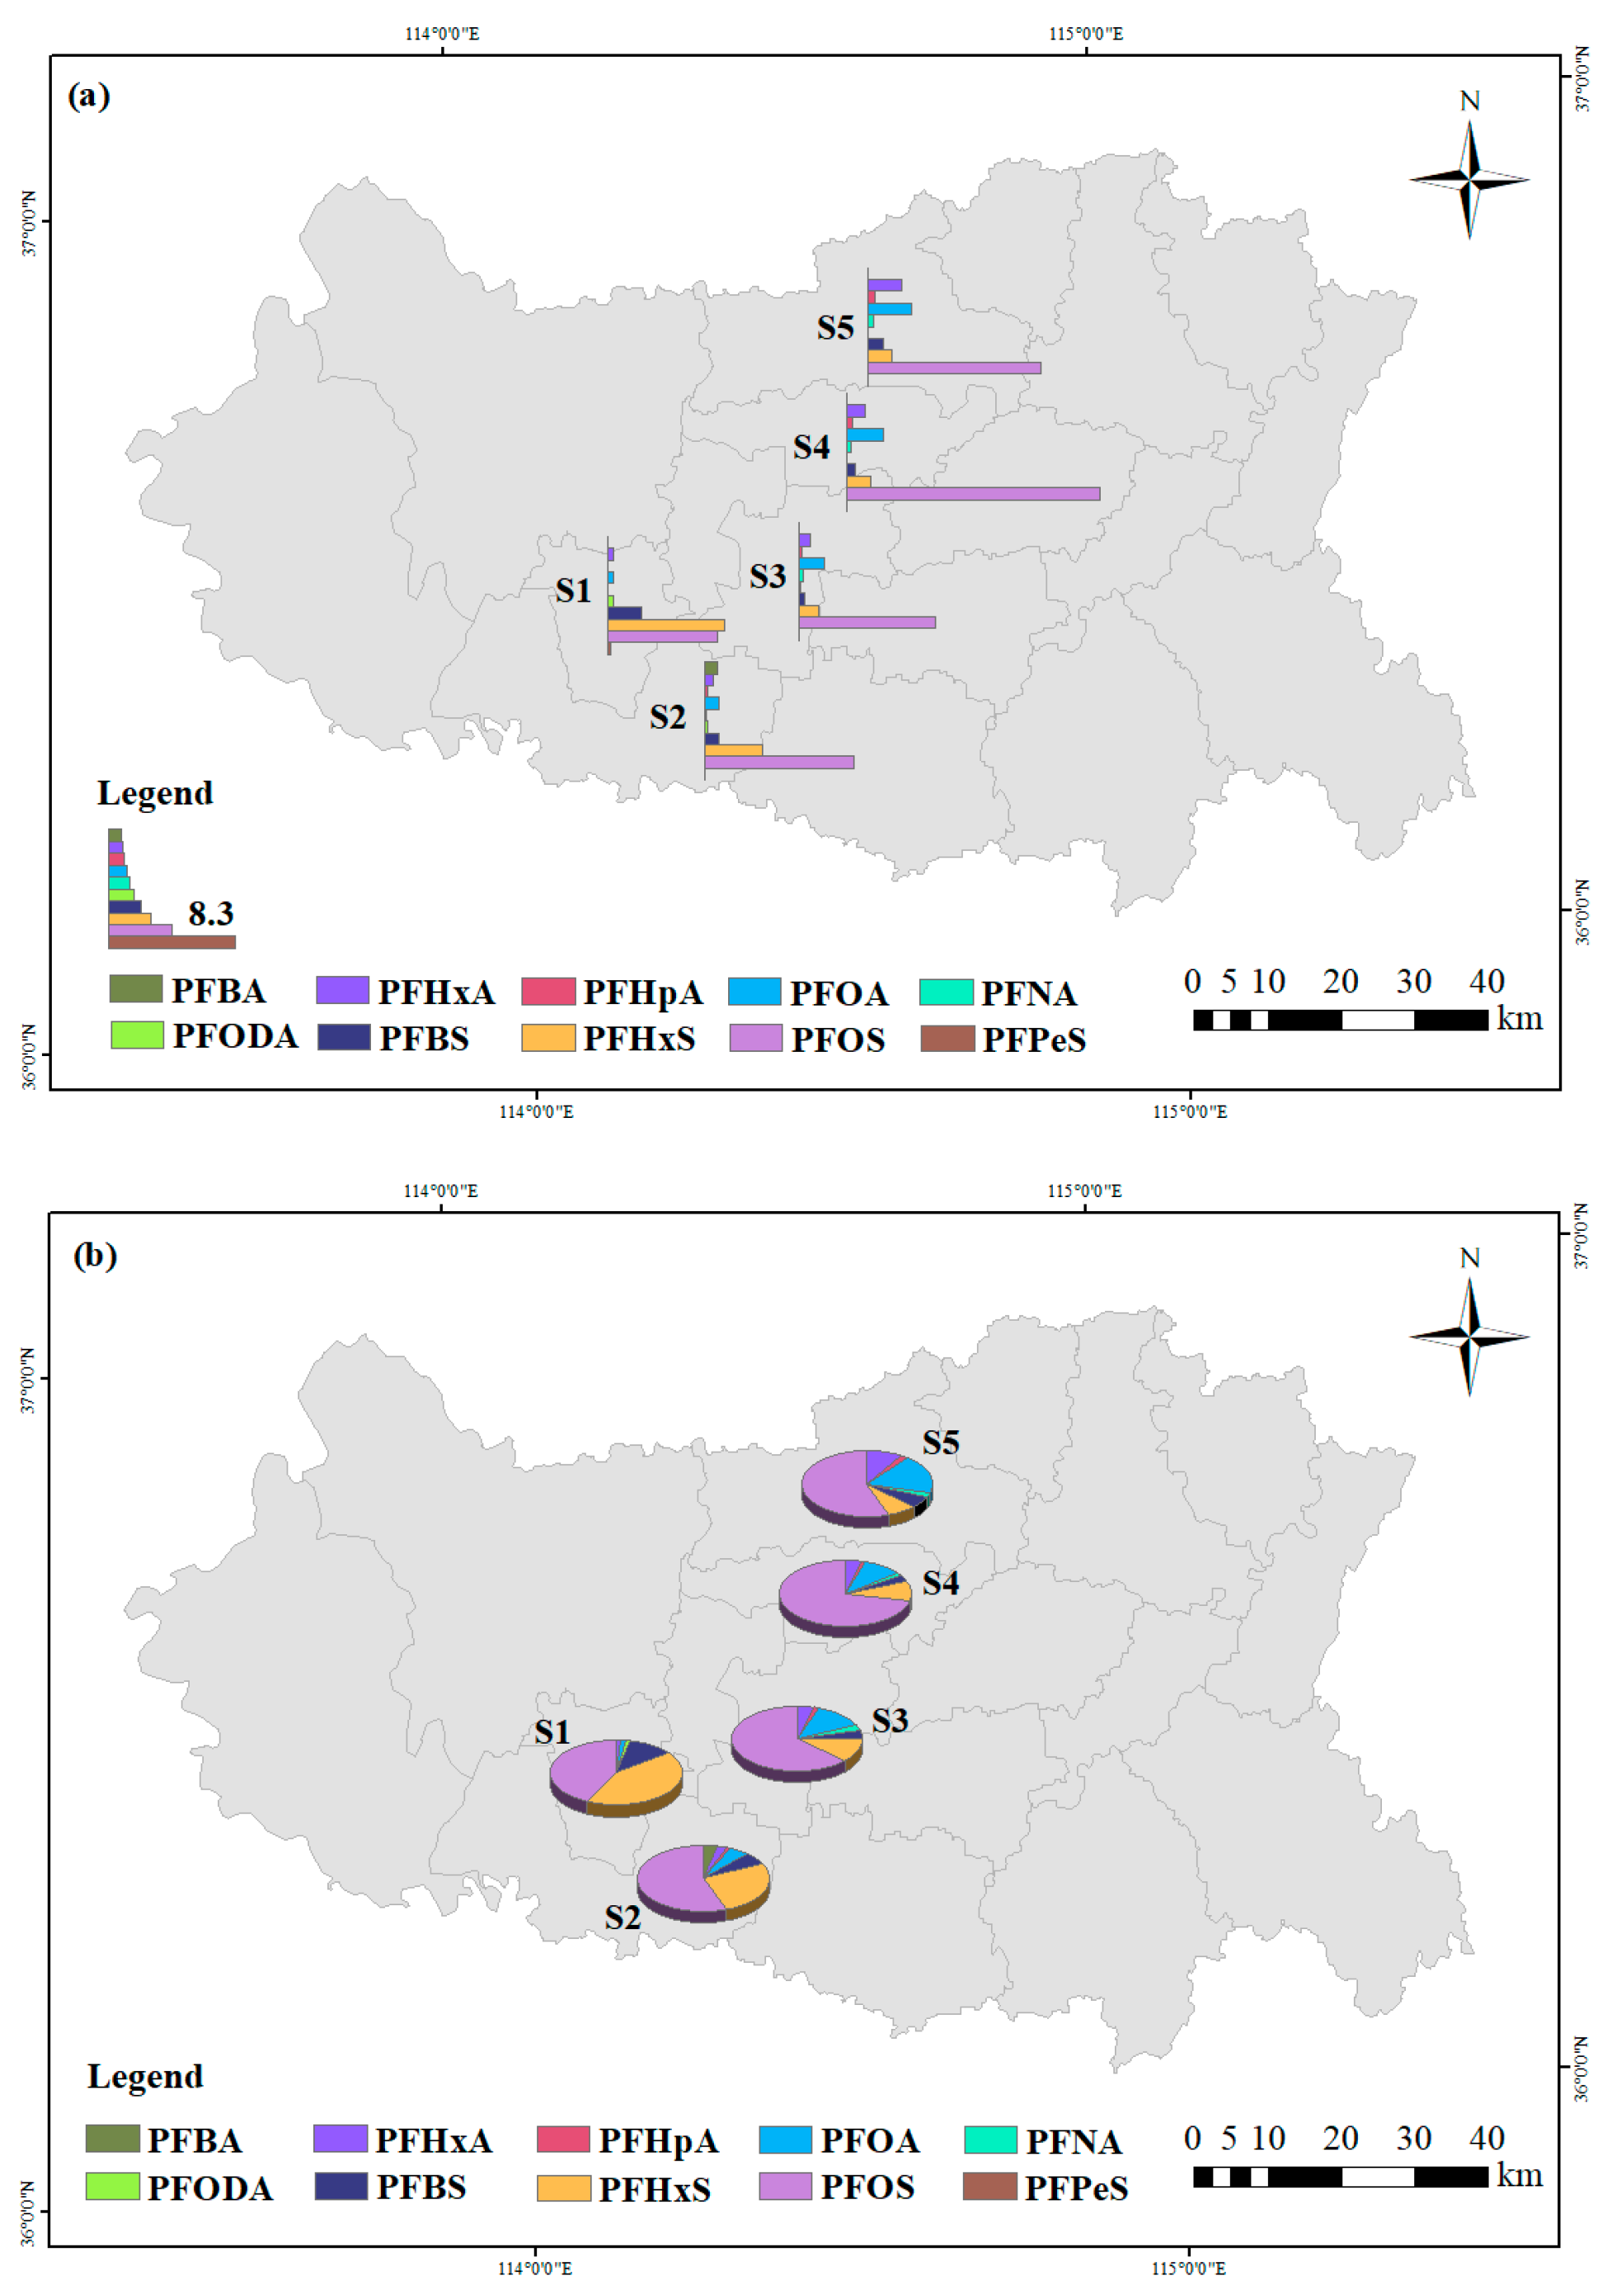
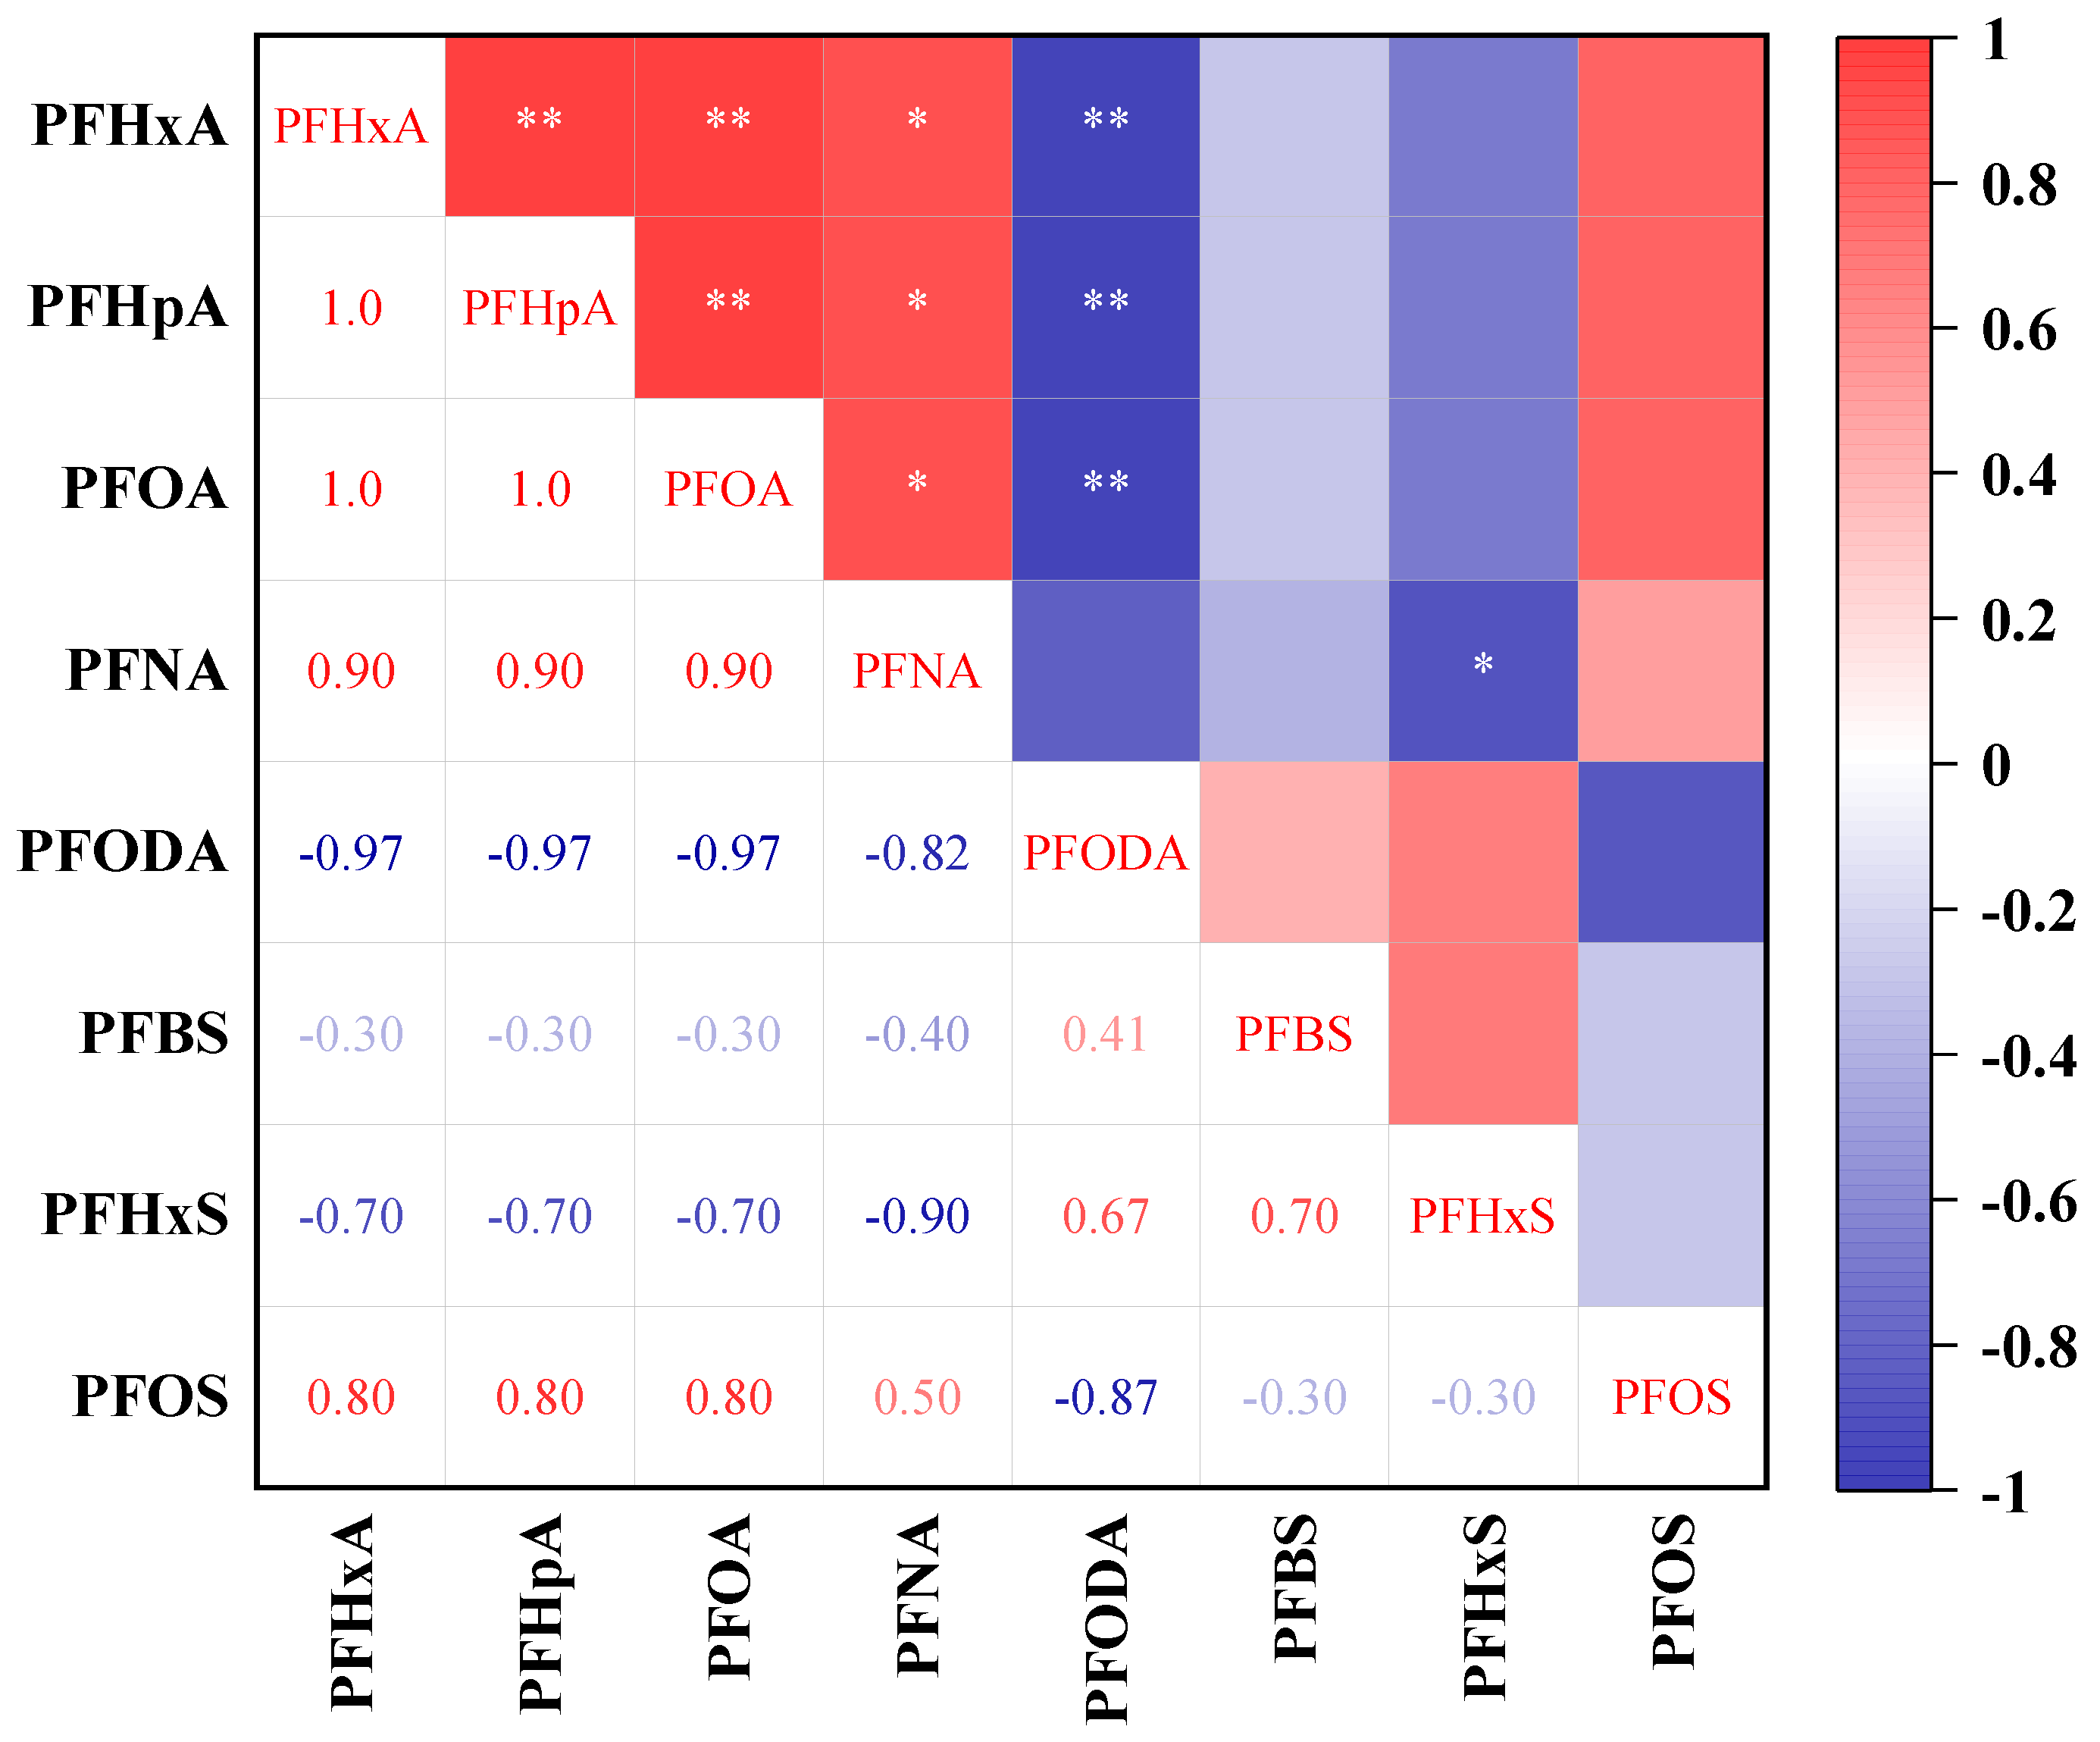
- The overall PFASs in the downstream of the Handan section of the Fuyang River are relatively high, and the PFASs show a gradually increasing trend in the downstream. Spearman correlation analysis suggests that the PFASs in the Fuyang River may have the same source. By combining the ratios of PFHxA/PFOA and PFOA/PFNA, it can be concluded that the main sources of PFASs in the Fuyang River are industrial activities and rainfall inputs around the river. Through principal component analysis, it was found that the main sources of PFASs in the Fuyang River are leather, textile manufacturing, fluorinated compound production, and electroplating metal industries.
- (3)
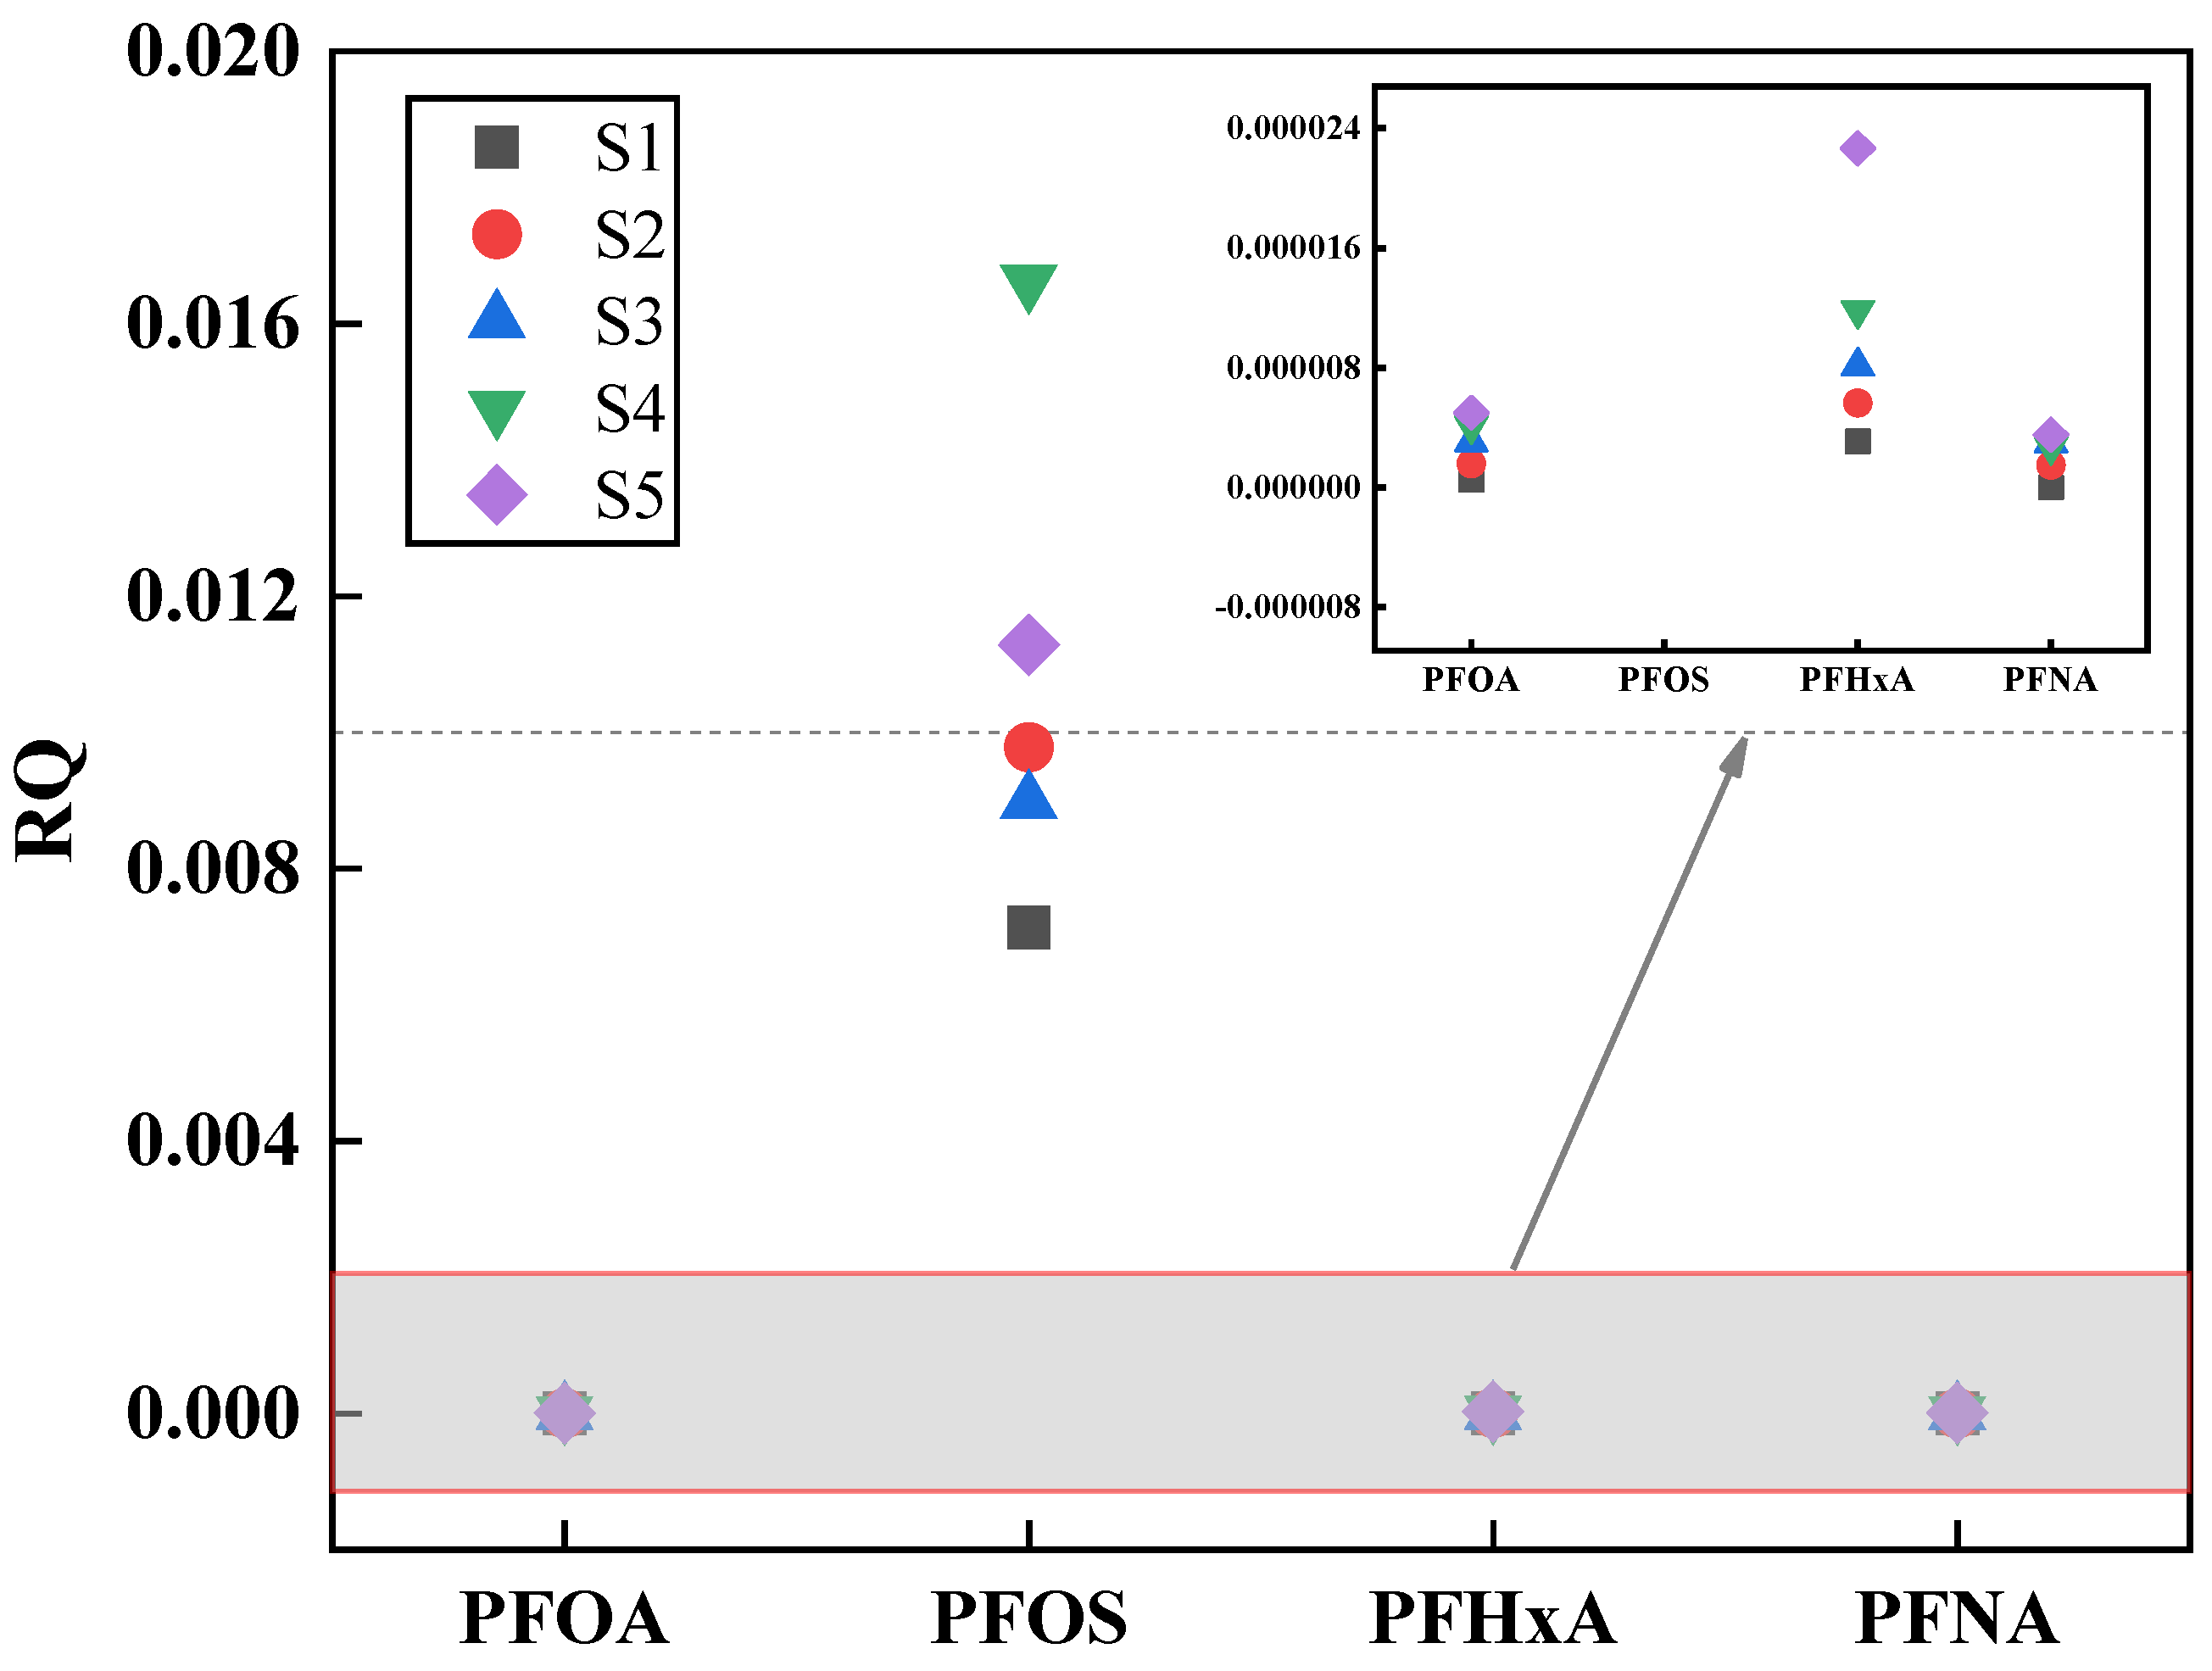
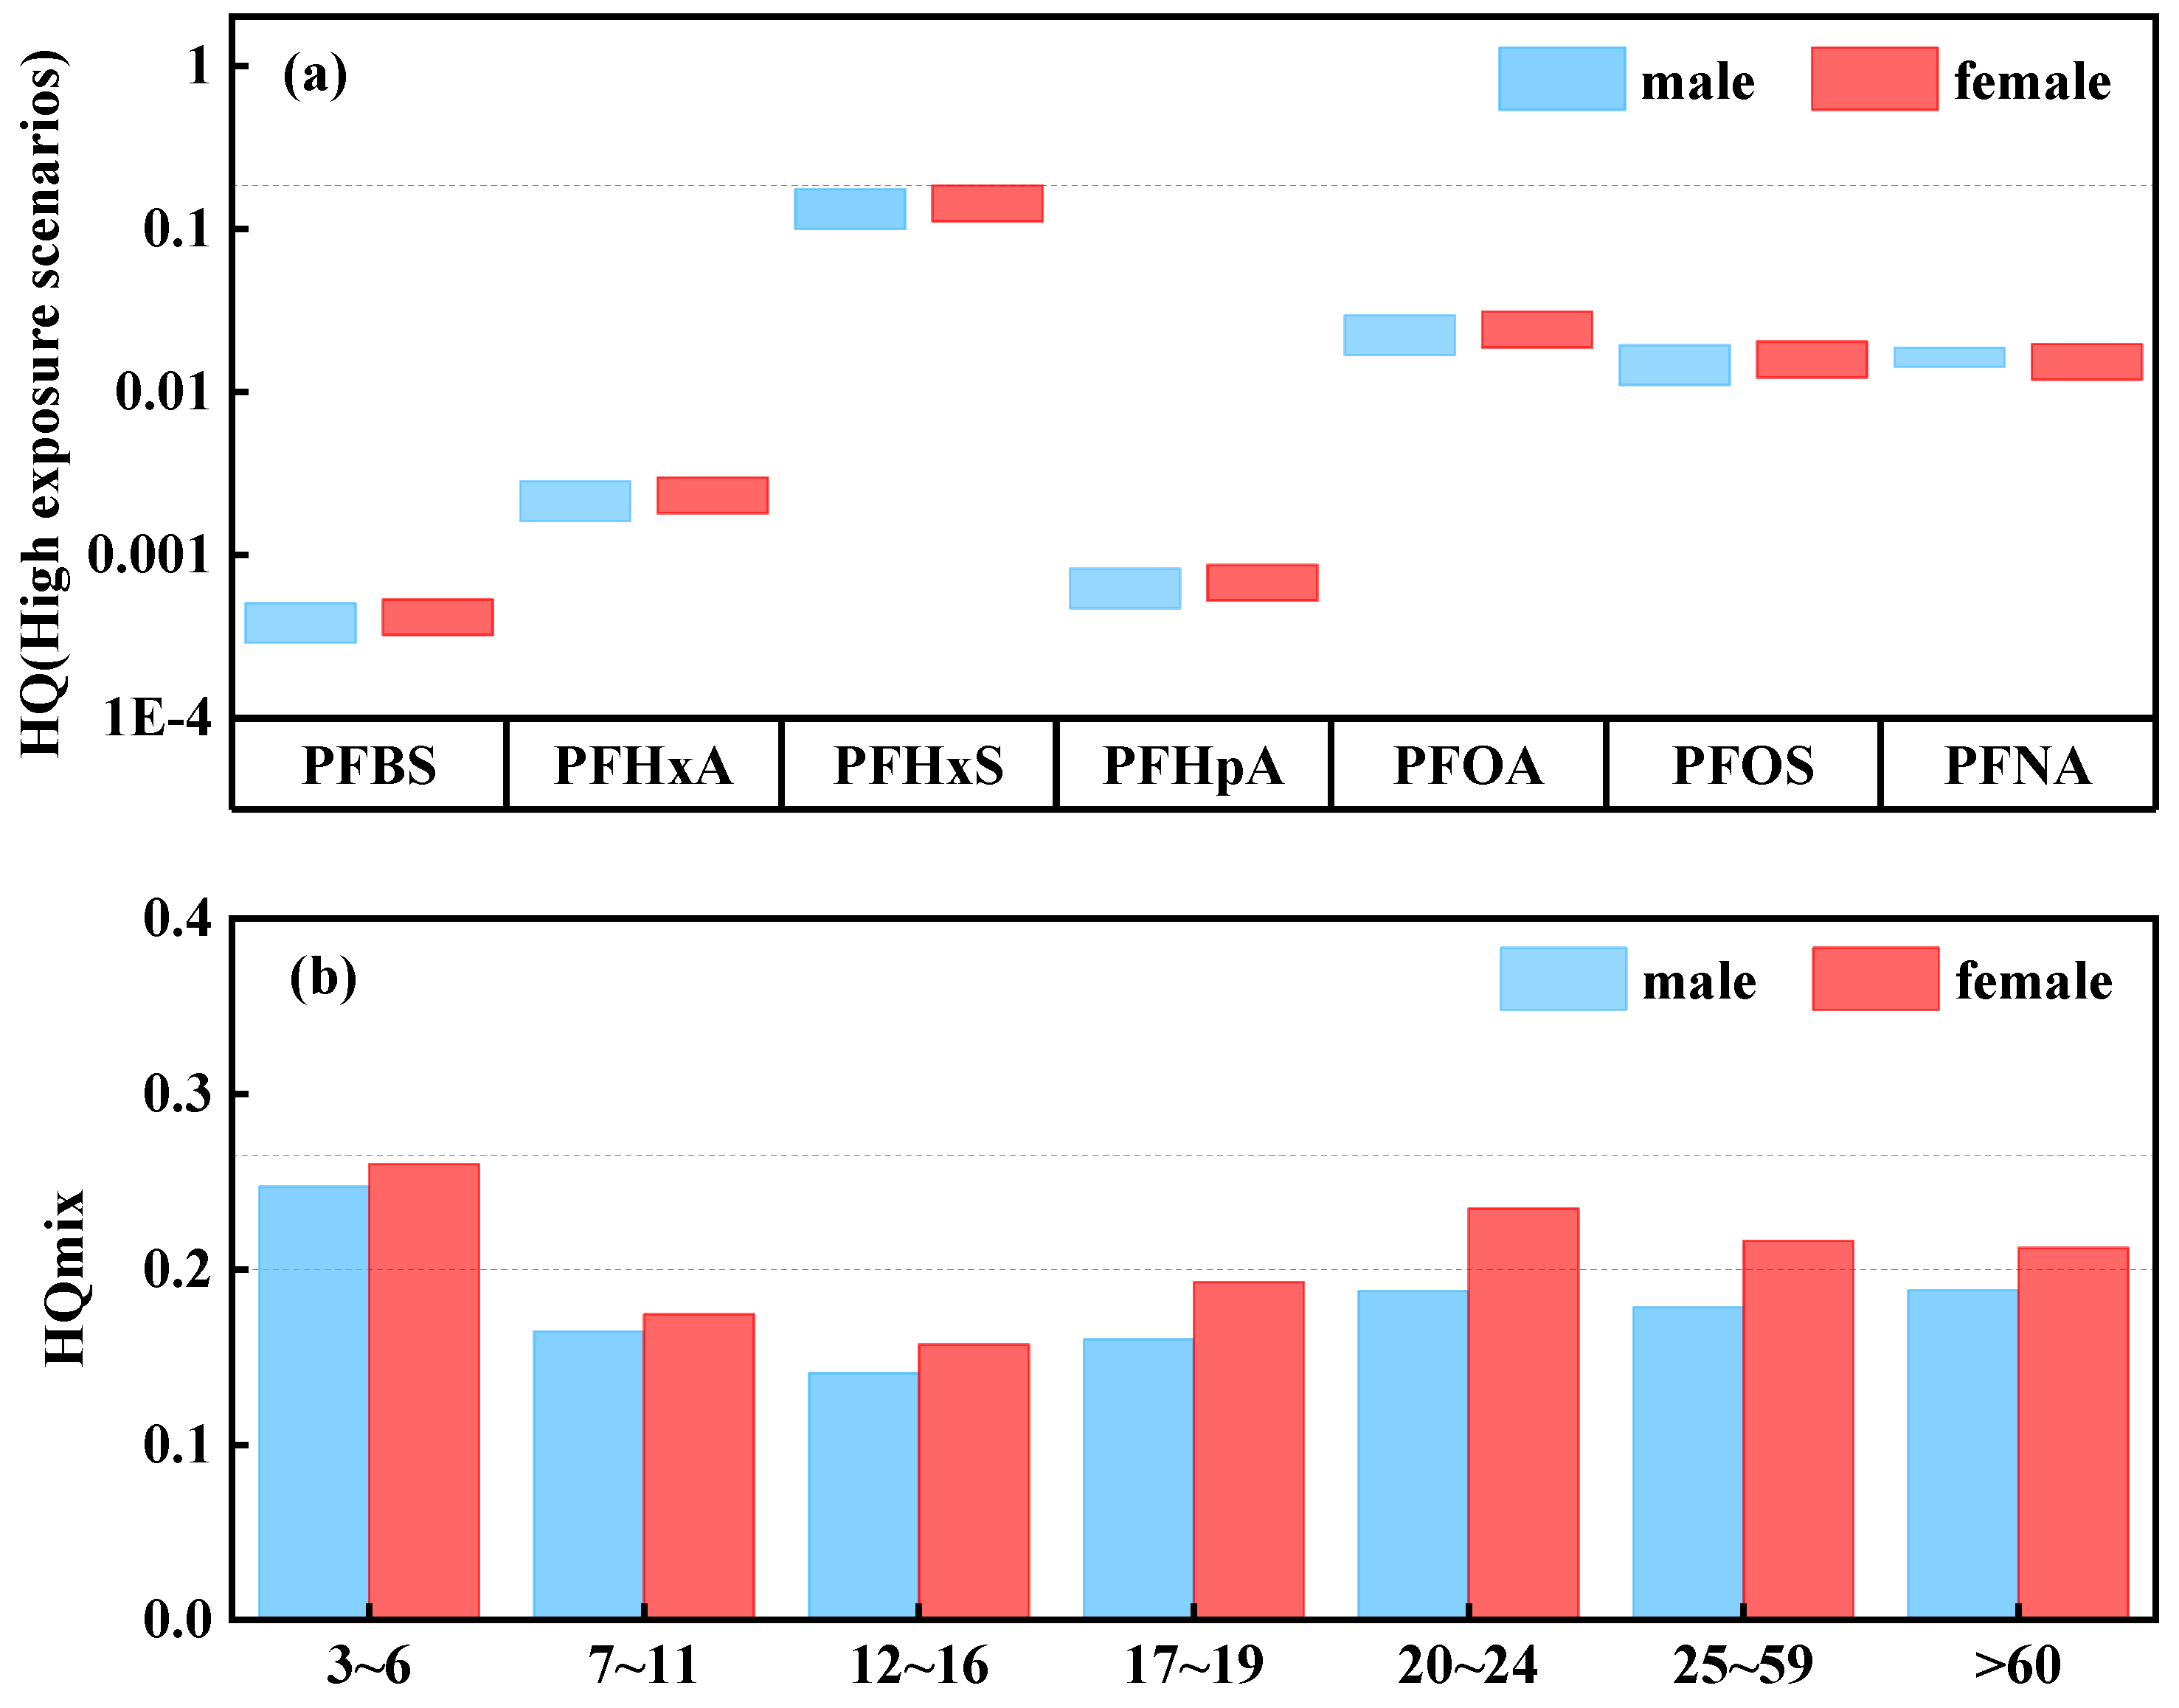
- The RQ values of four PFASs in the Fuyang River are all less than 0.1, indicating that the concentration of PFASs has not yet reached the level that may pose ecological risks. Similarly, under a high exposure background, the HQ values of seven PFASs in the Fuyang River did not reach the threshold for health risk assessment, indicating that the PFASs in the Fuyang River are at a low health risk level. However, the age groups of 3–6, 20–24, and over 60 years old are more susceptible to PFASs, and the cumulative toxicity of PFASs poses a greater risk to females.
Author Contributions
Funding
Data Availability Statement
Conflicts of Interest
References
- Zhang, H.X.; Zhang, H.C.; Hu, S.Q.; Shen, G.X.; Li, Z.J. Distribution characteristics of 24 perfluorocarbons in Taipu River and sediments. Environ. Chem. 2024, 43, 722–733. [Google Scholar]
- Li, T.; Chen, Y.; Wang, Y.; Tan, Y.; Jiang, C.; Yang, Y.; Zhang, Z. Occurrence, Source Apportionment and Risk Assessment of Perfluorinated Compounds in Sediments from the Longest River in Asia. J. Hazard. Mater. 2024, 467, 133608. [Google Scholar] [CrossRef] [PubMed]
- Zhou, J.; Li, Z.; Guo, X.; Li, Y.; Wu, Z.; Zhu, L. Evidences for Replacing Legacy Per- and Polyfluoroalkyl Substances with Emerging Ones in Fen and Wei River Basins in Central and Western China. J. Hazard. Mater. 2019, 377, 78–87. [Google Scholar] [CrossRef] [PubMed]
- Taniyasu, S.; Nobuyoshi, Y.; Eriko, Y.; Gert, P.; Kurunthachalam, K. The Environmental Photolysis of Perfluorooctanesulfonate, Perfluorooctanoate, and Related Fluorochemicals. Chemosphere 2013, 90, 1686–1692. [Google Scholar] [CrossRef]
- Kissa, E. Fluorinated Surfactants and Repellents, 2nd ed.; Taylor and Francis: Abingdon, UK; CRC Press: Boca Raton, FL, USA, 2001. [Google Scholar]
- Ding, G.; Xue, H.; Yao, Z.; Wang, Y.; Ge, L.; Zhang, J.; Cui, F. Occurrence and Distribution of Perfluoroalkyl Substances (PFASs) in the Water Dissolved Phase and Suspended Particulate Matter of the Dalian Bay, China. Chemosphere 2018, 200, 116–123. [Google Scholar] [CrossRef]
- Giesy, P.J.; Naile, J.E.; Khim, J.S.; Jones, P.D.; Newsted, J.L. Aquatic Toxicology of Perfluorinated Chemicals. Rev. Environ. Contam. Toxicol. 2010, 202, 1–52. [Google Scholar] [PubMed]
- He, P.F.; Zhang, H.; Li, J.; He, L.; Luo, J.; Liu, G.Q.; Shen, J.C.; Yang, B.; Cui, X.Y. Residue Characteristics of Perfluorinated Compounds in the Atmosphere of Shenzhen. Environ. Sci. 2016, 37, 1240–1247. [Google Scholar]
- Bossi, R.; Katrin, V.; Henrik, S. Concentrations of Organochlorine Pesticides, Polybrominated Diphenyl Ethers and Perfluorinated Compounds in the Atmosphere of North Greenland. Environ. Pollut. 2016, 217, 4–10. [Google Scholar] [CrossRef]
- Tang, J.X.; Zhu, Y.L.; Li, Y.; Xiang, B.; Tan, T. Pollution Status and Ecological Risk Assessment of Perfluorinated Compounds in the Liao River Basin and Surrounding. Ecol. Environ. Sci. 2021, 30, 1447–1454. [Google Scholar]
- Chen, R.; Li, G.; Yu, Y.; Ma, X.; Zhuang, Y.; Tao, H.; Shi, B. Occurrence and Transport Behaviors of Perfluoroalkyl Acids in Drinking Water Distribution Systems. Sci. Total Environ. 2019, 697, 134162. [Google Scholar] [CrossRef]
- Zhong, H.; Zheng, M.; Liang, Y.; Wang, Y.; Gao, W.; Wang, Y.; Jiang, G. Legacy and Emerging Per- and Polyfluoroalkyl Substances (PFAS) in Sediments from the East China Sea and the Yellow Sea: Occurrence, Source Apportionment and Environmental Risk Assessment. Chemosphere 2021, 282, 131042. [Google Scholar] [CrossRef] [PubMed]
- Abdallah, M.A.E.; Nina, W.; Daniel, S.D.; Christina, T.; Claire, C.; Kathy, C.; John, J.M.; Sean, D.; Marie, A.C.; Stuart, H. Concentrations of Perfluoroalkyl Substances in Human Milk from Ireland: Implications for Adult and Nursing Infant Exposure. Chemosphere 2020, 246, 125724. [Google Scholar] [CrossRef] [PubMed]
- Lin, N.X.; Wang, X.C.; Dong, X.J.; Su, L.Q.; Zhu, H.J.; Wang, C.; Zhang, D.P.; Liu, F.Y.; Hou, S.S.; Dong, B.; et al. Concentration, Spatial Distribution, and Health Risk Assessment of PFASs in Serum of Teenagers, Tap Water and Soil near a Chinese Fluorochemical Industrial Plant. Environ. Int. 2021, 146, 106166. [Google Scholar]
- Xu, B.; Qiu, W.; Du, J.; Wan, Z.; Zhou, J.L.; Chen, H.; Liu, R.; Magnuson, J.T.; Zheng, C. Translocation, Bioaccumulation, and Distribution of Perfluoroalkyl and Polyfluoroalkyl Substances (PFASs) in Plants. IScience 2022, 25, 104061. [Google Scholar] [CrossRef]
- Claire, P.; Coiffier, O.; LyonCaen, S.; Boudier, A.; Jovanovic, N.; Quentin, J.; Gioria, Y.; Haug, L.S.; Thomsen, C.; Bayat, S.; et al. In Utero Exposure to Poly- and Perfluoroalkyl Substances and Children Respiratory Health in the Three First Years of Life. Environ. Res. 2023, 234, 116544. [Google Scholar]
- Sachiko, I.; Yamazaki, K.; Suyama, S.; IkedaAraki, A.; Miyashita, C.; Ait, B.Y.; Kobayashi, S.; Masuda, H.; Yamaguchi, T.; Goudarzi, H.; et al. The Association between Prenatal Perfluoroalkyl Substance Exposure and Symptoms of Attention-Deficit/Hyperactivity Disorder in 8-Year-Old Children and the Mediating Role of Thyroid Hormones in the Hokkaido Study. Environ. Int. 2021, 159, 107026. [Google Scholar]
- Jochem, L.; Dellafiora, L.; van den Heuvel, J.J.M.W.; Rijkers, D.; Leenders, L.; Dorne, J.C.M.; Punt, A.; Russel, F.G.M.; Koenderink, J.B. Perfluoroalkyl Substances (PFASs) Are Substrates of the Renal Human Organic Anion Transporter 4 (OAT4). Arch. Toxicol. 2022, 97, 685–696. [Google Scholar]
- Yun, L.; Calafat, A.M.; Chen, A.; Lanphear, B.P.; Jones, N.Y.; Cecil, K.M.; Rose, S.R.; Yolton, K.; Buckley, J.P.; Braun, J.M. Associations of Prenatal and Postnatal Exposure to Perfluoroalkyl Substances with Pubertal Development and Reproductive Hormones in Females and Males: The Home Study. Sci. Total Environ. 2023, 890, 164353. [Google Scholar]
- Stockholm Convention. The New POPs Under the Stockholm Convention. 2009. Available online: http://chm.pops.int/Programmes/NewPOPs/The9newPOPs/tabid/672/language/enUS/Default.aspx (accessed on 2 February 2025).
- Stockholm Convention. POPRC Recommendations for Listing Chemicals. 2019. Available online: http://www.pops.int/TheConvention/ThePOPs/ChemicalsProposedforListing/tabid/2510/Default.aspx (accessed on 2 February 2025).
- Gallen, C.; Christine, B.; Foon, Y.L.; Kristie, T.; Jack, T.; Michael, W.; Jochen, F.M. Spatio-Temporal Assessment of Perfluorinated Compounds in the Brisbane River System, Australia: Impact of a Major Flood Event. Mar. Pollut. Bull. 2014, 85, 597–605. [Google Scholar] [CrossRef]
- Charles, E.S.; Hooper, J.L.; Strom, L.E.; Abusallout, I.; Dickenson, E.R.V.; Thompson, K.A.; Mohan, G.R.; Drennan, D.; Wu, K.; Guelfo, J.L. Occurrence of Quantifiable and Semi-Quantifiable Poly- and Perfluoroalkyl Substances in United States Wastewater Treatment Plants. Water Res. 2023, 233, 119724. [Google Scholar]
- Beškoski, V.P.; Katsuya, Y.; Atsushi, Y.; Hideo, O.; Mitsuru, H.; Takeshi, N.; Chisato, M.; Keiichi, F.; Shinpei, W.; Hideyuki, I. Distribution of Perfluoroalkyl Compounds in Osaka Bay and Coastal Waters of Western Japan. Chemosphere 2017, 170, 260–265. [Google Scholar] [CrossRef] [PubMed]
- Wang, P.; Lu, Y.; Wang, T.; Fu, Y.; Zhu, Z.; Liu, S.; Xie, S.; Xiao, Y.; Giesy, J.P. Occurrence and Transport of 17 Perfluoroalkyl Acids in 12 Coastal Rivers in South Bohai Coastal Region of China with Concentrated Fluoropolymer Facilities. Environ. Pollut. 2014, 190, 115–122. [Google Scholar] [CrossRef]
- Fang, S.; Sha, B.; Yin, H.; Bian, Y.; Yuan, B.; Cousins, I.T. Environment Occurrence of Perfluoroalkyl Acids and Associated Human Health Risks near a Major Fluorochemical Manufacturing Park in Southwest of China. J. Hazard. Mater. 2020, 396, 122617. [Google Scholar] [CrossRef] [PubMed]
- Ye, T.; Zhang, L.L.; Yuan, M. Succession of Perfluoroalkyl and Poly-fluoroalkylated Substances Pollution Characteristics in Global Surface Water. Environ. Monit. Forewarning 2022, 14, 1–9. [Google Scholar]
- Li, P.; Zhi, D.; Zhang, X.; Zhu, H.; Li, Z.; Peng, Y.; He, Y.; Luo, L.; Rong, X.; Zhou, Y. Research Progress on the Removal of Hazardous Perfluorochemicals: A Review. J. Environ. Manag. 2019, 250, 109488. [Google Scholar] [CrossRef] [PubMed]
- Konstantinos, P.; Cousins, I.T.; Buck, R.C.; Korzeniowski, S.H. Sources, Fate and Transport of Perfluorocarboxylates. Environ. Sci. Technol. 2006, 40, 32–44. [Google Scholar]
- Chen, H.; Sun, R.; Zhang, C.; Han, J.; Wang, X.; Han, G.; He, X. Occurrence, Spatial and Temporal Distributions of Perfluoroalkyl Substances in Wastewater, Seawater and Sediment from Bohai Sea, China. Environ. Pollut. 2016, 219, 389–398. [Google Scholar] [CrossRef]
- Hongmei, H.; Zhang, Y.; Zhao, N.; Xie, J.; Zhou, Y.; Zhao, M.; Jin, H. Legacy and Emerging Poly- and Perfluorochemicals in Seawater and Sediment from East China Sea. Sci. Total Environ. 2021, 797, 122617. [Google Scholar]
- Esther, S.C.; Detwiler, R.L. Global Patterns and Temporal Trends of Perfluoroalkyl Substances in Municipal Wastewater: A Meta-Analysis. Water Res. 2022, 221, 118784. [Google Scholar]
- Gu, C.; Xu, C.; Zhou, Q.; Shen, C.; Ma, C.; Liu, S.; Yin, S.; Li, F. Congener- and Isomer-Specific Perfluorinated Compounds in Textile Wastewater from Southeast China. J. Clean. Prod. 2021, 320, 128897. [Google Scholar] [CrossRef]
- Zhang, W.; Jin, X.; Liu, D.; Lang, C.; Shan, B. Temporal and Spatial Variation of Nitrogen and Phosphorus and Eutrophication Assessment for a Typical Arid River—Fuyang River in Northern China. J. Environ. Sci. 2016, 55, 41–48. [Google Scholar] [CrossRef] [PubMed]
- Tang, W.; Duan, S.; Shan, B.; Zhang, H.; Zhang, W.; Zhao, Y.; Zhang, C. Concentrations, Diffusive Fluxes and Toxicity of Heavy Metals in Pore Water of the Fuyang River, Haihe Basin. Ecotoxicol. Environ. Saf. 2016, 127, 80–86. [Google Scholar] [CrossRef] [PubMed]
- Li, J.; Gao, Y.; Wang, Z.F.; Wang, B.W.; Hao, H.S. Risk Assessment of Perfluoroalkyl Compounds (PFCs) in Water and Sediment Samples of Hanjiang River. Acta Sci. Nat. Univ. Pekin. 2017, 53, 913–920. [Google Scholar]
- Zeng, S.Y.; Yang, H.B.; Peng, J.; Tu, X.T.; Li, L. Pollution characteristics and risk assessment of perfluorinated compounds in surface water and sediments of Caohai Lake of Guizhou Province. Environ. Chem. 2021, 40, 1193–1205. [Google Scholar]
- Brooke, D.; Footitt, A.; Nwaogu, T.A. Environmental risk evaluation report: Perflurooctanesulphonate (PFOS). Bioinformatics 2004, 17, 646–653. [Google Scholar]
- Cao, Y.; Zhou, T.Y.; Liu, X.H.; Zhang, Y.H.; Liu, Z.T. Deduction of ineffective concentration prediction of perfluorooctanoic acid (PFOA) in the environment of our country. Environ. Chem. 2013, 9, 3101–3109. [Google Scholar]
- Sun, R.; Wu, M.; Tang, L.; Li, J.; Qian, Z.; Han, T.; Xu, G. Perfluorinated Compounds in Surface Waters of Shanghai, China: Source Analysis and Risk Assessment. Ecotoxicol. Environ. Saf. 2018, 149, 88–95. [Google Scholar] [CrossRef]
- Lei, M.Z.; He, J.Q.; Zhang, H.L.; Liu, W.; Fang, S.H. Pollution characteristics and risk assessment of perfluoroalkyl substances in the typical wetland of Chengdu City. Environ. Chem. 2024, 43, 1–11. [Google Scholar]
- Thomaidi, V.S.; Tsahouridou, A.; Matsoukas, C.; Stasinakis, A.S.; Petreas, M.; Kalantzi, O.I. Risk assessment of PFASs in drinking water using a probabilistic risk quotient methodology. Sci. Total Environ. 2020, 712, 136485. [Google Scholar] [CrossRef]
- Ying, L.; Hua, Z.; Chu, K.; Gu, L.; Liu, Y.; Liu, X. Distribution Behavior and Risk Assessment of Emerging Perfluoroalkyl Acids in Multiple Environmental Media at Luoma Lake, East China. Environ. Res. 2021, 194, 110733. [Google Scholar]
- Gloria, B.P.; Gleason, J.A.; Cooper, K.R. Key Scientific Issues in Developing Drinking Water Guidelines for Perfluoroalkyl Acids: Contaminants of Emerging Concern. PLoS Biol. 2017, 15, e2002855. [Google Scholar]
- Schwanz, T.G.; Marta, L.; Marinella, F.; Damià, B. Perfluoroalkyl Substances Assessment in Drinking Waters from Brazil, France and Spain. Sci. Total Environ. 2016, 539, 143–152. [Google Scholar] [CrossRef] [PubMed]
- Riva, F.; Sara, C.; Elena, F.; Angela, M.; Enrico, D.; Ettore, Z. Monitoring Emerging Contaminants in the Drinking Water of Milan and Assessment of the Human Risk. Int. J. Hyg. Environ. Health 2018, 221, 451–457. [Google Scholar] [CrossRef] [PubMed]
- Yang, Y.Y.; Gurpal, S.T.; Wilson, P.C.; Clinton, F.W. Micropollutants in Groundwater from Septic Systems: Transformations, Transport Mechanisms, and Human Health Risk Assessment. Water Res. 2017, 123, 258–267. [Google Scholar] [CrossRef]
- State Sport General Administration. 2014 National Physical Fitness Monitoring Bulletin; State Sport General Administration: Beijing, China, 2015.
- U.S. EPA. Exposure Factors Handbook, 2011 ed.; Release of Final Report; U.S. Environmental Protection Agency: Washington, DC, USA, 2011.
- Eichhorn, P.; Silvana, V.R.; Wolfram, B.; Thomas, P.K. Incomplete Degradation of Linear Alkylbenzene Sulfonate Surfactants in Brazilian Surface Waters and Pursuit of Their Polar Metabolites in Drinking Waters. Sci. Total Environ. 2002, 284, 123–134. [Google Scholar] [CrossRef]
- UNEP. Global PFC Group Synthesis Paper on per and Polyfluorinated Chemicals (PFCs) [M/OL]. Available online: https://www.oecd.org/chemicalsafety/risk-management/synthesis-paper-onper-andpolyfluorinated-chemicals.htm (accessed on 17 April 2025).
- Pico, Y.; Cristina, B.; Marinella, F. Occurrence of Perfluorinated Compounds in Water and Sediment of L’albufera Natural Park (Valencia, Spain). Environ. Sci. Pollut. Res. 2012, 19, 946–957. [Google Scholar] [CrossRef]
- Pan, C.G.; Ying, G.G.; Zhao, J.L.; Liu, Y.S.; Jiang, Y.X.; Zhang, Q.Q. Spatiotemporal Distribution and Mass Loadings of Perfluoroalkyl Substances in the Yangtze River of China. Sci. Total Environ. 2014, 493, 580–587. [Google Scholar] [CrossRef]
- Zhang, Y.; Lai, S.; Zhao, Z.; Liu, F.; Chen, H.; Zou, S.; Xie, Z.; Ebinghaus, R. Spatial Distribution of Perfluoroalkyl Acids in the Pearl River of Southern China. Chemosphere 2013, 93, 1519–1525. [Google Scholar] [CrossRef]
- Xun, Z.; Hu, T.; Yang, L.; Guo, Z. The Investigation of Perfluoroalkyl Substances in Seasonal Freeze-Thaw Rivers During Spring Flood Period: A Case Study in Songhua River and Yalu River, China. Bull. Environ. Contam. Toxicol. 2018, 101, 166–172. [Google Scholar]
- Li, F.; Sun, H.; Hao, Z.; He, N.; Zhao, L.; Zhang, T.; Sun, T. Perfluorinated Compounds in Haihe River and Dagu Drainage Canal in Tianjin, China. Chemosphere 2011, 84, 265–271. [Google Scholar] [CrossRef]
- Chen, X.; Zhu, L.; Pan, X.; Fang, S.; Zhang, Y.; Yang, L. Isomeric Specific Partitioning Behaviors of Perfluoroalkyl Substances in Water Dissolved Phase, Suspended Particulate Matters and Sediments in Liao River Basin and Taihu Lake, China. Water Res. 2015, 80, 235–244. [Google Scholar] [CrossRef] [PubMed]
- Yang, L.; Zhu, L.; Liu, Z. Occurrence and Partition of Perfluorinated Compounds in Water and Sediment from Liao River and Taihu Lake, China. Chemosphere 2011, 83, 806–814. [Google Scholar] [CrossRef] [PubMed]
- Rui, G.; Liu, X.; Liu, J.; Liu, Y.; Qiao, X.; Ma, M.; Zheng, B.; Zhao, X. Occurrence, Partition and Environmental Risk Assessment of Per- and Polyfluoroalkyl Substances in Water and Sediment from the Baiyangdian Lake, China. Sci. Rep. 2020, 10, 4691. [Google Scholar]
- Zhang, M.; Tang, F.L.; Cheng, X.L.; Xu, J.F.; Zhang, W. Occurrence and distribution of perfluorinated compounds in surface water of Lake Qiandao (Xin’anjiang Reservoir). J. Lake Sci. 2020, 32, 337–345. [Google Scholar]
- Dong, H.; Lu, G.; Yan, Z.; Liu, J.; Yang, H.; Zhang, P.; Jiang, R.; Bao, X.; Nkoom, M. Distribution, Sources and Human Risk of Perfluoroalkyl Acids (PFAAs) in a Receiving Riverine Environment of the Nanjing Urban Area, East China. J. Hazard. Mater. 2020, 381, 120911. [Google Scholar] [CrossRef]
- Gao, Y.; Fu, J.; Zeng, L.; Li, A.; Li, H.; Zhu, N.; Liu, R.; Liu, A.; Wang, Y.; Jiang, G. Occurrence and Fate of Perfluoroalkyl Substances in Marine Sediments from the Chinese Bohai Sea, Yellow Sea, and East China Sea. Environ. Pollut. 2014, 194, 60–68. [Google Scholar] [CrossRef]
- Simcik, M.F.; Kelly, J.D. Ratio of Perfluorochemical Concentrations as a Tracer of Atmospheric Deposition to Surface Waters. Environ. Sci. Technol. 2005, 39, 8678–8683, Erratum in Environ. Sci. Technol. 2006, 40, 410. [Google Scholar] [CrossRef]
- Wang, T.; Khim, J.S.; Chen, C.; Naile, J.E.; Lu, Y.; Kannan, K.; Park, J.; Luo, W.; Jiao, W.; Hu, W.; et al. Perfluorinated Compounds in Surface Waters from Northern China: Comparison to Level of Industrialization. Environ. Int. 2012, 42, 37–46. [Google Scholar] [CrossRef]
- Joyce, A.D.M.; Ye, Y.; Edwards, E.A.; Mabury, S.A. Fluorotelomer Alcohol Biodegradation Yields Poly- and Perfluorinated Acids. Environ. Sci. Technol. 2004, 38, 2857–2864. [Google Scholar]
- Zhang, H.X. Study on the occurrence characteristics and biological exposure risks of perfluorinated compounds in important cross-sections of the Taipu River. Ph.D. Thesis, East China University of Science and Technology, Shanghai, China, 2023. [Google Scholar]
- Liu, B.; Zhang, H.; Xie, L.; Li, J.; Wang, X.; Zhao, L.; Wang, Y.; Yang, B. Spatial Distribution and Partition of Perfluoroalkyl Acids (PFAAs) in Rivers of the Pearl River Delta, Southern China. Sci. Total Environ. 2015, 524–525, 1–7. [Google Scholar] [CrossRef]
- Wang, X.; Chen, M.; Gong, P.; Wang, C. Perfluorinated Alkyl Substances in Snow as an Atmospheric Tracer for Tracking the Interactions between Westerly Winds and the Indian Monsoon over Western China. Environ. Int. 2019, 124, 294–301. [Google Scholar] [CrossRef] [PubMed]
- Wang, F.; Shih, K.; Ma, R.; Li, X.-Y. Influence of Cations on the Partition Behavior of Perfluoroheptanoate (PFHpA) and Perfluorohexanesulfonate (PFHxS) on Wastewater Sludge. Chemosphere 2015, 131, 178–183. [Google Scholar] [CrossRef]
- Klaunig, J.E.; Motoki, S.; Hiroyuki, I.; Christopher, P.C.; Jeannie, B.K.; Zemin, W.; Richard, H.B. Evaluation of the Chronic Toxicity and Carcinogenicity of Perfluorohexanoic Acid (PFHxA) in Sprague-Dawley Rats. Toxicol. Pathol. 2015, 43, 209–220. [Google Scholar] [CrossRef] [PubMed]
- Qi, Y.; He, Z.; Huo, S.; Zhang, J.; Xi, B.; Hu, S. Source Apportionment of Perfluoroalkyl Substances in Surface Sediments from Lakes in Jiangsu Province, China: Comparison of Three Receptor Models. J. Environ. Sci. 2016, 57, 321–328. [Google Scholar] [CrossRef] [PubMed]
- Zhang, H.; Zhao, L.; He, L.; Chai, Z.F.; Shen, J.C. Pollution Fingerprints and Sources of Perfluorinated Compounds in Surface Soil of Different Functional Areas. Environ. Sci. 2014, 35, 2698–2704. [Google Scholar]
- Jessica, C.D.; Hurley, M.D.; Wallington, T.J.; Mabury, S.A. Atmospheric Chemistry of N-Methyl Perfluorobutane Sulfonamidoethanol, C4f9so2n(Ch3)Ch2ch2oh: Kinetics and Mechanism of Reaction with Oh. Environ. Sci. Technol. 2006, 40, 1862–1868. [Google Scholar]
- Kavitha, D.; Xia, X.; Siriwardena, D.; Klupinski, T.P.; Seay, B. Concentration Profiles of Per- and Polyfluoroalkyl Substances in Major Sources to the Environment. J. Environ. Manag. 2022, 301, 113879. [Google Scholar]
- Li, W.; Li, X.; Wang, H.; Su, J. Research on the Spatial Distribution Characteristics of Major Water Environmental Pollutants in Fuyang River. J. Environ. Sci. 2012, 11, 814–819. [Google Scholar]
- Lang, C.; Shan, B.Q.; Li, S.M.; Zhao, Y.; Duan, S.H. Pollution analysis and ecological risk assessment of heavy metals in surface sediment of Fuyang River. Acta Sci. Circumstantiae 2016, 36, 64–73. [Google Scholar]
- Huang, J.H.; Tao, Y.R.; Huang, T.Y.; Li, Z.C.; Chen, S.Q. Occurrence, Sources and Health Risk Assessment of Per- and Polyfluoroalkyl Substances in Surface Water of Hongze Lake. Res. Environ. Sci. 2023, 36, 694–703. [Google Scholar]


| Target Compounds | Target Compounds | ||
|---|---|---|---|
| PFBA | perfluorobutanoic acid | PFPeA | perfluoropentanoic acid |
| PFHxA | perfluorohexanoic acid | PFHpA | perfluoroheptanoic acid |
| PFOA | perfluorooctanoic acid | PFNA | perfluorononanoic acid |
| PFDA | perfluorodecanoic acid | PFUnDA | perfluoroundecanoic acid |
| PFDoDA | perfluorododecanoic acid | PFTrDA | perfluorododecanoic acid |
| PFTeDA | perfluorotetradecanoic acid | PFHxDA | perfluoropalmitic acid |
| PFODA | perfluorooctadecanoic acid | PFBS | perfluorobutane sulfonate |
| PFHxS | perfluorohexane sulfonate | PFOS | perfluorooctane sulfonate |
| PFDS | perfluorooctanesulfonate | PF-3,7-DMOA | perfluoro-3,7-dimethyloctanoic acid |
| PFPeS | perfliuoropentane sulfonate | 8-2FTS | 1H,1H,2H,2H-perfluorodecane sulfonate |
| PFHpS | perfluoroheptane sulfonate | PFNS | perfluorononane sulfonate |
| 4-2FTS | 1H,1H,2H,2H-perfluorohexane sulfonate | 6-2FTS | 1H,1H,2H,2H-perfluorooctane sulfonate |
| Reagents and Experimental Materials | Grade/Purity | Manufacturer and Producing Area |
|---|---|---|
| Methanol | LC-MS grade | MREDA, America |
| Formic acid | LC-MS grade | Aladdin Reagent, China |
| Acetonitrile | LC-MS grade | MREDA, America |
| Ammonium acetate | HPLC grade | GENERAL-REAGENT, China |
| Ammonia | LC-MS grade | Aladdin Reagent, China |
| Instrument | Type Specification | Manufacturer |
|---|---|---|
| Liquid chromatography triple quadrupole mass spectrometer | A/B SCIEX 5500+ | A/B SCIEX, USA |
| Chromatographic column | Waters, China | |
| Solid-phase extraction | CNW16 Solid Phase Extraction Vacuum Device | Anpel, China |
| Solid-phase extraction column | HLB | Waters, China |
| Filter membrane | Anpel, China | |
| Electronic analytical balance | SQP | Sartorius, Germany |
| Pure water filter | Milli-Q Direct16 | Millipore, USA |
| Sampling Points | Longitude (°E) | Latitude (°N) | Elevation |
|---|---|---|---|
| S1 | 114.2077 | 36.4234 | 144 |
| S2 | 114.3210 | 36.3982 | 96 |
| S3 | 114.4852 | 36.5647 | 56 |
| S4 | 114.5259 | 36.6958 | 55 |
| S5 | 114.7659 | 36.6826 | 48 |
| Instrument Model | Acquity UPLC ® HSS T3 chromatographic column | ||||
| Column temperature | 40 °C | ||||
| Mobile phase | 5 mmol/L ammonium acetate aqueous solution PH = 7 (A) acetonitrile (B) | ||||
| Gradient | Time | Velocity of flow | ) | ) | |
| Initial time | 0.3 | 80 | 20 | ||
| 14 | 0.3 | 10 | 90 | ||
| 16 | 0.3 | 10 | 90 | ||
| 16.01 | 0.3 | 80 | 20 | ||
| 20 | 0.3 | 80 | 20 | ||
| Mass spectrometry parameters | Capillary voltage | 4500 V | |||
| Desolvation temperature | 500 °C | ||||
| Desolvation gas flow | 50 mL/min | ||||
| Cone gas flow | 50 mL/min | ||||
| Substance | Mother Ion/Daughter Ion | Cone Voltage (V) | Collision Energy (V) |
|---|---|---|---|
| PFBA | 213/169 | 40 | 13 |
| PFPeA | 263/219 | 40 | 10 |
| PFHxA | 313/269 | 45 | 13 |
| PFHpA | 363/319 | 30 | 14 |
| PFOA | 413/369 | 40 | 14 |
| PFNA | 463/419 | 35 | 16 |
| PFDA | 513/469 | 40 | 18 |
| PFUnDA | 563/519 | 70 | 16 |
| PFDoDA | 619/569 | 70 | 18 |
| PFTrDA | 663/619 | 65 | 20 |
| PFTeDA | 713/669 | 85 | 20 |
| PFHxDA | 813/769 | 90 | 18 |
| PFODA | 913/869 | 40 | 25 |
| PFBS | 299/80 | 90 | 90 |
| PFHxS | 399/80 | 90 | 90 |
| PFOS | 499/80 | 105 | 110 |
| PFDS | 599/80 | 120 | 124 |
| PF-3,7-DMOA | 513/469 | 50 | 16 |
| PFPeS | 349/80 | 120 | 72 |
| PFHpS | 449/80 | 150 | 106 |
| PFNS | 549/80 | 170 | 120 |
| 8-2FTS | 527/507 | 75 | 28 |
| 4-2FTS | 327/307 | 115 | 34 |
| 6-2FTS | 427/407 | 145 | 40 |
| RQ | Grade |
|---|---|
| RQ < 0.01 | Minimal risk |
| 0.01 ≤ RQ < 0.1 | Low risk |
| 0.1 ≤ RQ < 1 | Medium risk |
| RQ ≥ 1 | High risk |
| Age | 3–6 | 7–11 | 12–16 | 17–19 | 20–24 | 25–59 | >60 | Reference | ||
|---|---|---|---|---|---|---|---|---|---|---|
| Sexual Distinction | ||||||||||
| Male | 19.63 | 33.84 | 55.16 | 63.43 | 67.2 | 70.77 | 67.1 | [48] | ||
| Female | 18.65 | 31.94 | 49.44 | 52.67 | 53.8 | 58.37 | 59.45 | |||
| ) | 1.08 | 1.24 | 1.73 | 2.26 | 2.81 | 2.81 | 2.81 | [49] | ||
| Concentration | |||||
|---|---|---|---|---|---|
| Compound | DF | ||||
| Short-chain PFASs | PFBA | <LOQ | 0.819 | 0.164 | 20 |
| PFHxA | 0.297 | 2.199 | 0.996 | 100 | |
| PFHpA | <LOQ | 0.428 | 0.234 | 80 | |
| PFBS | 0.385 | 2.157 | 1.000 | 100 | |
| PFHxS | 1.288 | 7.582 | 3.142 | 100 | |
| PFPeS | <LOQ | 0.114 | 0.023 | 20 | |
| Long-chain PFASs | PFOA | 0.302 | 2.849 | 1.630 | 100 |
| PFNA | 0.149 | 0.352 | 0.215 | 80 | |
| PFODA | <LOQ | 0.294 | 0.114 | 60 | |
| PFOS | 7.135 | 11.281 | 10.758 | 100 | |
| Total PFASs | Short-chain PFASs | 2.677 | 10.150 | 5.559 | 70 |
| Long-chain PFASs | 7.731 | 19.255 | 12.717 | 85 | |
| ∑24PFASs | 13.797 | 22.880 | 18.275 | 76 | |
| Study Area | Sample Time | Number of PFASs | Concentration | Reference | |||
|---|---|---|---|---|---|---|---|
| PFASs | PFOS | PFHxS | PFOA | ||||
| Fuyang River | 2024 | 10 | 13.8–22.9 | 7.1–16.6 | 1.3–7.6 | 0.3–2.9 | This paper |
| Yangtze River | 2013 | 18 | 2.2–74.6 | N.D.–3.1 | N.D.–4.5 | 0.5–18.0 | [53] |
| Pearl River | 2012 | 13 | 3.0–52.0 | 0.5–11.0 | N.D.–1.0 | 0.7–8.7 | [54] |
| Songhua River | 2017 | 15 | 6.4–32.0 | N.D. | N.D.–1.1 | N.D.–1.7 | [55] |
| Yalu River | 2017 | 15 | 6.3–28.0 | N.D. | N.D. | N.D.–2.2 | [55] |
| Haihe River | 2010 | 9 | 12.0–74.0 | 2.0–17.6 | N.D. | 14.4–42.1 | [56] |
| Liaohe river | 2012 | 11 | 44.4–781.0 | 0.1–9.5 | N.D. | 0.7–61.6 | [57] |
| Qinglong Lake | 2021 | 12 | 3.6–467.0 | N.D.–5.0 | N.D.–6.0 | N.D.–342.0 | [41] |
| Tai Lake | 2009 | 10 | 10.6–36.7 | 10.6–36.7 | N.D.–6.5 | 10.6–36.7 | [58] |
| Baiyang Lake | 2016 | 10 | 140.5–1828.5 | N.D.–12.7 | 2.1–1688.0 | 13.6–441.0 | [59] |
| Qiandao Lake | 2017 | 5 | 1.7–6.2 | N.D. | N.D. | 0.5–3.6 | [60] |
Disclaimer/Publisher’s Note: The statements, opinions and data contained in all publications are solely those of the individual author(s) and contributor(s) and not of MDPI and/or the editor(s). MDPI and/or the editor(s) disclaim responsibility for any injury to people or property resulting from any ideas, methods, instructions or products referred to in the content. |
© 2025 by the authors. Licensee MDPI, Basel, Switzerland. This article is an open access article distributed under the terms and conditions of the Creative Commons Attribution (CC BY) license (https://creativecommons.org/licenses/by/4.0/).
Share and Cite
Pan, X.; Wu, L.; Wang, D. Per- and Polyfluoroalkyl Substances in Surface Water of Fuyang River (Handan Section): Occurrence, Source Apportionment, and Risk Assessment. Water 2025, 17, 1223. https://doi.org/10.3390/w17081223
Pan X, Wu L, Wang D. Per- and Polyfluoroalkyl Substances in Surface Water of Fuyang River (Handan Section): Occurrence, Source Apportionment, and Risk Assessment. Water. 2025; 17(8):1223. https://doi.org/10.3390/w17081223
Chicago/Turabian StylePan, Xiaoying, Lifeng Wu, and Dong Wang. 2025. "Per- and Polyfluoroalkyl Substances in Surface Water of Fuyang River (Handan Section): Occurrence, Source Apportionment, and Risk Assessment" Water 17, no. 8: 1223. https://doi.org/10.3390/w17081223
APA StylePan, X., Wu, L., & Wang, D. (2025). Per- and Polyfluoroalkyl Substances in Surface Water of Fuyang River (Handan Section): Occurrence, Source Apportionment, and Risk Assessment. Water, 17(8), 1223. https://doi.org/10.3390/w17081223