Article

Study on Characteristics of the Water Diversion Ratio and Impact of the Diversion Dyke at South and North Ports of the Minjiang River During Wet Season

1
College of Civil Engineering, Fuzhou University, Fuzhou 350108, China
2
Fujian Port & Waterway Investigation and Design Institute Limited, Fuzhou 350002, China
*
Author to whom correspondence should be addressed.
Water 2025, 17(8), 1183; https://doi.org/10.3390/w17081183
Submission received: 5 March 2025 / Revised: 11 April 2025 / Accepted: 14 April 2025 / Published: 15 April 2025

Abstract

:
The hydrodynamic processes in estuarine regions play a crucial role in the morphological and ecological stability of coastal zones. As a key hydrodynamic characteristic of bifurcated rivers, the water diversion ratio (WDR) influences flow distribution, sediment transport, and shoreline changes in estuaries. This study focuses on the lower Minjiang River and employs a MIKE 21-based two-dimensional hydrodynamic model to quantify the WDR variations between the South and North Ports on the scale of a tidal cycle during the wet season and to reveal the regulatory effects of diversion dyke length and angle. The results indicate that the WDR of the North Port exhibits significant variation with tidal stages. The WDR of the North Port increases with the length of the diversion dyke. The current 110 m-long dyke has little effect on regulating water flow between the North and South Ports, and its WDR remains unaffected by changes in angle. In contrast, a 450 m-long dyke is highly sensitive to angle variations. This study not only provides scientific support for channel regulation in the lower Minjiang River but also offers indirect insights into shoreline stability and ecological management under the combined influence of human activities and natural processes in estuarine environments.

1. Introduction

In estuarine regions, the water diversion ratio (WDR), a critical metric for quantifying flow distribution within bifurcated channels, not only reflects inherent hydrodynamic processes but also directly influences sediment transport and deposition patterns, thereby potentially affecting estuarine morphological evolution and ecosystem health [1,2]. Estuarine topographies exhibit the dual impacts of tidal amplitude and river flow, while also incorporating representations of alluvial deposits [3]. The evolution of the riverbed, in turn, exerts a feedback effect on the development of the river [4].
Meandering river systems exhibiting mid-channel bar development constitute one of the most ubiquitous planform configurations observed in fluvial environments [5,6,7]. These dynamic systems exhibit distinct planimetric characteristics through central mid-channel bars that induce bifurcation [8]. Notably, these bifurcation points exhibit persistent flow asymmetry that governs differential sediment routing pathways, demonstrating significant temporal variations in hydraulic partitioning efficiency [9]. Understanding the decadal-scale evolutionary trajectories of such complex anastomosing systems requires comprehensive analysis of their response mechanisms to both autogenic processes and allogenic disturbances, particularly through the lens of coupled hydrodynamic forces and sediment dynamics [10].
The dynamic adjustment of the WDR significantly shapes hydro-sedimentary processes, as evidenced by multidisciplinary studies spanning urban water systems, fluvial morphology, and debris flow dynamics. In urbanized river basins, Song and Pang [11] demonstrated that shifts in the WDR in Nanjing’s Qinhuai River Basin directly modulate pollutant distribution and hydraulic equilibrium. Their modeling revealed that unequal flow partitioning between bifurcated channels creates distinct water quality gradients, with pollutant dilution exhibiting nonlinear responses to upstream flow variations. These findings highlight the dual role of WDRs as both hydraulic regulators and environmental stressors in managed water systems. Fluvial systems exhibit heightened sensitivity to diversion ratio alterations. Alomari et al. [12] experimentally quantified scour depth and length in main channels under diversion flows, revealing reduced scour with smaller diversion angles and establishing empirical relationships linking depth/length to angles, bed width ratios, and discharges. Complementary research by Abdulhafedh et al. [13] demonstrated that engineering interventions, particularly entrance edge modifications, can attenuate scour depth by up to 22% at critical discharge conditions, underscoring the potential for structural optimization to buffer sedimentary impacts. Debris flow studies have further expanded this paradigm. Xu et al. [14] developed a two-phase flow model showing that WDRs in cross-channels critically depend on solid–liquid composition and geometric constraints, with bifurcation dynamics dictating flow path sedimentation risks. Similarly, flood management research by Zhang and Yu [15] in the Han River basin identified threshold behaviors in diversion efficiency, where initial flow partitioning disproportionately influences breach evolution stages and sediment transport capacity. Therefore, diversion ratio management serves dual environmental roles: mitigating pollution/scour and triggering sediment instability. Developing adaptive frameworks and coupled flow–sediment models is critical for balancing objectives under climate-driven hydrological shifts. In the process of sediment transport, the dynamic evolution of permeability is a critical factor, as both permeability and flow characteristics are directly influenced by changes in the pore structure of sediments. Recent studies have highlighted the importance of advanced measurement techniques in quantifying permeability variations under varying stress conditions [16,17].
As critical engineered systems for managing flow distribution in bifurcated rivers, diversion dykes have persistently attracted research attention in river engineering, particularly regarding their hydrodynamic performance and failure mechanisms under complex hydraulic loads. Recent studies have systematically explored the hydrodynamic behavior and engineering applications of flow diversion structures. Gao et al. [18] conducted 3D numerical simulations on non-submerged diversion dykes, demonstrating that blockage ratios critically govern momentum redistribution and turbulent kinetic energy. Their results highlighted that higher blockage ratios intensify flow velocity gradients, amplify vortex shedding frequency, and elevate bed shear stress around the dyke, while Froude numbers exhibited minimal influence on recirculation zone dynamics. In parallel, Ranjbar-Zahedani et al. [19] investigated an optimized submerged triangular diversion structure for pier scour mitigation. Through systematic experimentation, they identified that strategic positioning and sizing of the structure significantly reduced both maximum scour depth and total scour volume. Flow field analysis revealed the structure’s effectiveness in attenuating downflow intensity and suppressing horseshoe vortex development, key mechanisms driving scour reduction. The research links theory to application, emphasizing tailored diversion structures for specific flow regimes. The stability and failure mechanisms of diversion dykes under extreme hydrological events (e.g., floods and tidal surges) have also drawn significant attention. Recent experimental studies have shown that optimizing the pile shape of combined dykes in flood scenarios can reduce the intensity of horseshoe vortices, lowering scour risks and protecting riverbanks [20]. Moreover, despite extensive research on spur dyke design, knowledge gaps remain regarding failure mechanisms under extreme conditions. Nandhini et al. [21] provided a comprehensive review of the flow characteristics, scour effects, and design standards of spur dykes under both normal and extreme conditions, offering valuable insights for research and engineering practice.
As the largest independent river discharging into the East China Sea in Fujian Province, southeastern China [22], the Minjiang River’s upstream flow regime is primarily regulated by the Shuikou Dam, with a mandated minimum ecological discharge threshold of 308 m3/s [23]. Investigating the water diversion ratio characteristics and the impact of the diversion dyke structure at the South–North Port bifurcation holds significant implications for advancing hydrological science, optimizing water resource management strategies, and informing sustainable engineering practices within estuarine environments.
However, existing research on the WDR of the South and North Ports mainly applies modern statistical methods to analyze current hydrological and topographical data, while numerical simulation studies remain relatively limited. To address this gap, this study develops a two-dimensional hydrodynamic model. Unlike previous research that emphasized long-term spatiotemporal analyses of WDR dynamics in the lower Minjiang River, this study focuses on the dynamic variation in the WDR during the wet season, particularly during spring and neap tidal cycles. Furthermore, it explores the influence of the diversion dyke’s length and rotation angle on the WDR under the current channel morphology of the South and North Ports.

2. Study Area and Methodology
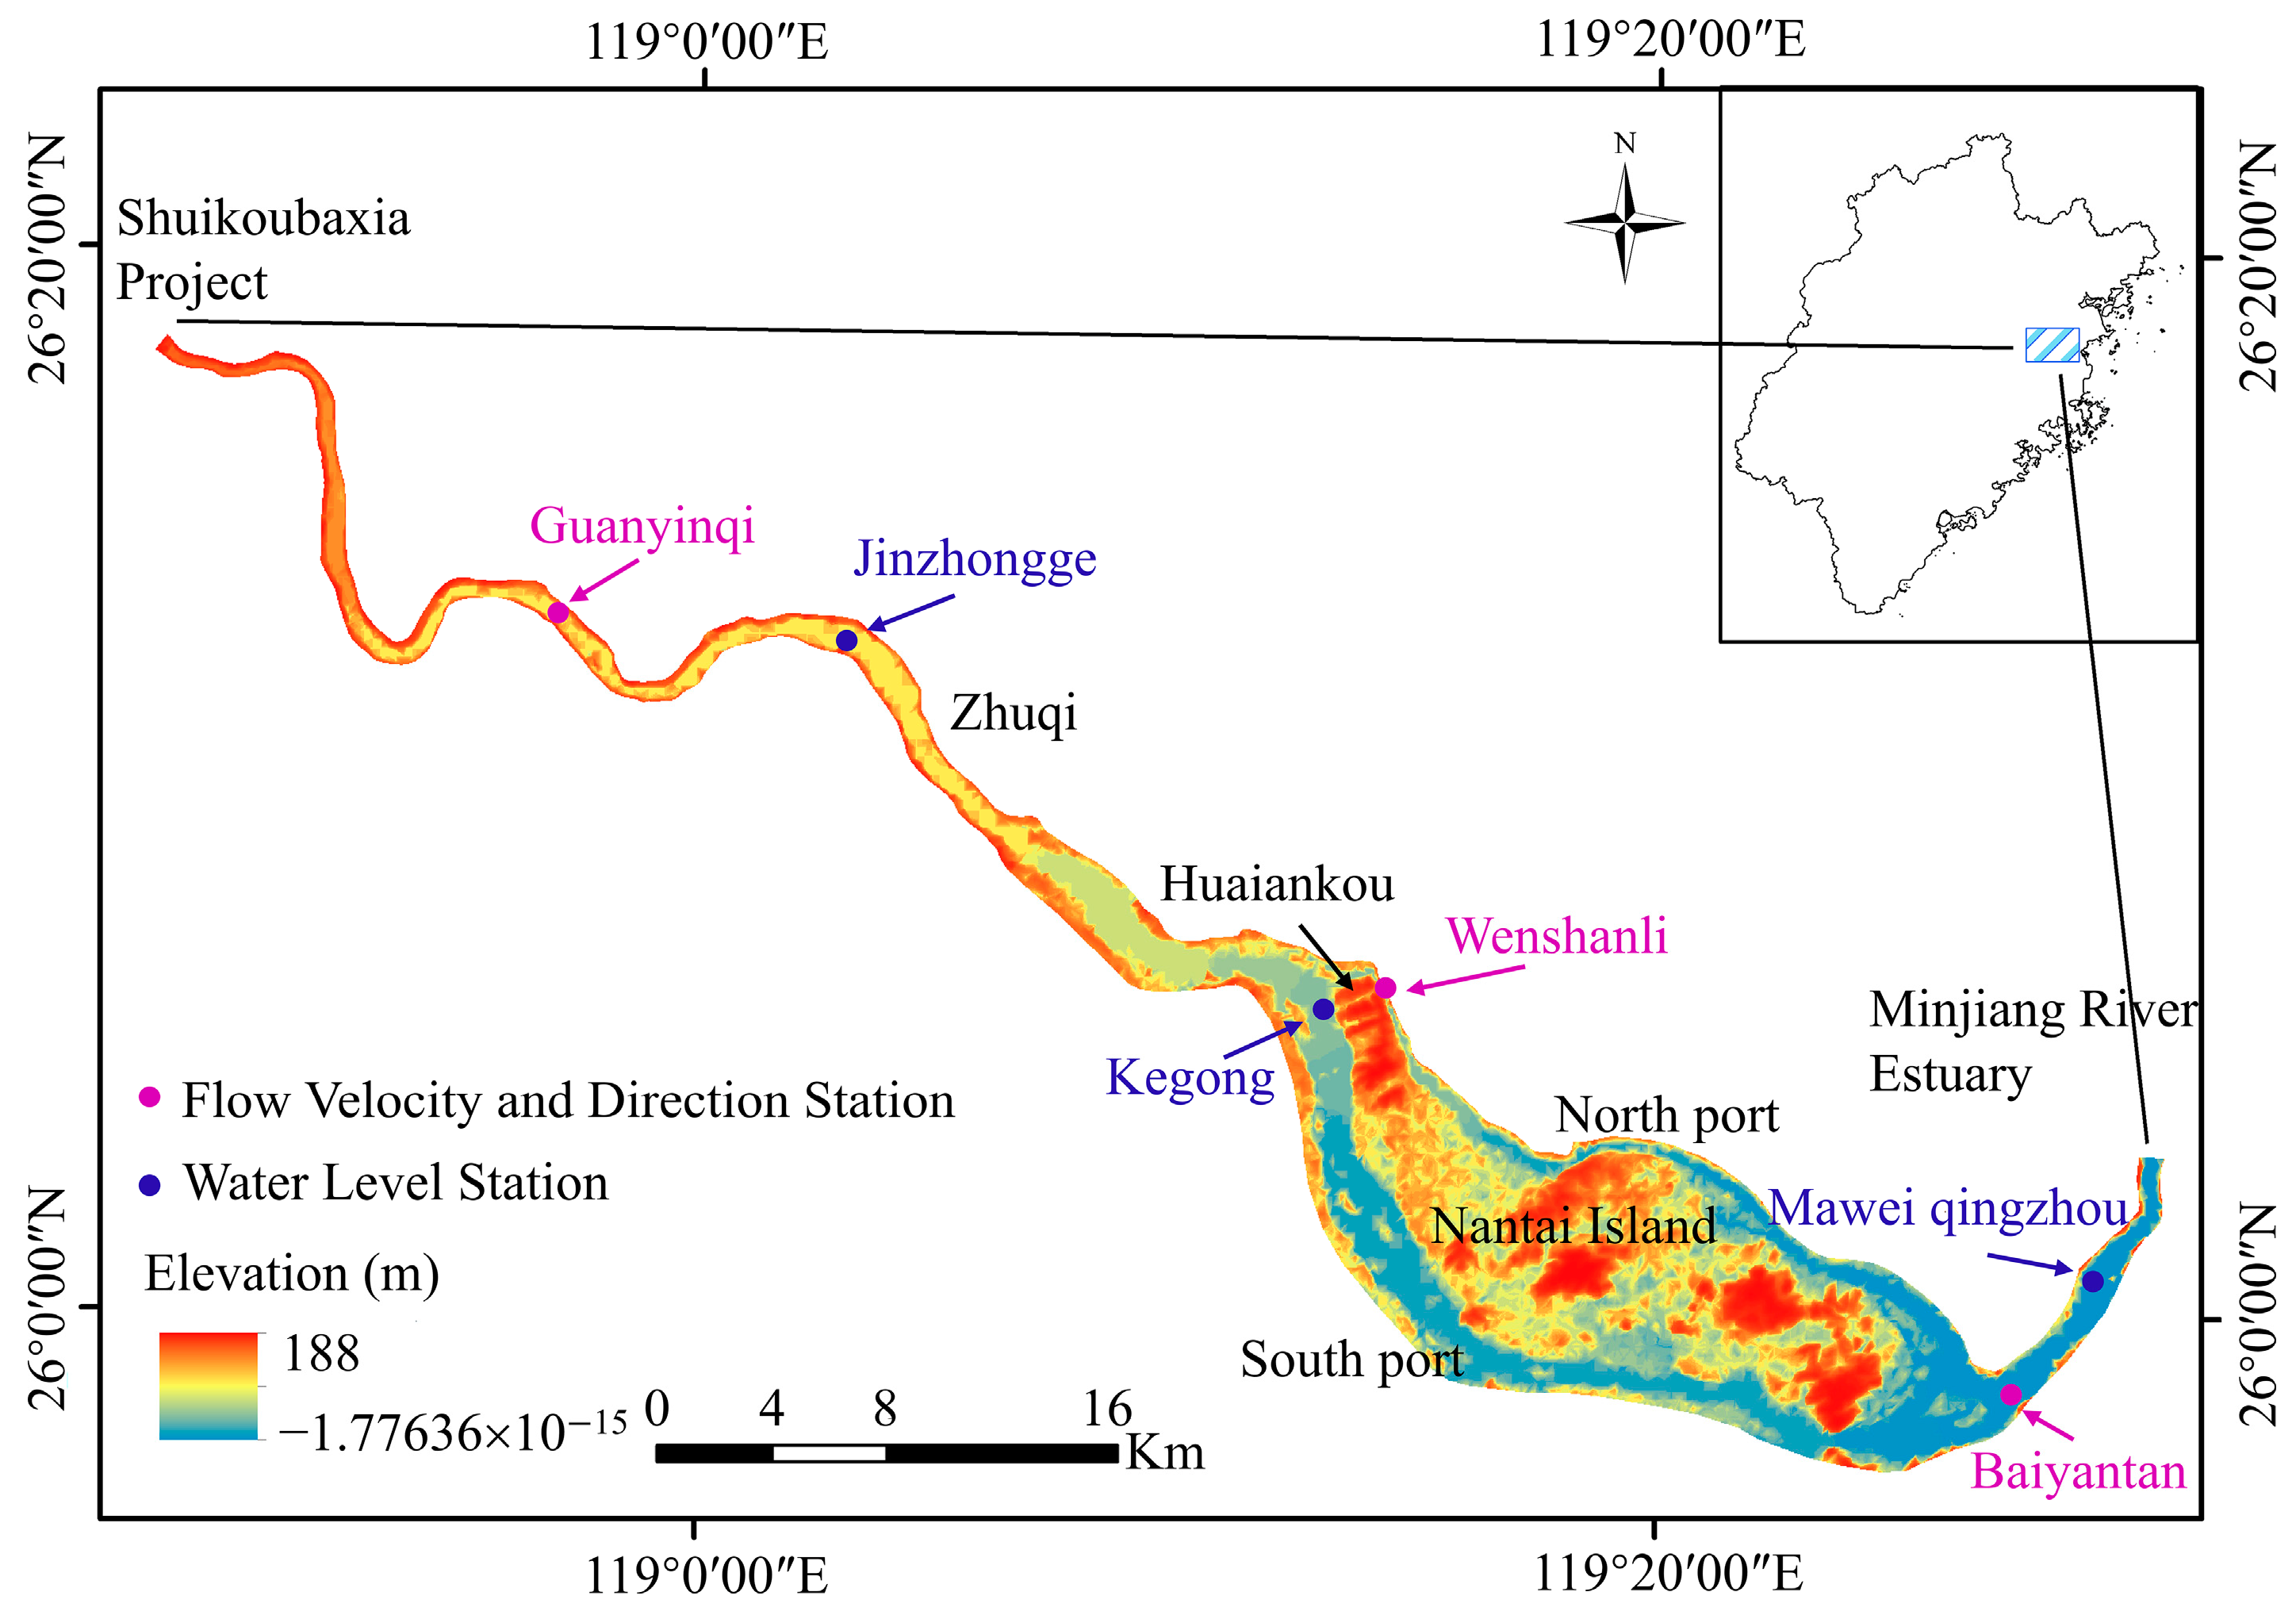
2.1. Study Area

The Minjiang River originates in Jiankou Town, Jianxian County, located at the border of Fujian and Jiangxi provinces. In its lower reaches, the river bifurcates at Huaiankou. The northern branch, known as the North Port, flows through the urban area of Fuzhou and reaches Mawei Port. The southern branch, referred to as the South Port or Wulong River, flows along the southern side of Nantai Island, joins the Dazhangxi River at Jiangkou, exits the Xiadou, and reaches Mawei. The South and North Ports encircle Nantai Island before converging at Luoxingta in Mawei. The South and North Ports differ significantly in channel morphology. The North Port is narrow and deep, functioning as a navigable waterway, with its narrowest section measuring only 130 m in width during the dry season. In contrast, the South Port is wide and shallow, with its widest section spanning up to 4600 m. The terrain along both banks alternates between plains and hills. Compared to the North Port, the South Port features more sandbars, shallows, and bifurcated channels, resulting in scattered water flow. As a result, it serves as the main channel for flood discharge and sediment transport. A schematic diagram of the lower reaches of the Minjiang River is shown in Figure 1.
Before 1975, the WDR between the South and North Ports remained relatively stable. During the dry season, the WDR was 3:7, while it reversed during the wet season. However, after 1975, large-scale sand extraction in the North Port caused a steady increase in its WDR. In 1998, the catastrophic “98·6” flood eroded the riverbed at the entrance of the South Port, leading to the opening of the South Port entrance. In recent years, the complete ban on sand extraction in the North Port, combined with development and channel regulation projects in the South Port, has significantly deepened the channel. Since 1998, the WDR between the South and North Ports has undergone structural changes. This has resulted in a trend of the South Port’s WDR being significantly greater than that of the North Port. Currently, the trend requires urgent attention from relevant authorities. If left unregulated, it could cause issues with navigation safety, bridge integrity, and the ecological environment. Therefore, new research from a different perspective is needed to propose waterway regulation strategies that align with the current trend.
The arrangement of hydraulic structures significantly affects the WDR. In 1981, a 450 m-long diversion dyke was constructed on the left side of the South Port’s diversion entrance in the Minjiang River. This structure played a crucial role in regulating the WDR between the South and North Ports. However, the regulatory effectiveness of the diversion dyke now faces several challenges due to changes in WDR trends. First, the diversion dyke, built in 1981, is no longer suited to current WDR conditions. Second, the spur dyke groups along the Zhuqi to Huaiankou river reach have been damaged by continuous water scouring over time. Notably, the diversion dyke at Huaiankou has experienced severe damage from repeated floods, significantly reducing its ability to control water flow. Therefore, exploring rehabilitation measures for the diversion dyke and assessing its impact on the WDR under the current morphological evolution of the South and North Ports holds significant engineering and academic value.

2.2. Model Establishment

This study utilizes the MIKE 21 two-dimensional hydrodynamic model developed by the DHI for the calculations. The computational principles of this model are based on the Reynolds-averaged Navier–Stokes equations and adhere to the Boussinesq assumption and the hydrostatic pressure assumption. The equations are solved using a finite volume method for spatial discretization. The continuity equation for water flow is expressed as follows:
h t + h u ¯ x + h v ¯ y = h S
The momentum equations for water flow in the x and y directions are as follows:
h u ¯ t + h u ¯ 2 x + h v ¯ u ¯ y = f ν ¯ h g h η x h p a ρ 0 x g h 2 ρ 2 ρ 0 x + τ s x ρ 0 τ b x ρ 0 1 ρ 0 ( S x x x + S x y y ) + x ( h T x x ) + y ( h T x y ) + h u s S
h v ¯ t + h u ¯ v ¯ x + h v ¯ 2 y = f u ¯ h g h η y h p a ρ 0 y g h 2 ρ 2 ρ 0 y + τ s y ρ 0 τ b y ρ 0 1 ρ 0 ( S y x x + S y y y ) + x ( h T x y ) + y ( h T y y ) + h v s S
where u ¯ and v ¯ are depth-averaged velocities; S is the magnitude of discharge due to point sources; t is time; x and y are Cartesian coordinates; η is surface elevation; d is still water depth; h = η + d is total water depth; f is the Coriolis parameter; g is gravitational acceleration; p a is atmospheric pressure; ρ is the density of water; ρ 0 is the reference density of water; τ s x and τ s y are the x and y components of the surface wind; τ b x and τ b y are the x and y components of the bottom stresses; S x x , S x y , S y x , and S y y are components of the radiation stress tensor; u s and v s represent the velocity by which the water is discharged into the ambient water; and T x x , T x y , and T y y are horizontal stress terms.
The study area encompasses the Minjiang River from the Shuikoubaxia project to the river’s estuary, spanning approximately 117 km. The section from the Shuikoubaxia project to Huaiankou extends about 60 km, while the North Port and South Port measure approximately 32 km and 34 km, respectively. The computational domain is shown in Figure 1. The model simulates hydrodynamic processes during the wet season, covering the period from 25 May to 10 June 2017. A spring tide occurred on 26 May, followed by a neap tide on 2 June.
The model mesh was generated using the Gauss–Kruger projection system (CGCS2000 3 Degree GK CM 120E) and employed an unstructured triangular mesh to discretize the computational domain. To ensure the quality of the mesh and better focus on the changes in the WDR of the South and North Ports, mesh refinement was applied at the Huaiankou bifurcation and along the South and North Channels, with a minimum mesh size of 50 m in critical areas and a maximum size of 80 m in peripheral regions. The study area included 49,492 nodes and 94,760 elements.
Closed boundaries were applied to levees on both sides and the land boundaries of river islets. An average discharge of 1108.92 m3/s, measured at Zhuqi Station during the 2017 wet season, was applied as the upstream boundary condition. The downstream boundary condition was defined by hourly tidal levels at the Minjiang River estuary, with tidal data simulated using the MIKE 21 tidal prediction function. The dynamic boundary condition adopted a “flood and dry” approach, setting drying depth to 0.005 m, flooding depth to 0.05 m, and wetting depth to 0.1 m. Table 1 summarizes the boundary conditions.
The CFL number was set to 0.8, and the time step interval to 10 s. To maintain numerical stability, MIKE 21 ensures that the CFL condition is satisfied at all mesh points by setting a maximum and minimum time step. The computational time step (Δt) is automatically adjusted during model simulation. We set the maximum time step to 10 s and the minimum time step to 0.01 s. The Manning’s roughness coefficient ranged from 0.014 to 0.017, increasing gradually from the Shuikoubaxia project to the estuary.

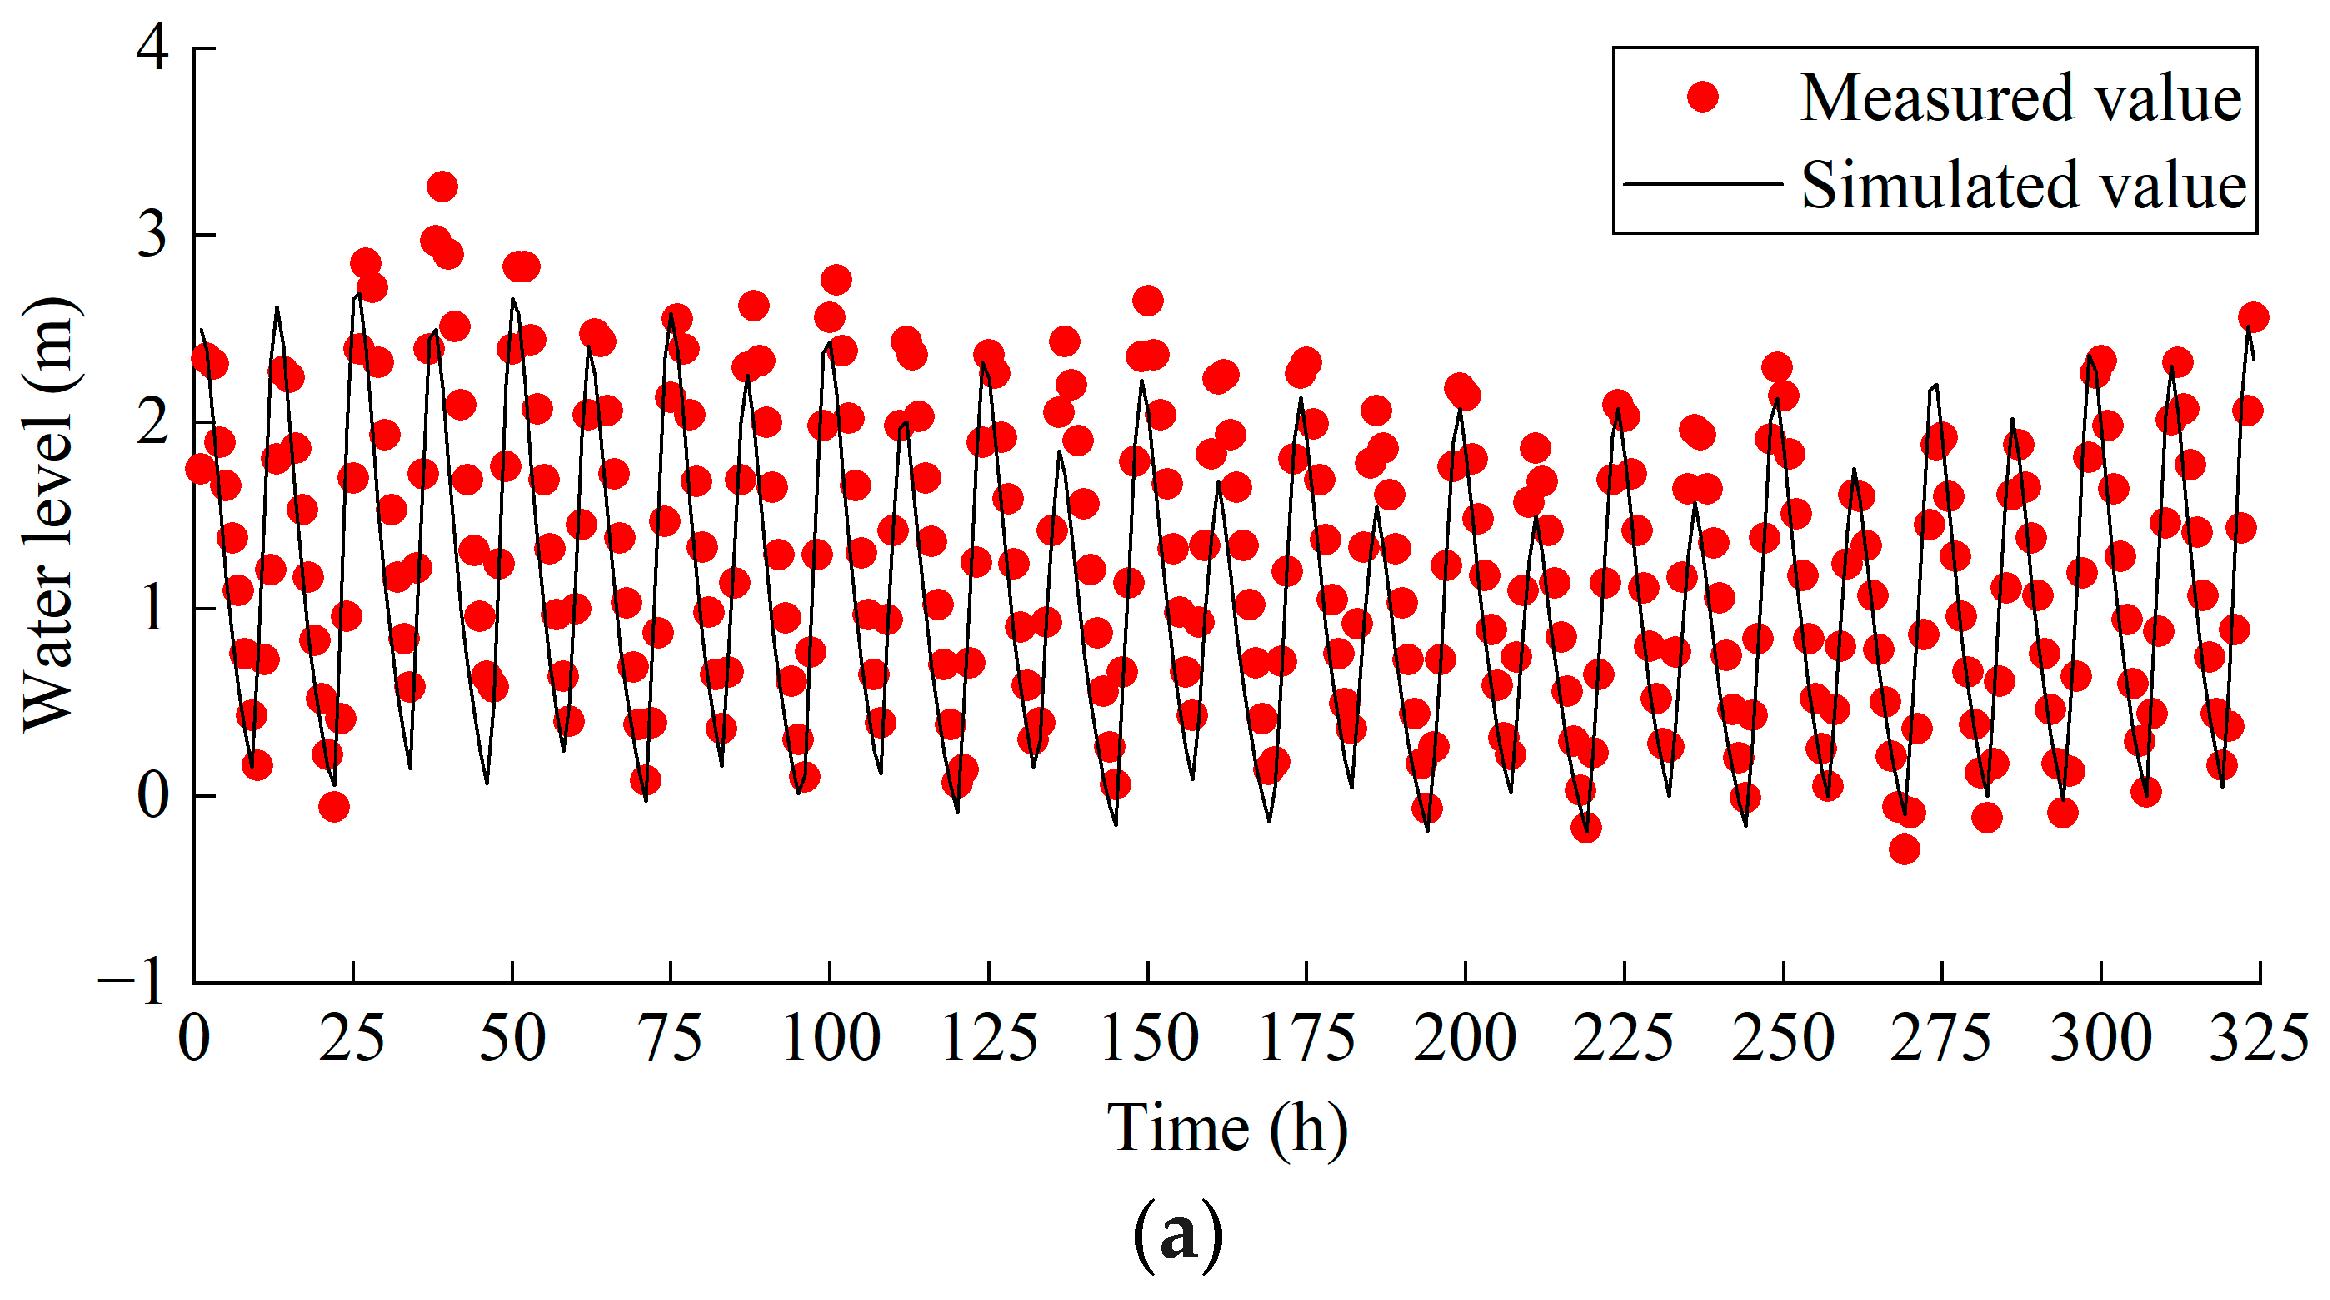
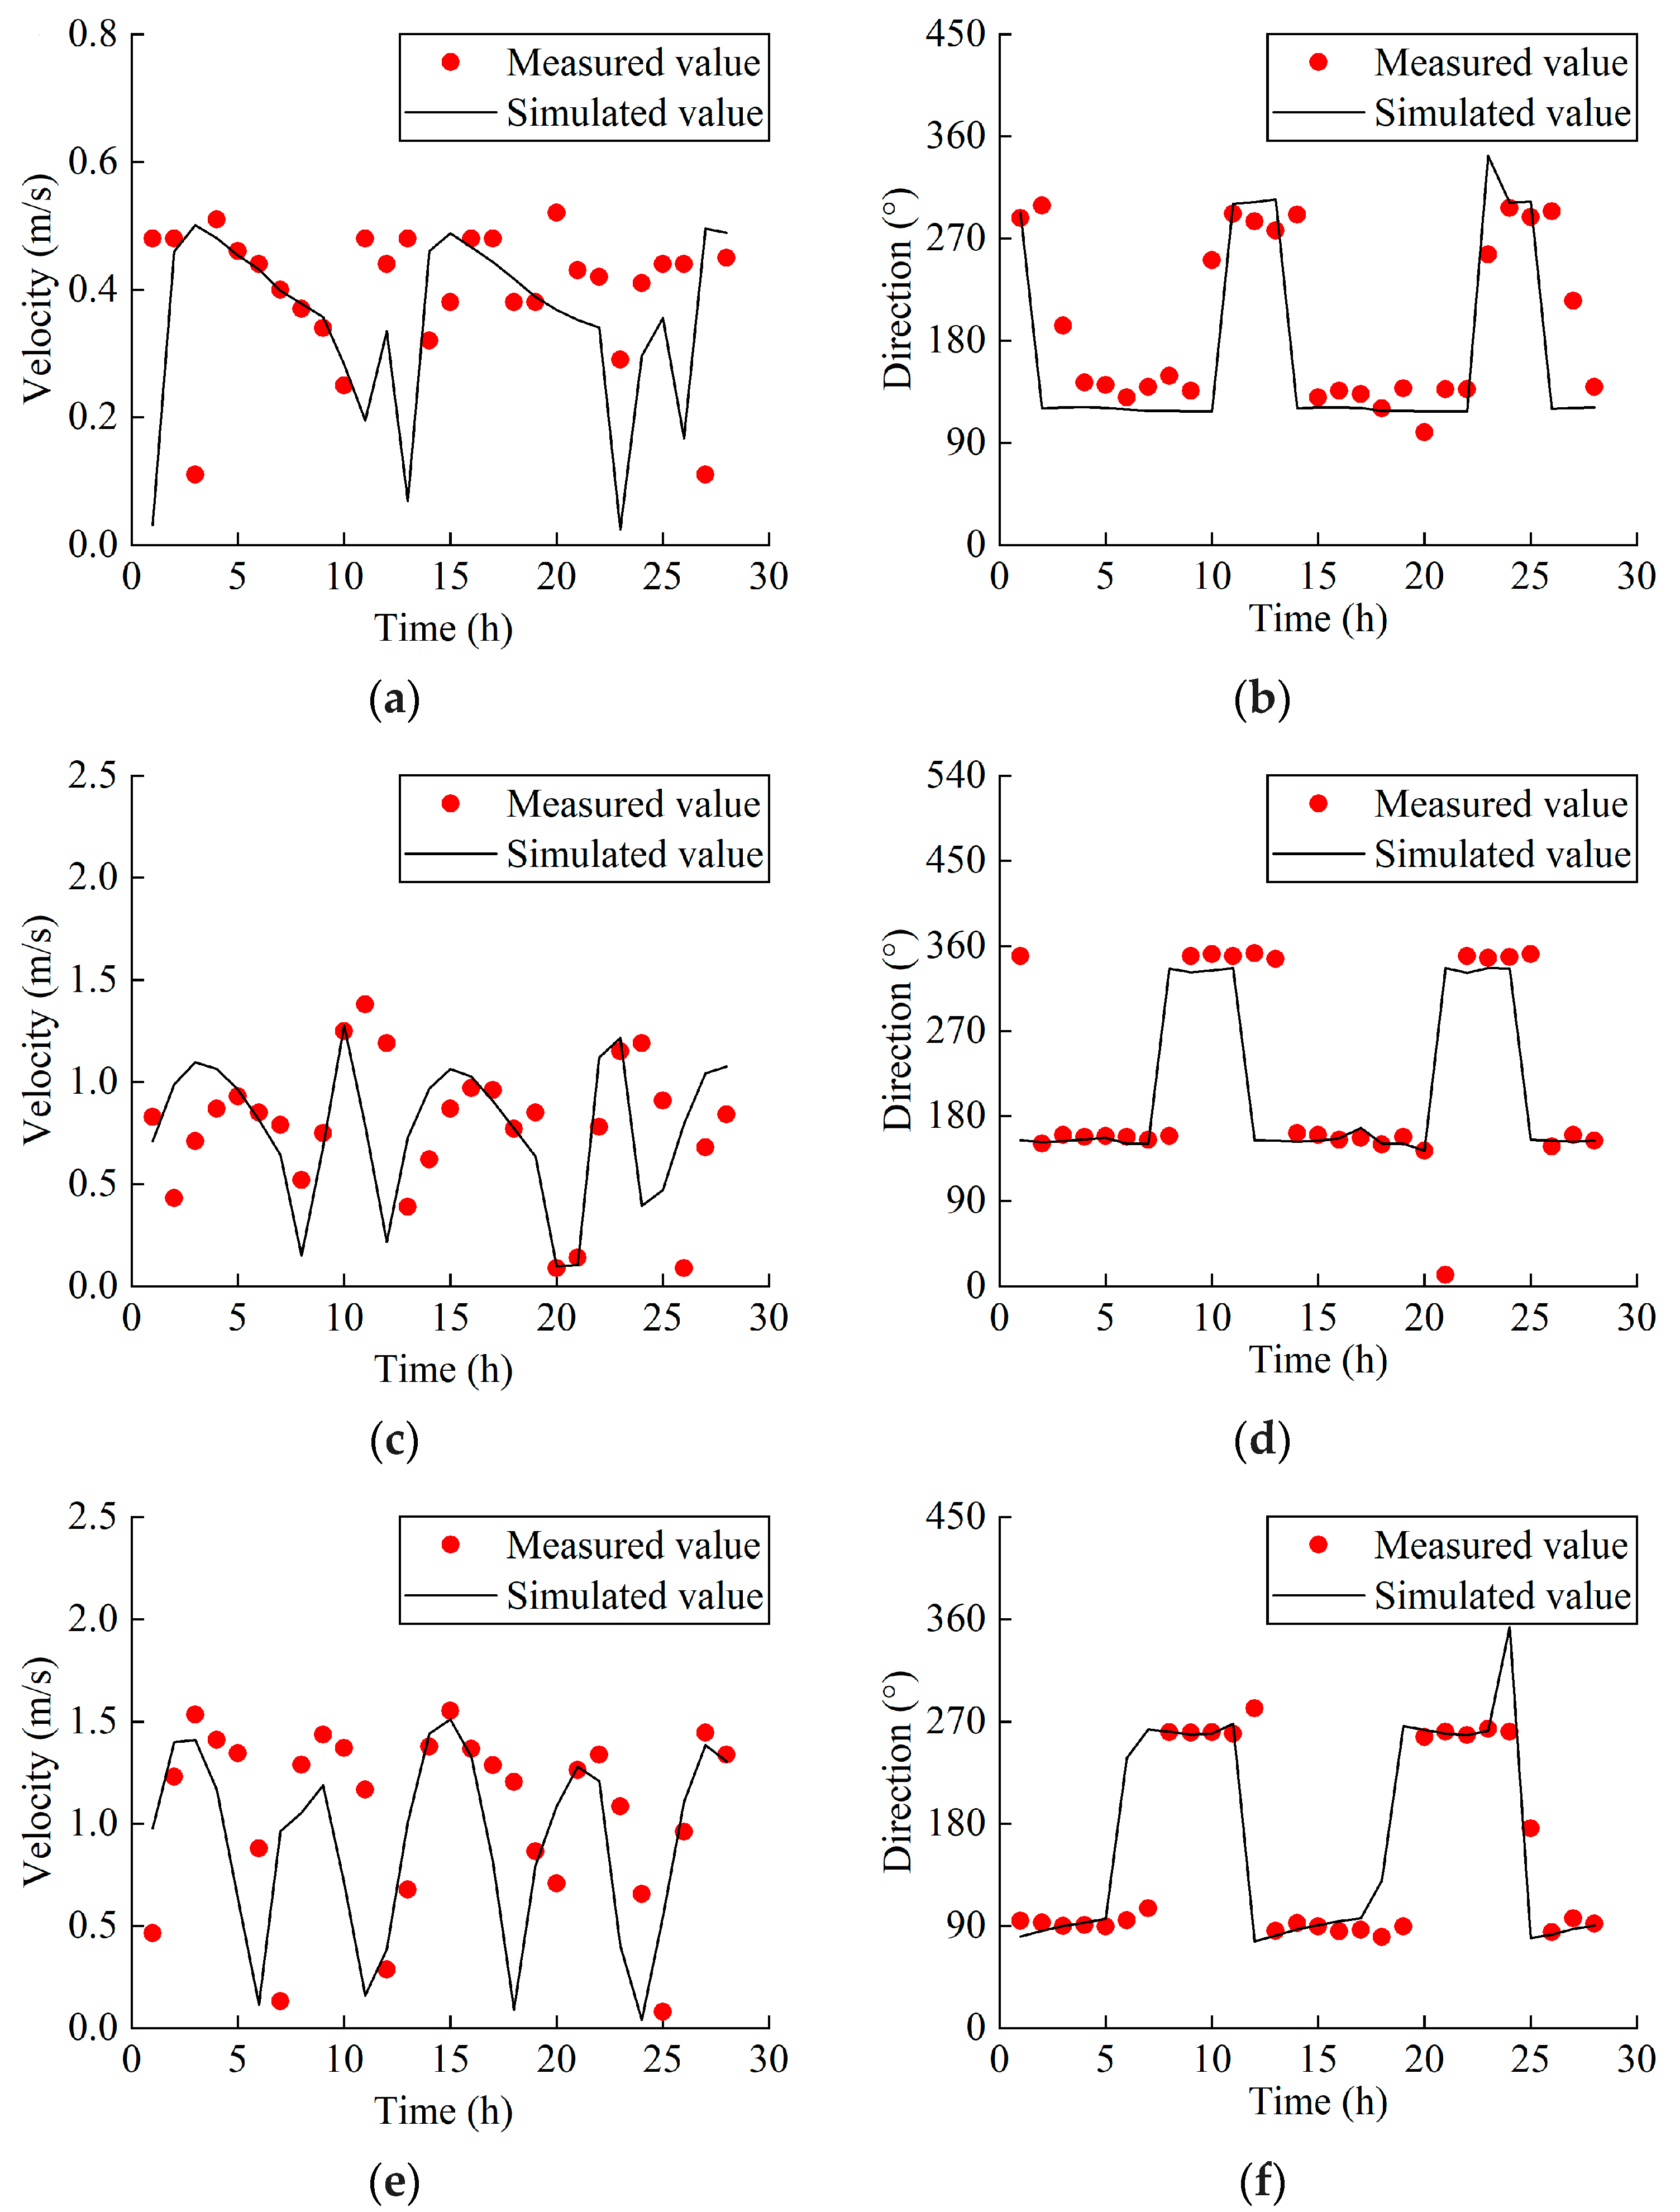
2.3. Model Validation

The model was validated using water levels, flow velocity and direction, and the WDR. For water level validation, data were collected from three stations: Jinzhongge, Kegong, and Maweiqingzhou. Flow velocity and direction validation used data from Guanyinqi, Wenshanli, and Baiyantan stations. The locations of these stations are shown in Figure 1.
The water level validation used hydrological measurement data from three water level stations collected from 12:00 on 17 November 2017 to 00:00 on 1 December 2017. Water levels were referenced to the zero point at Luoxingta. The validation results are shown in Figure 2. To quantify the agreement between the simulated and observed water levels, the mean absolute error (MAE) and mean squared error (MSE) were calculated, as presented in Table 2. The results indicate that the simulated water levels align well with the measured values. Although minor discrepancies occurred occasionally, the overall simulation results are reliable.
The flow velocity and direction validation utilized observed data from three monitoring stations, collected from 13:00 on 18 November 2017 to 16:00 on 19 November 2017. As shown in Figure 3, although the simulated values generally align with the measured values in terms of overall trend, phase errors may cause deviations in flow direction and velocity during rapid tidal flow reversals. The MAE of flow velocity at each monitoring station ranges from 0.13 to 0.37 m/s, with the MSE ranging from 0.04 to 0.23. The overall simulation performance for flow velocity is satisfactory. Additionally, the MAE of flow direction calculated by the model ranges from 36° to 51°. To further verify the accuracy and reliability of the model, the WDR between the South and North Ports during the wet season was examined. The validation data were based on the average WDR for the South and North Ports during the wet season of 2017. The simulated water diversion ratio for the North Port was 20.16%, while the measured ratio was 15.50%, with a relative error within 5%, demonstrating the model’s reliability [24].

2.4. Calculation Method of the WDR

Yu et al. [25] redefined the tidal fluctuation WDR, which refers to the percentage of tidal inflow or outflow through all cross-sections between the South and North Ports of the Mingjiang River. This includes the shoals and main channels during the entire process of flood tide or ebb tide. The WDR is relative to the total tidal inflow or outflow measured simultaneously at the South and North Ports. Therefore, the WDR formula for the South and North Ports analyzed in this paper is
μ N = Q N Q N + Q S ; μ S = Q S Q N + Q S
μ N = | Q N | | Q N | + | Q S | ; μ S = | Q S | | Q N | + | Q S |
where μ S is the WDR of the South Port; μ N is the WDR of the North Port; Q S and | Q S | are the flow at the Kegong cross-section in the South Port and its absolute value; Q N and | Q N | are the flow at the Wenshanli cross-section in the North Port and its absolute value; and μ S and μ N are the WDR of the South and North Ports calculated using absolute flow values.
The average WDRs for the South and North Ports during different periods are calculated using the following equations:
μ S ¯ = 1 T 2 T 1 T 1 T 2 μ S d T
μ N ¯ = 1 T 2 T 1 T 1 T 2 μ N d T
where T 1 and T 2 are the start time and end time of the calculation period, respectively; μ S ¯ and μ N ¯ are the average WDRs of the South Port and North Port during the calculation period; and μ S and μ N are the instantaneous WDRs of the South Port and North Port at a specific time.

3. Results and Discussion

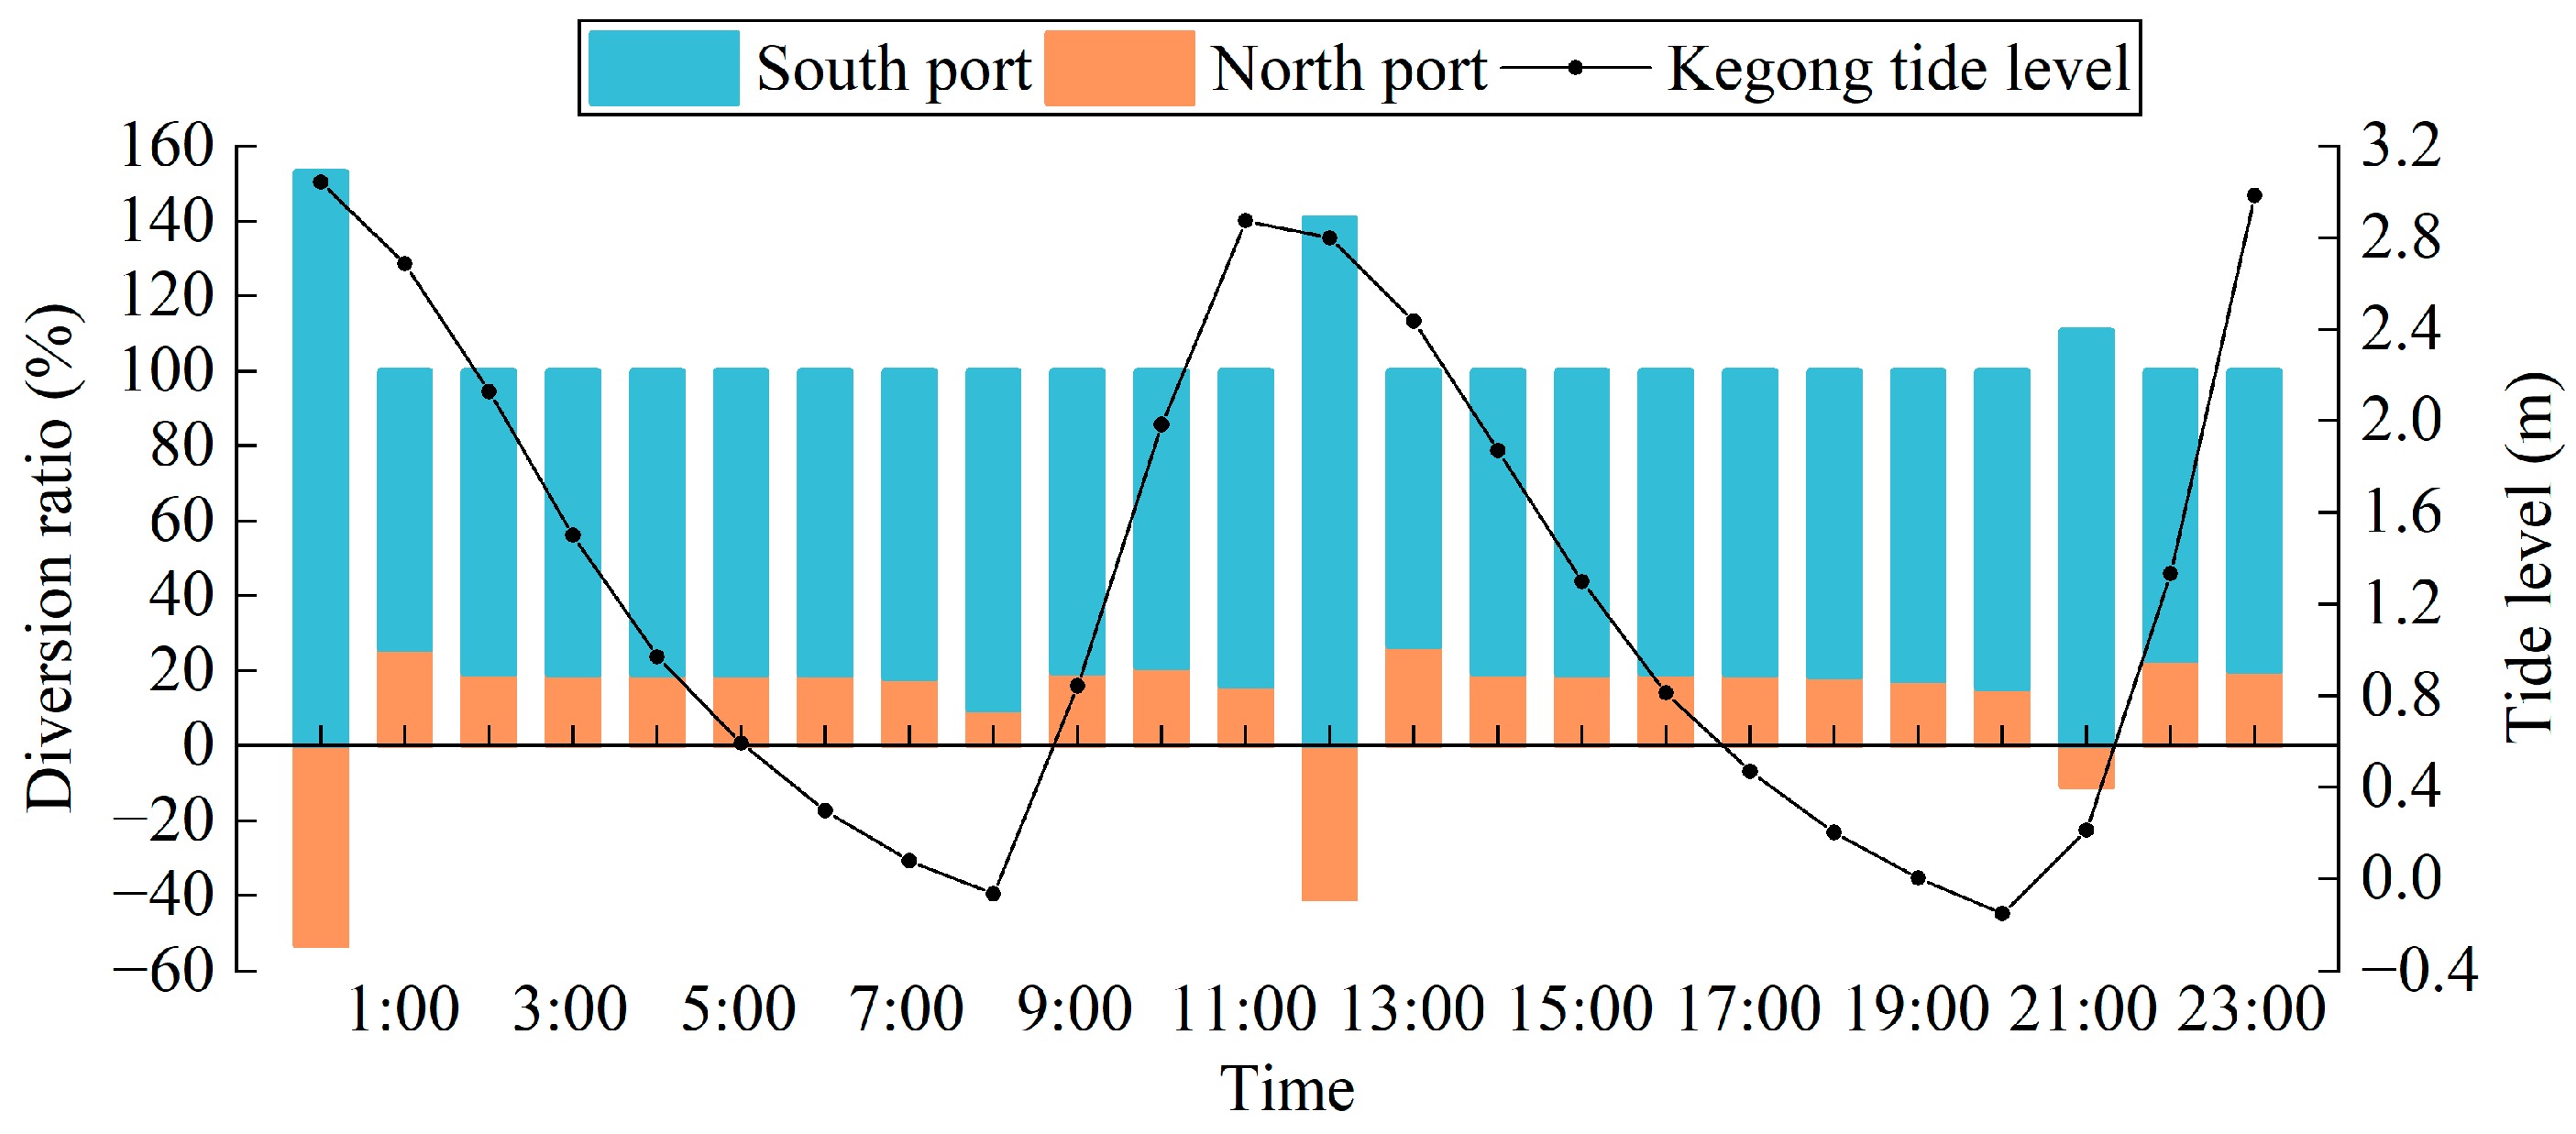
3.1. Spatiotemporal Dynamic Characteristics of the WDR Changes in the South and North Ports

This section analyzes the WDR simulation results for both the spring and neap tides during the wet season based on tidal cycle scales. The WDR for the South and North Ports on 26 May, calculated using Equation (4), is shown in Figure 4. During certain tidal phases, such as around high and low slack tides or one to two hours before or after these phases, the WDR between the South and North Ports may take negative values. For example, during the first ebb tide stage at 00:00, the WDR of the North Port is −53%; during the second ebb tide stage at 12:00, it is −41%; and during the second flood tide stage at 21:00, it is −11%. At other times, the WDR mainly ranges between 10% and 27%.
To explore the hydrodynamic mechanisms and dynamic characteristics of the WDR during these moments, the flow field and cross-sectional flow rates at 00:00 are analyzed as an example. Figure 5 shows the flow field near Huaiankou at 00:00 on 26 May. At this time, the flow pattern at the South and North Ports is complex. The flow rate at the Wenshanli section of the North Port is −475.51 m3/s, with the flow direction towards the downstream Minjiang River estuary. The flow rate at the Kegong section of the South Port is 1371.56 m3/s, with the flow direction towards the upstream Zhuqi. When calculated with Equation (4), the total flow of the South and North Ports is positive, but the flow at the North Port is negative, resulting in a negative WDR for the North Port.
Moments when the WDR becomes negative typically occur during the transition between flooding and ebbing tides at the South and North Ports. This is due to the combined effects of channel morphology, water level changes, and tidal propagation. The flow direction near Kegong in the South Port segment lags behind that in the North Port segment. During this time, the spatial distribution of flow velocity and direction in the South and North Ports differs significantly, resulting in an unstable flow pattern. The flow rates at the Kegong and Wenshanli sections are positive and negative, respectively. As a result, the WDR calculated using Equation (4) becomes negative. Therefore, Equation (5) is used to recalculate the simulation results in order to eliminate the directional effects on the WDR calculation, and these moments are marked with red borders, as shown in Figure 6a. After the revision, the previously negative water diversion ratios at 00:00, 12:00, and 21:00 were adjusted to 26%, 22%, and 9%, respectively. For subsequent data analysis, Equation (5) is used to calculate the WDR for the South and North Ports.
The hourly variations in the WDR of the South and North Ports and the tide level at Kegong during spring and neap tides are shown in Figure 6. During neap tide days (i.e., on 2 June), the WDR of the North Port is relatively low at 02:00 and 06:00, at 3% and 6%, respectively, reaching higher values of 33% and 69% at 07:00 and 19:00. At other times, the WDR fluctuates between 12% and 26%. On spring tide days, the WDR of the North Port gradually decreases during the initial ebb phase as the tide level falls. During the second flood phase, it exhibits a pattern of initially decreasing, subsequently increasing, and then decreasing again. This is likely due to the complex flow dynamics during the transition between flood and ebb tides as described above. In other phases of spring tide days, it generally shows a trend of first increasing and then decreasing.
On neap tide days, the WDR of the North Port exhibits a similar pattern during both the flood and ebb phases, initially increasing and then decreasing. However, during the first flood phase, it also shows the same variation pattern as observed during the second flood phase on spring tide days. In summary, with the variation in the tide level, the WDR of the North Port generally follows a pattern of first increasing and then decreasing, except for certain special moments.
Table 3 presents the average WDR of the North Port during different periods of spring and neap tides in the wet season. The average WDR of the North Port is 19.13% on spring tide days and 20.17% on neap tide days, indicating it is higher during neap tides than spring tides. However, both values are close to 20%, indicating strong agreement between simulation and observed data. This result aligns with previous studies based on hydrological station data and simulation results using the Delft3D model, which indicate that the annual average WDR between the South and North Ports during the wet season in recent years is approximately 4:1 [26,27]. The calculation results further reveal that during the ebb tide phase on neap tide days, the average WDR of the North Port is greater than that on spring tide days. Conversely, during the flooding phase, the WDR is higher on spring tide days than on neap tide days. Regardless of the tidal type, the WDR of the North Port during the ebb tide phase consistently exceeds that during the flooding phase. These patterns are consistent with findings from previous research [27]. Furthermore, the WDR during flood and ebb tidal surges is generally higher than during slack tide moments.

3.2. The Impact of a Diversion Dyke on the WDR

The scenario design in this study is based on the current configuration of the diversion dyke in the lower reach of the Minjiang River. The study simulates the effects of the dyke’s length and rotational angle on the WDR between the South and North Ports. A schematic diagram of the diversion dyke location is shown in Figure 7. Due to space constraints, this analysis focuses on WDR changes over half a tidal cycle during the spring and neap tide in the wet season. The analysis period for the spring tide is from 03:00 to 15:00 on 26 May, while for the neap tide, it covers the same time period on 2 June.

3.2.1. The Variation in Diversion Dyke Length

The length of the diversion dyke at Huaiankou was determined using satellite imagery, revealing an existing length of approximately 110 m. Based on this, six different diversion dyke length conditions were designed (Table 4).
The average WDR of the North Port under different operational conditions is provided in Table 5 and variation is illustrated in Figure 8. From the results, it can be observed that the length of the diversion dyke has a noticeable effect on the WDR of the South and North Ports, with the WDR fluctuating between 18% and 21%. When the dyke length ranges from 50 m to 300 m, the average WDR of the North Port remains relatively stable. However, the WDR starts to increase once the dyke length exceeds 300 m, with a more significant rise observed when the dyke length exceeds 450 m.
To further analyze the effect of dyke length on the WDR, the range of 450 m to 600 m was subdivided. Simulations were conducted for dyke lengths of 500 m and 550 m. The results indicate that the average WDR of the North Port differs by less than 0.02% when comparing dyke lengths of 450 m and 500 m. Similarly, the difference is within 0.04% between dyke lengths of 550 m and 600 m. Despite the small differences overall, the WDR increases most noticeably as the dyke length increases from 500 m to 550 m.
Based on the analysis above, the WDR of the North Port increases as the length of the diversion dyke extends. This finding aligns with the conclusions of Dai et al. [24]. When the dyke length is less than 300 m, its impact on regulating the WDR between the South and North Ports is minimal. However, once the dyke length exceeds 300 m, its effect on flow regulation becomes progressively noticeable. Within the range of 450 m to 600 m, dyke lengths of 500 m and 550 m are critical thresholds that most significantly affect the WDR variation between the South and North Ports.

3.2.2. The Variation in Diversion Dyke Angle

To further investigate the impact of the diversion dyke on the WDR between the South and North Ports, this study simulates scenarios with varying dyke angles (Table 6). Considering that the dyke length has changed over time due to water flow erosion, both the current dyke length of 110 m and the original dyke length of 450 m are included in the analysis. The scenarios assume that the dyke rotates either counterclockwise or clockwise at specific angles from its current position. When the dyke rotates counterclockwise, it gradually becomes perpendicular to the South Port flow, as illustrated in Figure 7.
Based on the simulations of the operating conditions in Table 6, Table 7 presents the calculated average WDR values for the North Port under different diversion dyke angles. The data show that for a dyke length of 110 m, the WDR values for the North Port remain nearly identical across all conditions. Any differences are minimal, within a range of 0.01%, and can be considered negligible. The average WDR of the North Port does not vary with the rotation angle of the diversion dyke. Combined with the simulation results from Section 3.2.1, which demonstrated that WDR values for dyke lengths shorter than 300 m were nearly the same, it can be concluded that the existing diversion dyke at Huaiankou has little to no effect on regulating water flow between the South and North Ports.
As shown in Figure 9, when the dyke length is 450 m, the WDR of the North Port responds more significantly to changes in the rotation angle compared to the scenario with a dyke length of 110 m. Larger rotation angles lead to more pronounced changes in the WDR, consistent with the findings of Yu et al. [28]. When the diversion dyke rotates counterclockwise, its contact with the South Port water flow gradually increases. This intercepts more water from the South Port, resulting in a higher WDR for the North Port. The changes in the WDR for counterclockwise rotations of 10° and 20° are similar. However, at a 30° counterclockwise rotation, the dyke becomes nearly perpendicular to the South Port flow direction, causing a sharp increase in the WDR for the North Port, which exceeds 23%.
Conversely, when the dyke rotates clockwise, its contact with the North Port water flow increases, leading to a continuous decrease in the WDR of the North Port. A 10° clockwise rotation causes only a slight decrease in the North Port’s WDR. As the rotation angle increases to 20°, the reduction becomes more pronounced, reaching a maximum decrease at a 30° clockwise rotation, where the North Port’s WDR drops below 15%.

4. Conclusions

In this study, a two-dimensional hydrodynamic mathematical model for the lower Minjiang River was developed based on measured data and the MIKE 21 hydrodynamic module. It is noteworthy that the current model focuses on hydrodynamic processes at the tidal cycle scale and does not incorporate sediment transport dynamics, which are critical for long-term morphological adjustments and bifurcation ratio evolution. Future research will address this limitation by coupling sediment transport modules to comprehensively analyze the interplay between hydrodynamics, sediment interactions, and channel morphology. The model was utilized to analyze the dynamic variation patterns of the WDR for the South and North Ports during the spring and neap tides of the wet season and to quantitatively evaluate the impacts of diversion dyke configurations on changes in the WDR for the South and North Ports. The main conclusions are as follows:
(1)
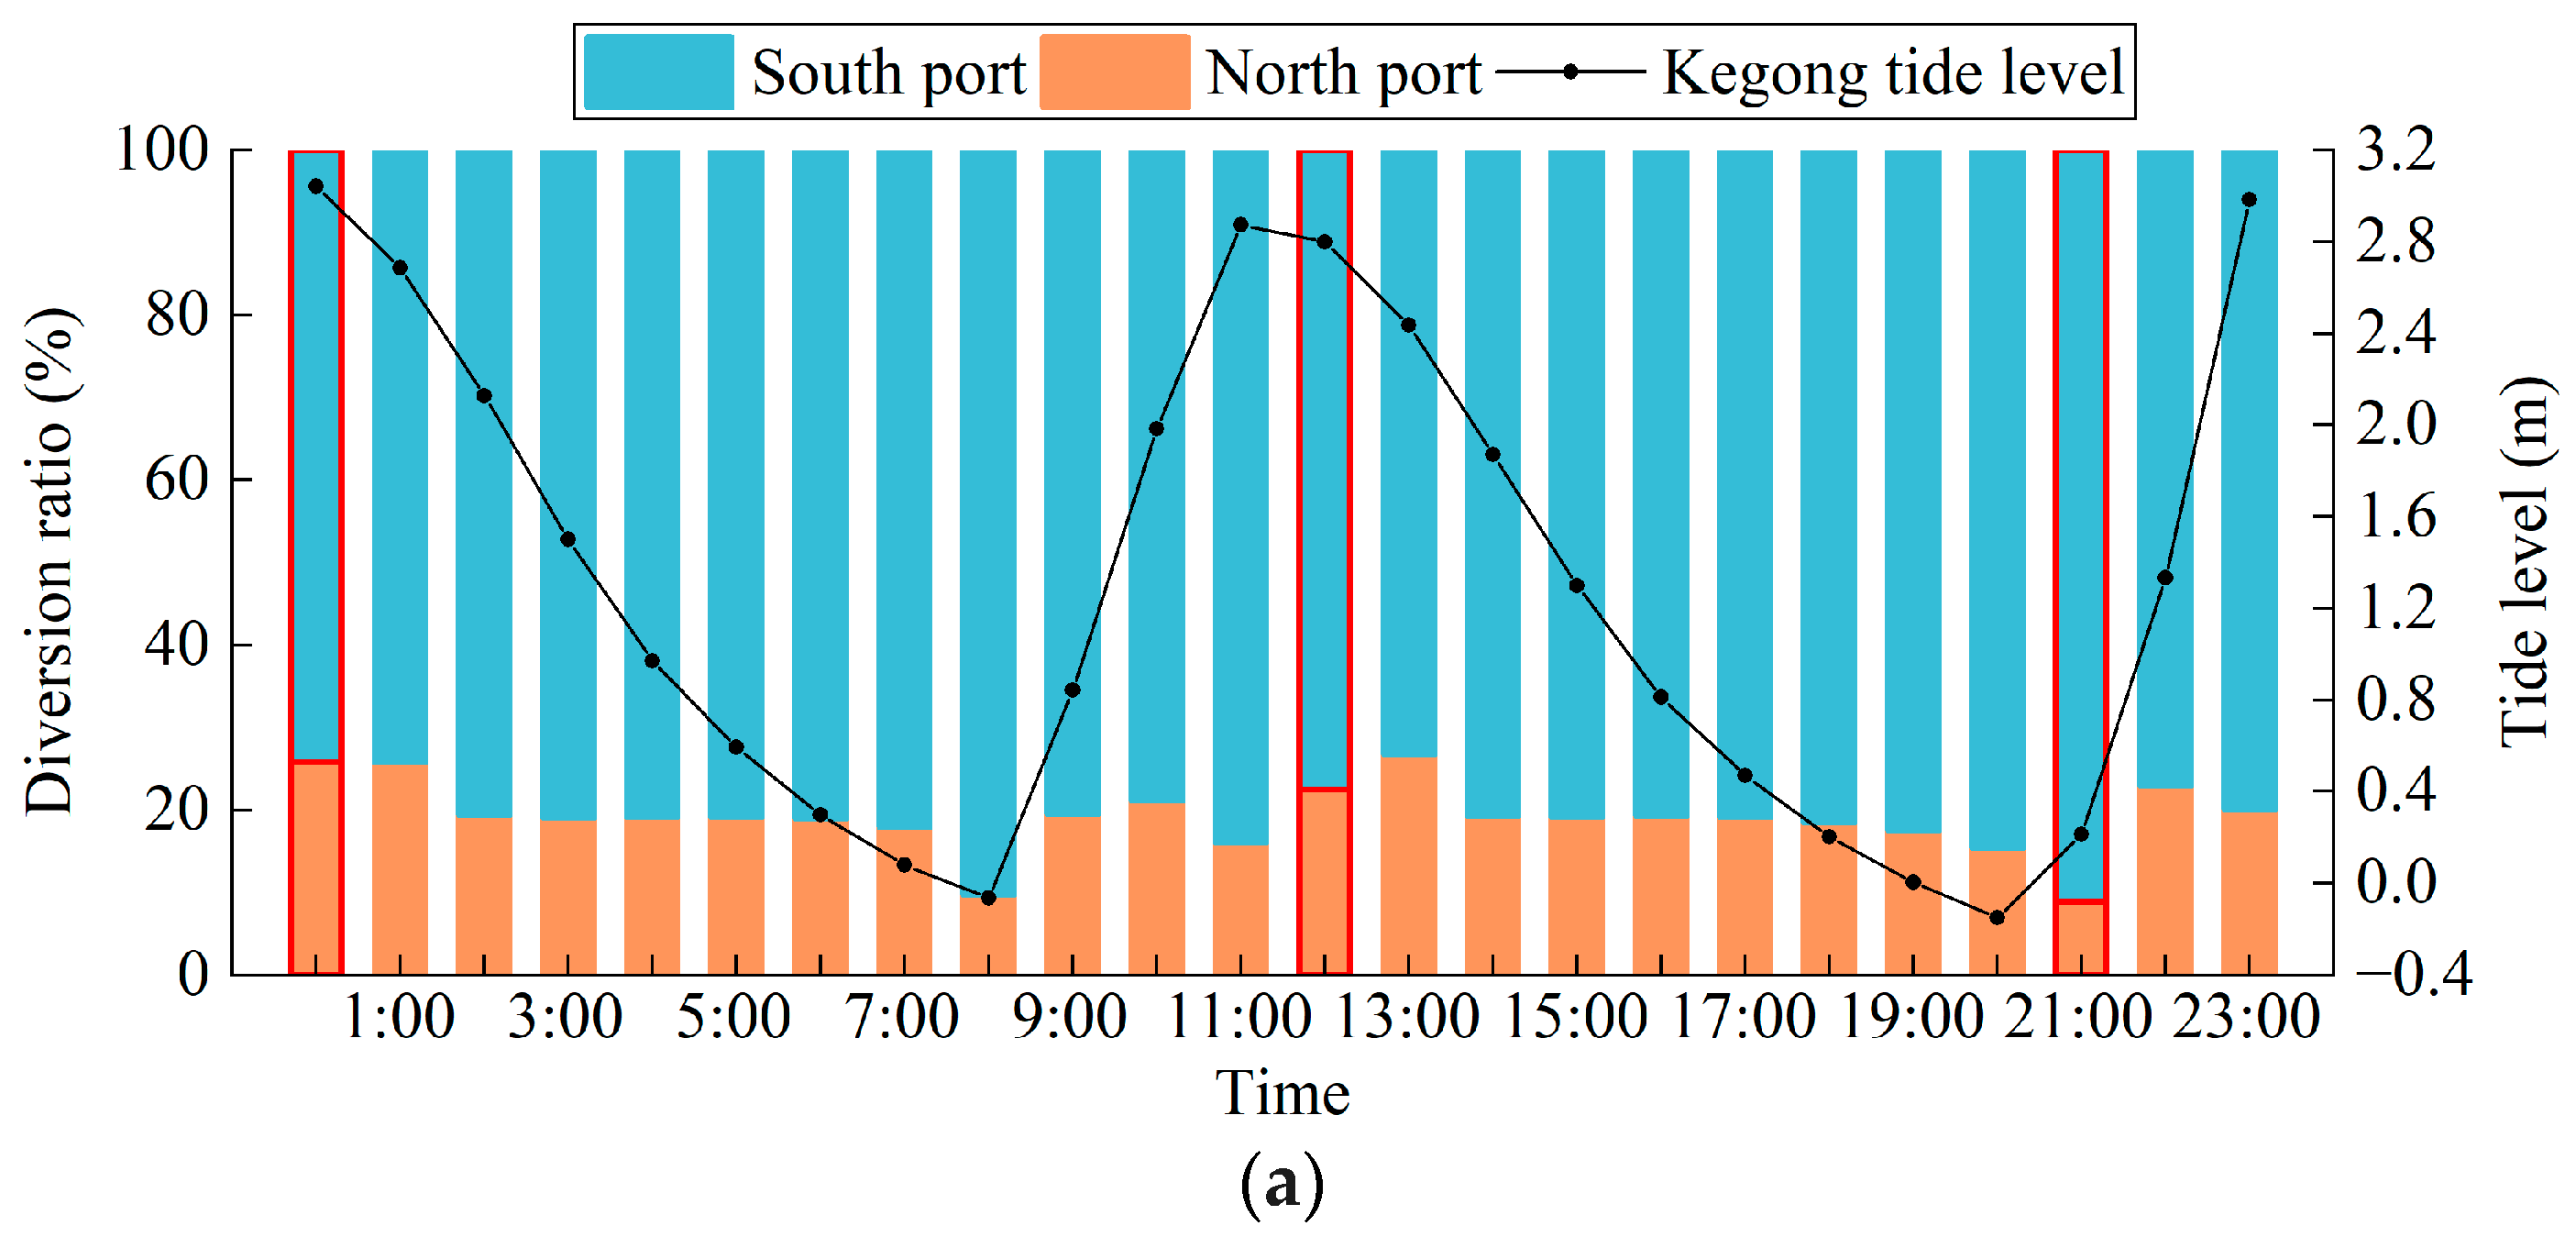
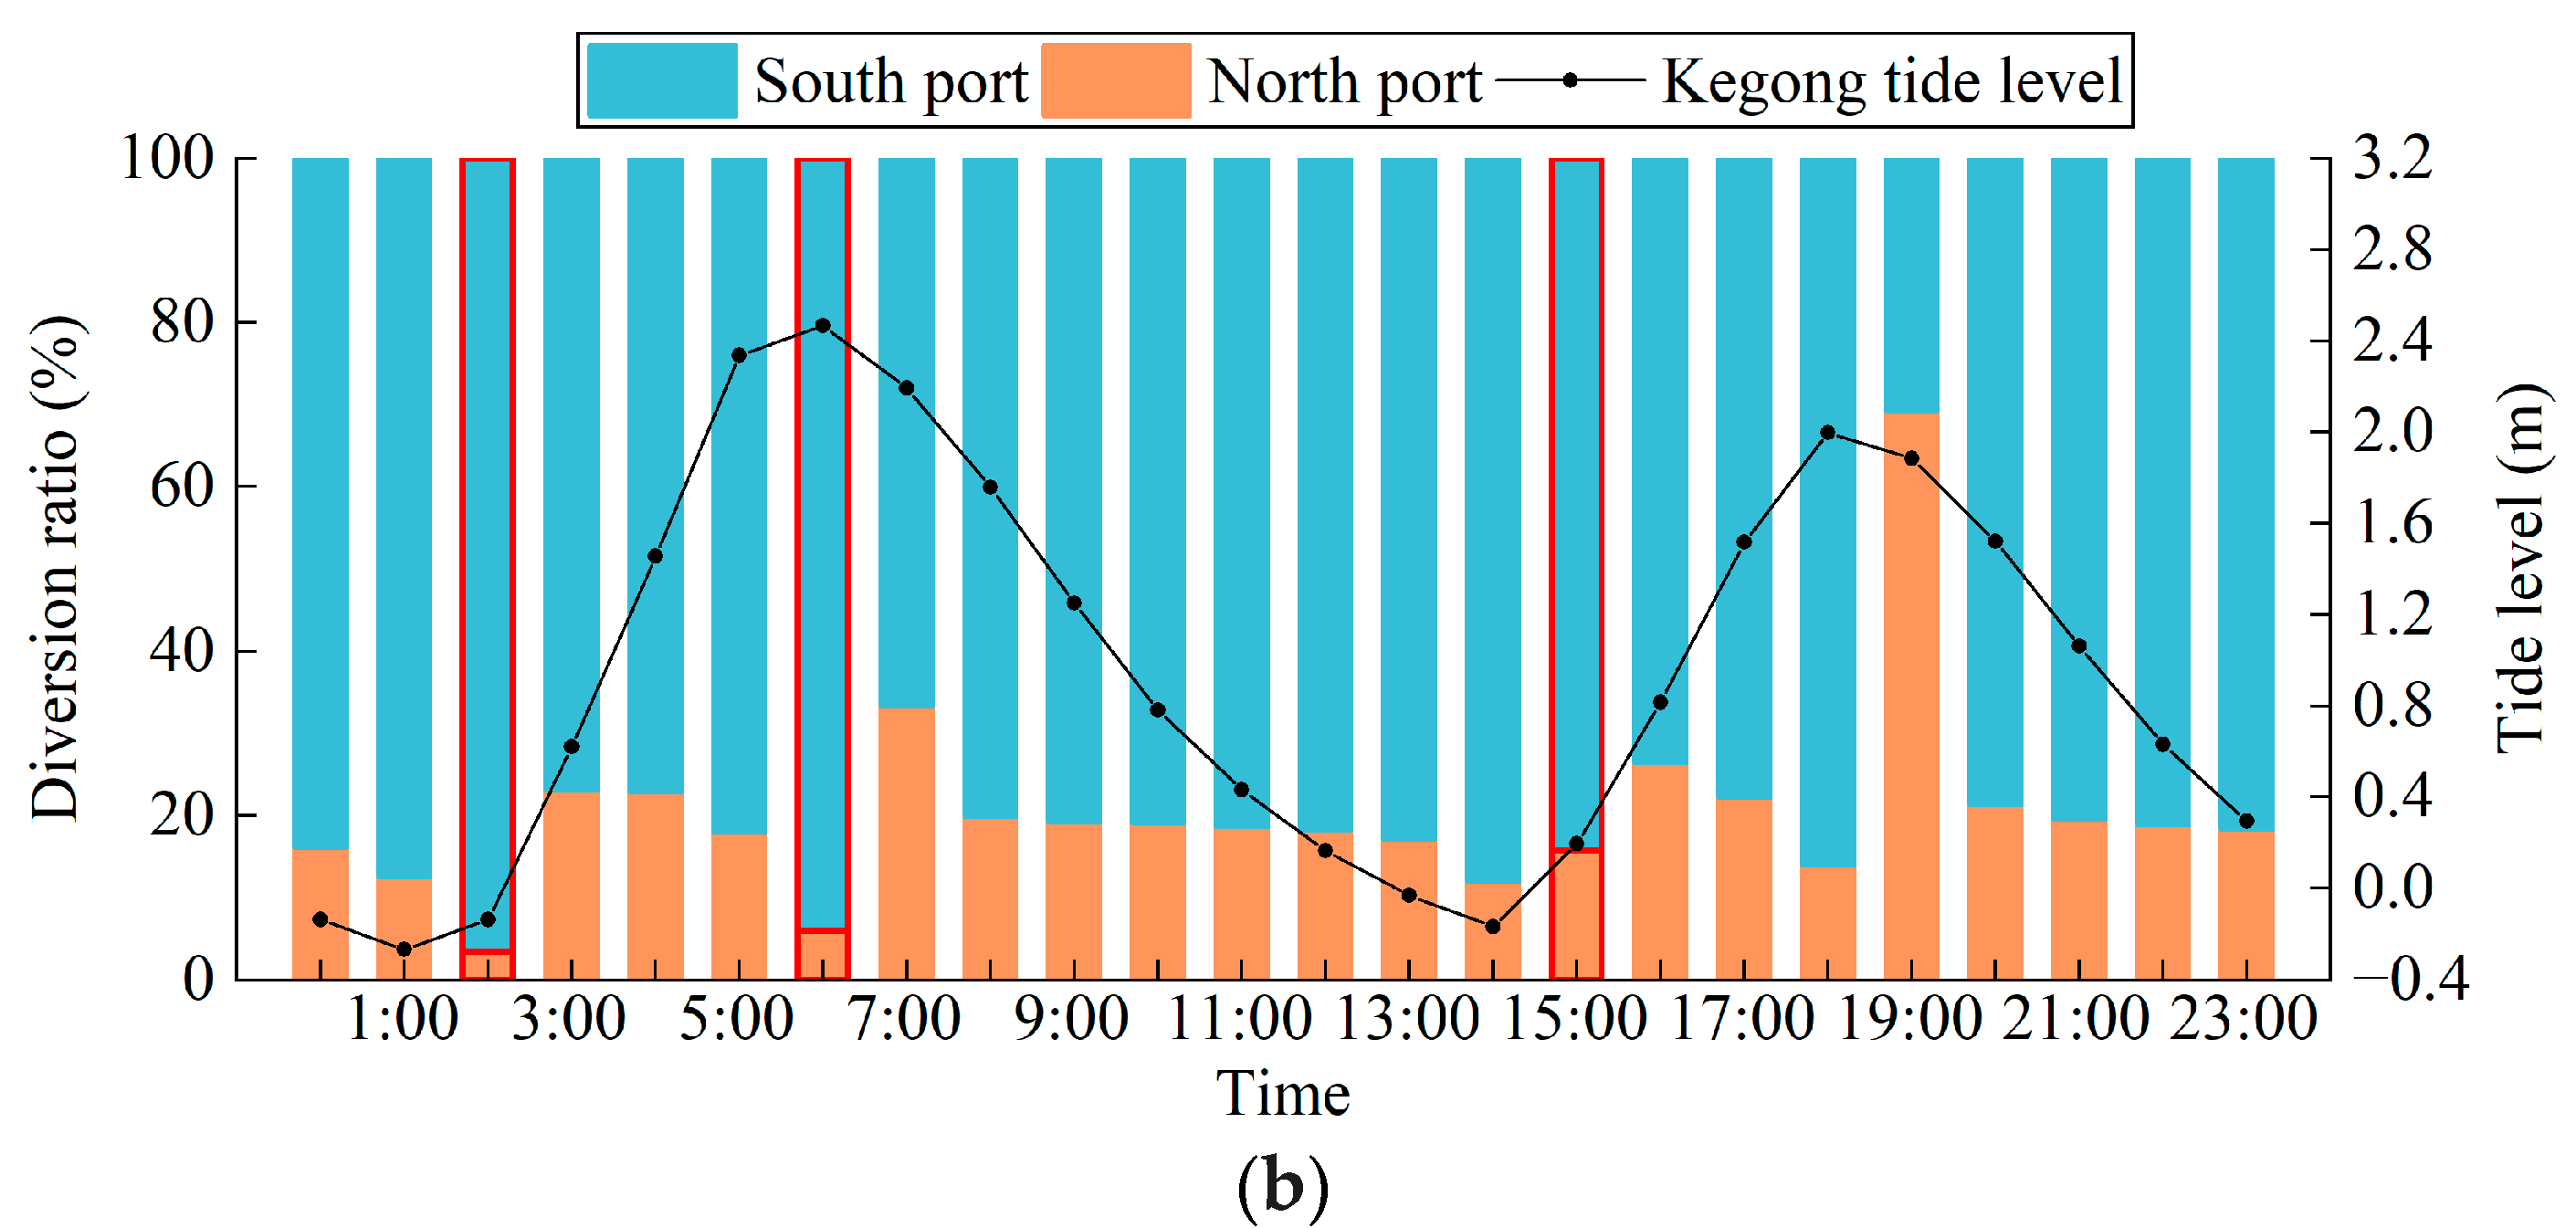
During the wet season, the WDR of the North Port is approximately 20%. The WDR is higher during the ebb phase of the neap tide, but lower during its flood phase compared to the spring tide. Regardless of tidal conditions, the WDR of the North Port is consistently higher during the ebb phase than during the flood phase. Furthermore, the WDR during the flooding and ebbing surge periods is higher than during the slack tide moments. During the flood and ebb phases, the WDR of the North Port generally shows a trend of first increasing and then decreasing as the tide level rises and falls.
(2)
The WDR of the North Port increases as the length of the existing dyke increases. Once the dyke length exceeds approximately 450 m, the WDR begins to increase significantly. Within the range of 450 m to 600 m, the dyke lengths of 500 m and 550 m are the critical values influencing the variation in the WDR for both the South and North Ports.
(3)
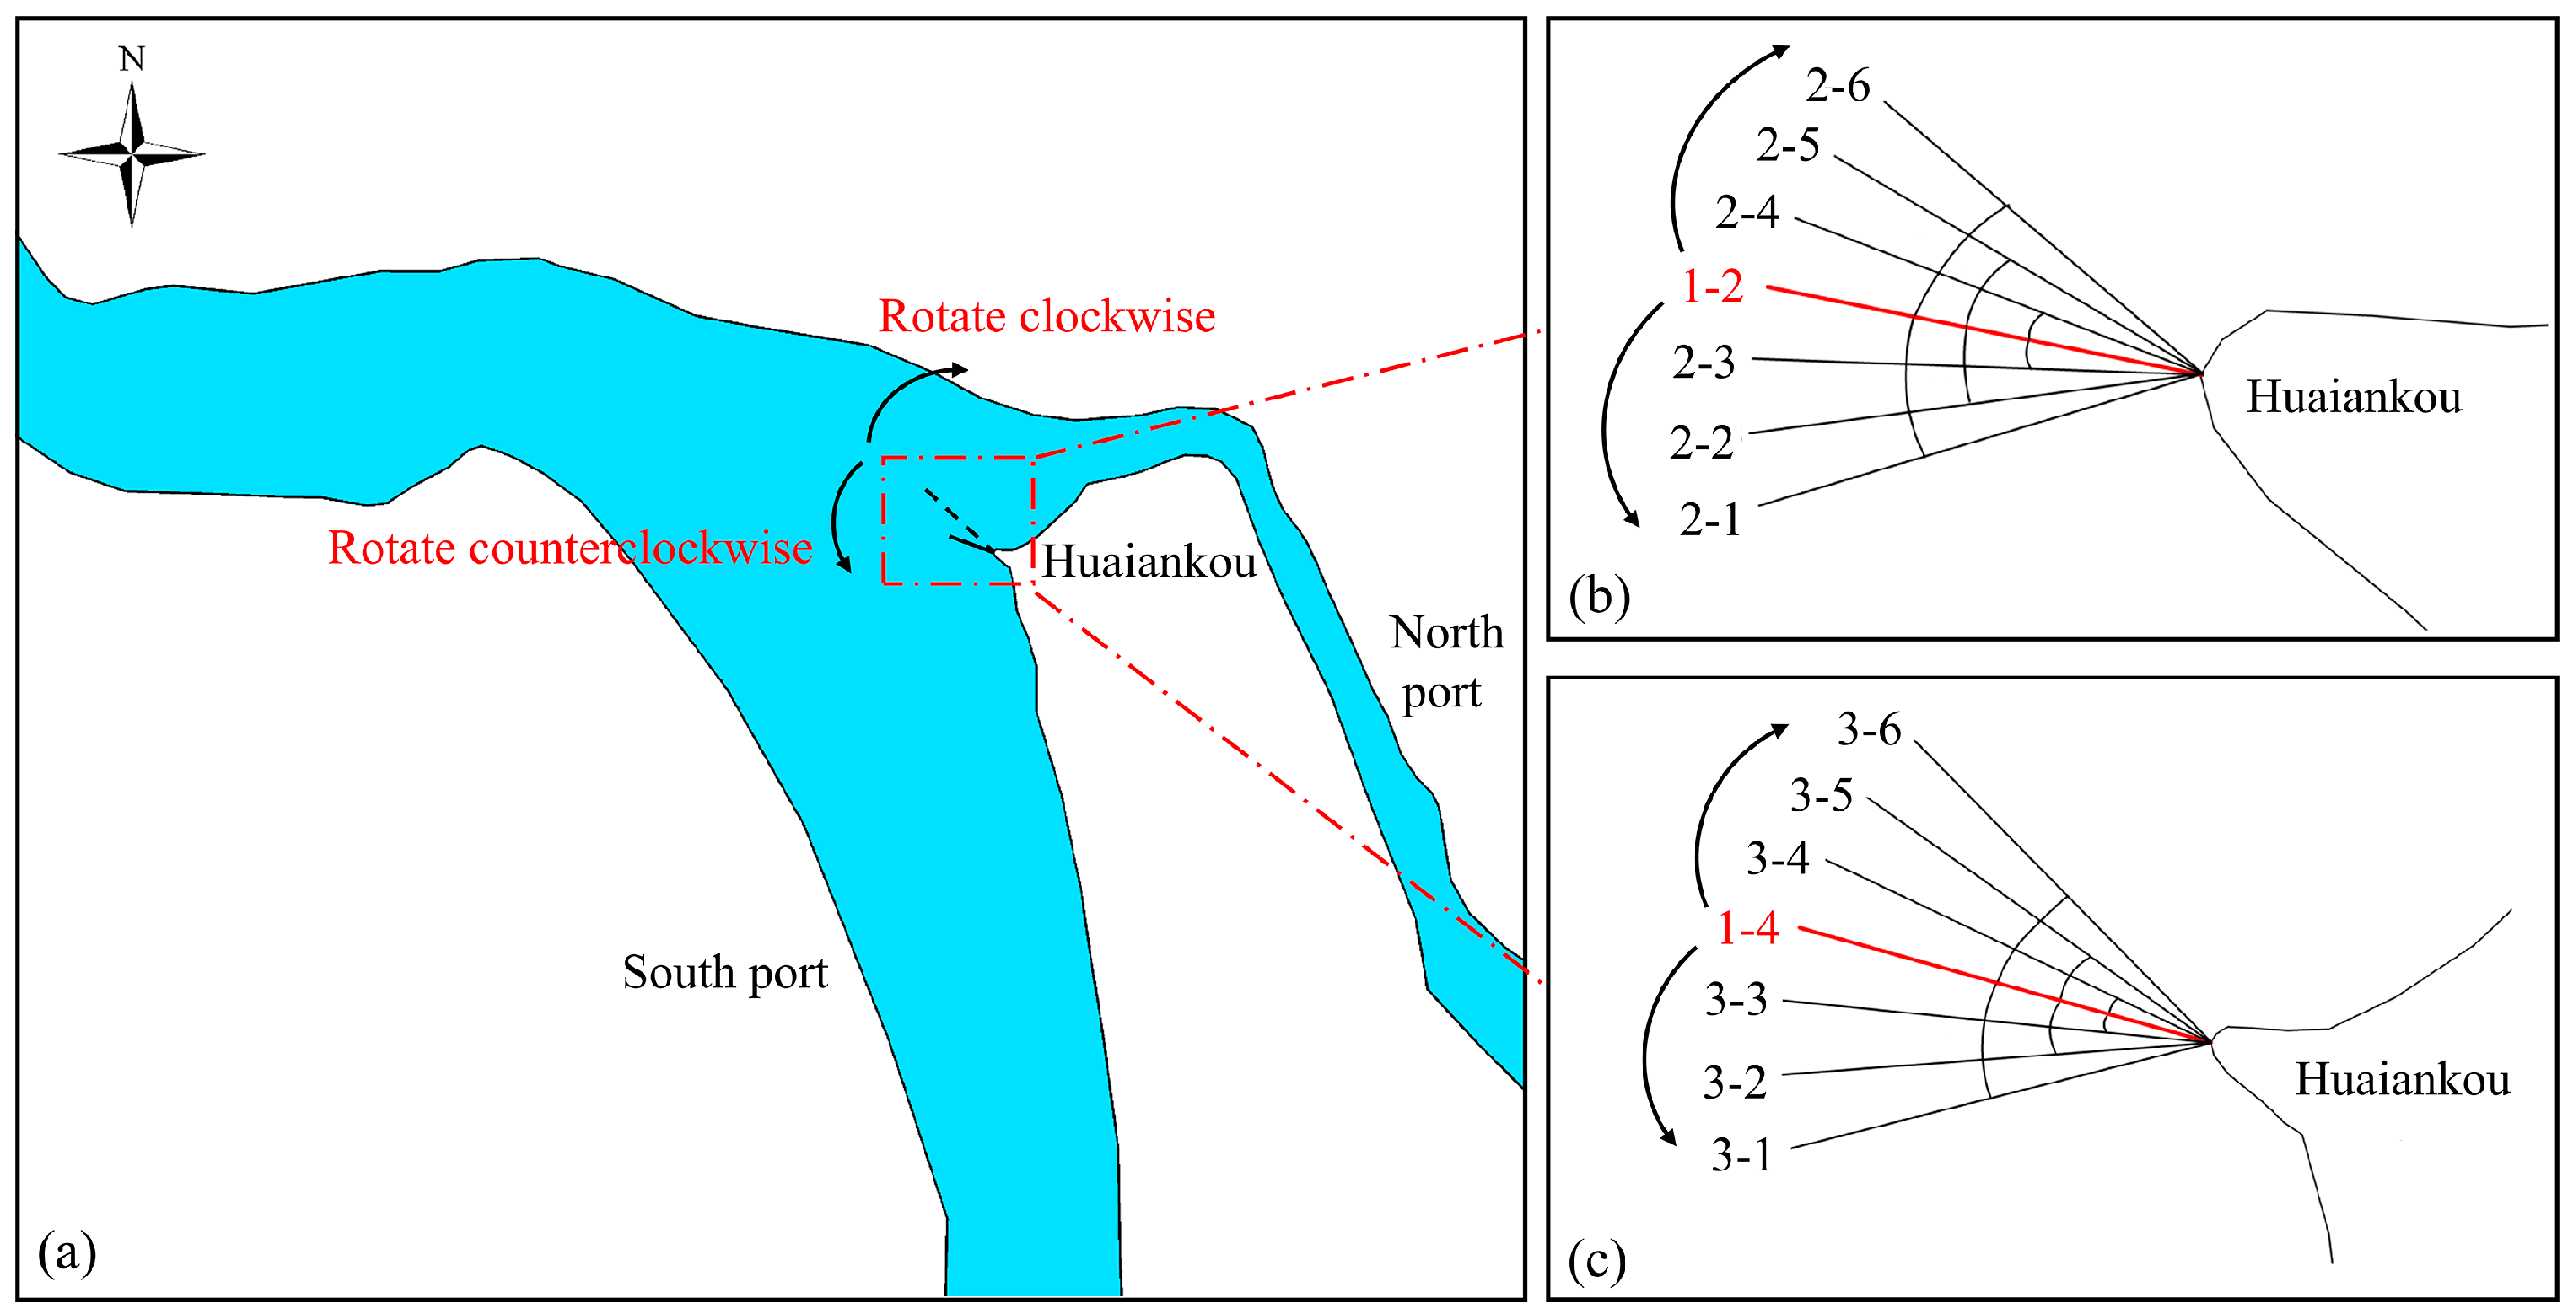
The existing diversion dyke with a length of 110 m has little effect on regulating the water flow between the South and North Port, and changes in the angle of the dyke do not significantly affect the WDR. However, the original diversion dyke with a length of 450 m is more sensitive to angle changes. When the rotation angle reaches 30°, the WDR shows a significant change. The larger the counterclockwise rotation angle of the dyke, the more pronounced the increase in the WDR of the North Port.

Author Contributions

Conceptualization, C.C.; Methodology, C.C. and W.Y.; Software, W.Y.; Validation, H.C.; Formal analysis, H.C.; Investigation, W.Y.; Resources, Z.W. and K.H.; Data curation, K.H.; Writing— original draft, W.Y.; Writing—review & editing, C.C. and F.C.; Visualization, Y.C.; Supervision, C.C., Z.W. and F.C.; Funding acquisition, Z.W. and K.H. All authors have read and agreed to the published version of the manuscript.

Funding

This research is supported by the Transportation Science and Technology Project of Fujian Province (JC202316) and the National Natural Science Foundation of China (U22A20585).

Data Availability Statement

Data will be made available on request.

Conflicts of Interest

Authors Zhihui Wang and Kailong Huangfu were employed by the company Fujian Port & Waterway Investigation and Design Institute Limited. The remaining authors declare that the research was conducted in the absence of any commercial or financial relationships that could be construed as a potential conflict of interest.

References

  1. Chen, Q.; Zhu, J.R.; Lyu, H.H.; Pan, S.Q.; Chen, S.L. Impacts of topography change on saltwater intrusion over the past decade in the Changjiang. Estuar. Coast. Shelf Sci. 2018, 231, 106469. [Google Scholar] [CrossRef]
  2. Hu, P.; Lei, Y.L.; Deng, S.Y.; Cao, Z.X.; Liu, H.H.; He, Z.G. Role of bar-channel interactions in a dominant branch shift: The Taipingkou waterway, Yangtze River, China. River Res. Appl. 2021, 37, 494–508. [Google Scholar] [CrossRef]
  3. Prandle, D.; Lane, A. Sensitivity of estuaries to sea level rise: Vulnerability indices. Estuar. Coast. Shelf Sci. 2015, 160, 60–68. [Google Scholar] [CrossRef]
  4. Ankita, P.; Mery, B. Changes in river bed terrain and its impact on flood propagation—A case study of River Jayanti, West Bengal, India. Geomat. Nat. Hazards Risk 2019, 10, 1928–1947. [Google Scholar] [CrossRef]
  5. Kleinhans, M.G. Sorting out river channel patterns. Prog. Phys. Geogr.-Earth Environ. 2010, 34, 287–326. [Google Scholar] [CrossRef]
  6. Carling, P.; Jansen, J.; Meshkova, L. Multichannel rivers: Their definition and classification. Earth Surf. Process. Landf. 2014, 39, 26–37. [Google Scholar] [CrossRef]
  7. Best, J. Anthropogenic stresses on the world’s big rivers. Nat. Geosci. 2019, 12, 7–21. [Google Scholar] [CrossRef]
  8. Luchi, R.; Zolezzi, G.; Tubino, M. Modelling mid-channel bars in meandering channels. Earth Surf. Process. Landf. 2010, 35, 902–917. [Google Scholar] [CrossRef]
  9. Wang, D.W.; Ma, Y.X.; Liu, X.F.; Huang, H.Q.; Huang, L.; Deng, C.Y. Meandering-anabranching river channel change in response to flow-sediment regulation: Data analysis and model validation. J. Hydrol. 2019, 579, 124209. [Google Scholar] [CrossRef]
  10. Lyu, B.; Li, J.; Hu, P.; Cao, Z.; Liu, H. High-resolution hydro-sediment-morphodynamic modelling of a meandering river reach with mid-channel bars on multiyear timescales: A case study of Shashi Reach in Middle Yangtze River. J. Hydrol. 2024, 635, 131167. [Google Scholar] [CrossRef]
  11. Song, W.W.; Pang, Y. Research on the influence of diversion flow ratio on the water environment in Nanjing. Water Supply 2019, 19, 2367–2378. [Google Scholar] [CrossRef]
  12. Alomari, N.K.; Yusuf, B.; Mohammad, T.A.; Ghazali, A.H. Experimental investigation of scour at a channel junctions of different diversion angles and bed width ratios. Catena 2018, 166, 10–20. [Google Scholar] [CrossRef]
  13. Abdulhafedh, A.Y.; Alomari, N.K.; Al-Janabi, A.M.S. Scour hole reduction at a diversion channel junction using different entrance edge shapes. Int. J. Sediment Res. 2023, 38, 811–820. [Google Scholar] [CrossRef]
  14. Xu, X.S.; Zhou, C.; Tan, Y.S.; Chen, D.B.; Fu, J.; Chai, C.; Liang, L.F. Analyzing the diversion effect of debris flow in cross channels utilizing two-phase flow theory and the principle of energy conservation. Water 2024, 16, 2134. [Google Scholar] [CrossRef]
  15. Zhang, J.H.; Yu, M.H. Experimental study of flood diversion in the middle and lower Han River, China. Can. J. Civ. Eng. 2014, 41, 381–388. [Google Scholar] [CrossRef]
  16. Wang, C.L.; Zhao, Y.; Ning, L.; Bi, J. Permeability Evolution of Coal Subjected to Triaxial Compression Based on In-Situ Nuclear Magnetic Resonance. Int. J. Rock Mech. Min. Sci. 2022, 158, 105213. [Google Scholar] [CrossRef]
  17. Wang, C.L.; Pan, L.H.; Zhao, Y.; Zhang, Y.F.; Shen, W.K. Analysis of the Pressure-Pulse Propagation in Rock: A New Approach to Simultaneously Determine Permeability, Porosity, and Adsorption Capacity. Rock Mech. Rock Eng. 2019, 52, 4301–4317. [Google Scholar] [CrossRef]
  18. Gao, Y.Y.; Yang, H.J.; Wang, L.Z.; Zhao, M. Three-dimensional numerical investigation on flow behaviors around a diversion dike. Phys. Fluids 2022, 34, 125119. [Google Scholar] [CrossRef]
  19. Ranjbar-Zahedani, M.; Keshavarzi, A.; Khabbaz, H.; Ball, J.E. Optimizing flow diversion structure as an effective pier-scour countermeasure. J. Hydraul. Res. 2021, 59, 963–976. [Google Scholar] [CrossRef]
  20. Iqbal, S.; Tanaka, N. An experimental investigation on Dike stabilization against floods. Geosciences 2023, 13, 307. [Google Scholar] [CrossRef]
  21. Nandhini, D.; Murali, K.; Harish, S.; Schüttrumpf, H.; Heins, K.; Gries, T. A state-of-the-art review of normal and extreme flow interaction with spur dikes and its failure mechanism. Phys. Fluids 2024, 36, 051301. [Google Scholar] [CrossRef]
  22. Xie, R.R.; Rao, P.Y.; Pang, Y.; Shi, C.C.; Li, J.B.; Shen, D.D. Salt intrusion alters nitrogen cycling in tidal reaches as determined in field and laboratory investigations. Sci. Total Environ. 2020, 729, 138803. [Google Scholar] [CrossRef] [PubMed]
  23. Xie, R.R.; Pang, Y.; Luo, B.R.; Li, J.B.; Wu, C.S.; Zheng, Y.Y.; Sun, Q.Y.; Zhang, P.; Wang, F.F. Spatiotemporal variability in salinity and hydraulic relationship with salt intrusion in the tidal reaches of the Minjiang River, Fujian province, China. Environ. Sci. Pollut. Res. 2017, 24, 11847–11855. [Google Scholar] [CrossRef]
  24. Dai, W.H.; Wu, S.X.; Zhang, Y.; Tang, H.W. Preliminary studies on improvement measures to the diversion ratio of Nanjing Baguazhou branch. Hydro-Sci. Eng. 2013, 1–7. [Google Scholar] [CrossRef]
  25. Yu, Z.M.; Zou, Q.S.; Chen, Y.Q.; Xu, P.; Wang, L.H. Analysis of the variation characteristics of diversion ratios between the South and North Ports of the Minjiang River during flood and ebb tides. In Proceedings of the 2022 Chinese Hydraulic Engineering Society Academic Conference (Volume 5), Beijing, China, 8 November 2022; Yellow River Water Conservancy Press: Beijing, China, 2022; pp. 224–230. [Google Scholar]
  26. Wu, J. Analysis of the variation characteristics and causes of the diversion ratio of North and South Ports in the Mingjiang River. Hydraul. Sci. Technol. 2024, 16–21. [Google Scholar]
  27. Chen, B.Y. Application of the Delft3D 2D hydrodynamic model in the study of tidal range, water levels, and diversion ratio of North and South Ports in the lower reaches of the Mingjiang River. Hydraul. Sci. Technol. 2020, 28–33. [Google Scholar]
  28. Yu, P.P.; Tang, H.W.; Xiao, Y.; Fu, H.; Chen, J.M.; Liang, D.F. Effects of a diversion dyke on river flow: A case study. Proc. Inst. Civ. Eng.-Water Manag. 2015, 168, 210–219. [Google Scholar] [CrossRef]
Figure 1. Schematic map of the study area and monitoring stations.
Water 17 01183 g001
Figure 2. Validation of water levels at monitoring stations. (a) Jinzhongge. (b) Kegong. (c) Maweiqingzhou.
Water 17 01183 g002aWater 17 01183 g002b
Figure 3. Validation of flow velocity and direction (flow direction is defined with 0° as true north and increases clockwise). (a,b) Guanyinqi monitoring station. (c,d) Wenshanli monitoring station. (e,f) Baiyantan monitoring station.
Water 17 01183 g003
Figure 4. Hourly WDR of the South and North Ports during spring tides in the wet season calculated using Equation (4).
Water 17 01183 g004
Figure 5. Flow field distribution near Huaiankou at 0:00 on 26 May.
Water 17 01183 g005
Figure 6. Hourly WDR of the South and North Ports during spring and neap tides in the wet season calculated using Equation (5). (a) Spring tide. (b) Neap tide.
Water 17 01183 g006aWater 17 01183 g006b
Figure 7. Schematic diagram of diversion dyke operational conditions. (a) Schematic diagram of diversion dyke locations. (b) Rotation angle scenarios for the 110 m-long diversion dyke. (c) Rotation angle scenarios for the 450 m-long diversion dyke.
Water 17 01183 g007
Figure 8. Variation in the average WDR of the North Port with different dyke lengths.
Water 17 01183 g008
Figure 9. Variation in the average WDR of the North Port with different rotation angles.
Water 17 01183 g009
Table 1. Model boundary conditions.
Boundary TypeLocation DescriptionParameter Settings
Upstream BoundaryShuikoubaxia projectDischarge of 1108.92 m3/s, measured at Zhuqi Station during the 2017 wet season.
Downstream BoundaryMinjiang River estuaryDefined by hourly tidal levels at the Minjiang River estuary, simulated using the MIKE 21 tidal prediction function.
Closed
Boundaries
Levees on both sides and land boundaries of river isletsImpermeable boundary.
Dynamic BoundaryWetting and drying boundaries across the entire domainDrying depth = 0.005 m; flooding depth = 0.05 m; wetting depth = 0.1 m.
Table 2. The comparison between the simulated and observed values of water level.
Monitoring StationsMean Absolute Error (MAE)Mean Squared Error (MSE)
Jinzhongge0.37 m0.20
Kegong0.44 m0.26
Maweiqingzhou0.61 m0.57
Table 3. Average WDR of the North Port during different periods of spring and neap tides in the wet season.
Spring TideNeap Tide
Over the entire day19.13%Over the entire day20.17%
Ebb tide stage19.32%Ebb tide stage20.76%
Flood tide stage16.63%Flood tide stage16.00%
Ebbing tide (4:00, 15:00)19.00%Ebbing tide (10:00, 21:00)19.50%
Low slack tide (8:00, 20:00)12.50%Low slack tide (1:00, 14:00)12.50%
Flooding tide (9:00, 22:00)21.00%Flooding tide (4:00, 16:00)24.50%
High slack tide (0:00, 11:00)21.00%High slack tide (6:00, 18:00)10.00%
Table 4. Operating conditions for diversion dyke length.
Operational Condition Number1-11-21-31-41-51-61-7
Diversion dyke length/m50110300450500550600
Table 5. Average WDR of the North Port for different dyke lengths.
Simulation TimeDiversion Dyke Length/m
50110300450500550600
Spring tide19.10%19.10%19.16%19.67%19.68%20.72%20.76%
Neap tide18.74%18.74%18.71%18.99%19.01%19.40%19.41%
Table 6. Operating conditions for diversion dyke angles (negative sign indicates counterclockwise rotation, while positive sign indicates clockwise rotation).
Operating Condition Number for the Dyke Length of 110 mOperating Condition Number for the Dyke Length of 450 mOperating Condition Description
2-13-1−30°
2-23-2−20°
2-33-3−10°
1-21-4
2-43-4+10°
2-53-5+20°
2-63-6+30°
Table 7. Average WDR of the North Port for different dyke angles.
Diversion Dyke Length/mSimulation TimeRotation Angle of the Diversion Dyke
−30°−20°−10°+10°+20°+30°
110Spring tide19.10%19.09%19.09%19.10%19.09%19.09%19.09%
Neap tide18.74%18.74%18.74%18.74%18.74%18.74%18.74%
450Spring tide24.98%21.52%20.42%19.67%19.25%17.55%14.18%
Neap tide23.60%19.58%19.26%18.99%18.76%17.35%13.98%
Disclaimer/Publisher’s Note: The statements, opinions and data contained in all publications are solely those of the individual author(s) and contributor(s) and not of MDPI and/or the editor(s). MDPI and/or the editor(s) disclaim responsibility for any injury to people or property resulting from any ideas, methods, instructions or products referred to in the content.

