Systematic Review

Advanced Analytical Approaches for Phenolic Compounds in Groundwater: A PRISMA Systematic Review

by
Giancarla Viviana Santa-Cruz-Mérida
1,
Juliana Ikebe Otomo
1,
Diego Ricardo Araoz-Prado
2,
Elaine Aparecida Rodrigues
1,3,*,
Delvonei Alves de Andrade
1 and
Oscar Vega Bustillos
1
1
Nuclear and Energy Research Institute IPEN-CNEN, Av. Prof. Lineu Prestes, 2242 Butantã, São Paulo 05508-000, Brazil
2
Independent Researcher, São Paulo 04153-040, Brazil
3
Environmental Research Institute IPA, Av. Professor Frederico Hermann Junior, 345, São Paulo 05259-900, Brazil
*
Author to whom correspondence should be addressed.
Water 2025, 17(8), 1173; https://doi.org/10.3390/w17081173
Submission received: 7 March 2025 / Revised: 11 April 2025 / Accepted: 11 April 2025 / Published: 14 April 2025
(This article belongs to the Special Issue Groundwater Quality and Contamination at Regional Scales)

Abstract

:
Groundwater is of vital significance to achieve the 2030 Agenda and its Sustainable Development Goals (SDGs); nevertheless, it remains vulnerable to contamination from phenolic compounds. This systematic review critically evaluates the chromatographic and spectrometric techniques applied in real-case groundwater contamination studies involving phenolic compounds. It highlights advances, limitations, and research gaps. A comprehensive research strategy retrieved a total of 345 publications from the Scopus and Web of Science databases, of which 52 (from the years 1984 to 2023) met the PRISMA criteria. The review identified 107 phenolic compounds across 25 countries. Temporal and spatial analyses, source identification, and pollutant profiles were systematically assessed per country. The study also mapped priority (n = 11) and hazardous (n = 27) phenolic compounds according to the USEPA, comparing their detectability across analytical methods. The most frequently applied techniques were LC-MS and LC-MS/MS, while GC-MS demonstrated competitive performance when combined with derivatization. The study found that contamination was predominantly reported in the Global North, with industrial and domestic sewage being the main sources. The highest concentrations reported were 40 × 106 ng/L for 4-methylphenol and 50 × 106 ng/L for phenol, both of which are hazardous substances typically linked to industrial/domestic effluents and the use of pesticides. These findings highlight the imperative for regulatory measures and international scientific collaboration to enhance groundwater monitoring, particularly in the Global South, where data scarcity persists.

1. Introduction

The 2030 Agenda was adopted in 2015 by the United Nations (UN). It is an action plan consisting of 17 Sustainable Development Goals (SDGs), as a roadmap for people to have peace and prosperity, to end poverty, and to protect the planet [1]. Although universal access to sanitation and clean water is one of the goals of the 2030 Agenda (SDG 6) [1,2], the complexity of its implementation poses a significant barrier to achieving sustainable development [3,4,5]. Countries, regions, and cities experiencing rapid economic development are primarily responsible for the increase in water demand [6]. Currently, around half of the world’s population experiences severe water shortages for at least part of the year [7].
Water shortages are affected by hydro-climatic conditions, socioeconomic factors, government policies, and an increase in human demand for the resource [3,8]. Most of this increase occurs in cities, countries, and regions experiencing rapid economic development, especially in emerging economies [6]. Groundwater represents approximately 99% of all liquid freshwater on the planet and plays an essential role in supplying human consumption, agricultural irrigation, and industrial processes [6,9]. Groundwater is responsible for supplying around 25% of all water used for irrigation and half of the freshwater used for domestic purposes [9]; it is also particularly important in arid and semi-arid regions where surface water is limited [10].
With 58.3% of the world’s population living in urban areas (4.77 billion people) [11], it is estimated that half of them are supplied by groundwater [9]. Aquifer systems play a fundamental role in combating poverty and in socioeconomic development, as well as being essential for strengthening socio-environmental resilience in the face of climate change [9,12]. Although groundwater has some relative geological protection, its contamination can be difficult to reverse and results in significant socio-environmental impacts and risks to public health [9,10,12,13]. Among the main environmental pollutants and sources of water contamination, phenolic compounds stand out, with more than 60 different phenols already identified and quantified in aqueous matrices around the world [14].
These compounds are common substances in nature from the metabolism of plants; their chemical structure has a specific characteristic, which comprises an aromatic ring with one or more hydroxyl substituents [15]. The replacement of the hydrogen of the aromatic ring with a halogen functional group, alkyl, phenyl, and benzyl, among others, gives rise to a vast group of phenolic compounds [16]. For example, nitrophenols, which are present in the atmosphere due to the gases generated by burning fuel in vehicles, and chlorophenols, which are used in disinfectants, antiseptics, and various household products [17].
Phenolic compounds are also widely synthesized in the industry for coal conversion, phenolic resin, the coke oven, petrochemicals, textiles, leather, fiberglass, paint, the paper industry, adhesives, pharmaceuticals, soap, paper, and wood preservatives [17,18,19]. Sources of contamination include but are not limited to industrial effluents, landfill leaching, agricultural runoff, and wastewater discharges [19,20]. In addition, pesticides and herbicides derived from phenols pose additional risks to the contamination of aquatic ecosystems [19].
The toxicity of these compounds is widely documented, and they are classified as priority pollutants due to their association with endocrine disorders, damage to the central nervous system, circulatory system failures and carcinogenic potential, in addition to being biologically accumulated in organisms through the food chain [14,18,20,21,22]. In contact with water, these compounds are transformed into new fractions that can pose even more risks than their original molecules [19].
Detecting phenolic compounds in groundwater is challenging due to the large number of known and unknown compounds and their varied physicochemical characteristics, which include low volatility, high polarity, and high solubility in water [14,23]. Phenols have very low concentrations and are affected by factors such as dilution by flow with other sources, seasonal climatic variations, pH, chemical–physical changes in general, and sediment resuspension [14].
Conventional and emerging methods for their detection and quantification have been reviewed in the literature and include hyphenated techniques developed from the coupling of two or more analytical techniques, for example, gas chromatography–mass spectrometry (GC-MS), high-performance liquid chromatography–tandem mass spectrometry (HPLC-MS/MS), inductively coupled plasma mass spectrometry (ICP-MS), and time-of-flight mass spectrometry (TOF-MS) [14,19,22,24]. Generally, the first analytical technique separates or increases the resolution, and the second technique characterizes the sample [24].
Although the academic production on advanced analytical techniques is diverse, the contamination of groundwater matrices by phenolic compounds is complex and involves the hydrogeological conditions of the aquifer and the diversity of degradation sources.
This varied production also highlights the need for a synthesis of knowledge applied to real groundwater samples since the lack of a systematic review comparing the efficiency and suitability of the techniques can compromise the recognition of the best approach for real phenolic compound contamination scenarios.
Thus, the study aims to conduct a Systematic Literature Review, following the Preferred Reporting Items for Systematic Review and Meta-Analyses (PRISMA) protocol [25], to investigate chromatographic and spectrometric techniques applied in real cases of groundwater contamination by phenolic compounds. The adoption of the PRISMA protocol enabled a careful and comparative evaluation of the available methods to contribute to the selection of the most effective approaches for monitoring and remediating this problem.

2. Materials and Methods

The review has been carried out following the Preferred Reporting Items for Systematic Reviews and Meta-Analyses (PRISMA 2020) guidelines. The literature search was initially conducted in October and November 2024 and subsequently updated in March 2025. The objective of the study is to identify, categorize, and compare the analytical approaches used to detect phenolic compounds in groundwater. Considering it is a systematic review, this study relies entirely on secondary data extracted from peer-reviewed publications.

2.1. Eligibility Criteria

The PRISMA protocol was followed to reduce bias and ensure the quality of the work [25,26,27]. The Population, Interest and Context (PI-Co) mnemonic was used to formulate the research question; this mnemonic is normally used to develop Systematic Literature Review (SLR) questions based on qualitative review or synthesis [28]. Thus, the following were defined: population—groundwater contaminated by phenolic compounds; interest—use of chromatographic and spectrometric analytical techniques for identification and quantification; context—detection of phenolic contaminants in environmental samples, with a focus on real groundwater. Based on this, general research questions were structured for the study: (1) What chromatographic and spectrometric techniques have been used to analyze phenolic compounds in real groundwater? (2) In which location was the study carried out, and what is the environmental context of the site? (3) What are the main limitations and advances of the techniques used?
Studies using chromatography and spectrometry techniques to analyze phenolic contaminants in real groundwater were included. The articles selected for this review were published in any period if they were available in their full version in one of the languages of technical mastery of the research team (English, Portuguese, or Spanish). The exclusion criteria for the studies were as follows: (1) object of study other than groundwater and/or phenols and their compounds; (2) simulated scenarios or synthetic groundwater; (3) studies that did not use spectrometry and chromatography techniques to analyze phenols; (4) no specification of the study site; (5) identification of phenolic compounds without their proper quantification.

2.2. Information Sources

The Web of Science (WoS) and Scopus repositories were selected as the preferred databases for collecting articles for this research. Created in 1964, WoS is the oldest database, with coverage in 2020 of around 75 million academic data points, more than 1.5 billion references cited in 254 disciplines [29], and coverage of around 34,000 journals [30]. Although each database presents at least some set of journals covered exclusively, this number is small for WoS [29], which also presents a low proportion of absence of highly cited documents [31]. Given the relevance to science of local and regional journals that address social needs, in 2015, WoS deepened its reach, maintaining a balance between subjects and regions [30].
Scopus was launched in 2004 by Elsevier as a database of abstracts and citations with peer-reviewed scientific content that has more than 77.8 million records [29,32]. Scopus is among the largest curated bibliographic databases, whose indexed material is selected through a process of content screening followed by continuous re-evaluation [29,32]. With more than 23,000 active journal titles, Scopus indexes 66.07% more unique journals compared to WoS [29].
Although sources such as Google Scholar, Dimensions, and Microsoft Scholar can be considered more comprehensive, their search functionalities have several limitations that make complex Boolean searches in their web interface and metadata export difficult [33]. From this perspective, WoS and Scopus remain the main sources of publication metadata and impact indicators [34,35]. As extracting data from different databases can produce different results due to the varying coverage of journals in the two sources [29], to obtain a more representative sample, both WoS and Scopus were selected as the primary sources for the studies.

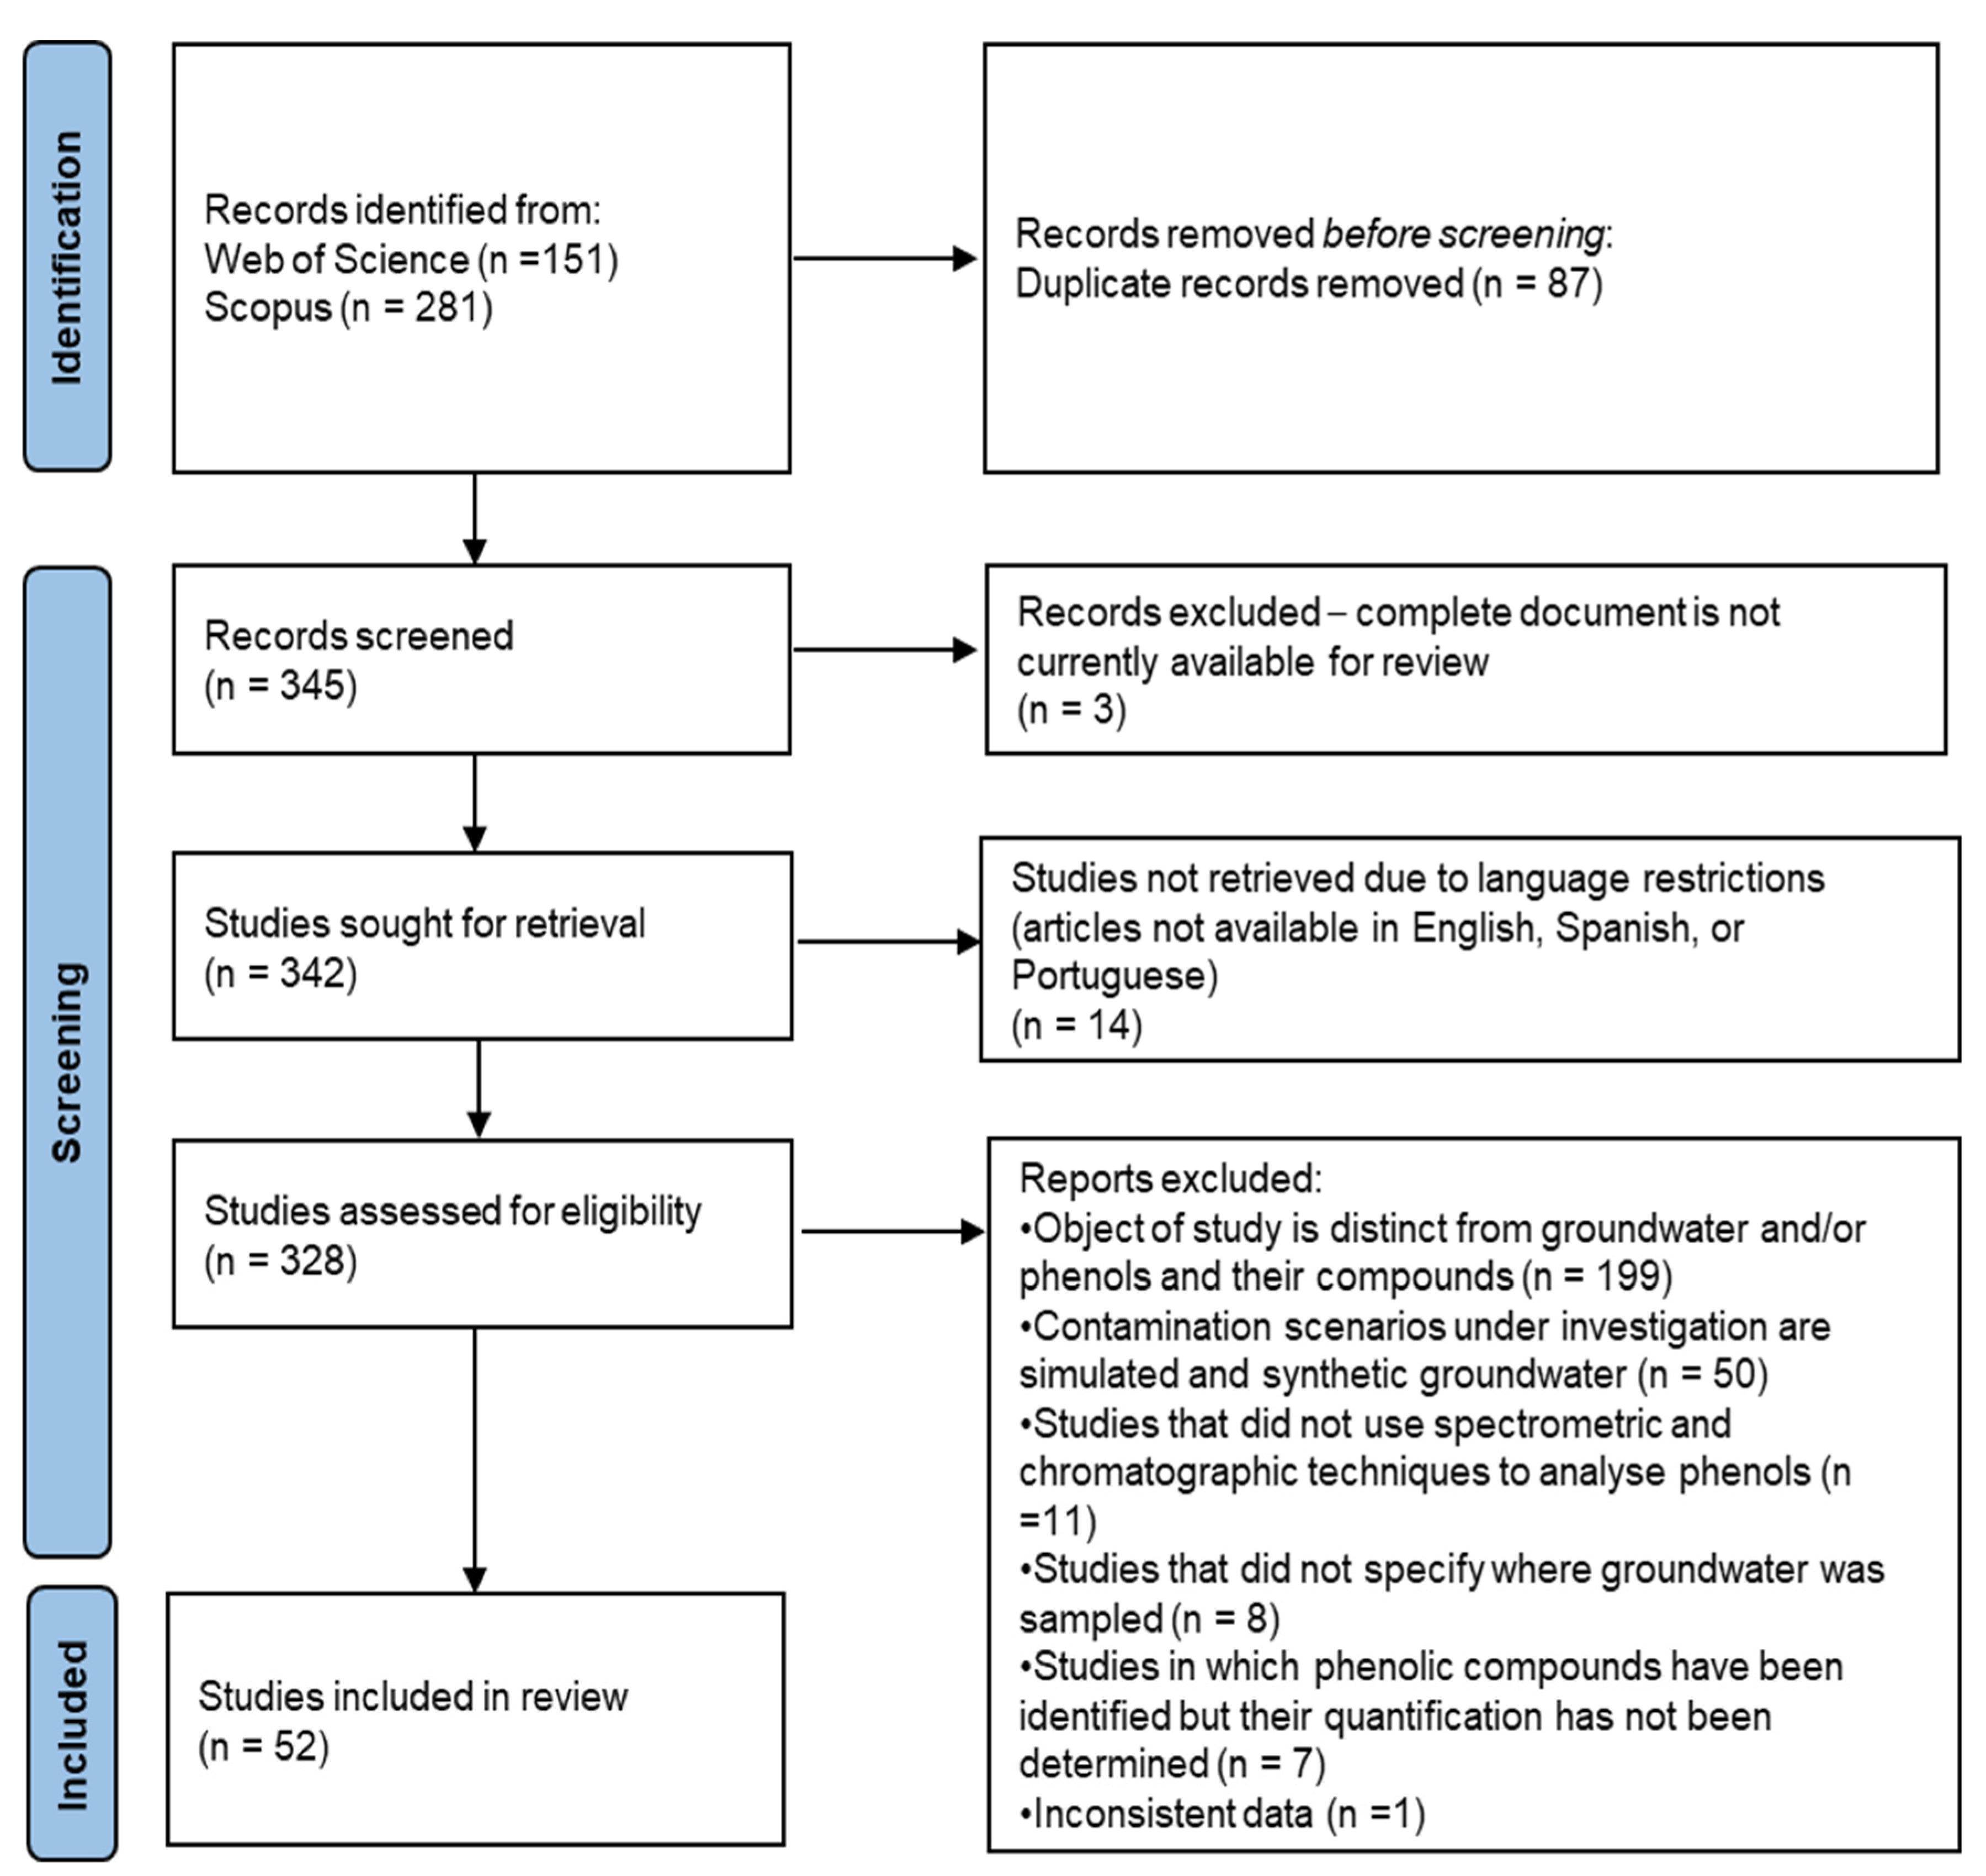
2.3. Search and Selection Strategies

A comprehensive search was carried out, with no restrictions on period or language, using a combination of descriptors and the Boolean operators “AND” and “OR”, with the application of the operator (*) to capture variations of the words; the search string used is shown in Box 1. In the WoS database, the search was conducted on 24 October 2024, while for the Scopus database, the search was conducted on 5 November 2024. The searches in the databases were updated on 14 March 2025. In both databases, the search was carried out with institutional registration and access by the University of São Paulo.
Box 1. Search string used in the scientific databases Web of Science and Scopus on 24 October and 5 November 2024, respectively.
WoS(“phenol*”) (Topic) and (“ groundwater*” or “ ground water*” or “subsurface water*” or “Underground water*”) (Topic) and (“spectrometry” OR “chromatography”) (Topic)
Scopus(TITLE-ABS-KEY ((“phenol*”)) AND TITLE-ABS-KEY ((“groundwater*” OR “ground water*” OR “subsurface water*” OR “Underground water*”)) AND TITLE-ABS-KEY ((“spectrometry” OR “chromatography”)))
The search identified 151 records in WoS and 281 in Scopus published between 1968 and 2025. The results were saved in lists in the respective databases, exported as a file with a <Tab delimited file> “TXT” structure for WoS and “CVC” format for Scopus. The main data (index base, authors, year, article title, source title, language, document type and DOI) were converted and organized in a Microsoft Excel spreadsheet, with an identifier number for each record. Two variables were added for validation: “evaluation”, with the values <included/excluded>, and “exclusion criteria”, with the values <study objective other than groundwater or phenols/simulated scenarios or synthetic waters/study site not identified/full document not located/unavailable in English-Portuguese-Spanish/does not use spectrometry-chromatography/duplicate study> (Figure 1).
All 432 records retrieved were accessed to identify the complete studies in English, Portuguese, or Spanish. In this evaluation, 87 duplicate records were excluded, leaving a total of 345 studies for analysis of their convergence with the research topic and eligibility concerning the established criteria.
The studies were analyzed in their entirety. This analysis was carried out independently by two researchers to reduce individual bias and increase the reliability of the review. All the analyses were validated and certified by a third researcher with more experience in the field. After evaluation, of the 345 articles analyzed, 52 remained for technical review: 23 from Scopus only, 8 from WoS only, and 21 studies indexed in both databases (Table S1—Supplementary Material).

2.4. Data Extraction, Evaluation and Synthesis

The WoS and Scopus databases were reassessed. The lists of studies initially retrieved from the two databases were edited to keep only the studies selected as eligible. The complete metadata from each database was exported and converted into “XLS” format files. These two files were merged into a single database, with normalization of the equivalent categories, and exported into “TXT” and “XLS” formats.
Data extraction was conducted systematically, using a standardized matrix for collection [36]. The matrix was structured into categories related to the following: (i) bibliographic information (title, authors, year of publication); (ii) study objectives; (iii) sample characteristics (type and specificity of groundwater; socioeconomic distribution (Global North and South); environmental context; type of contamination); (iv) analytical methods and techniques employed (experimental conditions, detection limits and instrumentation); (v) results and main findings (concentration and types of phenolic compounds, performance of analytical techniques and practical relevance); (vi) quality aspects (assessment of risk of bias and reported limitations).
The extracted data were organized in a Microsoft Excel spreadsheet and coded to facilitate analysis. Initially, open coding was carried out by assigning descriptive labels to the extracted data (variables). The codes were then grouped or ungrouped and normalized using axial coding to connect related themes [36,37]. This methodological approach was used to standardize the data and to guarantee the quality of its extraction.
To minimize errors and biases, the data were extracted by one researcher, and the consistency of the extraction was validated by two independent researchers. The variables corresponding to the chemical elements, analyte extraction techniques, and analytical techniques were standardized by the researcher with the most experience in trace analysis and environmental chemistry and certified by the researcher who carried out the extraction.
As the identification of several common names and synonyms can lead to duplications or omission of relevant data when analyzing information from different sources, to reduce bias and avoid ambiguities caused by different names, the Chemical Abstracts Service (CAS) number was used in the standardization of phenolic compounds. When compounds with various names were found in different articles, the most common one was selected and identified with the CAS number in the database for this study. The CAS number was searched on the PubChem website [38].
The risk of bias was assessed for the 52 studies included in the sample. Although all of them presented evidence that the analyses were carried out on real groundwater, it was not possible to identify the environmental context of the collection site or the precise location of the sites sampled for 40% (N = 21) of them. However, the transparency of the analytical methods and the availability of complementary data were considered when assessing the risk of sampling bias. As the compounds detected were identified with their respective CAS number, and the sources of pollution and the analytical, extraction, and derivatization techniques were duly standardized and certified by expert researchers in the field, the risk of bias was considered low, with a high level of robustness of the findings. Although the findings of this review may be subject to publication bias, this risk is also considered low given that the global research ecosystem increasingly relies on data from WoS and Scopus [34], which were the two repositories used to collect the articles.

2.5. Classification of Specific Phenolic Compounds

In 1970, the Environmental Protection Agency (USEPA) was created for the protection of human health and to safeguard the natural environment on US territory [39]. Environmental regulations are updated periodically, organized, and codified in the Code of Federal Regulations (CFR), which is structured into 50 titles, each covering a specific area of federal regulation. To implement and enforce environmental regulations, the USEPA has developed test procedures (analytical methods) for measuring regulated pollutants, which are contained in regulations codified at Title 40 CFR [40].
Title 40 covers regulations on environmental protection, which include topics such as water and air quality, solid and hazardous waste management, toxic substances, and chemical control [40]. Globally, the USEPA is recognized as one of the most influential environmental regulatory agencies [41]. With an adequate budget, a wealth of technical knowledge, and a variety of available technologies [41], the USEPA has an institutional leadership position in published research on environmental monitoring [42], contributing to policies in other nations. For this RSL, Chapter I (Environmental Protection Agency) of Title 40 was examined in its Subchapter D Water Programs (Part 116); Subchapter J Superfund, Emergency Planning, and Community Right-to-Know Programs (Part 302); and Subchapter N Effluent Guidelines and Standards (Part 423) [40].
The designation of hazardous substances for the Clean Water Act (CWA) is made in Part 116 of the 40 CRF, which establishes the framework for regulating the discharge of pollutants into U.S. waters to restore and maintain their chemical, physical, and biological integrity [43,44]. Substances classified as hazardous by the USEPA, when discharged in any quantity into jurisdictional waters, present an imminent and substantial endangerment to public health or welfare [45]. With the designation of a chemical (element and compound) as a hazardous substance by the CWA, its reportable quantity is established by regulation, and discharge in quantities that may be harmful to navigable waters and waters of the contiguous zone is prohibited; a total of 326 substances are currently classified as hazardous [45].
Part 302 of 40 CFR deals with “Designation, reportable quantities, and notifications” in compliance with the Comprehensive Environmental Response, Compensation, and Liability Act of 1980 (CERCLA). This act establishes prohibitions and requirements regarding closed and abandoned hazardous waste sites. It governs liability for hazardous releases and establishes a trust fund for cleanup when no responsible party can be identified [46]. CERCLA also specifies “reportable quantities” (RQs) for each substance, which are the minimum release amounts that require notification to the USEPA [45].
In addition to hazardous substances, priority pollutants are also regulated by the CWA. For these, Appendix A of 40 CFR Part 423, designated as the Priority Pollutants List, lists 126 priority pollutants that are regulated by the USEPA and for which analytical test methods have been developed [47]. The phenolic compounds found in the 52 studies in this review were classified based on these environmental regulations established by the USEPA.

2.6. Data Analysis and Synthesis

The data were normalized for co-occurrence analysis, which aims to explore the keywords that co-occur in two or more articles and that represent the main content of the studies by describing the topics covered by a knowledge domain. A keyword network shows the structure of the body of knowledge by presenting the inter-relationships and organization of research topics [48,49].
VOSviewer software version 1.6.20 was used to analyze the co-occurrence of keywords. After selecting the keywords described by the author, 156 terms were extracted for normalization (standardization of synonyms and different forms of the same word). Exported in a “TXT” file for processing, the normalization resulted in 116 terms for analysis (Table S2—Supplementary Material). The adjusted terms were entered into a synonym file with instructions for the analytical software to replace all instances of a keyword (embedded terms) with another (label) [50].
In the keyword co-occurrence analysis, keywords were identified that co-occur more frequently and have greater link strength. Thus, keywords with a minimum occurrence of two times and a minimum link strength of two were considered, resulting in 29 matches. VOSviewer’s “overlay visualization” function was used to help detect the evolutionary trend of the research topics investigated.
Microsoft Excel, a tool widely used for compiling, organizing, and visualizing data, was used to process and analyze the data collected. The extracted data were initially systematized in electronic spreadsheets for consistent treatment of the information to guarantee its accuracy. Based on the structural organization of the database, to meet the objectives of each synthesis devised by the research team, Python v.3.1 was used to support parameterization and Generative Artificial Intelligence (GAI) to explore graphical representations of the information. Multiple interactions were carried out to improve the resulting graphical summaries, which served as the basis for the preparation of final infographics built by an illustrator using specialized graphic publishing tools to ensure a clear and informative visual representation of the study’s findings.
In the temporal and socioeconomic distribution of the studies and the phenolic compounds identified in groundwater, the Global North and South structure [51,52] was considered, based on the list of countries in the Global South [53]. The heatmap technique was used for the graphical summaries of contamination sources and their relationship with groups of phenolic compounds and the distribution of regulated contaminants by country, with the data initially organized in spreadsheets to standardize and certify the information. Using IAG to identify the most favorable graphic structure, the data systematized in a Microsoft Excel spreadsheet was reworked by an illustrator using graphic editing tools. The intersection between the substances regulated by 40 CFR Parts 116, 302, and 423 [44,46,47] was established by parameterizing the data in a Microsoft Excel spreadsheet and applying it to a Venn diagram, which allows visualization of the overlap between the lists of regulated substances. The graph was developed by an illustrator and validated by the research team to ensure that all the components were correctly categorized and that they adequately represented the similarities and divergences between the regulations analyzed.
For the priority compounds that simultaneously presented LD and LQ data, the research team prepared a scatter plot generated with Python v.3.1 to allow visualization of these limits between the analytical techniques employed. A scatter plot was also drawn up for a comparative analysis of the GC-MS analytical technique with and without derivatization.
The efficiency of the recovery techniques (%) of priority phenolic compounds, which simultaneously presented LD and LQ data and which did not use derivatization, was analyzed using the Sunburst chart to visualize the hierarchy between the methodologies applied. This chart was made up of three levels of information: (i) the central ring, showing the extraction techniques used (LPME, SPE, and online SPE); (ii) the middle ring, showing the analytical techniques used for quantification (LC-MS/MS; GC-MS, HPLC-UV and LC-UV); and (iii) the outer ring, showing the recovery values (%) for the priority phenolic compounds analyzed. The graphical summary of the maximum concentrations of priority phenolic compounds per country was established in a bubble chart adjusted from the data organized and systematized in Microsoft Excel spreadsheets.
The meta-analyses and summaries of information were complemented by thematic descriptive narrative analyses.

3. Results and Discussion

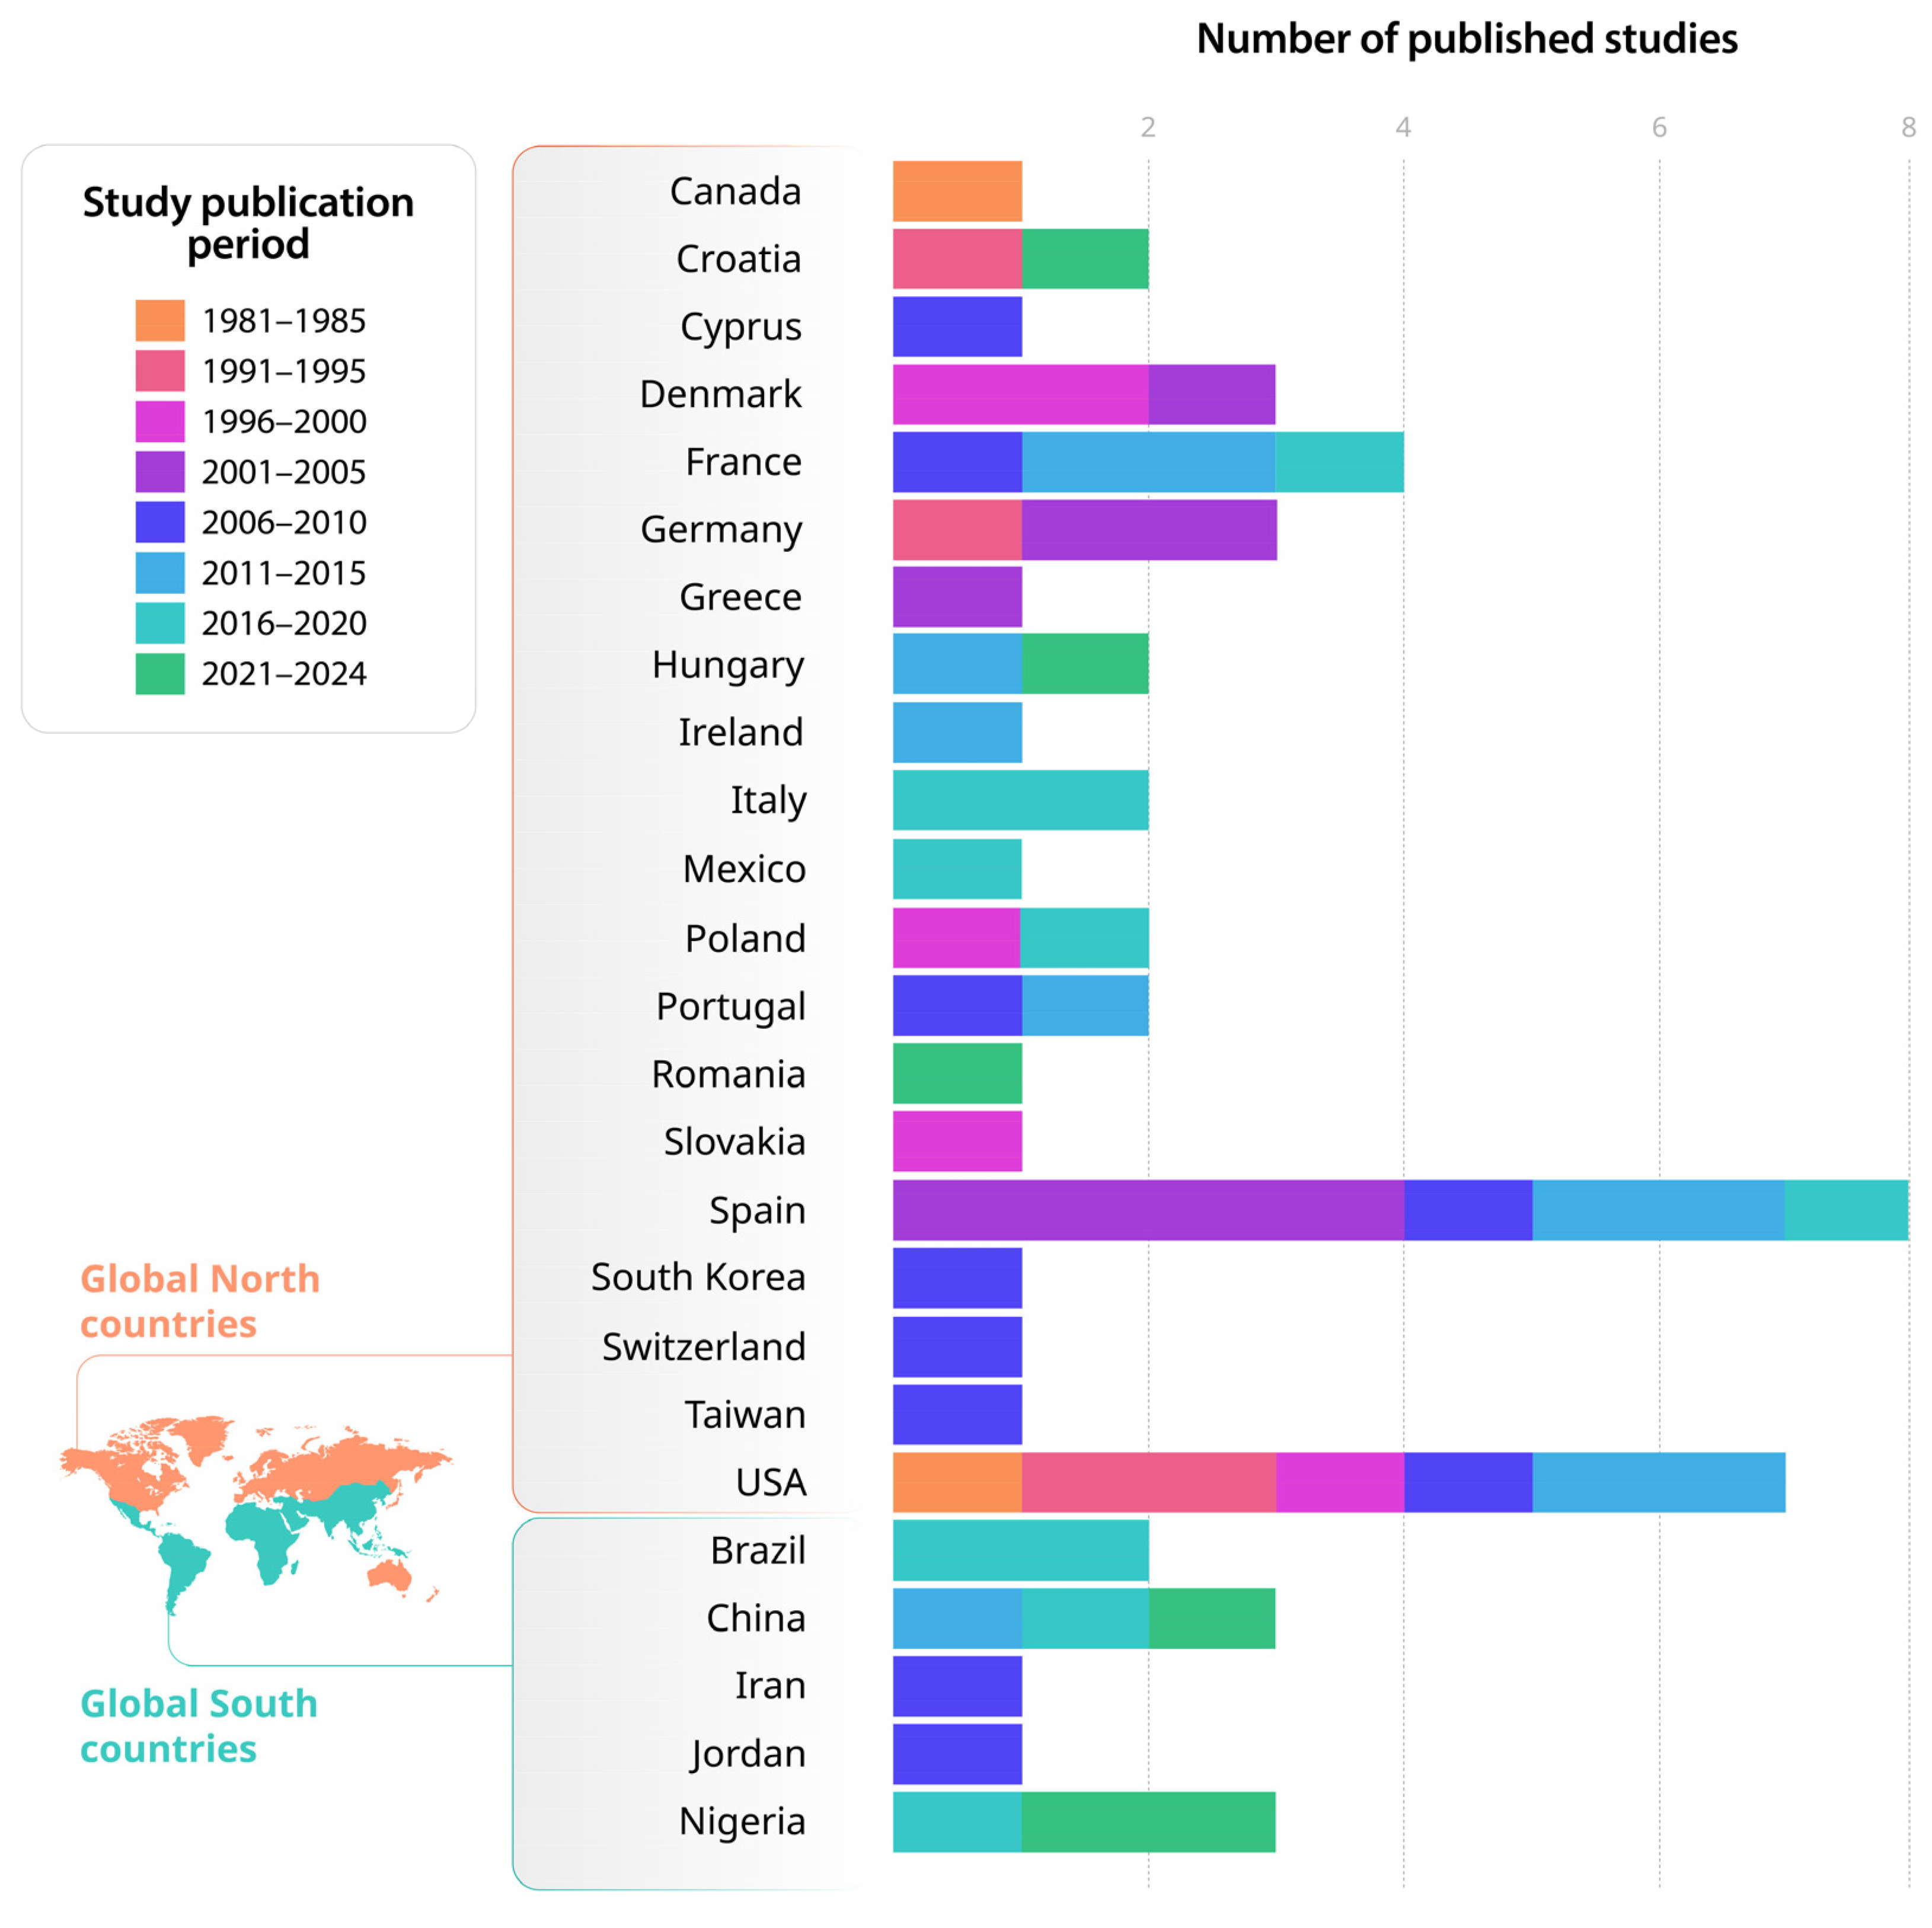
3.1. Temporal Evolution, Sources of Contamination and Global Distribution of Groundwater Contamination by Phenolic Compounds

With 345 studies previously selected in the searches carried out in the two referential scientific databases (WoS and Scopus), the number of articles that fell within the scope of this review was relatively low. Only 15.07% (N = 52) were considered eligible; they covered the years 1984 to 2023 (Figure 2).
Between 1984 and 2000—a period of around 20 years—only eleven studies were identified in just seven countries. Canada [54], Croatia [55], Slovakia [56], Poland [57], and Germany [58] have one publication related to each country, and Denmark [59,60], has two publications; the USA stood out with four studies in this same time frame [61,62,63,64].
The use of chromatographic methods to detect phenolic compounds in groundwater in different regions of the world before the 2000s suggests that chromatographic methods were already widely accepted. This result also shows that groundwater contamination was also a problem of primary concern, for example, in Denmark, where the supply of drinking water is almost entirely based on the use of groundwater susceptible to contamination by polar pesticides [59]. In the USA, wastewater represents a major source of pollution and an important source of groundwater contamination. For example, in Cape Cod, Massachusetts, drinking water is entirely supplied by groundwater and is especially vulnerable to wastewater discharge [64].
The advance in the sensitivity and specificity of analytical techniques over the decades is evident. In older studies evaluating the sites of Southington, Norwich, Watertown, Danbury, and Sheshire in the USA [61], the identification of phenolic compounds was based only on GC-MS without derivatization, while studies developed in the late 1990s already used LC-MS and chemical derivatization to improve the detection of phenols at trace levels [59,64]. In this same period, leachates from landfills and industries were mapped as critical sources of contamination by phenolic compounds [54,55,62,63,64], with studies also addressing agricultural waste and runoff as a source of contamination [57,59,61].
In the years between 2001 and 2020, significant evidence was found of the expansion of studies on phenol contamination in groundwater, with 37 studies carried out in 20 countries, the majority belonging to the Global North. Spain made the largest contribution, with eight publications [65,66,67,68,69,70,71,72]. There were three studies in the USA [73,74,75] and France [76,77,78] in the continental area and one study in the French overseas territories of Guadeloupe and Martinique (Atlantic Ocean), Reunion and Mayotte (Indian Ocean) and French Guiana (continental area in South America) [79].
With two publications in each country, studies were identified in Germany [80,81], Italy [82,83] and Portugal [84,85]. They were also found in Cyprus [86], Denmark [87], Greece [88], Hungary [89], Ireland [90], Switzerland [91], Taiwan [92], South Korea [93], Poland [94] and Mexico [95]. In the same period, countries in the Global South also assessed groundwater contamination by phenolic compounds: Brazil [96], Karak, Jordan [97], Henan province, China [98] and Iran [99].
Between 2021 and 2024, only five studies were identified that met the criteria of this review, with investigations in Dongying, in the Yellow River estuary, in China [100], in the Danube River basin [101], in the city of Ibadan [102] and Osun [103] both in Nigeria, where groundwater was found to be contaminated by multiple organic compounds [102], and in Monterrey Nuevo León, México [95].
It is interesting to note that no publications from the Global South were identified until 2005. In addition to this gap, evidence was also found of gaps in the details of the research site. Of the total number of studies selected (N = 52), 28.85% (N = 15) had an insufficient location (with superficial references to the site and its environmental context). This location was considered adequate for 40.4% of the studies (N = 21), which indicated the sites investigated but without specifying their hydrogeological and environmental characteristics. Only 19.2% of the studies (N = 10) provided detailed information on the sites sampled, which would make it possible to support comparative research between studies or additional complementary analyses on the same sites.
These studies with detailed information evaluated the locations of Zeitz, in Germany [80], Rosário do Catete in Sergipe, Brazil [104], Guiyang City in Guizhou Province, China [105], Zagreb in Croatia [55], Catalonia, Barcelona region, in Spain [71], Southington, Norwich, Watertown, Danbury and Sheshire and Cape Cod in Massachusetts, USA [61,64], Milan in Italy [83], and Ibadan and Osun, Oyo and Lagos States, in Nigeria [102,103].
In the analysis of keyword co-occurrence (Figure 3), where the color gradient (blue to yellow) indicates the temporal evolution of searches, topics such as “phenols”, “groundwater”, and “pesticides” showed connections throughout the period analyzed, suggesting consolidated research themes.
Concern about pesticides in groundwater, for example, was also identified throughout the period investigated, since the 1990s. These studies pointed to municipal and industrial sewage and agricultural runoff in Gdansk in Poland [57] and agricultural runoff in Denmark [59] as sources of contamination. In Denmark as well, water-soluble chlorinated phenols were reported to be associated, among other sources, with the degradation of pesticides [87], while in Spain, in the regions of Catalonia, Galicia, and Andalusia, minimal impact of herbicides, phthalates, alkylphenols, and BPA has been demonstrated in spring water intended for bottling, suggesting the effectiveness of measures to protect water from any anthropogenic impact [70].
More recent topics, such as “emerging contaminants”, reflect the growing concern about emerging pollutants. Thus, state-of-the-art broad-scope target screening was carried out, with the detection of 33 emerging compounds that qualified as potential pollutants specific to the Danube River basin [101]. In Milan, Italy, more than 80 emerging contaminants were investigated [83]. Endocrine-disrupting compounds, which constitute a broad group of contaminants of emerging concern, have been studied in the northeastern region of Emilia-Romagna, also in Italy [82]; in agricultural areas of Spain, close to large cities [65]; and in the Barcelona region, in Saint Joan Despí [67]. In this same location, possible trends in the seasonal distribution of estrogens, pesticides, and BPA have been investigated, with evidence that groundwater pollution is quite persistent and that the rate of degradation in this environment is very slow [68].
The keyword co-occurrence network also highlighted recent themes, such as “mass spectrometry” and “LC-MS/MS”, which represent advances in analytical techniques and the consequent increase in precision in the detection of phenolic compounds, allowing for more sensitive and selective analyses. Advanced analytical methods such as UPLC-MS/MS, for example, were used to assess groundwater contamination in Shengiu County, China, with detection limits of 0.1 ng/L for the identification of 2,4-dibromophenol (2,4-DBP), 2,4,6-tribromophenol (2,4,6-TBP), 4-bromophenol and 4-bromo-3-methylphenol [98], as well as the determination of 4-chloro-2-methylpenol (2,4-MCP) in Ireland [90].
Countries from the Global South made a small contribution, with only seven studies carried out between 2001 and 2020, developed in Brazil [96,104], China [98,105], Jordan [97], Iran [99] and Nigeria [103]. In the following interval (2021–2023), studies from the Global South assessed groundwater contamination by phenolic compounds at sites located in China [100] (Hai-Liang and Tong-Na, 2022) and Nigeria [102,103].
A total of 306 occurrences were counted in the Global North and 45 in the Global South, considering “occurrences” of all the phenolic compounds analyzed, even if repeated, in the different studies reviewed. A total of 115 occurrences of maximum detected concentrations were reported, with 94 in the Global North and 21 in the Global South (Figure 4).
Of the total occurrences in the Global North (N = 94), 48 different phenolic compounds were identified. Of these, 10 are considered priority compounds [47]—2,4,6-trichlorophenol, 2,4-dimethylphenol, 2,4-dichlorophenol, 2,4-dinitrophenol, 2-methyl-4,6-dinitrophenol, 2-chlorophenol, 4-chloro-3-methylphenol, 4-nitrophenol, pentachlorophenol and phenol—and they showed a range of concentrations from 4 ng/L (2,4-dichlorophenol) to 40,000,000 ng/L (phenol) in Ireland [90] and USA [63], respectively.
Twenty-one occurrences that were observed in the Global South correspond to five different phenolic compounds (2,4,6-trichlorophenol, 2,4-dimethylphenol, 2,4-dinitrophenol, 2-methyl-4,6-dinitrophenol and phenol) that are considered priority compounds (Part 423 40 CFR) [47], with 2,4-dinitrophenol having the highest maximum concentration of 1,313,000 ng/L in Nigeria [103].
One of the factors affecting water scarcity is water contamination, which mainly impacts cities and countries in emerging economies experiencing rapid economic growth [3,6,8]. However, in these same regions, the use of advanced techniques for assessing groundwater contamination by phenolic compounds is still limited. This gap suggests the need to improve environmental monitoring in under-represented regions, where the absence of systematic data can hinder the implementation of effective regulatory policies.
As few phenols are addressed in global water quality guidelines, regulation is a major challenge to mitigating risks to human health and the environment [14]. For the compounds classified as priority compounds, 2,4,6-trichlorophenol and pentachlorophenol exceeded the limit of 1500 ng/L and 30 ng/L, respectively [106], established in section 304 (a) of the CWA [107]. With quantified concentrations above 30 ng/L, pentachlorophenol was detected in six investigations [56,79,80,81,87,89]. Concentrations below the LQ or LD were also reported [57,62,84,104], as were investigations that did not detect the substance [88,92,101], and in these studies, the LDs or LQs were greater than 30 ng/L. Only three studies had quantification results or LDs and LQs below 30 ng/L [64,101,104].
The reported concentration of 2,4-dimethylphenol in Denmark was 2,090,000 ng/L [60]. In two studies, conducted in Denmark [87] and Germany [81] 2,4-dichlorophenol was reported to be above 300 ng/L, while 2-chlorophenol was detected above 100 ng/L in three of the seven studies that evaluated it [80,81,89].
The World Health Organization’s Guidelines for Drinking Water Quality [108] and the Europe Commission’s Phenol—Summary Risk Assessment Report [109] set a limit concentration for phenol of 1000 ng/L. Among the investigations that analyzed this substance [54,55,57,60,61,62,63,67,80,81,84,87,88,89,96,103], five studies reported concentrations lower than the LD or LQ, although they exceeded the 1000 ng/L concentration [54,67,84,88,96]. Regarding the concentrations detected, 56% of the studies (N = 9) reported values above 1000 ng/L [60,61,62,63,80,81,87,89,103].
Although the effects of environmental management in a river basin are related to how pollution control cooperates in the upstream and downstream regions [110], only one study has evaluated legacy and emerging contaminants in the Danube River Basin, with collections from sites in Romania, Croatia, and Hungary [101].
In France, overseas departments (DOM) are a major issue for the implementation of the EU Groundwater Directive (GDW) due to methodological limitations, knowledge gaps, and the absence of specific indicators for these environments, as well as the lack of local analytical laboratories and geographical isolation [79]. To address these difficulties, analyses were conducted in five French overseas territories, determining the occurrence of 36 organic micropollutants, including pesticides that exceeded the groundwater quality limit of 100 ng/L. The results indicated the stability of the substances and reinforced the importance of packaging and transportation conditions for samples collected outside the laboratory [79]. As similar challenges can affect countries and locations in the Global South, including a lack of laboratory infrastructure, geographical isolation, and the absence of specific indicators, the strategies developed have the potential to contribute to overcoming these limitations.
Groups of phenol compounds, alkylphenols and chlorophenols were identified with greater diversity and concentration correlated with contamination by industrial and municipal effluents, pesticides and fuels (Figure 5). Phenol is an aromatic organic compound used in chemical skin peels, anesthetics and disinfectants; in lower concentrations, it makes up formulations for antiseptics, lotions, ointments, paints, polishes, adhesives, lacquers, varnishes and solvents [111]. Alkylphenols are derivatives of phenols and comprise a wide range of compounds used as emulsifiers for polymerization, detergents, pesticides and the processing of wool and metals [112]. The investigations conducted by the 52 studies in this review suggest that the alkylphenols detected come from a variety of contamination sources and are strongly associated with industrial discharges and urban effluents, pesticides, fuels and endocrine disruptors, while the most significant contamination sources for phenols were industrial effluents and pesticides.
Chlorophenols are a class of chlorinated halogenated phenols, made up of 24 types of chlorophenols. A total of 12 substances in this group have been reported as hazardous by 40 CFR Part 302 [46]: 2,3,4,6-tetrachlorophenol, 2,3,4-trichlorophenol, 2,3,5-trichlorophenol, 2,3,6-trichlorophenol, 2,4,5-trichlorophenol, 2,4,6-trichlorophenol, 3,4,5-trichlorophenol, 2,4-dichlorophenol, 2,6-dichlorophenol, 2,4-dichlorophenoxyacetic acid, 2-chlorophenol and pentachlorophenol [113]. These compounds stand out for their variety of contaminants, with the greatest representation in industrial discharges, pesticides, herbicides, antiseptics, disinfectants, urban effluents and the degradation of natural substances [113].
The results have also shown a direct link with public health and environmental protection policies. In France, for example, monitoring of hormones, pharmaceuticals, pesticides, perfluoroalkyl substances (PFASs), phthalates, and alkylphenols (APs) at the ultra-trace level was carried out to analyze the potential presence of emerging contaminants in bottled mineral waters [78]. Among the 330 compounds investigated in 40 bottled waters, no phthalate, hormone, or pharmaceutical substance was quantified. On the other hand, 19 compounds were quantified in 11 samples at the low ng/L level, 11 of which were herbicides or their metabolites, 6 PFAS, and 2 APs. The answers obtained suggest that the natural geological protection of the aquifers exploited has not managed to prevent the presence of some PFASs, herbicides, and their metabolites in some samples, even at levels well below the applicable French regulations [78]. Thus, although benefiting from long-term protection policies in their watersheds and their natural geological protection, French bottled spring waters (SPWs) or natural mineral waters (NMWs) are still subject to deterioration by emerging contaminants [114].

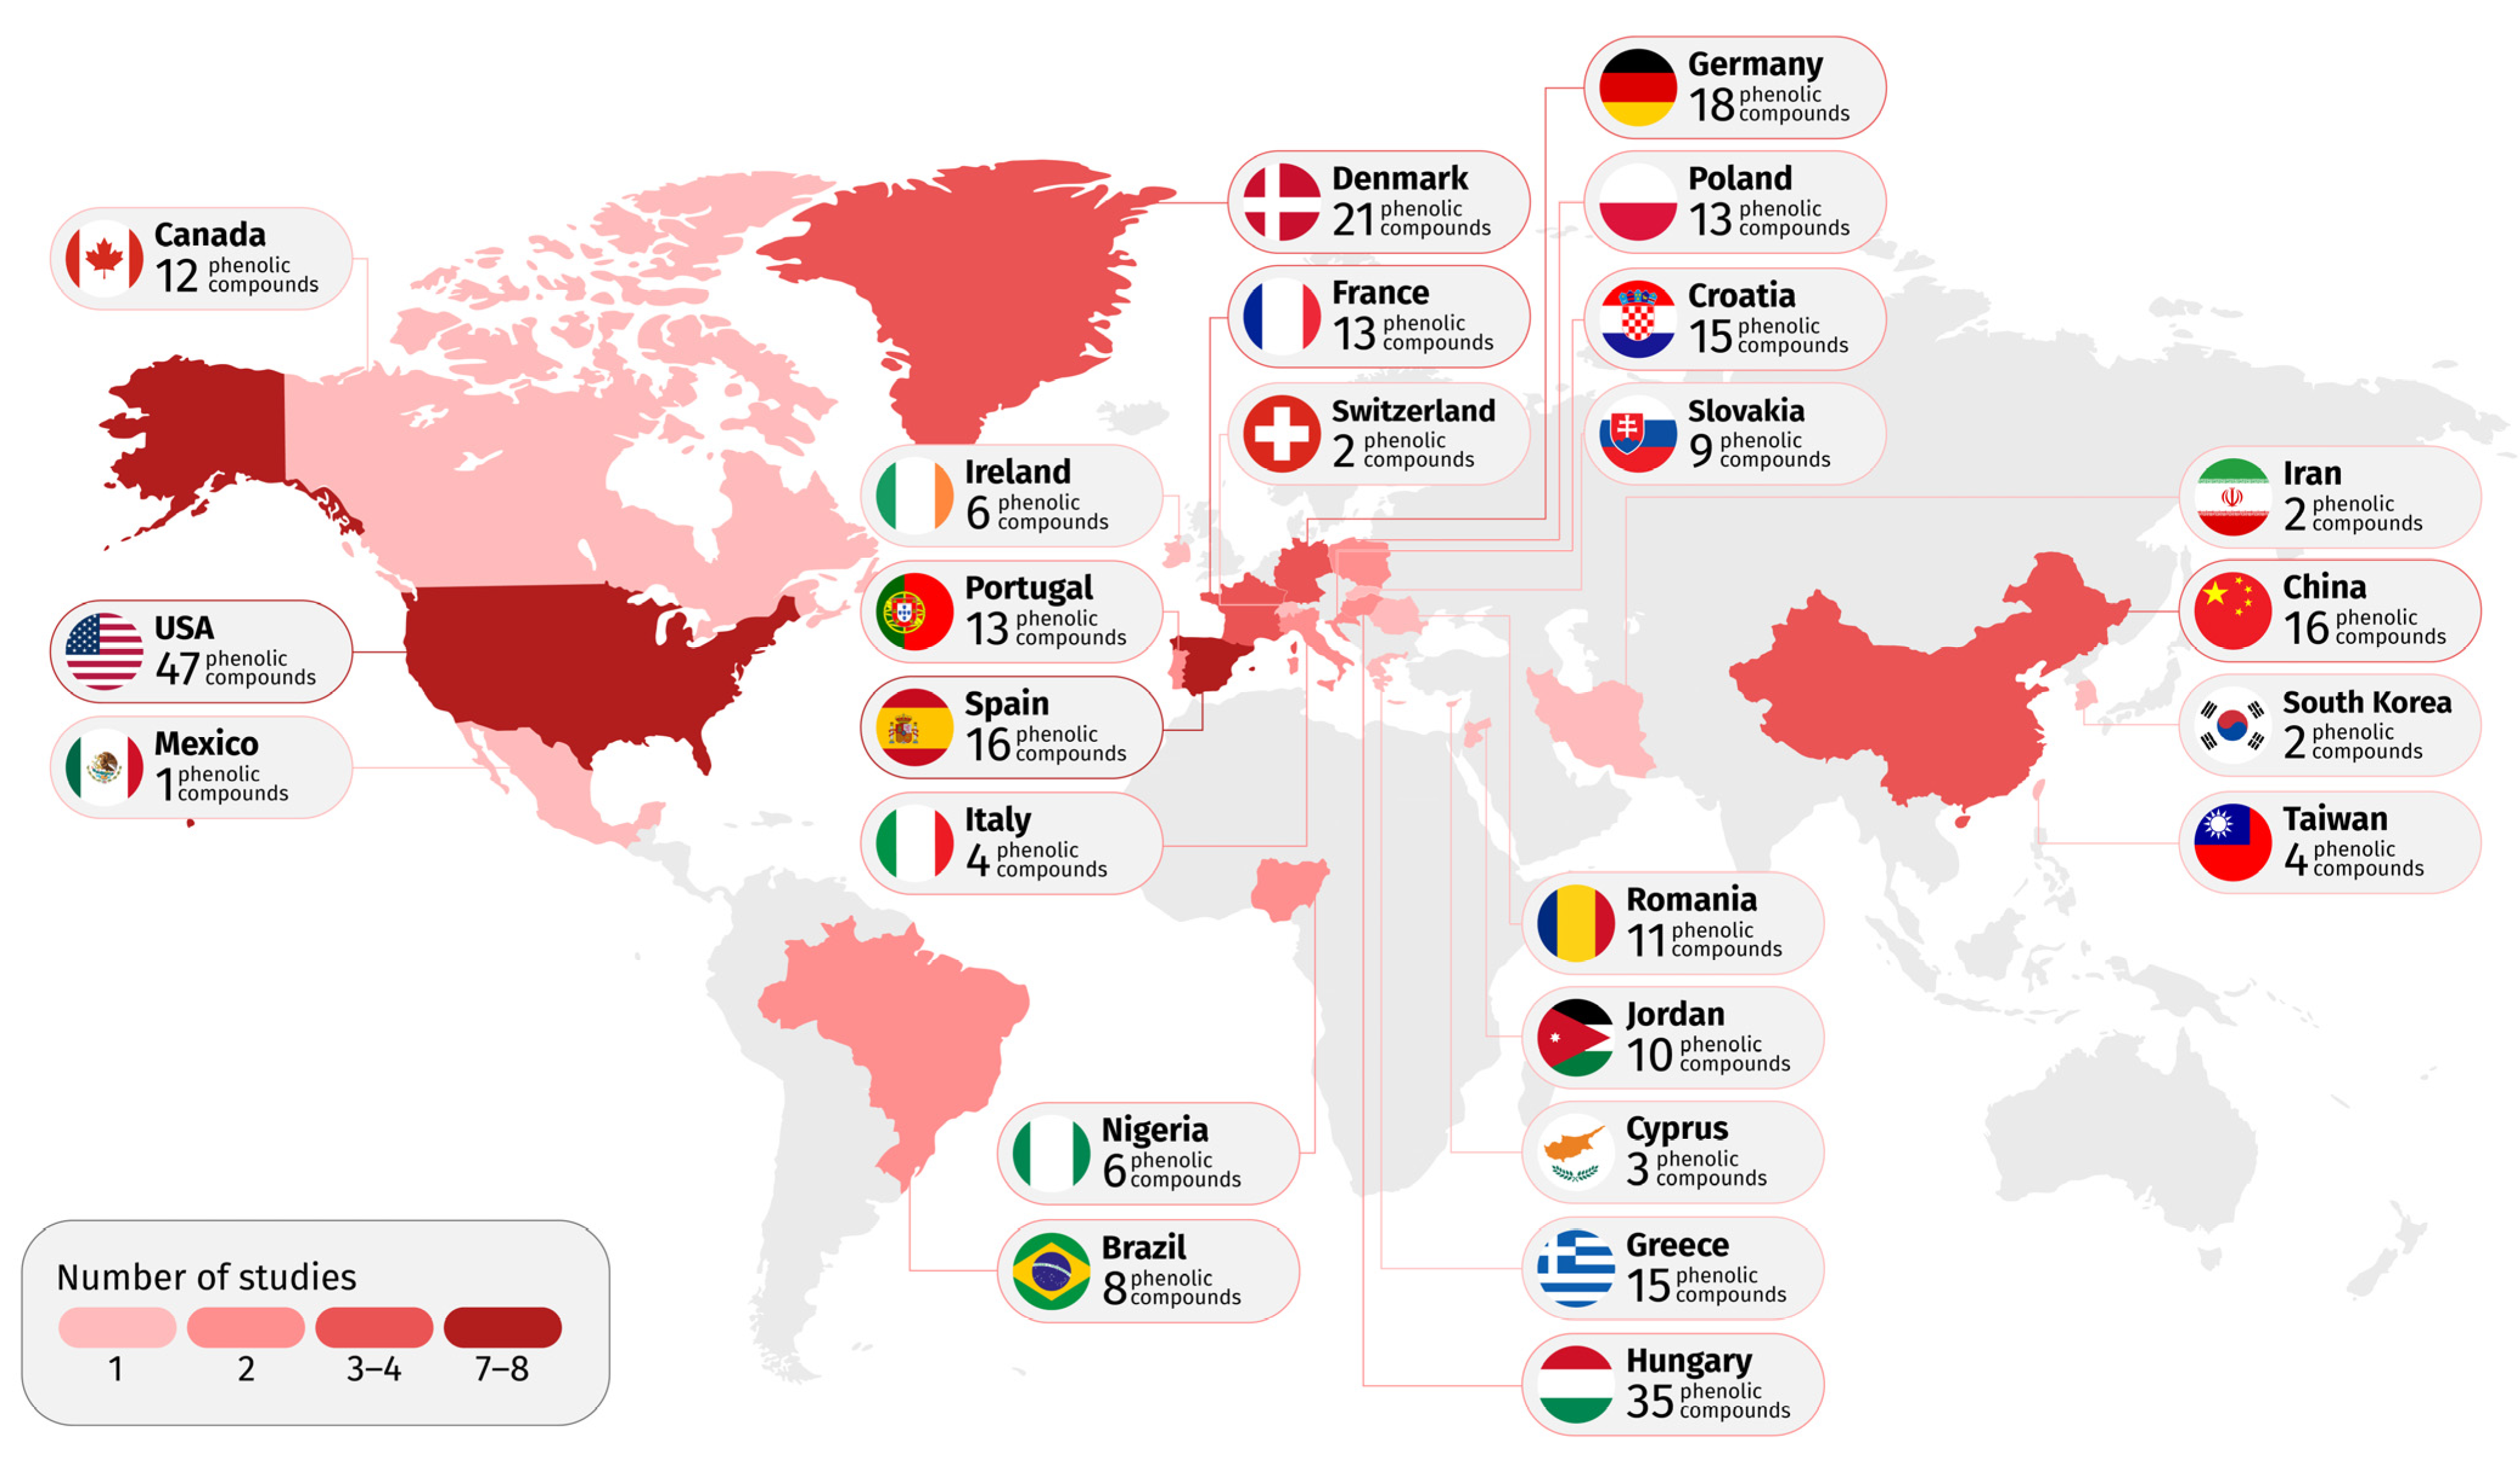
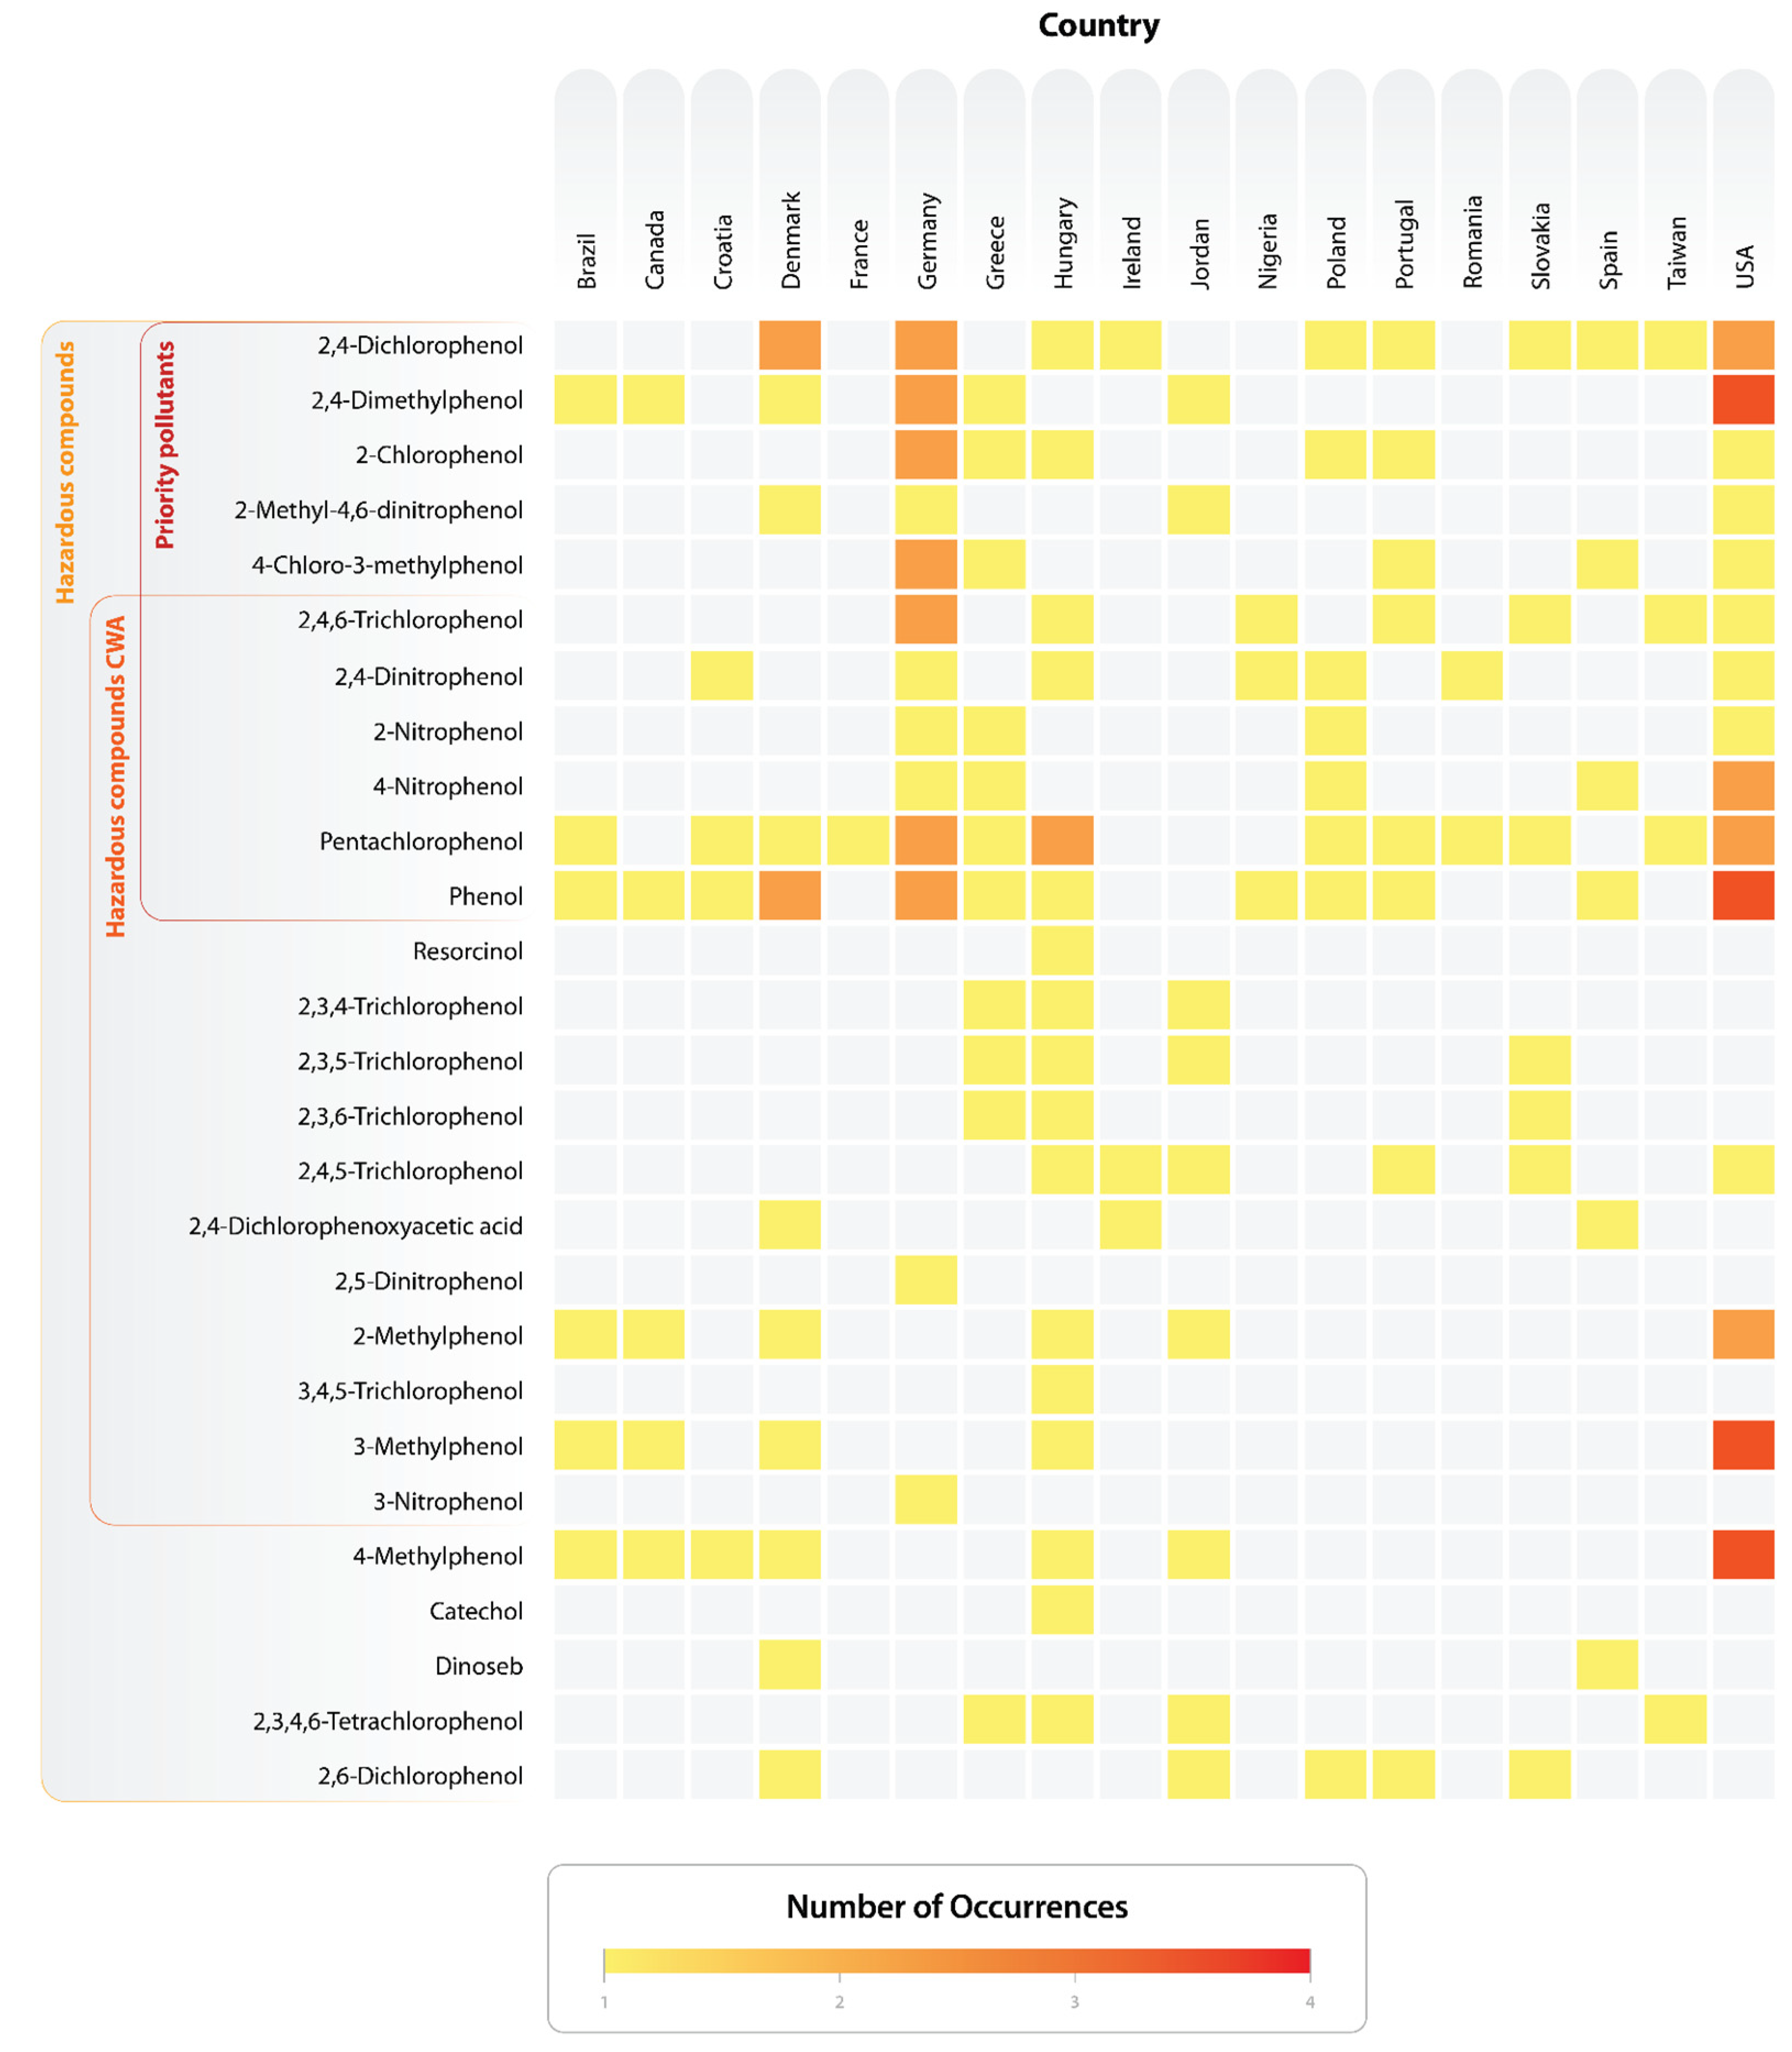
3.2. Phenolic Compounds Evaluated and Detected by Groundwater Studies

The detection and quantification of phenols and their compounds in groundwater matrix have evolved with the development of new equipment; these developments have made it possible to improve analytical techniques and appropriate sample preparation methods. In Denmark, for example, an extensive study was carried out with 7671 samples collected from 1115 screens between 1993 and 2001 for the National Groundwater Monitoring Program (GRUMO). Phenol and chlorophenol data were obtained using GC with ECD, FID, or MS detection [87]. These different detection techniques coupled with GC are because phenolic compounds have different functional groups, with brominated and chlorinated phenolic compounds being more suitable for detection via ECD and alkylated compounds via FID. In addition to being suitable for most phenolic groups, MS detection is a complementary tool for identifying and quantifying lower concentrations of these pollutants (Table 1).
In a study from Denmark, the phenolic compounds identified included phenol, methyl-phenols, dimethyl-phenols (2,4-dichlorophenol; 2,6-dichlorophenol) and pentachlorophenol [87]. Phenol was reported most frequently, in 14.6% of the 159 screens examined, while methyl- and dimethyl-phenols were detected in less than 1% of the several hundred screens examined; dichlorophenols showed concentrations below the potability limit of 0.1 µg/L, and pentachlorophenol was found in 7 of the 1090 screens examined. Possible sources of contamination include the production of plastics and detergents by the chemical industry and impurities in pesticides (for chlorophenols). Other sources of pollution suggested were creosote, a substance widely used to preserve railway sleepers, which contains cresol and phenol, also used in old gas plant installations, pentachlorophenol (a component used to impregnate wood between 1956 and 1979), as well as the degradation of organic matter, which can give rise to some phenols [87].
The GC-FID technique has been used to detect and quantify phenolic compounds in different environmental contexts [54,60,61,62,97]. In the USA, in the towns of Southington, Cheshire, Norwich, Watertown, and Danbury in Connecticut, the contamination of groundwater by leachate from municipal landfills that received domestic and industrial waste was analyzed. Phenol and alkylphenols (3-ethylphenol, 4-ethylphenol, 3-methylphenol, 4-methylphenol) were reported, with phenol showing one of the highest concentrations (1,200,000 ng/L) [61]. In groundwater adjacent to three ferrous smelting landfills in Wisconsin, also in the USA, phenol was detected above the limit of quantification, with a significant concentration of 540,000 ng/L, while chlorophenols, nitrophenols, alkylphenols, nitrocresols, and chlorocresols were detected at very low levels (<LQ), which may indicate either residual presence or limitations of the analytical methodology [62].
Studies conducted in the Middle East, in the city of Karak, Jordan, evaluated the absorption of organic compounds in different plant species resulting from the use of wastewater for irrigation in agriculture. Consequently, the study evaluated irrigation as a potential source of groundwater contamination, with a total concentration of 1000 to 4000 ng/L being reported for the sum of the phenolic compounds analyzed, with o-cresol standing out as having the highest reported concentration (780 ng/L) [97]. In Canada, groundwater located near a tailings pond was also investigated, but the phenolic compounds evaluated were below the LD of 1000 ng/L [54].
GC-GC-TOFMS was used in California, USA, to examine 22 groundwater samples collected from five sites impacted by fuel spills [74]. As the technique was applied for the non-targeted analysis of polar petroleum metabolites, it was possible to detect an additional 760 compounds, including acids, esters, alcohols, ketones, aldehydes, and phenols, with the determination of 2,4-dimethylphenol, 2,3,5-trimethylphenol, 4-cumylphenol, 4-pentylphenol, 4-tert-amylphenol, 4-tert-butylphenol, 4-nonylphenol). Although phenols were reported, as they were not identified at multiple sites and were present in very low concentrations (<LOQ), these findings suggest that phenols are not the predominant metabolites in oil biodegradation environments [74].
Nineteen studies conducted in twelve different countries have used GC-MS as an analytical technique using various extraction techniques. Studies were carried out in Germany [80,81], Brazil [104], China [100,105], South Korea [93], Spain [65,66,70,71], USA [63,64,73], France [78], Hungary [89], Nigeria [102], Portugal [84], Taiwan [92] and Poland [94]. In more recent studies, for example, low or non-detectable levels of phenols have been reported in Nigeria, using acetylation to increase the volatility of phenols in GC-MS analysis [102], and in China, using silylation, which improves the thermal stability and spectrometric response of phenolic compounds [100]. On the other hand, the highest concentrations were determined in domestic and industrial landfills in the United States, with reported concentrations of 40 to 50 × 106 ng/L by direct injection of the sample into the GC-MS [63].
In another example, two residential areas in Catalonia (Spain) were investigated in an episode of drinking water contamination due to a strong sweet and paint/solvent odor in the water, with reports of nausea associated with its consumption. The organic compound 3-(trifluoromethyl)phenol (CAS number 98-17-9) has been detected at concentrations of up to 17,000 ng/L in groundwater [71]. Used as a raw material, this compound is an intermediate in the synthesis of pesticides, medicines, resins, dyes and other products. As well as causing serious burns to the skin and damage to the eyes, 3-(trifluoromethyl)phenol is harmful if it is inhaled, ingested, or comes into contact with the skin; it is also harmful to aquatic life, with long-lasting effects [115].
The HPLC-SPE-NMR-TOF-MS technique is an advanced analytical approach that combines various instrumental techniques for the separation, purification and structural identification of chemical compounds. Highly sensitive and specific, it was used in Switzerland for a comprehensive non-targeted analysis of contaminated groundwater at a former munition destruction site [91]. In this same study, a high concentration of PBA was detected, in the range of 12,000 to 13,000 ng/L, due to this compound being used in the ammunition to stabilize the propellant charge.
LC-MS is a powerful analytical tool used to separate, identify and quantify chemical compounds in a variety of complex matrices. In Denmark, its use determined seven acid herbicides in groundwater, four of which were considered hazardous (2,4-dichlorophenol, 2,4-dichlorophenoxyacetic acid, 2-methyl-4,6-dinitrophenol, and dinoseb); however, all the compounds evaluated remained below the detection limit, which ranged from 3 to 26 ng/L [59]. In Barcelona, Spain, a concentration of approximately 1600 ng/L of 4-nonylphenol, which is considered an endocrine disruptor, was reported in the groundwater that serves as the city’s second source of water [67]. Selected endocrine-disrupting compounds were also analyzed in groundwater from Romagna, northern Italy, with BPA occurring below the MQL [82]. A study in the USA identified the residential septic system as a potential contaminant of local groundwater by detecting concentrations of nonylphenol at levels of 20,000 ng/L [75]. In a groundbreaking study conducted in Mexico, the presence of BPA was identified in groundwater at concentrations of 25,000 ng/L. The concern that motivated the study was the reuse of municipal water for irrigation [95].
In Croatia, even though the Sava River is an essential ecological, economic and social resource, both the watercourse and its entire basin upstream of Zagreb have been under severe pressure in recent decades. As early as the 1990s, the city was densely occupied and one of the most industrialized in the region [116]. This process has affected both the river and the aquifer, which is directly connected to the Sava and which supplies the city, as part of the domestic and industrial effluent is discharged into the watercourse [55]. In the groundwater of Zagreb, the compound 4-nonylphenol at a concentration of 78 ng/L, 10 ng/L of monoethoxylated 4-nonylphenol, and 280 ng/L of phenol were identified using LC-MS/GC-MS techniques [55].
The LC-UV technique is the most widespread but is less sensitive than LC-MS and LC-MS/MS. This same technique was used in studies carried out in Poland [57], Spain [69,72], the USA [64], Brazil [96], Greece [88], Iran [99] and Nigeria [103]. The study conducted in Nigeria stands out due to the concentration of 1,313,000 ng/L of 2,4-Dinitrophenol found in groundwater used for public water supply. The concern is exacerbated by the fact that the region lacks proper water treatment, posing a significant health risk to the population.
On the other hand, in studies using the LC-MS/MS technique [76,77,78,79,83,85,86,90,98,101], LDs were obtained in the range of 0.3 ng/L for 2,4-dichlorophenoxyacetic acid, 0.7 ng/L for 2,4-dichlorophenol, 1.2 ng/L for 2,4,5-trichlorophenol [90], 0.06 ng/L for 2,4-dinitrophenol and 0.13 ng/L for pentachlorophenol [101]. All of these are considered hazardous by 40 CFR Part 302 [46]. These same compounds have shown maximum concentrations of up to 418 ng/L for pentachlorophenol, for example [101]. Concentrations above 1000 ng/L have also been reported for compounds such as 4-chloro-2-methylphenol and mecocrop in Ireland [90] and BPA in France [79], reaching 7400 ng/L. In other words, these compounds are present in the environment at concentrations below the LDs that many techniques achieve.
Several environmental and methodological factors have been shown to exert a significant influence on the outcomes of analytical procedures. These factors encompass conditions related to the collection, storage and handling of samples. The selection of extraction methodology (e.g., LLE, SPE, or SPME), solvents and chromatographic parameters can also have a significant impact on outcomes. To minimize such variability, researchers must adhere to strict protocols, including the use of appropriate containers (e.g., amber glass bottles for organic compounds), maintaining refrigeration until extraction and employing basic laboratory quality control practices (e.g., using properly decontaminated materials).
Furthermore, adherence to method validation procedures is essential to ensure data reliability. Such procedures include calibration curves, precision and accuracy testing, determination of LD and LQ, recovery studies and the use of certified reference standards. Despite the fact that analytical methods are designed to standardize results, a certain degree of dependence on operator skill remains, particularly during sample preparation and extraction steps. Consequently, the implementation of comprehensive training programs and the execution of reproducibility checks are of paramount importance.
In addition to analytical performance, economic and operational factors constitute crucial considerations in the selection of techniques for the monitoring of phenolic compounds in groundwater. While methods such as LC-MS/MS and GC-MS/MS offer high sensitivity and selectivity, they require expensive instrumentation, specialized laboratory infrastructure and highly trained personnel. These constraints can significantly limit their application in contexts where resources are limited, particularly in countries of the Global South.
Conversely, less sophisticated configurations, such as standard GC or LC systems, though less sensitive, are more economically accessible and may be suitable for routine analyses or preliminary screening, especially in regions with limited analytical infrastructure. The extant literature illustrates this distribution, with advanced techniques more commonly associated with institutions and countries that possess greater financial and technical capacity. Consequently, the selection of analytical methods involves, among other aspects, a balance between technical rigor and financial or logistical feasibility, an aspect that is particularly relevant for environmental monitoring programs and evidence-based public policy planning in under-resourced areas.

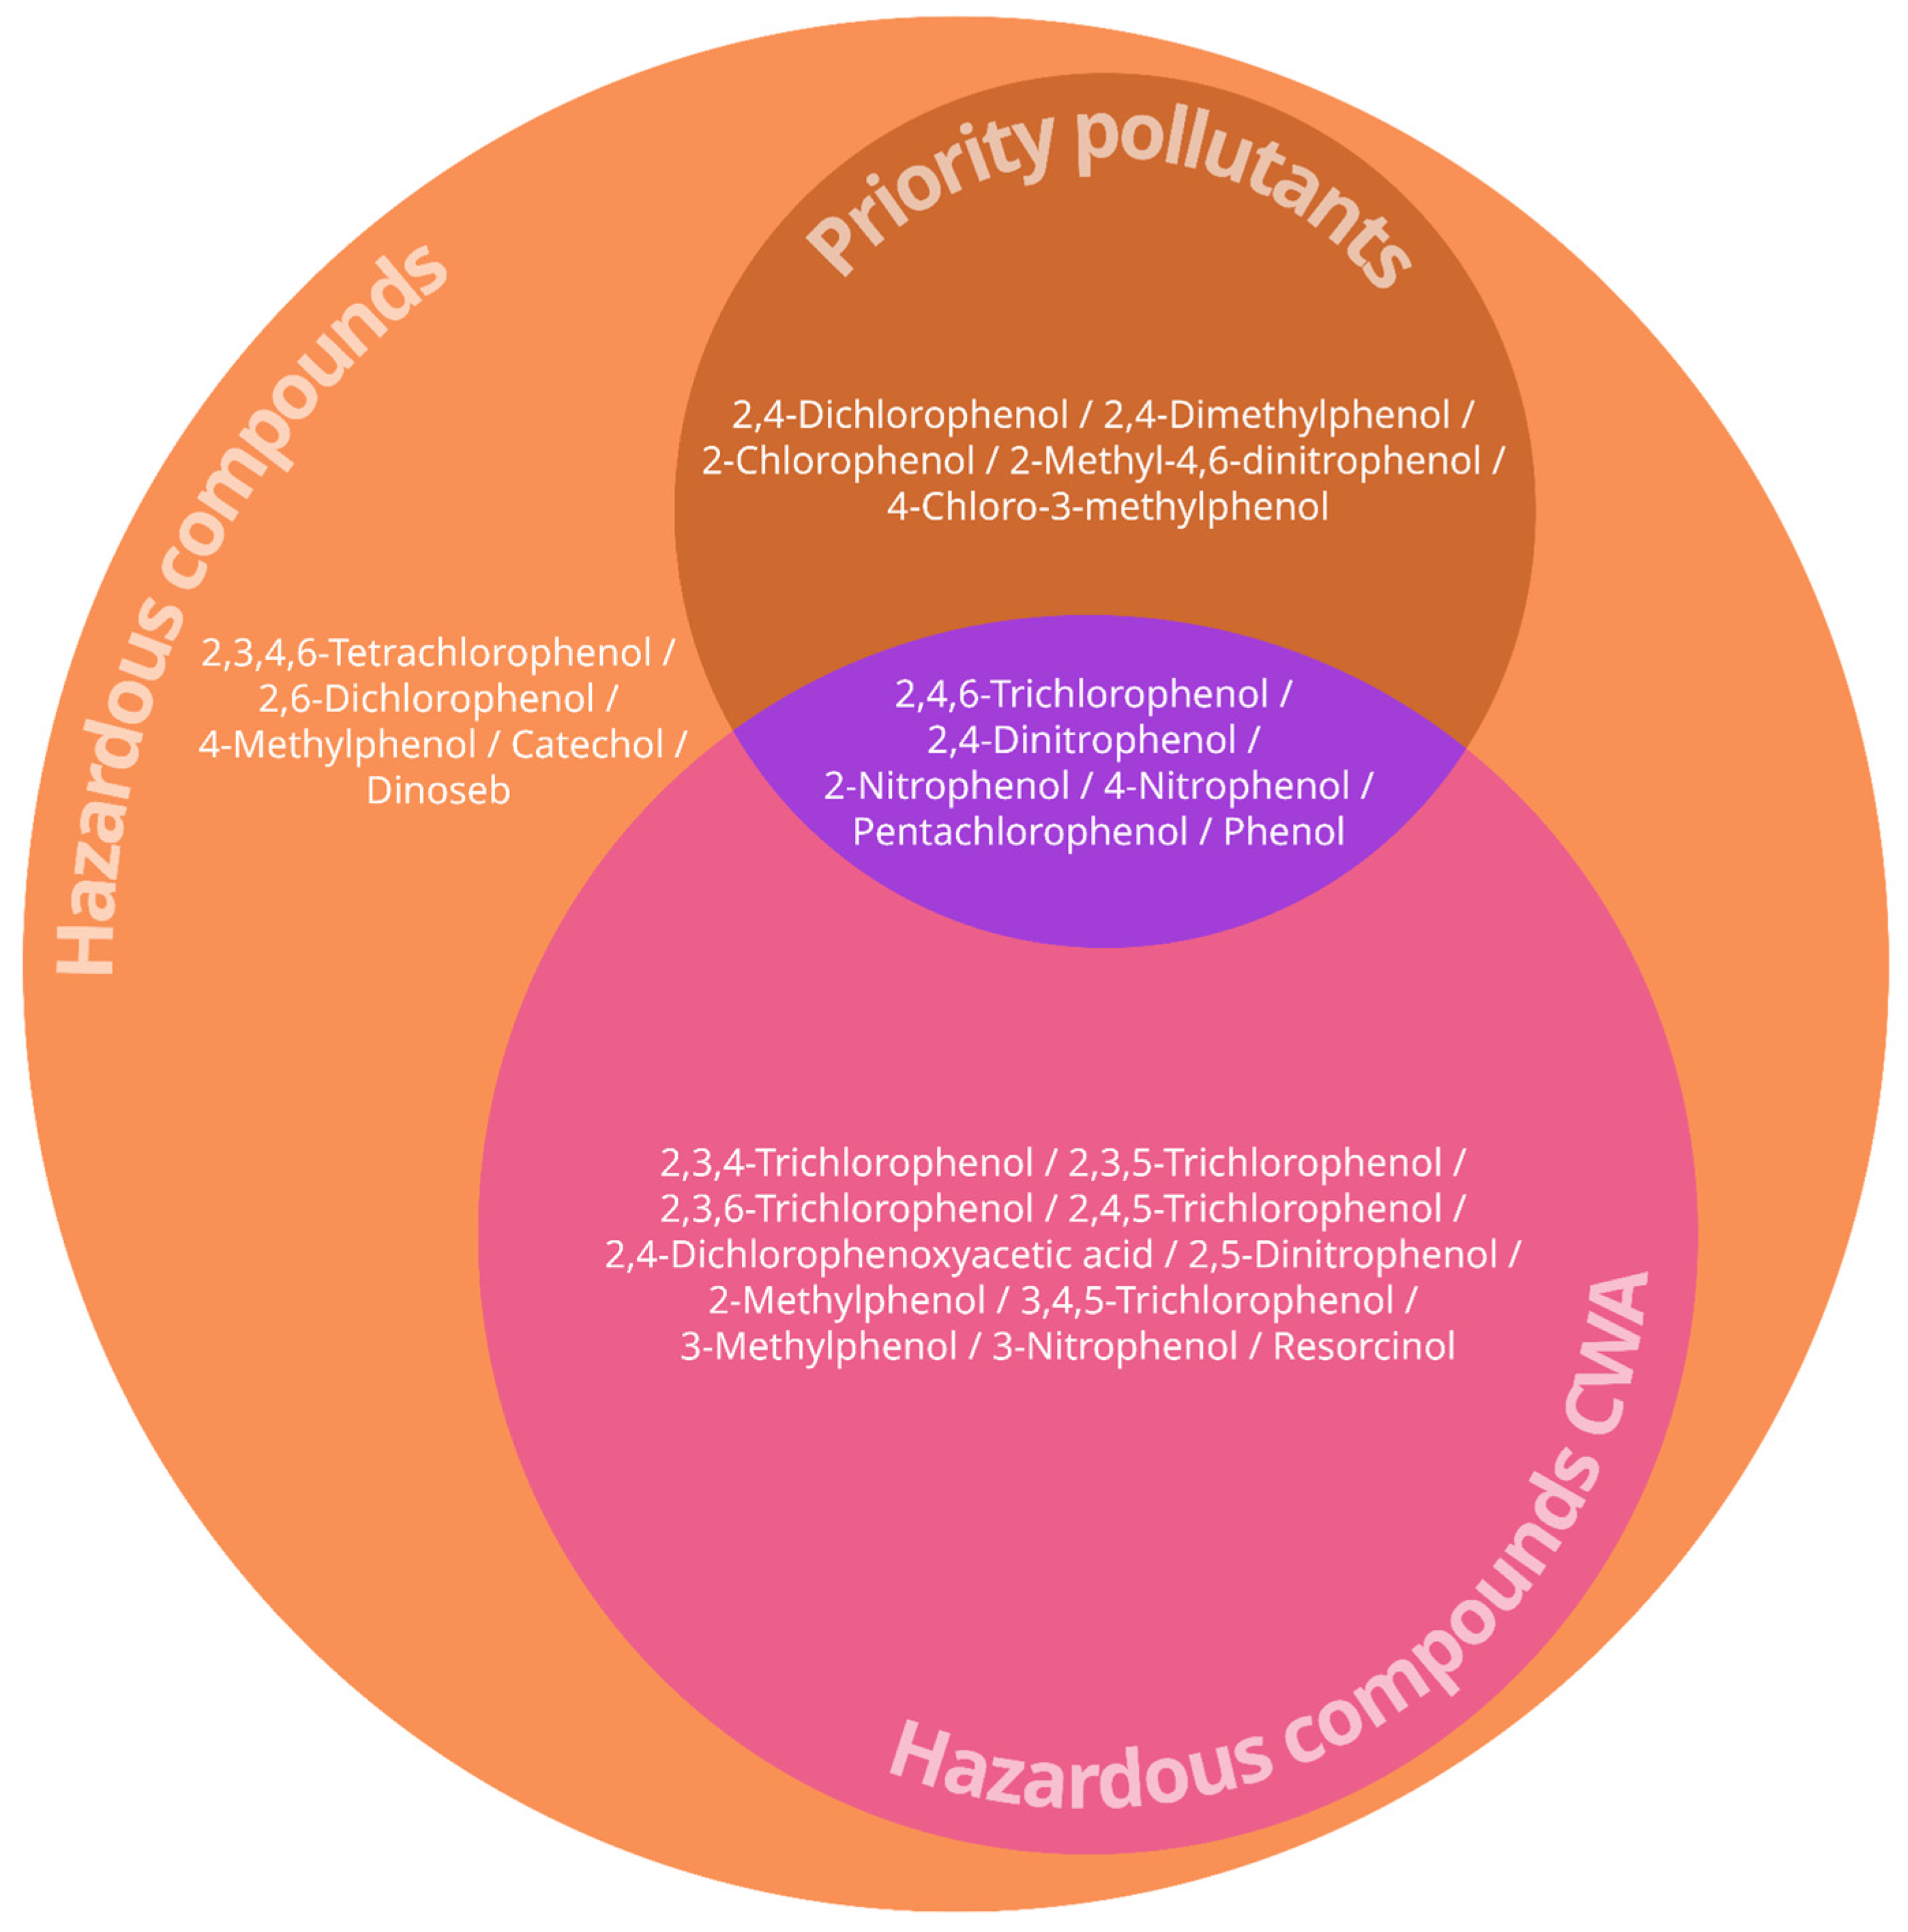
3.3. Priority Pollutants and Hazardous Compounds Identified in Contaminated Groundwater

In the 52 studies reviewed, 107 specific phenolic compounds were identified. These substances were classified based on the regulations set out in Parts 116, 302, and 423 of the 40 CFR [44,46,47], to determine the substances of greatest concern, to allow for a more consistent risk assessment. A total of 27 of the 107 phenolic compounds are classified as hazardous substances (40 CFR Part 302) [46]. Among these 27 substances, 17 compounds are also regulated as hazardous under the CWA (40 CFR Part 116) [44], and 11 are additionally designated priority toxic pollutants (40 CFR Part 423) [47] (Figure 6).
The identification and classification of phenolic compounds contribute to understanding the danger they pose to groundwater quality. In addition, this classification enables a more precise assessment of the risks to the environment and the health of the population. Evidence of potential and actual risks was found, especially for compounds that are classified simultaneously in the three regulations analyzed from 40 CFR (Figure 7). The Supplementary Material details the risks for the 27 compounds identified in the studies and classified as hazardous substances (Table S4—Supplementary Material).
The compounds 2,4,6-trichlorophenol, 2,4-dinitrophenol, 2-nitrophenol, 4-nitrophenol, pentachlorophenol, and phenol are regulated as hazardous in three concurrent lists of the 40 CFR. Part 423 of the CFR [47] sets out the substances that should receive priority consideration in the development of effluent limitation guidelines. This regulation is in line with the Clean Water Act (CWA), provided for in Part 304(b) [107], which establishes criteria and guidelines for the control of pollutants to protect water quality in the USA. Part 116 designates hazardous substances that may pose an imminent risk to human health and aquatic life [44], while Part 302 [46] lists the substances that must be monitored in domestic and industrial effluents and that may affect the quality of the receiving bodies of water. 2,4,6-trichlorophenol and pentachlorophenol belong to the class of chlorinated phenols, are extremely toxic and can cause cancer; these substances are widely used in pesticide and herbicide formulations, with pentachlorophenol being restricted to certified consumers [38,117].
In the USA, 2,4-dinitrophenol was widely used in the 1930s to treat obesity; a few years later, in 1938, its use was discontinued due to its relationship with several fatalities and the occurrence of cataracts. It is currently used in herbicide, fungicide and insecticide formulations [118]. In addition, 2,4-dinitrophenol can be formed by the nitrification of 2-nitrophenol and 4-nitrophenol. Nitrophenols are pollutants with mutagenic potential and are widely present in the atmosphere. As they are the most abundant compounds in rainwater, they cause concern due to their phytotoxic activities and ability to penetrate plant tissues and enter aquatic environments [119]. In industry, nitrophenols are intermediates to produce dyes, pigments, pharmaceuticals, rubber components, photographic components and pesticides, including fungicides and wood preservatives [120]. Phenols are widely used in various personal care products, cleaning products, paints and waxes, among others. Even in low concentrations, due to their easy availability in these products, care should be taken with their exposure [111].

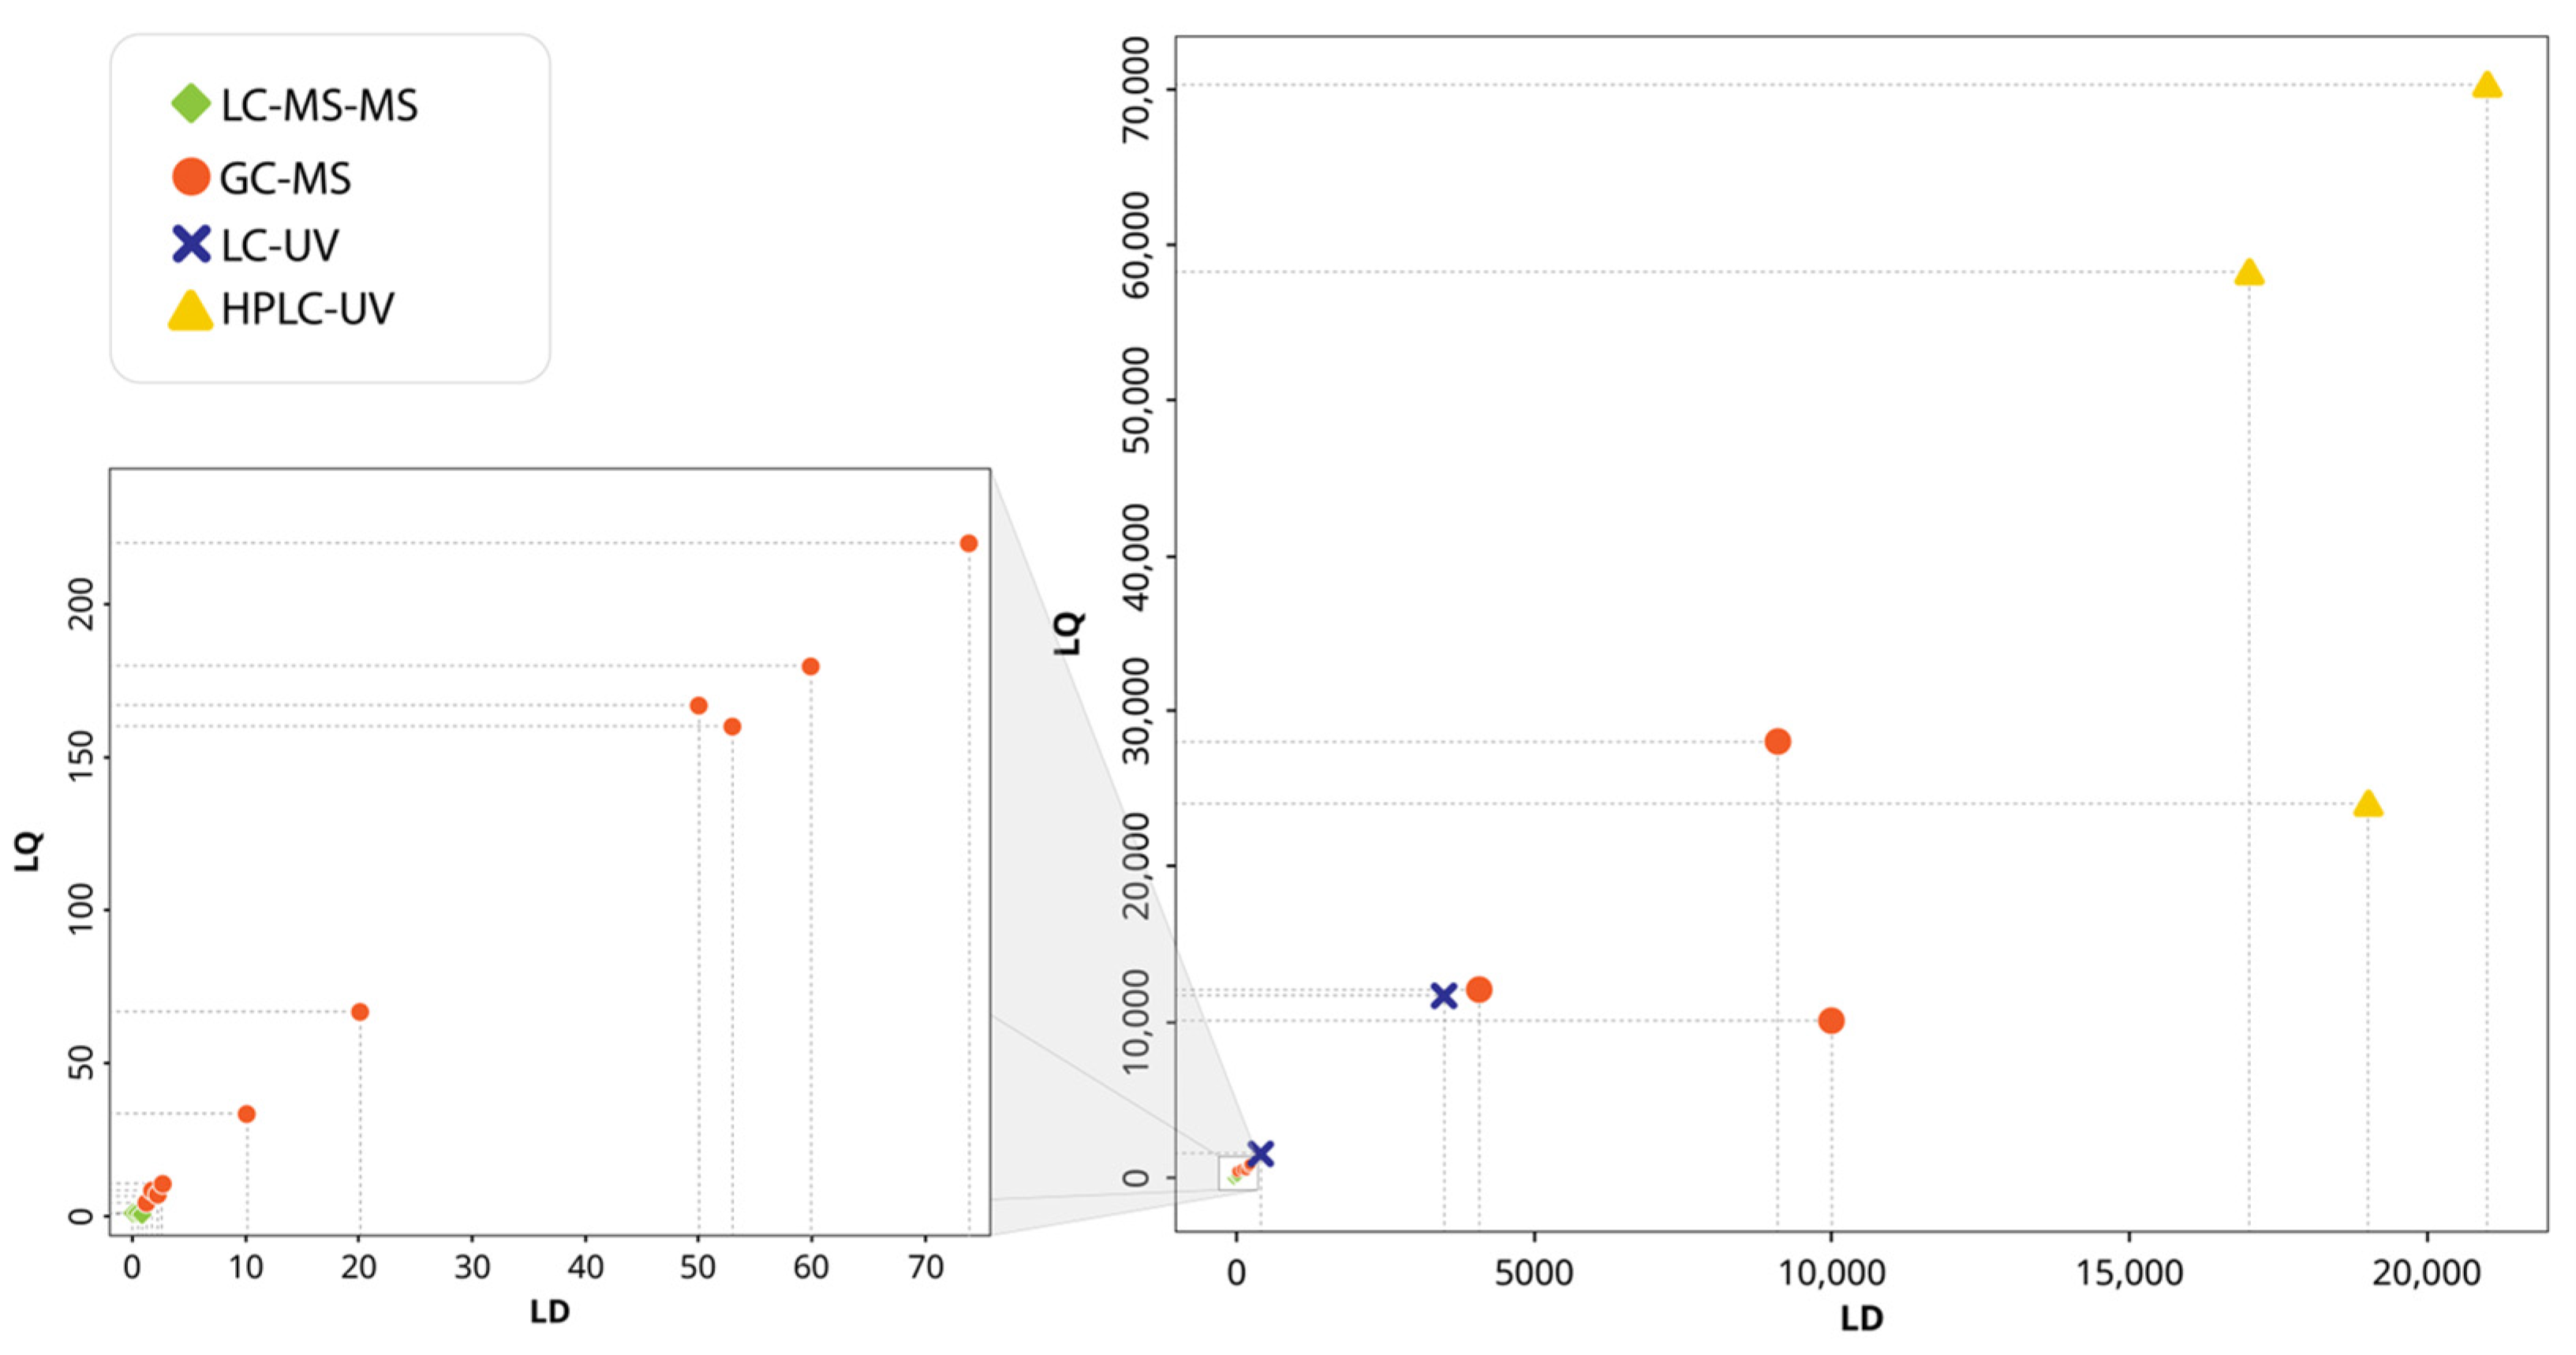
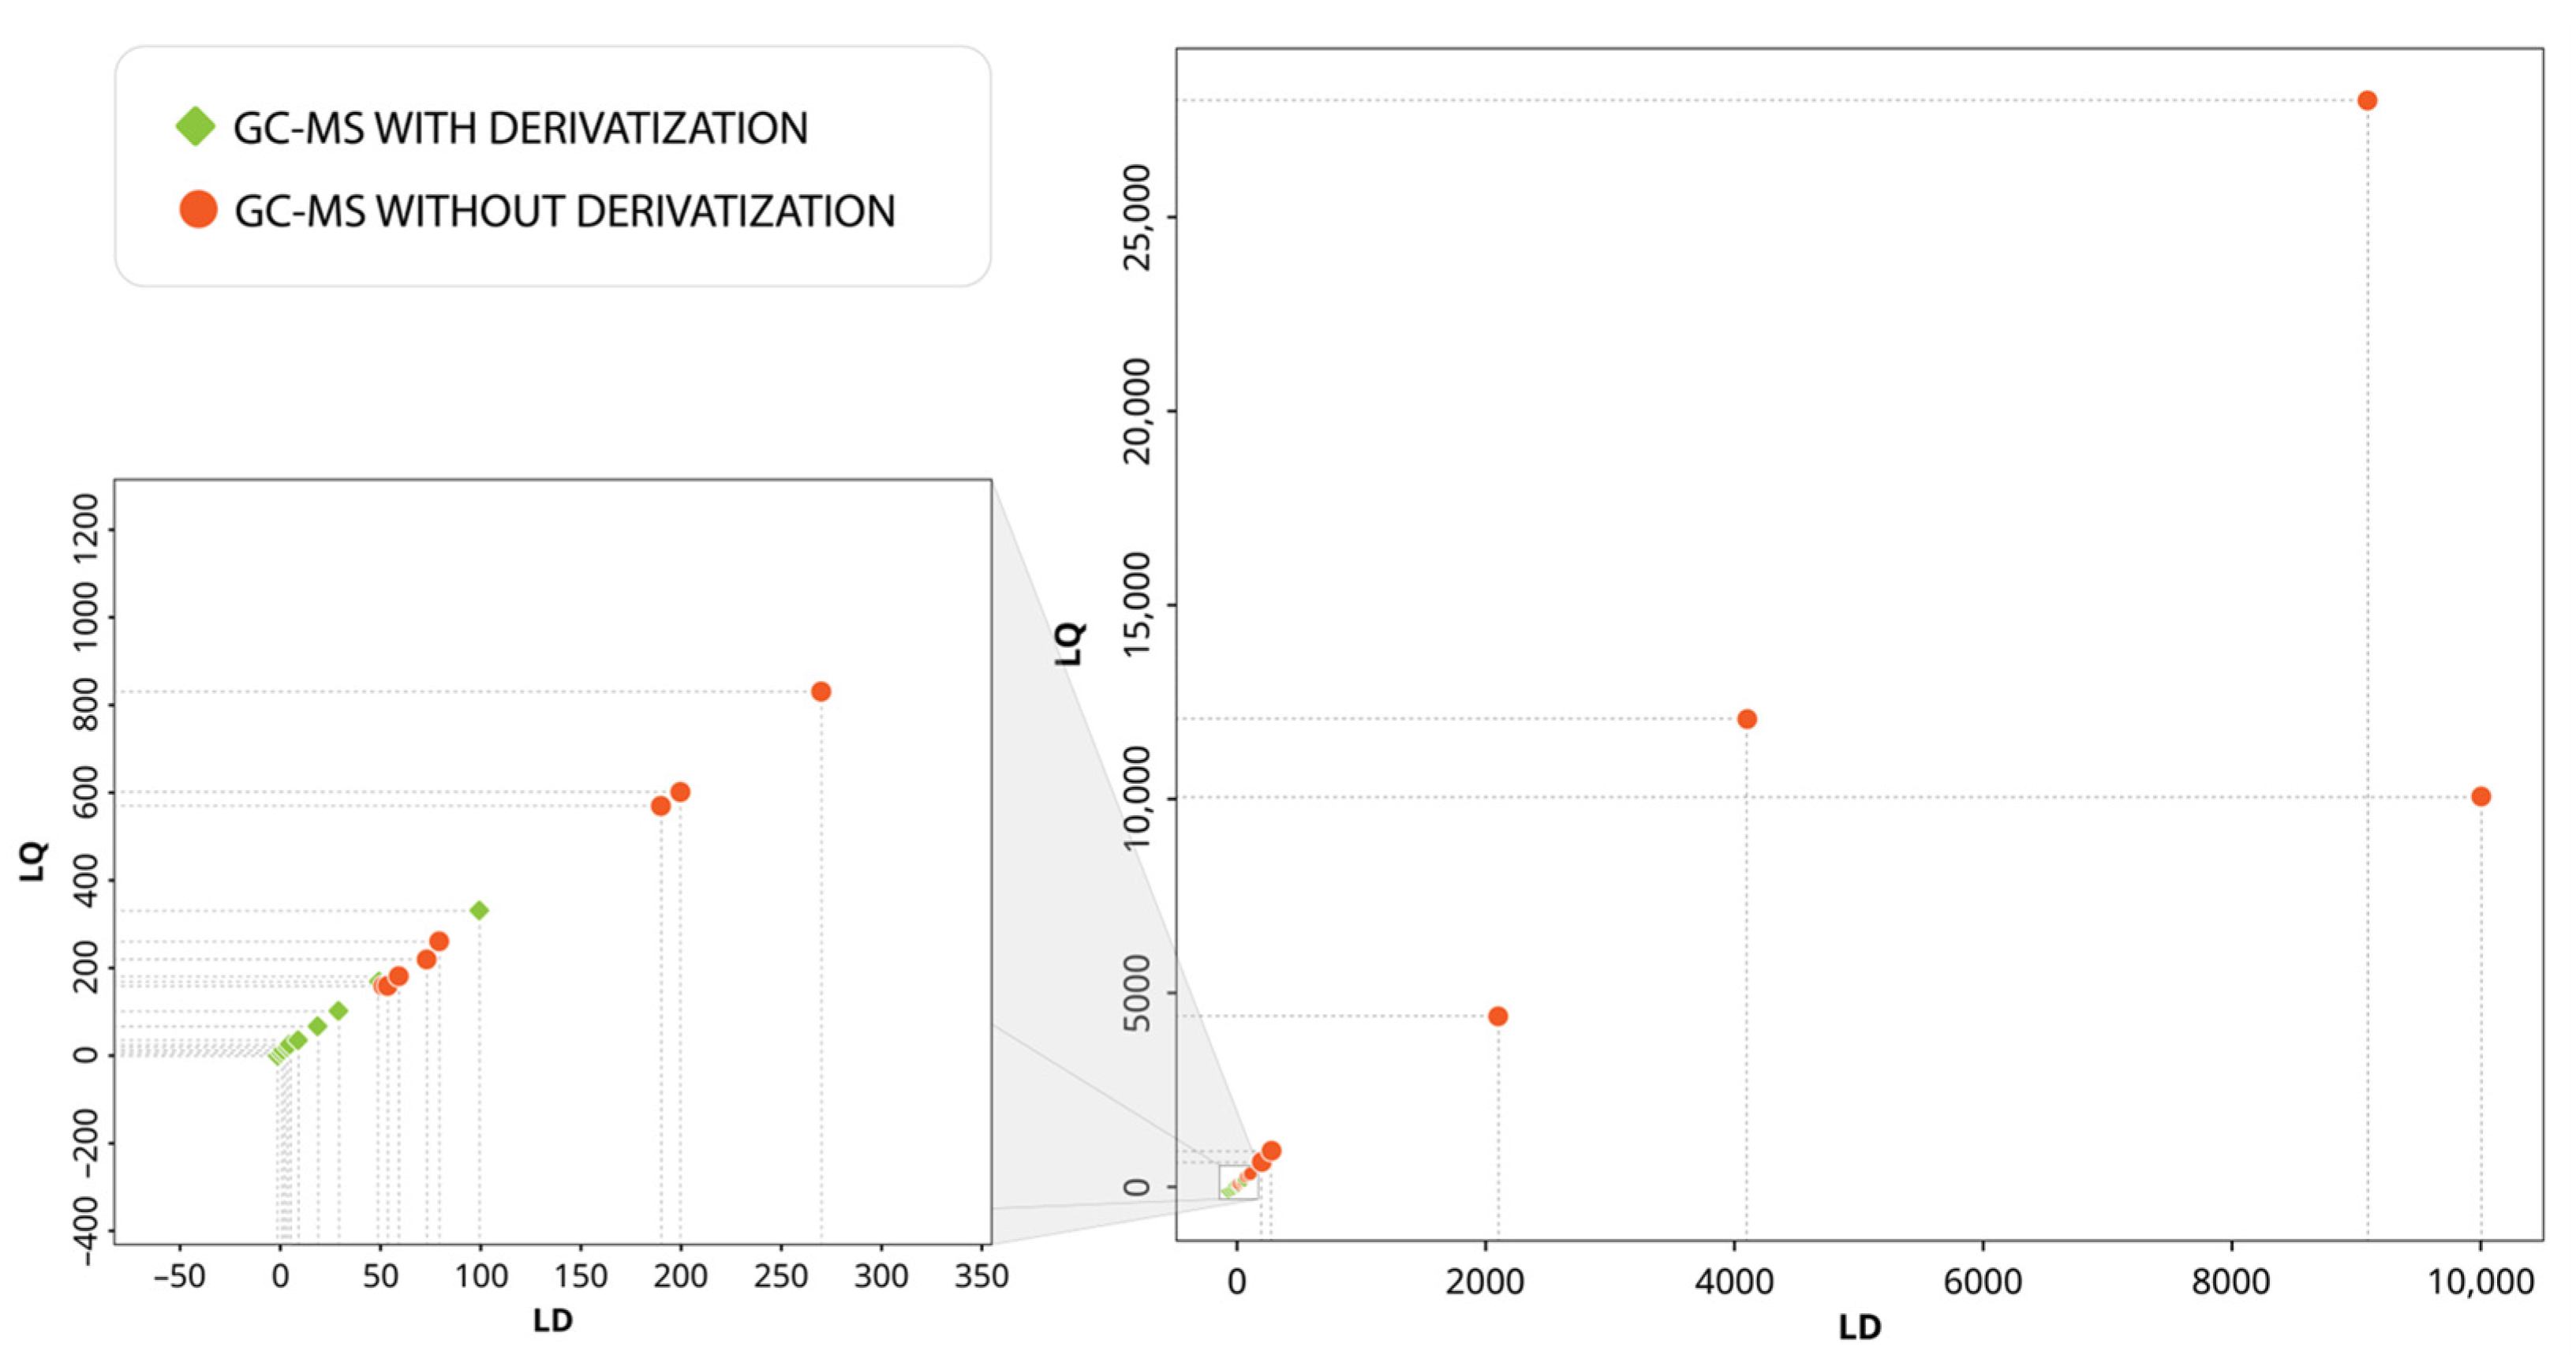
3.4. Performance of Analytical Techniques for the Detection and Quantification of Priority Phenolic Compounds in Groundwater

In a specific investigation conducted for the priority compounds observed in this research, studies that simultaneously presented LQ and LD data were selected for analysis of the sensitivity of the techniques, comparison between methods and their relevance for monitoring contamination.
The visualization of the LD and LQ for the priority compounds shows significant differences depending on the analytical technique used (Figure 8). The main graph (right) covers a wide range of values and demonstrates the separation between the groups of points, suggesting that the GC-MS and HPLC-UV analytical techniques tend to result in LD and LQ values that are considerably higher than those observed with other techniques.
The secondary graph (left) highlights the low concentration range, where LC-MS/MS and GC-MS have their lowest limits, highlighting the sensitivity of these methods compared to LC-UV and HPLC-UV, which operate in a much higher detection range. In particular, the LC-MS/MS technique generally shows greater sensitivity, with lower values for both LD and LQ in this subset of data. As an example, a study conducted with 42 groundwater samples collected from various locations in Ireland had detection limits between 0.08 and 4.7 ng/L for the 18 analytes evaluated, with all compounds detected below the limits of 0.1 ng/L allowed in EU drinking water legislation [90]. The secondary graph also shows the distribution of some GC-MS points, suggesting greater variability in detection and quantification limits. GC-MS reported values ranging from close to zero [64] to the higher values highlighted in the primary graph (right) [84]. This variability may be the result of different operating conditions and/or the use of different sample preparation techniques to be analyzed by GC-MS.
Derivatization is the process of transforming an analyte so that it is detectable in instrumental analytical methods and, specifically, in GC. The technique makes it possible to improve aspects of GC by adapting compounds so that they can be analyzed, producing good resolution, peak symmetry of the compound and detectability because of the interaction between the analyte and the GC detector. The derivatization reagent is the substance used to chemically modify a compound to produce a new compound with properties suitable for GC analysis [121].
Derivatization has been employed as an additional technique to extraction techniques in studies conducted in Cape Cod in Massachusetts, USA [64], Zeitz, Germany [80], Tiszaug and Budapest, Hungary [89], Rosário do Catete, Brazil [104], Dongying, China [100], Ibadan, Nigeria [102], western parts of Slovakia [56] and the northeast region of Poland [94] (Figure 9).
The use of GC-MS without derivatization resulted in higher LD and LQ values compared to the use of derivatization, which may suggest a lower capacity of the method to detect and quantify phenols at low concentrations [73,84,92]. Because of this, greater dispersion was observed in the values obtained without derivatization compared to studies with derivatization, which may indicate greater variability in the performance of the technique for different phenolic compounds. In contrast, reduced LQ and LD values have been reported with the use of derivatization [64,89], with evidence of an improvement in the analytical efficiency of the method. This behavior can be explained by the greater volatility and thermal stability of phenolic derivatives, with reduced interference and increased detector sensitivity.
The findings reinforce that derivatization in GC-MS is an efficient technique for reducing detection and quantification limits, making a significant contribution to the analysis of phenolic compounds in groundwater, especially for monitoring trace levels. Among the derivatization reagents used are BSTFA (bis(trimethylsilyl)trifluoroacetamide) with TMCs at different concentrations [64,100,104] and trimethylsilyl-N,N-dimethylcarbamate (TMSDMC) [89]. Both reagents revealed the technique’s ability to optimize the detection and quantification of a wide variety of phenols, chlorophenols, alkylphenols, ethoxylates, and bisphenols.
When evaluating the influence of different derivatization reagents on the determination of LD and LQ in the analysis of phenolic compounds by GC-MS, it was observed that the choice of derivatizer directly affects analytical sensitivity (Figure 10).
The reagents examined, BSTFA + 1% TMCS, BSTFA + 10% TMCS and TMSDMC, showed a positive (and expected) correlation between LD and LQ, since LQ is, by definition, a higher value than LD.
BSTFA + 1% TMCS [100] and BSTFA + 10% TMCS [64] showed very similar results, with close LD and LQ values, especially for lower concentrations of the phenolic groups: chlorophenols, biphenols, alkylphenols, nitrophenols and bisphenols. This suggests that varying the percentage of TMCS between 1% and 10% when using BSTFA does not have a significant impact on the sensitivity of the technique for most of the compounds analyzed. However, for one of the compounds in the alkylphenol ethoxylates group, the use of BSTFA + 10% TMCS resulted in a considerably higher LD and LQ [64].
On the other hand, TMSDMC showed values for some compounds from the alkylphenol and phenol groups that were very similar to BSTFA but also had much higher LD and LQ values, especially for chlorophenol concentrations [89], which indicates a lower analytical sensitivity when compared to BSTFA-based reagents. The difference in performance is more pronounced at higher concentrations.
Studies have demonstrated the effectiveness of GC-MS in determining phenolic compounds using, for example, different sample preparation methods. Liquid–liquid extraction (LLE) [55,58,60,93,100,102], solid-phase extraction (SPE) [58,59,65,66,67,68,69,70,75,76,78,79,82,83,85,86,88,89,90,91,93,97,98,99,101,103,104,105], liquid-phase microextraction (LPME) [92,96] and stir bar sorptive extraction (SBSE) [80] have been reported. Membrane-assisted solvent extraction (MASE) [81], solid-phase microextraction (SPME) [77,78,84], closed-loop strip analysis (CLSA) [71], derivatization [54,62,64,80,89,100,102,104] and other approaches have also been used.
The GC-MS technique with derivatization has been optimized for the determination of alkylphenols, alkylphenol ethoxylates and bisphenols [64,100,102,104]. Derivatization is also convenient for the simultaneous determination of a wide variety of phenols and chlorophenols [80,89].
These checks not only help to evaluate the performance of different analytical techniques but also help to select the most suitable technique according to the specific needs of each investigation. In addition, the analysis of data dispersion suggests that the choice of analytical technique can have a significant impact on the ability to detect and quantify priority compounds at low concentrations.
Determining the efficiency of extraction techniques is also a critical factor when examining phenols in groundwater environmental matrices, as it directly influences the accuracy and reliability of the results. Thus, the recovery (%) of an analyte reflects the ability of the extraction method to isolate the compound of interest in the matrix without significant losses or interferences that could compromise its quantification.
For the studies that reported priority phenolic compounds, which simultaneously presented LD and LQ data and did not employ derivatization [90,92,96,101,103], different extraction approaches combined with different analytical techniques were compared (Figure 11).
The three concentric rings represent the efficiency of the extraction techniques in the recovery (%) of priority phenolic compounds. The extraction techniques (inner ring) were used to isolate the phenolic compounds from the environmental matrix before analysis and included LPME, SPE and online SPE. Different coupled analytical techniques (middle ring) were used for the identification and quantification of the extracted compounds (LC-MS/MS; GC-MS; LC-UV and HPLC-UV), while the recovery efficiency per compound (outer ring) displays the percentage recovery for each priority phenolic compound, associated with a given combination of extraction and analysis.
The SPE-LC-MS-MS technique demonstrated high efficiency in the extraction of 2,4-dichlorophenol (99% recovery) [85], while in the SPE (online)-LC-MS/MS technique, pentachlorophenol and 2,4-dinitrophenol showed lower efficiencies (60%) [101].
The results of the LPME-GC-MS technique showed good efficiency, with recoveries of 94.75% for 2,4,6-trichlorophenol, 91.39% for 2,4-dichlorophenol and 101.31% pentachlorophenol [92]. Although pentachlorophenol showed a recovery of slightly more than 100% [92], as this response can be attributed to small experimental variations or matrix interferences, further investigation is recommended.
With recoveries that varied significantly between the compounds analyzed, 89.60% for phenol and 116.20% for 2,4-dimethylphenol [96], the LPME-LC-UV technique also showed recovery above 100% for 2,4-dimethylphenol [96], which suggests further investigation due to the possibility of interferents or errors in quantification.
The SPE-HPLC-UV technique showed high efficiency in the recovery of phenol (92.2%) and good efficiency in the recovery of 2,4-dinitrophenol (86%) and 2,4,6-trichlorophenol (75.2%).
When examining the maximum concentrations of priority compounds identified by country, phenol was quantified at 40,000,000 ng/L using GC-MS in landfill monitoring in the USA [63] (Figure 12).
Maximum concentrations of 35 ng/L were obtained for 2,4-dichlorophenol and 26 ng/L for pentachlorophenol in Cape Cod, Massachusetts, associated with contamination by urban effluents [64].
In Germany, for example, in addition to phenol in high concentration (866,140 ng/L), high concentrations of 2,4-dimethylphenol (304,010 ng/L), 2,4,6-trichlorophenol (216,200 ng/L), 4-chloro-3-methylphenol (113,910 ng/L), 2-chlorophenol (79,740 ng/L) and pentachlorophenol (79,500 ng/L) have also been reported [81]. For these results, GC-MS and membrane-assisted solvent extraction (MASE) were used, without the need for derivatization or complex sample preparation for extraction [81] (Figure 12).
As water is key to achieving sustainable development, peace, and prosperity [6], its integrated management is central to both the governance of the resources worldwide and the implementation of the 2030 Agenda [122]. Progress towards achieving the SDG may be severely constrained by the continued decline of nature [123,124,125], especially considering that more than half of the 169 SDG targets are dependent on nature for their achievement [125]. Thus, the depletion of natural resources jeopardizes human well-being and adds to the list of challenges to be overcome, especially in terms of water scarcity and its costs both for people and for maintaining the ecosystems that sustain life [4].
In this context, the establishment of regulations, robust indicators and continuous monitoring of water resources play a fundamental role, especially for groundwater. Despite their importance for human supply and ecosystems, aquifer systems remain invisible [9,126] and subject to overexploitation and contamination, particularly by phenolic compounds.
Indications have been found that the adoption of advanced analytical techniques makes it possible to detect and quantify these contaminants sensitively, contributing to the formulation of evidence-based public policies for the protection and monitoring of aquifer systems. However, to advance its implementation, especially in the Global South, international scientific and technical cooperation can play a strategic role in the sharing of knowledge. This perspective is fundamental for tackling the cumulative legacy of Euro-American colonialism, imperialism, and capitalism and the resulting socioeconomic, political and geographical inequalities [5].
In Nigeria, for example, although groundwater is essential for supplying rural areas and is vulnerable to several vectors, there have been few studies examining the level of EDs [102]. In Brazil, the vulnerability of water sources and supply systems to EDs has highlighted the importance of including these compounds in national controls to guarantee quality water supply for the population [104].
The expansion of advanced analytical technologies, especially in remote locations, can also be limited by the short-term stability of substances during transportation, temperature control from the sampling point to the analytical laboratory and the stability of target substances under laboratory conditions [79]. These difficulties become even more relevant in countries, cities and regions where laboratory infrastructure and research investments are more restricted, especially in locations in the Global South.

4. Limitations of the Study

Twenty-three percent of the studies were not analyzed because they did not specify the study site, because they dealt with simulated scenarios or synthetic waters or because they identified phenolic compounds without quantifying them, even using spectrometric and chromatographic techniques, which may represent a bias in the research results. In addition, the databases selected for the research, as well as the descriptors used, can carry some bias, possibly reducing the representativeness of the sample.
Keyword co-occurrence analysis may also be limited by terms that were not attributed to the authors or were absent from the documents evaluated.
Another possible restriction refers to the heterogeneity in data reporting between the included studies, which made direct comparison and meta-analysis of the results difficult, specifically concerning parameters such as LD, LQ, recovery percentage (%) and derivatization, among others.
As environmental, operational and methodological factors have been demonstrated to influence analytical results, it can be assumed that the authors of the studies reviewed took the necessary precautions to ensure the robustness and credibility of their analytical procedures. Nevertheless, not all of the articles reviewed explicitly mentioned whether full validation was carried out or whether standardized protocols, especially for manual steps, were adopted.
Although priority was given to articles in English, Portuguese and Spanish, which are languages in which the research team has technical mastery, only 4% (N = 14) of the total studies retrieved (N = 342) were in other languages. Thus, the possible exclusion of works from this set is unlikely to introduce significant bias in the sample. Even so, this limitation could restrict the inclusion of any studies published in other languages, including those from regions under-represented in the global scientific literature. Similarly, the other eligibility criteria adopted may also have favored the inclusion of studies predominantly conducted in the Global North, which would result in a possible socioeconomic bias.
The inconsistent terminology of phenolic compounds (use of synonyms) may have affected the sensitivity of the search. Thus, it is possible that studies were not identified due to variability in the nomenclature used. Although this review was conducted according to the PRISMA 2020 guidelines, it was not prospectively registered. However, all methodological steps were documented to ensure the transparency of the research and its reproducibility.

5. Conclusions

This review covered a broad period of approximately 40 years of research (1984 to 2023), despite the low number of eligible studies. The temporal evolution of the publications analyzed suggests an increase in concern about groundwater contamination by phenolic compounds over the years. In addition, the socioeconomic scope of the research has widened, with countries in both the Global North and South, although scientific production has been more expressive in the former.
The studies highlighted the diversity of analytical techniques used in the detection and quantification of phenolic compounds, with differences in their sensitivity, resolution and suitability for a given class of chemical compounds. Among the methods identified, LC-MS and LC-MS/MS stood out as the main analytical approaches, with extremely low detection limits (LD) and quantification limits (LQ) in the ng/L range. GC-MS, in turn, proved to be competitive when associated with derivatization with BSTFA + TMCs before analysis. In addition, in terms of sample preparation methods, liquid-phase extraction (LPE) was the most widely used technique, with satisfactory recovery rates.
The lack of specific regulations for phenolic compounds in aqueous matrices at a global level, especially in groundwater, reinforces the urgent need for national regulatory agencies to define maximum permissible limits. In addition, these regulations should cover a comprehensive number of phenolic compounds, particularly those classified as hazardous, since concentrations over 1000 ng/L have been reported in several studies, reaching a maximum concentration of 50 × 106 ng/L.
The main contributors to the presence of these contaminants in the aquifer systems investigated include domestic and industrial wastewater, as well as pesticides with phenolic compounds in their formulation. This scenario represents a significant challenge for achieving SDG 6, which aims to guarantee the availability and sustainable management of water and sanitation for all. Furthermore, considering the interdependence of the goals set out in the 2030 Agenda, the implementation of coordinated efforts to achieve them in full is both desirable and necessary.
From a practical point of view, the implementation of advanced analytical techniques, especially in countries of the Global South, must be accompanied by strategies that ensure operational viability and equitable access to these technologies, given the structural, logistical and financial challenges that can hinder their adoption. Evidence from this research also highlights the importance of carefully selecting analytical methods for determining phenolic compounds in groundwater. Knowledge about the efficiency and limitations of different techniques can guide the choice of the best approaches for early detection of contamination.
In addition to the technical evaluation, the identification and quantification of the risk associated with phenolic compounds, based on the regulations established by reference agencies, are fundamental for prioritizing areas of intervention, establishing safety limits and subsidizing strategic decisions in cases of contamination.
In terms of public policy, it is advisable to establish stricter and more harmonious regulatory standards between different countries, as well as encourage technology transfer and partnerships, including international ones, to strengthen local capacities for monitoring and mitigating contamination. The implementation of funding mechanisms aimed at laboratory modernization and the development of national monitoring programs is essential. Likewise, promoting research and innovation in new analytical techniques and specialized technical training is indispensable for training highly qualified human resources and for disseminating good practices in sustainable groundwater management.
Finally, the search for more sensitive analytical methods for detecting phenolic compounds in low concentrations represents a promising area for future research. Technological and scientific advances in this area could contribute to more accurate monitoring and the development of innovative remediation techniques for the preservation and recovery of contaminated aquifers.

Supplementary Materials

The following supporting information can be downloaded at: https://www.mdpi.com/article/10.3390/w17081173/s1, Table S1: 52 unified records: 23 from Scopus only, 8 from WoS only and 21 studies indexed in both databases; Table S2: Authors’ keywords incorporated into the same label for co-occurrence analysis—Synonym Table for VOSviewer; Table S3: Bibliography on the presence of phenolic compounds in groundwater identified and quantified by chromatographic and spectrometric analytical techniques; Table S4: Characteristic of the 27 Hazardous compounds classified with 40 CFR-Part 302; Table S5: Toxicity and Environmental Regulations classification of the 27 Hazardous compounds; Table S6: Classification of studies that used Derivatization with GC-MS analytical technique; Table S7: Comparison of the efficiency of extraction techniques that did not use derivatization to analyze priority compounds.

Author Contributions

Conceptualization, G.V.S.-C.-M., E.A.R. and O.V.B.; Methodology, G.V.S.-C.-M., D.R.A.-P., E.A.R., D.A.d.A. and O.V.B.; Software, D.R.A.-P.; Validation, G.V.S.-C.-M., J.I.O. and E.A.R.; Formal analysis, G.V.S.-C.-M., D.R.A.-P., J.I.O. and E.A.R.; Investigation, G.V.S.-C.-M., J.I.O., D.R.A.-P. and E.A.R.; Resources, D.R.A.-P., E.A.R., D.A.d.A. and O.V.B.; Data curation, G.V.S.-C.-M., J.I.O., D.R.A.-P. and E.A.R.; Writing—original draft preparation, G.V.S.-C.-M., J.I.O. and E.A.R.; Writing—reviewer and editing, G.V.S.-C.-M., J.I.O. and E.A.R.; Visualization, G.V.S.-C.-M., J.I.O., D.R.A.-P. and E.A.R.; Supervision, E.A.R.; Project administration, G.V.S.-C.-M. and E.A.R.; Funding acquisition, D.A.d.A. and O.V.B. All authors have read and agreed to the published version of the manuscript.

Funding

This research was funded by “Coordination for the Improvement of Higher Education Personnel” (CAPES, 01). The APC was funded by TVGD Holding.

Data Availability Statement

All the data are available in the manuscript and its Supplementary Materials.

Acknowledgments

We thank Luisa Sadeck for her support in the illustrations. During the preparation of this manuscript, the authors used GPT (OpenAI, GPT-4, 2025 version) to support graphical structure definitions, and assist in the generation of initial drafts for figures and graphics summaries. The authors have reviewed and edited the output and take full responsibility for the content of this publication.

Conflicts of Interest

The authors declare no conflicts of interest. The funders had no role in the design of the study; in the collection, analysis, or interpretation of data; in the writing of the manuscript; or in the decision to publish the results.

Abbreviations

The following abbreviations are used in this manuscript:
µg/LMicrogram per Liter;
1H NMRProton Nuclear Magnetic Resonance;
2,4,6-TBP2,4,6-Tribromophenol;
2,4-MCP4-chloro-2-methylpenol;
APsAlkylphenols;
A-SPEAdmicellar Solid-Phase Extraction;
BPABisphenol A;
BSTFABis(trimethylsilyl)trifluoroacetamide;
C18Octadecyl;
CASChemical Abstracts Service;
CERCLAComprehensive Environmental Response, Compensation and Liability Act of 1980;
CFRCode of Federal Regulations (United States);
CGGas Chromatography;
GC-MSGas Chromatography;
CLSAClosed-Loop Striping Analysis;
CWAClean Water Act;
DBPDibromophenol;
DCMDichlorometano;
DOMOverseas Departments;
DSDGDivision for Sustainable Development Goals;
ECEurope Commission;
ECsEmerging Contaminants;
ECDElectron Capture Detector;
EDsEndocrine Disruptors;
EDCsEndocrine-Disrupting Chemicals;
FIDFlame Ionization Detector;
GCGas Chromatography;
GC-ECDGas Chromatography with Electron Capture Detector;
GC-FIDGas Chromatography with a Flame Ionization Detector;
GC-GC-TOFMSTwo-Dimensional Gas Chromatography with Time-of-Flight Mass Spectrometry;
GC-NPDGas Chromatography–Nitrogen–Phosphorus Detector;
GC-MSGas Chromatography–Mass Spectrometry;
GC-MS/MSGas Chromatography–Tandem Mass Spectrometry;
GRUMOThe National Groundwater-Monitoring Program;
GWDThe EU Groundwater Directive;
HPLCHigh-Performance Liquid Chromatography;
HPLC-MS/MSHigh-Performance Liquid Chromatography–Tandem Mass Spectrometry;
HPLC-SPE-NMR-TOF-MSHigh-Performance Liquid Chromatography coupled to Solid-Phase Extraction and Nuclear Magnetic Resonance and Time-of-Flight Mass Spectrometry;
IAGGenerative Artificial Intelligence;
ICP-MSInductively Coupled Plasma Mass Spectrometry;
IPCCIntergovernmental Panel on Climate Change;
JP8Jet Propulsion;
LCLiquid Chromatography;
LC-MSLiquid chromatography–Mass Spectrometry;
LC-MS/GC-MSLiquid chromatography–Mass Spectrometry-Gas Chromatography–Mass Spectrometry;
LC-MS/MSLiquid Chromatography–Tandem Mass Spectrometry;
LC-UVLiquid Chromatography-Ultraviolet;
LDDetection Limit;
LODLimit of Detection;
LOQLimit of Quantification;
LQQuantification Limit;
LLELiquid–Liquid Extraction;
LMELiquid-Phase Micro Extraction;
LPMELiquid-Phase Micro Extraction;
LPME-GC-MSLiquid-Phase Micro Extraction–Tandem Mass Spectrometry;
LPME-LC-UVLiquid-Phase Micro Extraction-Liquid Chromatography-Ultraviolet;
MASEMicrowave-Assisted Solvent;
MIPMolecularly Imprinted Polymer;
MQLMethod Quantification Limit;
MSMass Spectrometry;
MTBEMethyl Tertiary Butyl Ether;
ng/LNanogram per Liter;
NIHNational Institutes of Health;
NLMNational Library of Medicine;
NMRNuclear Magnetic Resonance;
NMWNatural Mineral Water;
ONUOrganização das Nações Unidas;
OPFRsOrganophosphate Flame Retardants;
PFASsPerfluoroalkyl Substances;
PICoPopulation, Interest and Context;
PRISMAPreferred Reporting Items for Systematic Review and Meta-Analyses;
RRecovery (%);
RQReportable Quantity;
SBSEStir Bar Sorptive Extraction;
SDGSustainable Development Goal;
SERSSurface Enhanced Raman Spectroscopy;
SLRSystematic Literature Review;
SPESolid-Phase Extraction;
SPE-LC-MS-MSSolid-Phase Extraction–Liquid Chromatography–Tandem Mass Spectrometry;
SPE-LC-APCI-MSSolid-Phase Extraction–Liquid Chromatography Atmospheric Pressure Chemical Ionization–Mass Spectrometry;
SPE (on line)-LC-MS-MSSolid-Phase Extraction (on line)–Liquid Chromatography–Tandem Mass Spectrometry;
SPMESolid-Phase Microextraction;
SPME-GC-MSSolid-Phase Microextraction with Gas Chromatography–Mass Spectrometry;
SPWSpring Water
TBPTribromophenol;
TCLPToxicity Characteristic Leaching Procedure;
TD-SBSEThermodesorption System–Stir Bar Sorptive Extraction;
TMCSTrimethylchlorosilane;
TMSDMCTrimethylsilyl-N,N-dimethylcarbamate;
TOF-MSTime-of-Flight Mass Spectrometry;
TRIToxics Release Inventory;
UNUnited Nations;
UPLCUltra-Performance Liquid Chromatography;
UPLC-MS/MSUltra-Performance Liquid Chromatography–Tandem Mass Spectrometry;
UHPLCUltra-High-Performance Liquid Chromatography;
USAUnited States of America;
US CFRUnited States Code of Federal Regulations;
USEPAUnited States Environmental Protection Agency;
WHOWorld Health Organization;
WoSWeb of Science

References

  1. UN. General Assembly. Transforming Our World: The 2030 Agenda for Sustainable Development. 2015. Available online: https://www.un.org/en/development/desa/population/migration/generalassembly/docs/globalcompact/A_RES_70_1_E.pdf (accessed on 23 February 2025).
  2. UN-DSDG. Division for Sustainable Development Goals. 2025. Available online: https://sdgs.un.org/about (accessed on 23 February 2025).
  3. Huang, Z.; Yuan, X.; Liu, X. The key drivers for the changes in global water scarcity: Water withdrawal versus water availability. J. Hydrol. 2021, 601, 126658. [Google Scholar] [CrossRef]
  4. Rodrigues, E.A.; Ferreira, M.L.; de Carvalho, A.R.; Bustillos, J.O.W.V.; Victor, R.A.B.M.; Sodré, M.G.; de Andrade, D.A. Land, water, and climate issues in large and megacities under the lens of nuclear science: An approach for achieving sustainable development goal (SDG11). Sustainability 2022, 14, 13646. [Google Scholar] [CrossRef]
  5. Rodrigues, E.A.; Carvalho, A.R.D.; Ferreira, M.L.; Victor, R.A.B.M.; Luca, E.F.D.; Rocha, G.C.D.; Andrade, D.A.D. Beyond the Rising Tide: Towards Effective Climate Policy in Coastal Urban Centers. Land 2024, 13, 2071. [Google Scholar] [CrossRef]
  6. UN. The United Nations World Water Development Report 2024: Water for Prosperity and Peace; UNESCO: Paris, France, 2024; 153p, Available online: https://unesdoc.unesco.org/ark:/48223/pf0000388948 (accessed on 23 February 2025).
  7. IPCC. Summary for policymakers. In Climate Change 2023: Synthesis Report; Lee, H., Romero, J., Eds.; Contribution of Working Groups I II and III to the Sixth Assessment Report of the Intergovernmental Panel on Climate Change; IPCC: Geneva, Switzerland, 2023; pp. 1–34. Available online: https://www.ipcc.ch/report/ar6/syr/downloads/report/IPCC_AR6_SYR_SPM.pdf (accessed on 23 February 2025).
  8. Gleick, P.H.; Cooley, H. Freshwater scarcity. Annu. Rev. Environ. Resour. 2021, 46, 319–348. [Google Scholar] [CrossRef]
  9. UN. The United Nations World Water Development Report 2022: Groundwater: Making the Invisible Visible; UNESCO: Paris, France, 2022; 225p, Available online: https://unesdoc.unesco.org/ark:/48223/pf0000380721 (accessed on 23 February 2025).
  10. Li, P.; Karunanidhi, D.; Subramani, T.; Srinivasamoorthy, K. Sources and consequences of groundwater contamination. Arch. Environ. Contam. Toxicol. 2021, 80, 1–10. [Google Scholar] [CrossRef]
  11. UN-Habitat. World Cities Report 2022: Envisaging the Future of Cities; UN-Habitat: Nairobi, Kenya, 2022; 422p, Available online: https://unhabitat.org/sites/default/files/2022/06/wcr_2022.pdf (accessed on 23 February 2025).
  12. Ravindiran, G.; Rajamanickam, S.; Sivarethinamohan, S.; Karupaiya Sathaiah, B.; Ravindran, G.; Muniasamy, S.K.; Hayder, G. A Review of the Status, Effects, Prevention, and Remediation of Groundwater Contamination for Sustainable Environment. Water 2023, 15, 3662. [Google Scholar] [CrossRef]
  13. Kumar, R.; Qureshi, M.; Vishwakarma, D.K.; Al-Ansari, N.; Kuriqi, A.; Elbeltagi, A.; Saraswat, A. A review on emerging water contaminants and the application of sustainable removal technologies. Case Stud. Chem. Environ. Eng. 2022, 6, 100219. [Google Scholar] [CrossRef]
  14. Ramos, R.L.; Moreira, V.R.; Amaral, M.C.S. Phenolic compounds in water: Review of occurrence, risk, and retention by membrane technology. J. Environ. Manag. 2024, 351, 119772. [Google Scholar] [CrossRef] [PubMed]
  15. Ayad, R.; Akkal, S. Phytochemistry and biological activities of algerian Centaura an related genera. Stud. Nat. Prod. Chem. 2019, 63, 357–414. [Google Scholar] [CrossRef]
  16. Rutala, W.A.; Weber, D.J. Disinfection, Sterilization, and Control of Hospital Waste. In Mandell, Douglas, and Bennett’s Principles and Practice of Infectious Diseases, 8th ed.; Elsevier Saunders: Amsterdan, The Netherlands, 2015; Volume 2, pp. 3294–3309. [Google Scholar] [CrossRef]
  17. Silah, H.; Erkmen, C.; Unal, D.N.; Uslu, B. Sensing of phenol and chlorophenols using carbon nanotubes modified glassy carbon electrode. In Sensing of Deadly Toxic Chemical Warfare Agents, Nerve Agent Simuants, and Their Toxicologial Aspects; Elsevier: Amsterdam, The Netherlands, 2023; Chapter 13; pp. 297–329. [Google Scholar] [CrossRef]
  18. Abdollahi, M.; Hassani, S.; Derakhshani, M. Phenol. In Philip Wexler, Encyclopedia of Toxicology, 3rd ed.; Academic Press: Cambridge, MA, USA, 2014; pp. 871–873. [Google Scholar] [CrossRef]
  19. Ahmaruzzaman, M.; Mishra, S.R.; Gadore, V.; Yadav, G.; Roy, S.; Bhattacharjee, B.; Kumari, K. Phenolic Compounds in Water: From Toxicity and Source to Sustainable Solutions-An Integrated Review of Removal Methods, Advanced Technologies, Cost Analysis, and Future Prospects. J. Environ. Chem. Eng. 2024, 12, 112964. [Google Scholar] [CrossRef]
  20. Sarkar, S.; Gill, S.S.; Das Gupta, G.; Kumar Verma, S. Water toxicants: A comprehension on their health concerns, detection, and remediation. Environ. Sci. Pollut. Res. 2022, 29, 53934–53953. [Google Scholar] [CrossRef] [PubMed]
  21. Xie, X.; Shi, J.; Pi, K.; Deng, Y.; Yan, B.; Tong, L.; Jiang, G. Groundwater quality and public health. Annu. Rev. Environ. Resour. 2023, 48, 395–418. [Google Scholar] [CrossRef]
  22. Deng, Z.H.; Li, N.; Jiang, H.L.; Lin, J.M.; Zhao, R.S. Pretreatment techniques and analytical methods for phenolic endocrine disrupting chemicals in food and environmental samples. TrAC Trends Anal. Chem. 2019, 119, 115592. [Google Scholar] [CrossRef]
  23. Vaye, O.; Ngumbu, R.S.; Xia, D. A review of the application of comprehensive two-dimensional gas chromatography MS-based techniques for the analysis of persistent organic pollutants and ultra-trace level of organic pollutants in environmental samples. Rev. Anal. Chem. 2022, 41, 63–73. [Google Scholar] [CrossRef]
  24. Vega-Bustillos, O.; Redígolo, M. Princípios e Aplicações da Espectrometria de Massas, 1st ed.; Scortecci: São Paulo, Brazil, 2024. [Google Scholar]
  25. PRISMA. Welcome to the Preferred Reporting Items for Systematic Reviews and Meta-Analyses (PRISMA) Website. 2025. Available online: https://www.prisma-statement.org/ (accessed on 23 February 2025).
  26. Moher, D.; Shamseer, L.; Clarke, M.; Ghersi, D.; Liberati, A.; Petticrew, M.; Prisma-P Group. Preferred reporting items for systematic review and meta-analysis protocols (PRISMA-P) 2015 statement. Syst. Rev. 2015, 4, 1. [Google Scholar] [CrossRef] [PubMed]
  27. Page, M.J.; McKenzie, J.E.; Bossuyt, P.M.; Boutron, I.; Hoffmann, T.C.; Mulrow, C.D.; Moher, D. The PRISMA 2020 statement: An updated guideline for reporting systematic reviews. BMJ 2021, 372, 71. [Google Scholar] [CrossRef] [PubMed]
  28. Lockwood, C.; Munn, Z.; Porritt, K. Qualitative research synthesis: Methodological guidance for systematic reviewers utilizing meta-aggregation. JBI Evid. Implement. 2015, 13, 179–187. [Google Scholar] [CrossRef]
  29. Singh, V.K.; Singh, P.; Karmakar, M.; Leta, J.; Mayr, P. The journal coverage of Web of Science, Scopus and Dimensions: A comparative analysis. Scientometrics 2021, 126, 5113–5142. [Google Scholar] [CrossRef]
  30. Birkle, C.; Pendlebury, D.A.; Schnell, J.; Adams, J. Web of Science as a data source for research on scientific and scholarly activity. Quant. Sci. Stud. 2020, 1, 363–376. [Google Scholar] [CrossRef]
  31. Martín-Martín, A.; Orduna-Malea, E.; Thelwall, M.; López-Cózar, E.D. Google Scholar, Web of Science, and Scopus: A systematic comparison of citations in 252 subject categories. J. Informetr. 2018, 12, 1160–1177. [Google Scholar] [CrossRef]
  32. Baas, J.; Schotten, M.; Plume, A.; Côté, G.; Karimi, R. Scopus as a curated, high-quality bibliometric data source for academic research in quantitative science studies. Quant. Sci. Stud. 2020, 1, 377–386. [Google Scholar] [CrossRef]
  33. Martín-Martín, A.; Thelwall, M.; Orduna-Malea, E.; Delgado López-Cózar, E. Google Scholar, Microsoft Academic, Scopus, Dimensions, Web of Science, and OpenCitations’ COCI: A multidisciplinary comparison of coverage via citations. Scientometrics 2021, 126, 871–906. [Google Scholar] [CrossRef] [PubMed]
  34. Asubiaro, T.; Onaolapo, S.; Mills, D. Regional disparities in Web of Science and Scopus journal coverage. Scientometrics 2024, 129, 1469–1491. [Google Scholar] [CrossRef]
  35. Pranckutė, R. Web of Science (WoS) and Scopus: The titans of bibliographic information in today’s academic world. Publications 2021, 9, 12. [Google Scholar] [CrossRef]
  36. Gioia, D. A systematic methodology for doing qualitative research. J. Appl. Behav. Sci. 2021, 57, 20–29. [Google Scholar] [CrossRef]
  37. Corbin, J.; Strauss, A. Basics of Qualitative Research: Techniques and Procedures for Developing Grounded Theory, 4th ed.; Sage Publications: Thousand Oaks, CA, USA, 2014; 434p. [Google Scholar]
  38. Kim, S.; Chen, J.; Cheng, T.; Gindulyte, A.; He, J.; He, S.; Li, Q.; Shoemaker, B.A.; Thiessen, P.A.; Yu, B.; et al. Atualização do PubChem 2025. Nucleic Acids Res. 2025, 53, D1516–D1525. [Google Scholar] [CrossRef]
  39. USEPA. U.S. Environmental Protection Agency. 2025. Available online: https://www.epa.gov/ (accessed on 23 February 2025).
  40. US-eCFR. Title 40. Title 40 Was Last Amended 2/07/2025. 2025. Available online: https://www.ecfr.gov/current/title-40 (accessed on 23 February 2025).
  41. Guo, L.C.; Zeng, E.Y. Broadening the global reach of the United States environmental protection agency (USEPA) is vital to combating globalized environmental problems. Environ. Sci. Technol. 2010, 44, 6911–6913. [Google Scholar] [CrossRef] [PubMed]
  42. Zhang, D.; Fu, H.Z.; Ho, Y.S. Characteristics and trends on global environmental monitoring research: A bibliometric analysis based on Science Citation Index Expanded. Environ. Sci. Pollut. Res. 2017, 24, 26079–26091. [Google Scholar] [CrossRef]
  43. USEPA. Summary of the Clean Water Act. 2025. Available online: https://www.epa.gov/laws-regulations/summary-clean-water-act (accessed on 23 February 2025).
  44. US-eCFR. Title 40, Part 116.4: Designation of Hazardous Substances. 2025. Available online: https://www.ecfr.gov/current/title-40/chapter-I/subchapter-D/part-116#116.4 (accessed on 27 February 2025).
  45. USEPA. Hazardous Substance Designations and Release Notifications. 2025. Available online: https://www.epa.gov/epcra/hazardous-substance-designations-and-release-notifications (accessed on 23 February 2025).
  46. US-eCFR. Title 40, Part 302.—Designation, Reportable Quantities, and Notification. 2025. Available online: https://www.ecfr.gov/current/title-40/chapter-I/subchapter-J/part-302 (accessed on 23 February 2025).
  47. US-eCFR. Title 40 Part 423—Steam electric power generating point source category: Appendix A to Part 423–126 Priority Pollutants. 2025. Available online: https://www.ecfr.gov/current/title-40/chapter-I/subchapter-N/part-423 (accessed on 23 February 2025).
  48. Bhuyan, A.; Sanguri, K.; Sharma, H. Improving the keyword co-occurrence analysis: An integrated semantic similarity approach. In Proceedings of the 2021 IEEE International Conference on Industrial Engineering and Engineering Management (IEEM), Singapore, 13–16 December 2021; IEEE: Piscataway, NJ, USA, 2021; pp. 482–487. [Google Scholar] [CrossRef]
  49. Van Eck, N.J.; Waltman, L. Visualizing bibliometric networks. In Measuring Scholarly Impact: Methods and Practice; Springer International Publishing: Cham, The Netherland, 2014; pp. 285–320. [Google Scholar] [CrossRef]
  50. Van Eck, N.J.; Waltman, L. VOSviewer Manual: Manual for VOSviewer Version 1.6.18. Universiteit Leiden/CWTS Meaningful metrics. 2022. Available online: https://www.vosviewer.com/documentation/Manual_VOSviewer_1.6.18.pdf (accessed on 17 February 2025).
  51. Lees, N. The Brandt Line after forty years: The more North–South relations change, the more they stay the same? Rev. Int. Stud. 2021, 47, 85–106. [Google Scholar] [CrossRef]
  52. Solarz, M.W. North–South, Commemorating the First Brandt Report: Searching for the contemporary spatial picture of the global rift. Third World Q. 2012, 33, 559–569. [Google Scholar] [CrossRef]
  53. FCSSC—Finance Center for South-South Cooperation. Organization in Special Consultative Status with ECOSOC of the United Nations. Global South Countries (Group of 77 and China). 2025. Available online: http://www.fc-ssc.org/en/partnership_program/south_south_countries (accessed on 23 February 2025).
  54. Hargesheimer, E.E.; Coutts, R.T.; MacKinnon, M.D. Characterization of simple phenols in oil sands extraction-process water. Environ. Technol. 1984, 5, 433–440. [Google Scholar] [CrossRef]
  55. Ahel, M. Infiltration of organic pollutants into groundwater: Field studies in the alluvial aquifer of the Sava River. In Organic Micropollutants in the Aquatic Environment: Proceedings of the Sixth European Symposium, Lisbon, Portugal, 22–24 May 1990; Springer: Dordrecht, The Netherlands, 1990; pp. 423–427. [Google Scholar] [CrossRef]
  56. Veningerová, M.; Prachar, V.; Kovacicová, J.; Uhnák, J. Analytical methods for the determination of organochlorine compounds: Application to environmental samples in the Slovak Republic. J. Chromatogr. A 1997, 774, 333–347. [Google Scholar] [CrossRef]
  57. Biziuk, M.; Namieśnik, J.; Czerwiński, J.; Gorlo, D.; Makuch, B.; Janicki, W.; Wolska, L. Occurrence and determination of organic pollutants in tap and surface waters of the Gdańsk district. J. Chromatogr. A 1996, 733, 171–183. [Google Scholar] [CrossRef] [PubMed]
  58. Wennrich, L.; Efer, J.; Engewald, W. Gas Chromatographic trace analysis of underivatized nitrophenols. Chromatographia 1995, 41, 361–366. [Google Scholar] [CrossRef]
  59. Køppen, B.; Spliid, N.H. Determination of acidic herbicides using liquid chromatography with pneumatically assisted electrospray ionization mass spectrometric and tandem mass spectrometric detection. J. Chromatogr. A 1998, 803, 157–168. [Google Scholar] [CrossRef] [PubMed]
  60. Johansen, S.S.; Hansen, A.B.; Mosboek, H.; Arvin, E. Identification of heteroaromatic and other organic compounds in ground water at Creosote-contaminated sites in Denmark. Groundw. Monit. Remediat. 2009, 17, 106–115. [Google Scholar] [CrossRef]
  61. Sawhney, B.L.; Kozloski, R.P. Organic Pollutants in Leachates from Landfill Sites. J. Environ. Qual. 1984, 13, 349–352. [Google Scholar] [CrossRef]
  62. Ham, R.K.; Boyle, W.C.; Engroff, E.C.; Fero, R.L. Organic compounds in ferrous foundry process waste leachates. J. Environ. Eng. 1993, 119, 34–55. [Google Scholar] [CrossRef]
  63. Beihoffer, J.; Ferguson, C. Determination of selected carboxylic acids and alcohols in groundwater by GC—MS. J. Chromatogr. Sci. 1994, 32, 102–106. [Google Scholar] [CrossRef]
  64. Rudel, R.A.; Melly, S.J.; Geno, P.W.; Sun, G.; Brody, J.G. Identification of alkylphenols and other estrogenic phenolic compounds in wastewater, septage, and groundwater on Cape Cod, Massachusetts. Environ. Sci. Technol. 1998, 32, 861–869. [Google Scholar] [CrossRef]
  65. Lacorte, S.; Latorre, A.; Guillamon, M.; Barceló, D. Nonylphenol, octyphenol, and bisphenol a in groundwaters as a result of agronomic practices. Sci. World J. 2002, 2, 1095–1100. [Google Scholar] [CrossRef] [PubMed]
  66. Latorre, A.; Lacorte, S.; Barceló, D. Presence of nonylphenol, octyphenol and bisphenol a in two aquifers close to agricultural, industrial and urban areas. Chromatographia 2003, 57, 111–116. [Google Scholar] [CrossRef]
  67. López-Roldán, P.; López de Alda, M.J.; Barceló, D. Simultaneous determination of selected endocrine disrupters (pesticides, phenols and phthalates) in water by in-field solid-phase extraction (SPE) using the prototype PROFEXS followed by on-line SPE (PROSPEKT) and analysis by liquid chromatography-atmospheric pressure chemical ionisation-mass spectrometry. Anal. Bioanal. Chem. 2004, 378, 599–609. [Google Scholar] [CrossRef]
  68. Rodriguez-Mozaz, S.; de Alda, M.J.L.; Barceló, D. Monitoring of estrogens, pesticides and bisphenol A in natural waters and drinking water treatment plants by solid-phase extraction–liquid chromatography–mass spectrometry. J. Chromatogr. A 2004, 1045, 85–92. [Google Scholar] [CrossRef]
  69. Moral, A.; Sicilia, M.D.; Rubio, S.; Pérez-Bendito, D. Multifunctional sorbents for the extraction of pesticide multiresidues from natural waters. Anal. Chim. Acta 2008, 608, 61–72. [Google Scholar] [CrossRef]
  70. Bono-Blay, F.; Guart, A.; de la Fuente, B.; Pedemonte, M.; Pastor, M.C.; Borrell, A.; Lacorte, S. Survey of phthalates, alkylphenols, bisphenol A and herbicides in Spanish source waters intended for bottling. Environ. Sci. Pollut. Res. 2012, 19, 3339–3349. [Google Scholar] [CrossRef]
  71. Quintana, J.; Hernández, A.; Ventura, F.; Devesa, R.; Boleda, M.R. Identification of 3-(trifluoromethyl) phenol as the malodorous compound in a pollution incident in the water supply in Catalonia (NE Spain). Environ. Sci. Pollut. Res. 2019, 26, 16076–16084. [Google Scholar] [CrossRef]
  72. Herrero-Hernández, E.; Rodrígues-Gonzala, E.; Andrade, M.S.; Sánchez-González, S.; Carabias-Martinéz, R. Occurrence of phenols and phenoxyacid herbicides in environmental waters using an imprinted polymer as a selective sorbent. Sci. Total Environ. 2013, 454–455, 299–306. [Google Scholar] [CrossRef] [PubMed]
  73. Zemo, D.A.; O’Reilly, K.T.; Mohler, R.E.; Tiwary, A.K.; Magaw, R.I.; Synowiec, K.A. Nature and estimated human toxicity of polar metabolite mixtures in groundwater quantified as TPHd/DRO at biodegrading fuel release sites. Groundw. Monit. Remediat. 2013, 33, 44–56. [Google Scholar] [CrossRef]
  74. Mohler, R.E.; O’Reilly, K.T.; Zemo, D.A.; Tiwary, A.K.; Magaw, R.I.; Synowiec, K.A. Non-targeted analysis of petroleum metabolites in groundwater using GC× GC–TOFMS. Environ. Sci. Technol. 2013, 47, 10471–10476. [Google Scholar] [CrossRef]
  75. Swartz, C.H.; Reddy, S.; Benotti, M.J.; Yin, H.; Barber, L.B.; Brownawell, B.J.; Rudel, R.A. Steroid estrogens, nonylphenol ethoxylate metabolites, and other wastewater contaminants in groundwater affected by a residential septic system on Cape Cod, MA. Environ. Sci. Technol. 2006, 40, 4894–4902. [Google Scholar] [CrossRef]
  76. Baugros, J.B.; Giroud, B.; Dessalces, G.; Grenier-Loustalot, M.F.; Cren-Olivé, C. Multiresidue analytical methods for the ultra-trace quantification of 33 priority substances present in the list of REACH in real water samples. Anal. Chim. Acta 2008, 607, 191–203. [Google Scholar] [CrossRef] [PubMed]
  77. Dévier, M.H.; Le Menach, K.; Viglino, L.; Di Gioia, L.; Lachassagne, P.; Budzinski, H. Ultra-trace analysis of hormones, pharmaceutical substances, alkylphenols and phthalates in two French natural mineral waters. Sci. Total Environ. 2013, 443, 621–632. [Google Scholar] [CrossRef] [PubMed]
  78. Le Coadou, L.; Le Ménach, K.; Labadie, P.; Dévier, M.H.; Pardon, P.; Augagneur, S.; Budzinski, H. Quality survey of natural mineral water and spring water sold in France: Monitoring of hormones, pharmaceuticals, pesticides, perfluoroalkyl substances, phthalates, and alkylphenols at the ultra-trace level. Sci. Total Environ. 2017, 603, 651–662. [Google Scholar] [CrossRef] [PubMed]
  79. Vulliet, E.; Tournier, M.; Vauchez, A.; Wiest, L.; Baudot, R.; Lafay, F.; Cren-Olivé, C. Survey regarding the occurrence of selected organic micropollutants in the groundwaters of overseas departments. Environ. Sci. Pollut. Res. 2014, 21, 7512–7521. [Google Scholar] [CrossRef]
  80. Montero, L.; Conradi, S.; Weiss, H.; Popp, P. Determination of phenols in lake and ground water samples by stir bar sorptive extraction–thermal desorption–gas chromatography–mass spectrometry. J. Chromatogr. A 2005, 1071, 163–169. [Google Scholar] [CrossRef]
  81. Schellin, M.; Popp, P. Membrane-assisted solvent extraction of seven phenols combined with large volume injection–gas chromatography–mass spectrometric detection. J. Chromatogr. A 2005, 1072, 37–43. [Google Scholar] [CrossRef]
  82. Pignotti, E.; Farré, M.; Barceló, D.; Dinelli, E. Occurrence and distribution of six selected endocrine disrupting compounds in surface and groundwaters of the Romagna area (North Italy). Environ. Sci. Pollut. Res. 2017, 24, 21153–21167. [Google Scholar] [CrossRef]
  83. Castiglioni, S.; Davoli, E.; Riva, F.; Palmiotto, M.; Camporini, P.; Manenti, A.; Zuccato, E. Mass balance of emerging contaminants in the water cycle of a highly urbanized and industrialized area of Italy. Water Res. 2018, 131, 287–298. [Google Scholar] [CrossRef]
  84. Simões, N.G.; Cardoso, V.V.; Ferreira, E.; Benoliel, M.J.; Almeida, C.M. Experimental and statistical validation of SPME-GC–MS analysis of phenol and chlorophenols in raw and treated water. Chemosphere 2007, 68, 501–510. [Google Scholar] [CrossRef]
  85. Carvalho, A.R.M.; Cardoso, V.V.; Rodrigues, A.; Ferreira, E.; Benoliel, M.J.; Duarte, E.A. Occurrence and analysis of endocrine-disrupting compounds in a water supply system. Environ. Monit. Assess. 2015, 187, 1–8. [Google Scholar] [CrossRef]
  86. Makris, K.C.; Snyder, S.A. Screening of pharmaceuticals and endocrine-disrupting compounds in water supplies of Cyprus. Water Sci. Technol. 2010, 62, 2720–2728. [Google Scholar] [CrossRef] [PubMed]
  87. Juhler, R.K.; Felding, G. Monitoring methyl tertiary butyl ether (MTBE) and other organic micropollutants in groundwater: Results from the Danish National Monitoring Program. Water Air Soil Pollut. 2003, 149, 145–161. [Google Scholar] [CrossRef]
  88. Papadopoulou-Mourkidou, E.; Patsias, J.; Papadakis, E.; Koukourikou, A. Use of an automated on-line SPE–HPLC method to monitor caffeine and selected aniline and phenol compounds in aquatic systems of Macedonia–Thrace, Greece. Fresenius’ J. Anal. Chem. 2001, 371, 491–496. [Google Scholar] [CrossRef] [PubMed]
  89. Kovács, Á.; Mörtl, M.; Kende, A. Development and optimization of a method for the analysis of phenols and chlorophenols from aqueous samples by gas chromatography–mass spectrometry, after solid-phase extraction and trimethylsilylation. Microchem. J. 2011, 99, 125–131. [Google Scholar] [CrossRef]
  90. McManus, S.L.; Moloney, M.; Richards, K.G.; Coxon, C.E.; Danaher, M. Determination and occurrence of phenoxyacetic acid herbicides and their transformation products in groundwater using ultra high performance liquid chromatography coupled to tandem mass spectrometry. Molecules 2014, 19, 20627–20649. [Google Scholar] [CrossRef]
  91. Godejohann, M.; Heintz, L.; Daolio, C.; Berset, J.D.; Muff, D. Comprehensive non-targeted analysis of contaminated groundwater of a former ammunition destruction site using 1H-NMR and HPLC-SPE-NMR/TOF-MS. Environ. Sci. Technol. 2009, 43, 7055–7061. [Google Scholar] [CrossRef]
  92. Chung, L.W.; Lee, M.R. Evaluation of liquid-phase microextraction conditions for determination of chlorophenols in environmental samples using gas chromatography–mass spectrometry without derivatization. Talanta 2008, 76, 154–160. [Google Scholar] [CrossRef]
  93. Shin, H.S. GC–MS determination of antioxidants in ground water contaminated with JP-8. Chromatographia 2007, 66, 893–897. [Google Scholar] [CrossRef]
  94. Kapelewska, J.; Kotowska, U.; Karpinska, J.; Kowalczuk, D.; Arciszewska ASwirydo, A. Occurrence, removal, mass loading and environmental risk assessment of emerging organic contaminants in leachates, groundwaters and wastewaters. Microchem. J. 2018, 137, 292–301. [Google Scholar] [CrossRef]
  95. Cruz-López, A.; Dávila-Pórcel, R.A.; de León-Gómez, H.; Rodríguez-Martínez, J.M.; Suárez-Vázquez, S.I.; Cardona-Benavides, A.; Castro-Larragoitia, G.J.; Boreselli, L.; Villalba, M.L.; Pinales-Munguía, A.; et al. Exploratory study on the presence of bisphenol A and bis(2-ethylhexyl)phthalate in the Santa Catarina river in Monterrey, N.L., Mexico. Environ. Monit. Assess. 2020, 192, 488. [Google Scholar] [CrossRef]
  96. Dolatto, R.G.; Messerschmidt, I.; Pereira, B.F.; Martinazzo, R.; Abate, G. Preconcentration of polar phenolic compounds from water samples and soil extract by liquid-phase microextraction and determination via liquid chromatography with ultraviolet detection. Talanta 2016, 148, 292–300. [Google Scholar] [CrossRef]
  97. Al Nasir, F.; Batarseh, M.I. Agricultural reuse of reclaimed water and uptake of organic compounds: Pilot study at Mutah University wastewater treatment plant, Jordan. Chemosphere 2008, 72, 1203–1214. [Google Scholar] [CrossRef] [PubMed]
  98. Han, F.; Gao, Y.; Hu, F.; Yu, X.; Xie, H.; Li, H.; Zheng, W. Solid-phase extraction of seventeen alternative flame retardants in water as determined by ultra-high-performance liquid chromatography-tandem mass spectrometry. J. Chromatogr. A 2019, 1602, 64–73. [Google Scholar] [CrossRef] [PubMed]
  99. Jafari, A.J.; Abasabad, P.; Salehzadeh, A. Endocrine disrupting contaminants ins water resources and sewage in Hamadan city of Iran. Iran. J. Environ. Health. Sci. Eng. 2009, 6, 89–96. [Google Scholar]
  100. Hai-Liang, Y.; Tong-Na, Z. Simultaneous determination of nine C4–C9 alkylphenols and bisphenol A in environmental water using gas chromatography-mass spectrometry. Chin. J. Anal. Chem. 2022, 50, 100112. [Google Scholar] [CrossRef]
  101. Ng, K.; Alygizakis, N.; Nika, M.C.; Galani, A.; Oswald, P.; Oswaldova, M.; Slobodnik, J. Wide-scope target screening characterization of legacy and emerging contaminants in the Danube River Basin by liquid and gas chromatography coupled with high-resolution mass spectrometry. Water Res. 2023, 230, 119539. [Google Scholar] [CrossRef]
  102. Adebesin, T.N.; Lateef, S.A.; Oloruntoba, E.O.; Adejumo, M. Occurrence of bisphenol A, nonylphenol, octylphenol and heavy metals in groundwater from selected communities in Ibadan, Nigeria. J. Water Health 2023, 21, 740–750. [Google Scholar] [CrossRef]
  103. Otitoju, O.B.; Alfred, M.O.; Ogunlaja, O.O.; Olorunnisola, C.G.; Olukanni, O.D.; Ogunlaja, A.; Omorogie, M.O.; Unuabonah, E.I. Pollution and risk assessment of phenolic compounds in drinking water sources from southwestern Nigeria. Environ. Sci. Pollut. Res. 2023, 30, 76798–76817. [Google Scholar] [CrossRef]
  104. Maynard, I.F.N.; Cavalcanti, E.B.; da Silva, L.L.; Martins, E.A.J.; Pires, M.A.F.; de Barros, M.L.; Marques, M.N. Assessing the presence of endocrine disruptors and markers of anthropogenic activity in a water supply system in northeastern Brazil. J. Environ. Sci. Health Part A 2019, 54, 891–898. [Google Scholar] [CrossRef]
  105. Tao, X.; Tang, C.; Wu, P.; Han, Z.; Zhang, C.; Zhang, Y. Occurrence and behaviour of nonylphenol and octylphenol in Nanming River, Guiyang City, China. J. Environ. Monit. 2011, 13, 3269–3276. [Google Scholar] [CrossRef]
  106. USEPA. National Recommended Water Quality Criteria—Human Health Criteria Table. Environmental Protection Agency of United States. 2019. Available online: https://www.epa.gov/wqc/national-recommended-water-quality-criteria-human-health-criteria-table (accessed on 17 February 2025).
  107. US-eCFR. Title 40 Part 304—Arbitration Procedures for Small Superfund Cost Recovery. 2025. Available online: https://www.ecfr.gov/current/title-40/chapter-I/subchapter-J/part-304 (accessed on 23 February 2025).
  108. WHO—World Healty Organization. Guidelines for Drinking-Water Quality, 4th ed.; WHO: Geneva, Switzerland, 2017. Available online: https://www.ncbi.nlm.nih.gov/books/NBK579461/pdf/Bookshelf_NBK579461.pdf (accessed on 17 February 2025).
  109. EC—European Commission. Phenol—Summary Risk Assessment Report. European Chemicals Bureau, Italy. 2006. Available online: https://echa.europa.eu/documents/10162/3e04f30d-9953-4824-ba04-defa32a130fa (accessed on 17 February 2025).
  110. Huang, X. Transboundary watershed pollution control analysis for pollution abatement and ecological compensation. Environ. Sci. Pollut. Res. 2023, 30, 44025–44042. [Google Scholar] [CrossRef]
  111. GOV.UK. Guidance Phenol: General information (Updated 1 October 2024): UK Health Security Agency. 2025. Available online: https://www.gov.uk/government/publications/phenol-properties-incident-management-and-toxicology/phenol-general-information (accessed on 17 February 2025).
  112. Ye, L.; Guo, J.; Ge, R. Chapter Thirteen—Environmental Pollutants and Hydroxysteroid Dehydrogenases. Vitam. Horm. 2014, 94, 349–390. [Google Scholar] [CrossRef]
  113. Bdanthadka, M.; Mehendale, H.M. Chlorophenols. In Encyclopedia of Toxicology, 3rd ed.; Elsiever: Amsterdam, The Netherlands, 2014; pp. 896–899. [Google Scholar] [CrossRef]
  114. Lapworth, D.J.; Baran, N.; Stuart, M.E.; Manamsa, K.; Talbot, J. Persistent and emerging micro-organic contaminants in Chalk groundwater of England and France. Environ. Pollut. 2015, 203, 214–225. [Google Scholar] [CrossRef] [PubMed]
  115. European Chemicals Agency. Information on Chemicals. 2025. Available online: https://echa.europa.eu/substance-information/-/substanceinfo/100.002.405 (accessed on 17 February 2025).
  116. Bonacci, O.; Žaknić-Ćatović, A.; Roje-Bonacci, T. Significant Rise in Sava River Water Temperature in the City of Zagreb Identified across Various Time Scales. Water 2024, 16, 2337. [Google Scholar] [CrossRef]
  117. Kim, J.; Choi, K.; Chung, D.S. Sample Preparation for capillary electrophoretic Applications. Compr. Sampl. Sample Prep. 2012, 3, 701–721. [Google Scholar] [CrossRef]
  118. Janz, D.M. Dinitrophenols. In Encyclopedia of Toxicology, 3rd ed.; Elsevier: Amsterdam, The Netherlands, 2014; pp. 177–178. [Google Scholar] [CrossRef]
  119. Vione, D.; Maurino, V.; Minero, C.; Duncianu, M.; Olariu, R.; Arsene, C.; Sarakha, M.; Mailhot, G. Assessing the transformation kinetics of 2- and 4-nitrphenol in the atmospheric aqueous phase. Implications for the distribution of both nitroisomers in the atmosphere. Atmos. Environ. 2009, 43, 2321–2327. [Google Scholar] [CrossRef]
  120. NLM National Library of Medicine; National Institutes of Health; U.S. Department of Health and Human Services. Toxicological Profile for Nitrophenols: Chapter 1 Relevance to Public Health. 2025. Available online: https://www.ncbi.nlm.nih.gov/books/NBK601147/ (accessed on 17 February 2025).
  121. Orata, F. Derivatization reactions and reagents for gas chromatography analysis. In Advanced Gas Chromatography—Progress in Agricultural, Biomedical and Industrial Applications; InTech: Rijeka, Croatia, 2012; pp. 83–156. ISBN 978-953-51-0298-4. [Google Scholar] [CrossRef]
  122. Bilalova, S.; Newig, J.; Tremblay-Lévesque, L.C.; Roux, J.; Herron, C.; Crane, S. Pathways to water sustainability? A global study assessing the benefits of integrated water resources management. J. Environ. Manag. 2023, 343, 118179. [Google Scholar] [CrossRef]
  123. IPBES. Global Assessment Report on Biodiversity and Ecosystem Services of the Intergovernmental Science-Policy Platform on Biodiversity and Ecosystem Services; Brondizio, E.S., Settele, J., Díaz, S., Ngo, H.T., Eds.; IPBES Secretariat: Bonn, Germany, 2019; 1148p. [Google Scholar] [CrossRef]
  124. Brauman, K.A.; Garibaldi, L.A.; Polasky, S.; Aumeeruddy-Thomas, Y.; Brancalion, P.H.; DeClerck, F.; Verma, M. Global trends in nature’s contributions to people. Proc. Natl. Acad. Sci. USA 2020, 117, 32799–32805. [Google Scholar] [CrossRef]
  125. Hole, D.G.; Collins, P.; Tesfaw, A.; Barrera, L.; Mascia, M.B.; Turner, W.R. Make nature’s role visible to achieve the SDGs. Glob. Sustain. 2022, 5, e8. [Google Scholar] [CrossRef]
  126. Khiyat, Z. Groundwater in the Arab region: Making the invisible visible. Desalination Water Treat. 2022, 263, 204–206. [Google Scholar] [CrossRef]
Figure 1. PRISMA 2020 flow diagram (adapted for this study).
Water 17 01173 g001
Figure 2. Temporal and socioeconomic distribution of studies on phenol contamination in groundwater from 1984 to 2023, with emphasis on the Global North and South.
Water 17 01173 g002
Figure 3. Network of keyword co-occurrence in groundwater contamination studies: phenolic compounds—emerging pollutants and analytical techniques.
Water 17 01173 g003
Figure 4. Global distribution of studies between 1984 and 2023 and phenolic compounds reported in the investigated groundwater.
Water 17 01173 g004
Figure 5. Correlation matrix between sources of contamination and groups of phenolic compounds detected in groundwater studies using advanced analytical techniques.
Water 17 01173 g005
Figure 6. Phenolic compounds identified in groundwater and their classification under USEPA regulations.
Water 17 01173 g006
Figure 7. Distribution of the occurrence of hazardous and priority phenolic compounds identified in groundwater.
Water 17 01173 g007
Figure 8. Comparison of the detection limits (LD) and quantification limit (LQ) for four analytical techniques used in studies on groundwater contamination by priority phenolic compounds: LC-MS/MS (green), GC-MS (orange), LC-UV (blue) and HPLC-UV (yellow).
Water 17 01173 g008
Figure 9. Comparison of the GC-MS analytical technique with and without derivatization in studies on groundwater contamination by phenolic compounds.
Water 17 01173 g009
Figure 10. Effect of different derivatization reagents on the detection and quantification limits of phenolic compounds by GC-MS.
Water 17 01173 g010
Figure 11. Efficiency of extraction techniques for priority phenolic compounds: recovery rates across different analytical methods.
Water 17 01173 g011
Figure 12. Spatial distribution and maximum concentrations of priority phenolic contaminants in groundwater.
Water 17 01173 g012
Table 1. Analytical and extraction techniques were used to determine phenolic compounds in real water samples from different locations.
Analytical TechniqueExtraction TechniquePhenolic GroupLD Range (ng/L)LQ Range (ng/L)Detected Concentration Range (ng/L)Pollution SourceCountry (Authors)
GC-ECD; GC-FID; GC-MS-Chlorophenols--20 to 340Natural substance degradation, Fuel, PesticidesDenmark [87]
Alkylphenols600 to 4200
Alkylphenols ethoxylates-
Phenols70 to 5100
GC-FIDTCLP, Purge and trap, LLE, SPE and DerivatizationAlkylphenols1000 to 10,0002000 to 3000180 to 2.09 × 10⁶Creosote
Ferrous foundry
Landfill leaching, Municipal wastewater, Industrial wastewater, Pesticides
Treated wastewater
Canada [54], Jordan [97], USA [61,62], Denmark [60]
Chlorocresols-40,000<LQ
Chlorophenols-40,000 to 180,000710 to 1740
Nitrocresols-80,000640
Nitrophenol-60,000 to 140,000<LQ
Phenols1000 to 10,00030,00011,000 to 1.2 × 10⁶
GC-GC-TOFMS-Alkylphenols-1 × 10⁶ to 11 × 106<LOQFuelUSA [74]
GC-MSCLSA, direct injection, extraction and derivatization, LLE, LPME Clean up and derivatization, MASE, LPME, OASIS-SPE (offline), SPE, SPE (online), SPME, SPME (online), TD-SBSE, SPE LLE, SPMEAlkylphenols1 to 100,0002 to 10,0002.2 to 50 × 106Alcohols, Carboxylic acids, Chlorination, Endocrine disrupters (EDCs), Fuel, Industrial wastewater, Jet fuel (JP8), Mining, Municipal wastewater, Natural substance degradation, Pesticides, Pharmaceuticals, Phenolic compounds, Phenoxy alkanoic acidsBrazil [104], China [100,105], France [78], Germany [80,81], Hungary [89], Nigeria [102], Portugal [84], South Korea [93], Spain [65,66,70,71], Taiwan [92], USA [63,64,73], Poland [94]
Alkylphenols ethoxylates3.3 to 86.715.6 to 260-
Biphenols1.1 to 2.94.2 to 10,00014 to 33
Bisphenols3 to 13701 to 16.26 to 6880
Bromophenols190570<LQ
Chlorocresols74 to 2002207000 to 113,910
Chlorophenols1.4 to 41002 to 12,0002.08 to 216,200
Halogenated Phenols10-17,000
Nitrophenols2.26.6<LQ
Phenols0.05 to 100,0000.167 to 28,000720 to 40 × 106
GC-NPD/GC-ECDSPE-LLENitrophenols10,000 to 30,000-15,000 to 88,000Explosive and Heavy metalsGermany [58]
Nitrocresols10,000 to 30,000-15,000 to 31,000
HPLC-SPE-NMR-TOF-MSSPE by 1H NMRBisphenols--12,000 to 13,000Explosives, Heavy metalsSwitzerland [91]
Nitrophenols---
LC-MSSPE, Profexs and Prospekt, SPE OasisAlkylphenols52.9 to 264.7-374.2 to 20,000Endocrine disrupters (EDCs), Industrial wastewater, Pesticides,
Municipal wastewater
Denmark [59], Italy [82], Spain [67,68], USA [75], Mexico [95]
Alkylphenols ethoxylates--2500
Bisphenols0.61 to 6.32,025 to 25,000
Chlorocresols34.9 to 38.5--
Chlorophenols3 to 87.7--
Nitrocresols3 to 7--
Phenols1216.2--
LC-MS/GC-MSLLEAlkylphenols--31 to 78Municipal wastewater, Industrial wastewater,Croatia [55]
Alkylphenols ethoxylates--10
Phenols--120 to 280
LC-MS-MSSPE, SPE (negative and positive mode) SPE (on line) SPE (on line), SPME (on line) SPE Oasis (on line and off line) SPMEAlkylphenols3.32 to 2201 to 104.9 to 106Bromophenols, Emerging contaminants (ECs), Endocrine disrupters (EDCs), Industrial wastewater, Laboratory contamination, Municipal wastewater, Organophosphate flame retardants (OPFRs), Pesticides, Pharmaceuticals, Phenoxyacetic acid herbicidesChina [98], Cyprus [86], France [76,77,79], Ireland [90], Italy [83], Portugal [85], Romania—Croatia—Hungary [101]
Alkylphenols ethoxylates0.7 to 38.82 to 102.2 to 211.9
Bisphenols0.93 to 6.291 to 106.29 to 7400
Bromocresols0.10.25-
Bromophenols0.1 to 2.50.25 to 51.29 to 15.57
Chlorocresols0.10.25 to 1364
Chlorophenols0.08 to 1.20.2 to 4.91 to 1461
Nitrophenols0.060.17-
Phenols1.173.5-
Phthalene1.334-
LC-UVA-SPE;
Extraction and derivatization;
Molecularly imprinted polymers (MIP); LC-Sorption C18;
LPME SPE (online)
Alkylphenols10 to 41901200 to 11,6001 to 1230Municipal wastewater,
Industrial wastewater,
Acid herbicides,
Pesticides,
Chemical waste,
Phenolic compounds
Brazil [96], Spain [69,72], USA [64], Greece [88], Poland [57], Iran [99], Nigeria [103]
Alkylphenols ethoxylates1950 to 7900--
Bisphenols--22 to 9000
Chlorocresols100--
Chlorophenols50 to 21,00070,00075,000 to 407,000
Nitrocresols13,000--
Nitrophenols50 to 17,00058,000210,000 to 1,313,000
Phenols400 to 19,0001400 to 24,000119,000 to 552,000
Notes: Abbreviations: 1H NMR: Proton Nuclear Magnetic Resonance, A-SPE: Admicellar Solid-Phase Extraction, C18: Octadecyl, CLSA: Closed-Loop Striping Analysis, DCM: Dichloromethane, ECs: Emerging Contaminants, EDCs: Endocrine-Disrupting Chemicals, GC-ECD: Gas Chromatography with Electron Capture Detector, GC-FID: Gas Chromatography with Flame Ionization Detector, GC-GC-TOFMS: two-dimensional Gas Chromatography with Time-of-Flight Mass Spectrometry, GC-NPD: Gas Chromatography—Nitrogen–phosphorus Detector. GC-MS: Gas Chromatography–Mass Spectrometry, HPLC-SPE-NMR-TOF-MS: High-Performance Liquid Chromatography coupled to Solid-Phase Extraction and Nuclear Magnetic Resonance and Time-of-Flight Mass Spectrometry, JP8: Jet Propulsion, OPFRs: Organophosphate Flame Retardants, LC: Liquid chromatography, LC-MS/GC-MS: Liquid Chromatography–Mass Spectrometry/Gas Chromatography–Mass Spectrometry, LC-MS-MS: Liquid Chromatography–tandem Mass Spectrometry, LC-UV: Liquid Chromatography-Ultraviolet, LLE: Liquid–Liquid Extraction, LPME: Liquid-Phase Microextraction, MASE: Microwave-Assisted Solvent, MIP: Molecularly imprinted polymer, NMR: Nuclear Magnetic Resonance, SPE: Solid-Phase Extraction, SPME: Solid-Phase Microextraction, TCLP: Toxicity Characteristic Leaching Procedure, TD-SBSE: Thermodesorption System—Stir Bar Sorptive Extraction, USA: United States of America.
Disclaimer/Publisher’s Note: The statements, opinions and data contained in all publications are solely those of the individual author(s) and contributor(s) and not of MDPI and/or the editor(s). MDPI and/or the editor(s) disclaim responsibility for any injury to people or property resulting from any ideas, methods, instructions or products referred to in the content.

