Article

Removal of Nitrogen and Phosphorus from Municipal Wastewater Through Cultivation of Microalgae Chlorella sp. in Consortium

by
Flor Maria Ortega-Blas
1,2,*,
José C. Ramos-Saravia
3 and
Pablo Luis Cossío-Rodríguez
4
1
Faculty of Mechanical Engineering, National University of Engineering, Lima 15094, Peru
2
Bioenergy Research Center, National University of Callao, Callao 07011, Peru
3
Department of Mechanical & Energy Engineering, University of Engineering and Technology–UTEC, Lima 15063, Peru
4
Faculty of Science and Technology, Major University of San Simón, Cochabamba, Bolivia
*
Author to whom correspondence should be addressed.
Water 2025, 17(8), 1160; https://doi.org/10.3390/w17081160
Submission received: 28 February 2025 / Revised: 1 April 2025 / Accepted: 10 April 2025 / Published: 13 April 2025
(This article belongs to the Special Issue Advanced Biological Wastewater Treatment and Nutrient Removal)

Abstract

:
Demographic growth in developing countries has increased domestic wastewater generation, posing environmental and health risks due to nitrogen and phosphorus accumulation, the main contributors to eutrophication. This study explores microalgae–bacteria consortia for nutrient removal, using Chlorella sp. for its high pollutant assimilation efficiency and biomass production. A lab-scale experiment was designed using response surface methodology to optimize key variables, revealing that lighting and the culture medium significantly influenced biomass production and nutrient removal, with lighting having the strongest statistical impact (p = 0.0002). The optimal conditions (18 μmolm−2 s−1 light, municipal wastewater) achieved nitrogen and phosphorus removal efficiencies of 87.16% and 94.43%, respectively. A mathematical model was developed with two independent systems: (1) the first describes biomass generation via photosynthesis, considering CO2 as a limiting substrate, while (2) the second models nitrogen and phosphorus consumption, assuming nitrogen as limiting substrate and introducing an intermediate (I) that couples phosphorus and nitrogen removal. This coupling is regulated by factor k, which represents a percentage of the total consortium consumption rate. Model predictions showed high accuracy for biomass (SE = 0.07186) and phosphorus (SE = 0.63065), but nitrogen exhibited greater deviation (SE = 3.40285). These findings highlight the system’s potential as a sustainable and cost-effective wastewater treatment alternative.

1. Introduction

Current demographic growth has a direct impact on the generation of domestic wastewater in developing countries, increasing risks to public health and the environment due to elevated nitrogen and phosphorus levels [1]. Excessive amounts of these contaminants can lead to eutrophication in aquatic ecosystems, causing significant ecological imbalances [2]. The use of microalgae in wastewater treatment emerges as a highly effective option, as their cultivation in nutrient-rich domestic effluents not only enables water decontamination [3] but also contributes to reducing CO2 concentration in the atmosphere, thereby helping mitigate greenhouse gases [4]. There are many species of microalgae that stand out for their unique qualities, one of which is Chlorella sp. due to its ubiquitous nature, easy adaptability to adverse conditions, and rapid growth. In this context, open pond systems involving microalgae–bacteria consortia emerge as a viable solution for wastewater treatment, especially in rural areas with technological and economic limitations. These systems offer advantages such as simplicity, low operational costs, and accessibility, making them ideal for these regions [5].
Strengthening knowledge about consortium-based systems is crucial for the design, optimization, and scaling of these processes, aiming to ensure their accessibility and generate an impact on the development of sustainable systems and circular economies in rural populations. Facilitating access to pollutant removal technologies and waste utilization through the generation of usable biomass (such as biogas for renewable energy or biofertilizers that enhance local agriculture) also promotes efficient resource management and drives sustainable [6] and decentralized development in these communities. The cultivation of microalgae requires rigorous control of various factors that influence the metabolic and reproductive functions of these microorganisms [3]. Among the most relevant factors are carbon concentration, temperature, light intensity, available nutrients, and the specific type of microalgae used [7]. Proper management of these variables is essential to maximize process efficiency and ensure optimal performance in microalgal biomass production [8]. Unlike pure microalgae cultures, open ponds are characterized by hosting diverse microbial consortia, where consortial relationships, nutrient assimilation dynamics, and biomass generation processes are all complex [9].
The use of microalgae for wastewater bioremediation has proven to be effective in removing key pollutants such as nitrogen and phosphorus, with removal rates ranging from 24% to 100% for nitrogen and 25% to 100% for phosphorus, depending on the type of wastewater and cultivation conditions. Additionally, microalgae have been shown to reduce COD levels by 23% to 95% when used in raw or primary wastewater treatment [3]. The co-cultivation of microalgae and bacteria offers a promising alternative to conventional systems by leveraging synergistic interactions between microorganisms, reducing operational costs by utilizing oxygen produced through photosynthesis [3]. However, challenges such as nutrient competition, mutual inhibition, and system scalability limit its widespread application, highlighting the need for innovative approaches to overcome these barriers.
The study by [10] developed a kinetic model integrating the Droop function and Logistic equations to predict the growth, nutrient consumption, and CO2 fixation of Chlorella vulgaris. This model uniquely incorporated internal nitrogen and phosphorus quotas as key variables, enabling accurate predictions of algal growth behavior under varying CO2 and NH4-N concentrations, with correlation coefficients ranging from 0.68 to 0.97. The findings revealed high nutrient removal efficiencies (96.12–99.61% for nitrogen and phosphorus) and significant CO2 fixation rates (up to 85.72 mg CO2·L−1·d−1) under optimized conditions. Despite its robust theoretical framework and promising results, this study focused solely on monocultures of C. vulgaris and did not explore algal–bacterial consortia or their potential synergies in wastewater treatment systems.
The use of microalgae–bacteria consortia for wastewater treatment has proven to be an efficient and sustainable strategy, highlighted by their ability to remove nutrients and produce biomass. Studies such as [11] have explored the dynamics between microalgae and bacteria, analyzing the impact of physicochemical parameters under controlled conditions, including light intensity, nutrient loads, and N:P ratios. Although significant advances have been made, such as the proposal of simple monitoring tools like dissolved oxygen and electrical conductivity for evaluating system performance, challenges remain in hydrodynamic modeling, light attenuation, and gas exchange. Furthermore, experimental validation in real-world conditions is necessary. These gaps present opportunities for improving the design and operation of microalgae–bacteria systems, enhancing their efficiency for industrial applications in diverse environments.
Experimental studies and the use and development of mathematical models play a crucial role in understanding, designing, scaling, and optimizing processes, which are key factors for the implementation and improvement of technologies. In the field of wastewater treatment, these models provide valuable insights into system dynamics, allowing for the prediction of pollutant removal efficiencies and the identification of optimal operating conditions.
Numerous studies and research efforts have been conducted on wastewater treatment, the use of microalgae–microbial consortia, and mathematical models applied to these processes. The integration of these approaches has gained increasing attention due to their potential for efficient nutrient removal and biomass generation.
The study conducted by [12] presents an innovative approach to simultaneously model the removal of organic matter, ammonium, and phosphate in algal–bacterial consortia, integrating the ASM NO.3 model with a refined algal kinetic model (ASM-A). The findings reveal that phosphate-accumulating organisms (PAOs) and nitrifying bacteria are responsible for over 80% of phosphate removal and 60% of ammonium removal under varying aeration conditions, while algae play a minor role in nutrient uptake. The model illustrates the influence of alkalinity on microbial activity, demonstrating enhanced nutrient removal at an alkalinity level of 1 mol/m3 (100 mg/L CaCO3). It also highlights the significance of light intensity and biomass concentration in optimizing reactor performance, recommending low biomass levels to achieve efficient light utilization under artificial illumination. This work provides a robust theoretical framework for optimizing algal–bacterial reactors and addresses challenges associated with microbial interactions and industrial scalability.
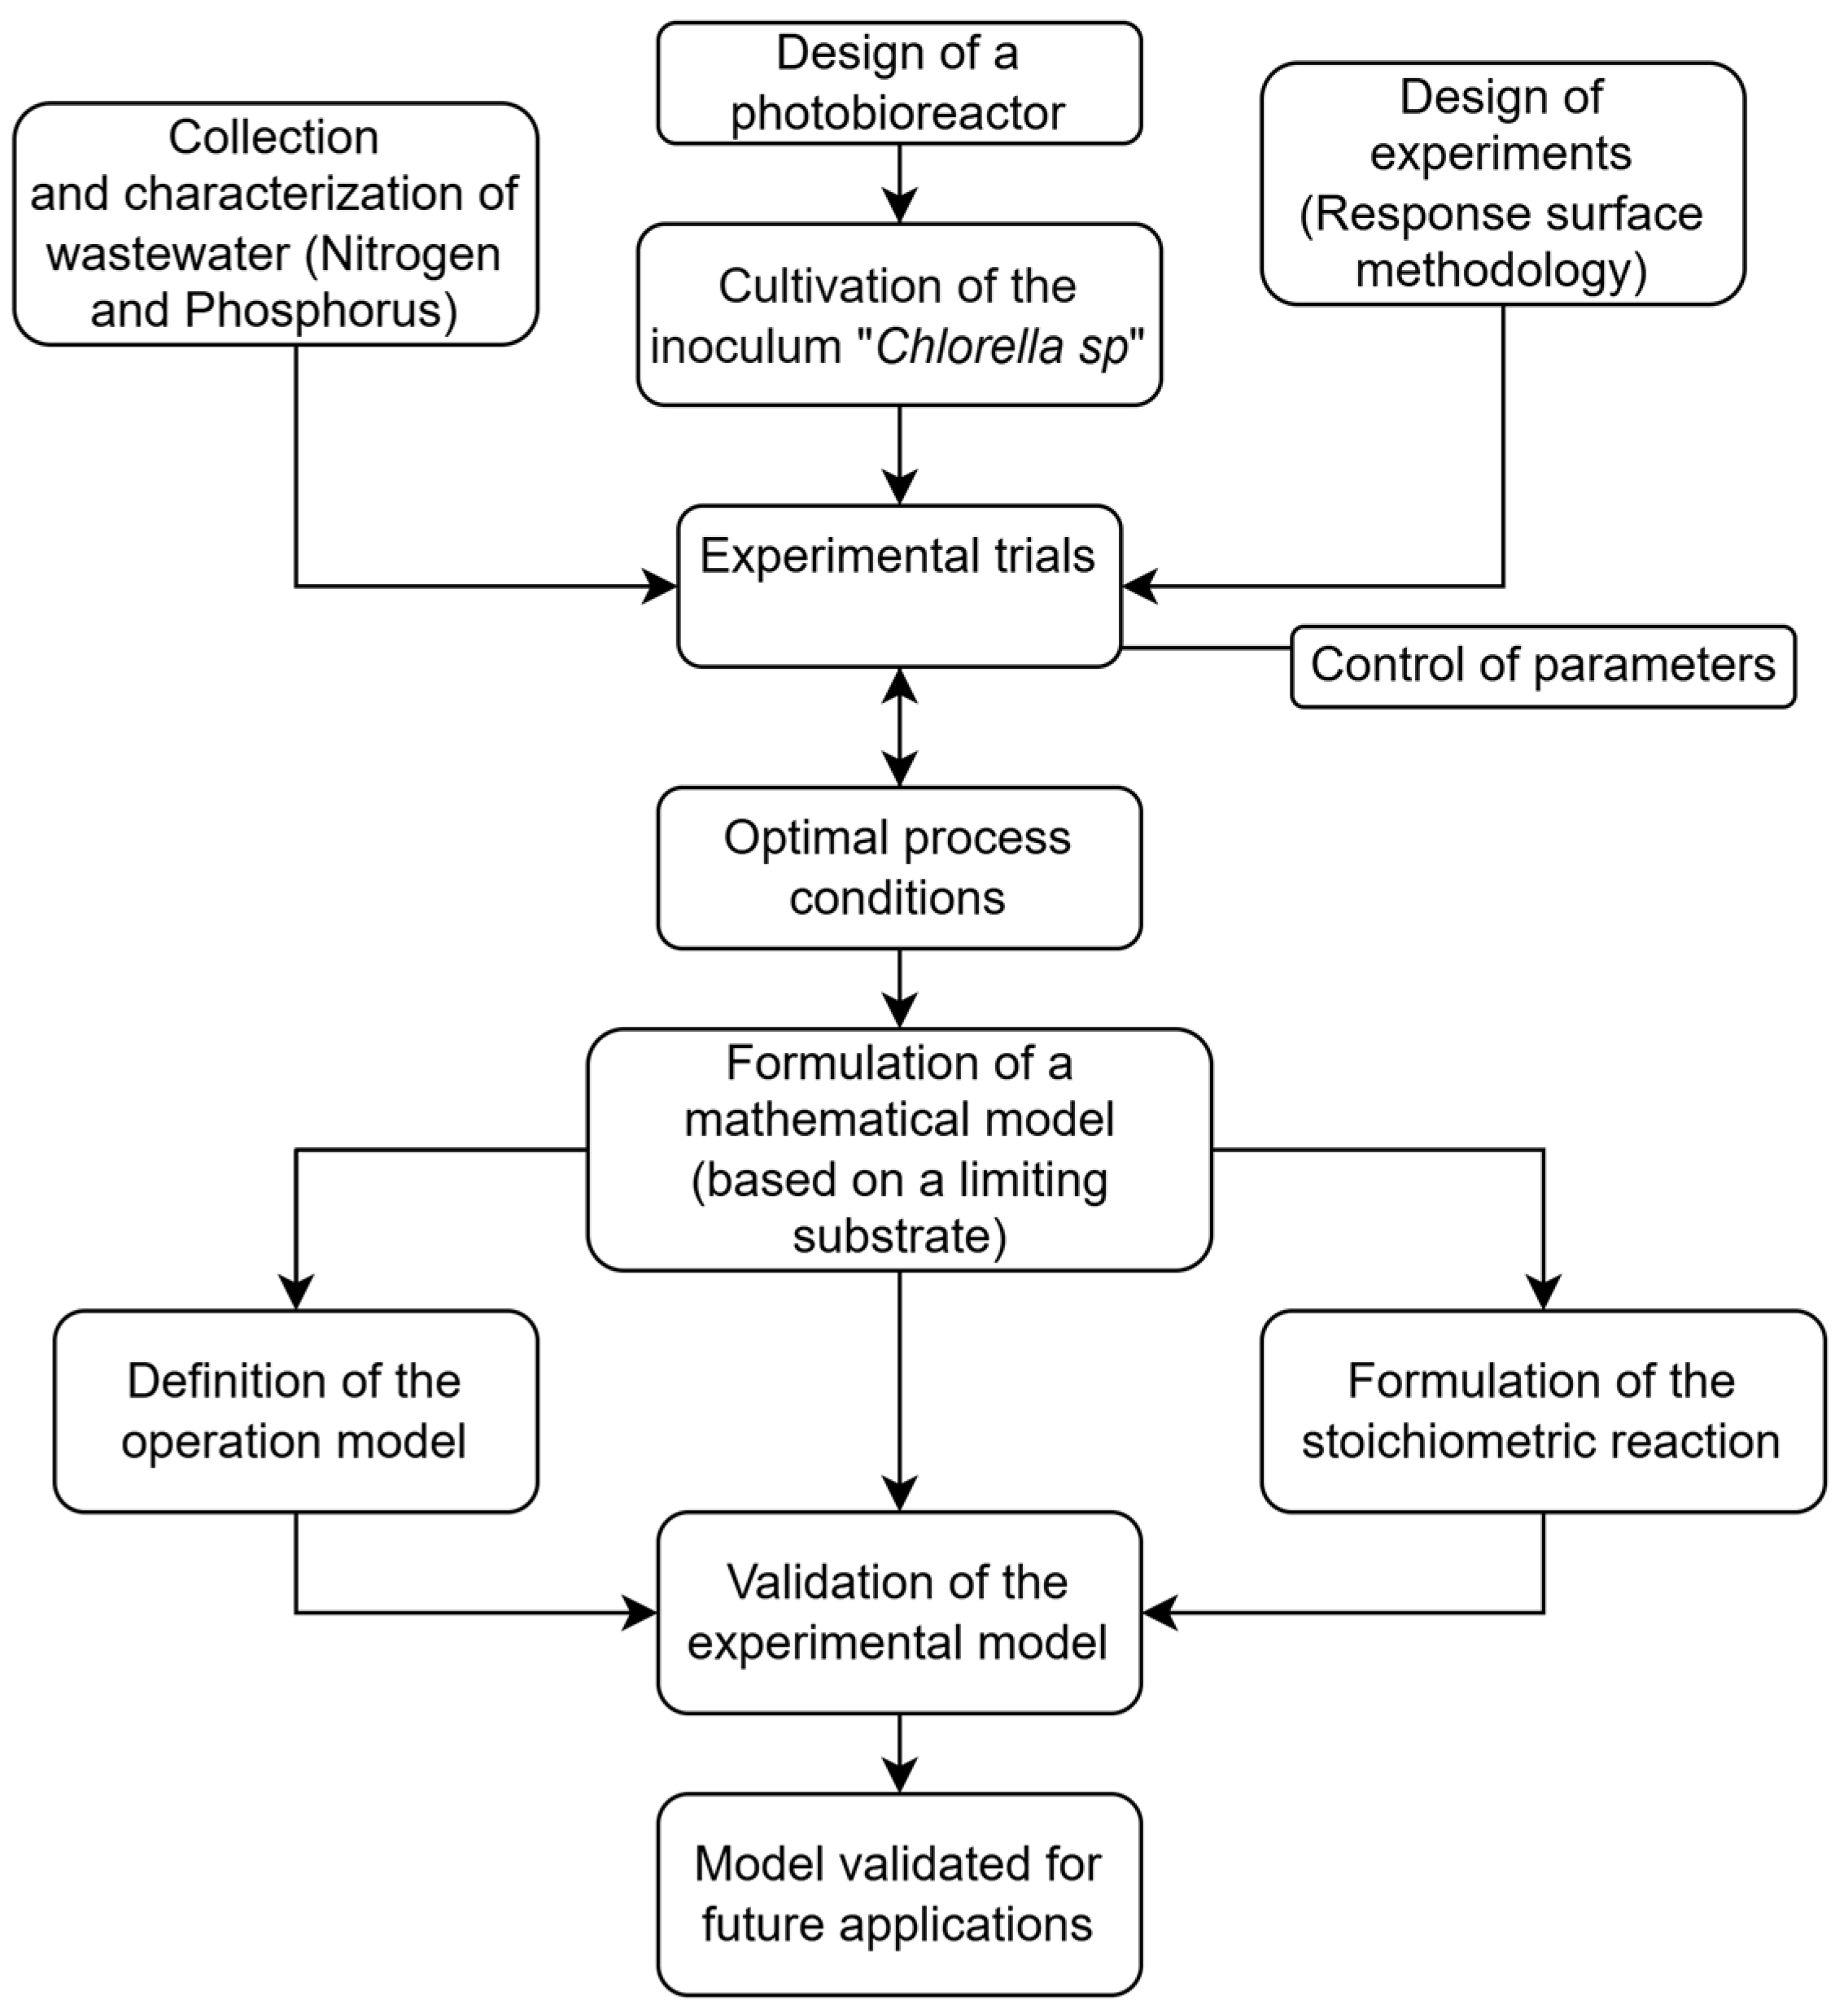
To better understand the dynamics of contaminant assimilation and biomass generation by microalgae–bacteria consortia present in municipal wastewater from open treatment ponds in rural areas of Huanta-Ayacucho, Peru, a study with an experimental design based on the response surface methodology was conducted. This approach allowed the identification of key variables and optimal conditions associated with the cultivation process. Subsequently, a mathematical model was developed to describe the assimilation of nitrogen in the form of ammonium ions (NH4+), phosphorus in the form of phosphate ions (PO43−), and microalgal biomass generation through the formulation of independent systems [12] based on the concept of a limiting substrate.

2. Materials and Methods

The methodology was developed through a comprehensive approach that combines laboratory experiments and mathematical modeling to optimize wastewater treatment using microalgae [13] (Figure 1). The resulting hybrid model can be a valuable tool for designing and operating more efficient and sustainable wastewater treatment systems. The process is divided into several interconnected stages: First, wastewater was collected and analyzed, focusing on nitrogen and phosphorus concentrations. Detailed information on the origin and characteristics of the culture medium is found in the third paragraph (line 154) of Section 2.1.
Simultaneously, a photobioreactor was designed and constructed for inoculum cultivation (Figure 2). Additionally, an experimental design was implemented using the response surface methodology to plan experiments and optimize process conditions. Second, the Chlorella sp. inoculum was cultivated, and experiments were conducted while varying process conditions such as the light intensity, pH, and the type of culture medium. Third, based on the optimal process conditions determined from the experimental results, a mathematical model was developed to describe microalgae growth and nitrogen and phosphorus consumption as a function of a limiting substrate (nitrogen and CO2). The mode of operation was defined as batch, and stoichiometric reactions were established. The model parameters were determined by fitting the experimental data to the Monod and Herbert–Pirt equations using OriginPro2021; the procedures used for data fitting and parameter estimation are detailed in Section 2.9. Finally, the mathematical model predictions were compared with experimental results to validate their accuracy and reliability. It is necessary to mention that to ensure clarity and linguistic accuracy, AI-based tools were employed for paraphrasing and translation. These tools were utilized strictly for language refinement and did not influence the scientific content, data interpretation, or conclusions of this study.

2.1. Materials, Equipment, and Reagents

In this study, 20 borosilicate glass bottles with a capacity of 1 L were used. Each bottle functioned as a batch-type reactor [14] and was intermittently supplied with air and carbon dioxide. For inoculum cultivation, a photobioreactor was designed with a metal/wood structure, consisting of six 250 mL borosilicate glass tubes arranged concentrically around a red LED lamp (Figure 2). Carbon dioxide (CO2) was quantified using the acid–base titration method [15]. For absorbance measurement, a Kyntel UV–Visible spectrophotometer (model KUV-1100) imported from Bjenndia, China was used, along with a digital camera microscope, a potentiometer, a conductivity meter, and a 0.45 µm GF/C fiberglass microfilter for filtering water samples for phosphorus and nitrogen analysis [16]. A 500 mL sample of Chlorella sp. was provided by Bioandex Tech S.R.L (Arequipa, Peru). Chlorella sp. was selected for this study due to its outstanding nutrient removal capabilities, adaptability to adverse environments, ubiquity, and ease of access. Buffer reagents used included 98% sulfuric acid with a density of 1.84 g/mL and 99% sodium hydroxide granules, which were supplied by the Chemistry Laboratory of the National University of Callao.
In this study, three types of culture media were used. The first consisted of synthetic water (1), the second of seawater (2), and the third of municipal wastewater (3). The synthetic water (1) was prepared in the Microbiology Laboratory of the Faculty of Chemical Engineering at the National University of Callao, following the procedure established by [17]. It was composed of the following compounds: KCl = 0.1 M, KH2PO4 = 3.3 × 10⁻⁴ M, NH4Cl = 13.2 × 10⁻⁴ M, and Na2CO3 = 3 × 10⁻⁴ M. The seawater, on the other hand, was collected from the shores of La Punta, Callao, Peru, and its composition includes 34.8 g NaCl/L, magnesium sulfate (4 g/L), magnesium chloride (3.8 g/L), calcium chloride (1.2 g/L), and trace elements such as potassium, strontium, and bromine [18].
Finally, the municipal wastewater sample was collected from the clarification pond in the pre-treatment area of the Puca Puca wastewater treatment plant (WWTP) located in Huanta, Ayacucho, Peru. This WWTP collects sewage from approximately 70% of the population of Huanta, with an inflow capacity of 65 L/s. The wastewater is characterized not only by the presence of organic and inorganic contaminants but also by pathogenic microorganisms [19,20,21]. The municipal wastewater sample was recollected and subsequently filtered, stored at 4 °C [22], and analyzed. It is important to note that the municipal wastewater sample was not autoclaved to preserve the formation of microbial consortia through the synergistic interaction between bacteria and microalgae. Water quality parameters such as BOD, COD, nitrogen in the form of ammonium, phosphorus, pathogens, and pH were analyzed using standard methods [22]. Table 1 presents the measured values of the municipal wastewater quality parameters.

2.2. Experimental Design

To determine the most relevant operational factors influencing the growth of Chlorella sp., a series of experimental trials were designed under different conditions, modifying variables such as the light intensity, CO2 concentration, airflow rate, pH, and culture medium type. Given the long cultivation periods required for microalgae and the multiple factors that could influence their growth process, it was necessary to select a method that optimizes the identification of the most significant factors [23,24]; therefore, the response surface methodology using a face-centered central composite design (FC-CCD) was applied [25,26,27,28,29,30]. The applied method resulted in 20 experimental runs, which were randomly generated to minimize error and were conducted using the statistical software Design Expert 13.
Initially, the experimental design was established to determine whether the airflow rate, CO2 concentration, and light intensity were highly influential factors in microalgae growth. This design included three levels for each variable: aeration rates of 500, 1250, and 2000 mL/min; CO2 concentrations of 10, 20, and 30% v/v; and light intensities of 4 μmolm−2 s−1, 11 μmolm−2·s−1, and 18 μmolm−2·s−1. These ranges were based on previous studies [27]. The analysis of this first group suggested that light intensity was a statistically significant factor, making it necessary to consider it as a relevant variable in a second experimental design. Subsequently, a second experimental design was developed, incorporating light intensity as one of the key factors. This second design included three factors: pH, light intensity, and culture medium type. The levels for the culture medium type were synthetic water (1), seawater (2), and municipal wastewater (3). The pH levels were set at 6–7, 7–8, and 8–9, and the light intensity levels remained at 4 μmolm−2·s−1, 11 μmolm−2·s−1, and 18 μmolm−2·s−1.
It is important to note that temperature was not controlled, and the inoculum concentration was kept constant.

2.3. Experimental Procedure

A 1 L experimental culture of Chlorella sp. at 5% v/v was grown in three different types of culture media, under three pH levels and three light intensity levels, as specified in the second experimental design. A total of 20 experimental trials with replicates were conducted over seven days. The cultures were kept in constant agitation using air pumps at a flow rate of 1 L of air/min to prevent algae sedimentation and ensure homogenization within the reactor. Growth was monitored daily using spectrophotometry at 689 nm, following the determination of the maximum wavelength and calibration curve [26].

2.4. Mathematical Model Formulation

The proposed model was designed according to the complexity of the system to be represented and the available resources for analyzing and measuring the involved variables. Based on these guidelines, a non-structured and semi-segregated model was selected due to its balance between mathematical simplicity and biological relevance. This approach is particularly suitable for describing the behavior of microbial consortia, as it considers two interacting cellular populations: microalgae and bacteria. While a fully structured model would require detailed intracellular kinetics for each species, the semi-segregated approach captures essential interactions, such as nutrient exchange and metabolic coupling, without excessive complexity. This choice is further supported by [31]. This modeling approach allowed addressing the limitations associated by measuring key process variables while enabling the consideration of different cellular populations within the system, which was particularly useful for analyzing the microalgae–bacteria consortium [32]. The developed mathematical model was based on the limiting substrate principle, considering carbon dioxide (CO2) as the primary limiting substrate and recognizing its essential role in photosynthesis [33] and biomass generation from inorganic carbon. The removal or assimilation of nitrogen and phosphorus was treated as an independent system from carbon dioxide, with the model based on Monod consumption kinetics. The model design was structured around stoichiometric reaction equations for the involved processes, establishing relationships between reactants and products, using Monod kinetics to describe nutrient consumption, and applying mass balances for a batch-operated process. The model was divided into three parallel stages (Figure 3):
  • Biomass generation model from carbon dioxide (CO2): Describes photosynthesis and respiration subprocesses, referred to as SYSTEM 1.
  • Nitrogen (NH4+) and phosphorus (PO43−) consumption model: Based on the assumption of an intermediate formation subprocess (I), referred to as SYSTEM 2.
  • Microalgae–bacteria interaction model for the consortium: Describes the division of NH4+ consumption within the consortium, referred to as SYSTEM 3.
Figure 3. Schematic representation of the mathematical model construction process.
Water 17 01160 g003

2.5. Definition of Stoichiometric Reactions

The relationships among all the components of the processes included in the model were established based on theoretical stoichiometric reactions, incorporating the relevant molecules for the objectives of this study. The biomass generation by microalgae was modeled using the stoichiometric reaction equation for photosynthesis, which was divided into two reactions: photosynthesis and respiration, following the carbon balance (System 1). The assimilation of nitrogen and phosphorus contaminants was considered independent of biomass generation and was modeled with the assumption of an intermediate relationship (System 2). The consortium modeling (System 3) was developed by integrating these two systems through nitrogen interactions.

2.5.1. System 1: Biomass Generation by Microalgae (CO2 → Glucose → Biomass)

For this system, the photosynthesis process for converting CO2 into glucose was taken as a basis, along with the biomass formation process from nutrients and glucose (respiration) and the empirical formula of microalgal biomass composed of five elements (C, H, O, N, and P) [2] (Figure 4).
The previously presented system was structured according to the stoichiometric reactions of the aforementioned processes:
The photosynthesis phase (CO2 → Glucose), which uses CO2 to convert it into glucose as follows:
6 C O 2 + 6 H 2 O L i g h t C 6 H 12 O 6 + 6 O 2
The respiration phase (Glucose → Biomass), in which the microalga uses glucose to generate biomass according to the following stoichiometric reaction:
C 6 H 12 O 6 + O 2 + N H 4 + + P O 4 3 C O 0.48 H 1.83 N 0.11 P 0.01 + C O 2 + H 2 O + H +
And the stoichiometric equation for cellular maintenance based on glucose is as follows:
C 6 H 12 O 6 + 6 O 2 6 C O 2 + 6 H 2 O + 2700   k J

2.5.2. System 2: NH4+ and PO43− Consumption Through the Formation of an Intermediate

The assimilation of nitrogen and phosphorus was formulated as an independent system, under the assumption of an intermediate denoted “I” (Figure 5), which interacts with nitrogen and phosphorus concentrations to describe their nutrient assimilation behavior.
The relationship between nitrogen and the formation of the intermediate was represented by introducing a constant “d”, which indicates the degree of nitrogen conversion into the intermediate according to the following relation:
N i t r o g e n d · I n t e r m e d i a t e

2.5.3. System 3: Microalgae–Bacteria Consortium Interaction

The interaction for the consortium was proposed based on nitrogen consumption, where the total consumption rate by the consortium is composed of the sum of the rate corresponding to the microalgae and the rate corresponding to the bacteria.

2.6. Microalgae–Bacteria Interaction Based on Nitrogen Consumption

It was assumed that nitrifying bacteria exist within the consortium, consuming a fraction of the nitrogen present in the system through a nitrification process, which is a chemical reaction that oxidizes ammonium to nitrate, carried out by autotrophic bacteria under aerobic conditions. This mechanism can be described by the following stoichiometric reaction:
1.98 H C O 3 + N H 4 + + 1.34 O 2 + 0.98 H 2 O 0.0021 C 5 H 7 N O 2 + 0.98 N O 3 + 2.02 H 2 O + 1.88 H 2 C O 3
From the nitrification process carried out by bacteria, bacterial biomass, nitrate, water, and carbonic acid are produced. The resulting nitrate from this mechanism can then be used by microalgae through the action of the nitrate reductase enzyme, which converts it back into ammonium [6,34,35].
Nitrogen in the form of NH4+ is consumed by both microalgae and bacteria simultaneously, albeit at different rates [36,37]. Due to limitations in analyzing nutrient consumption kinetics separately in a consortium, a single consumption rate was assumed as the total rate for the microalgae–bacteria system. Based on this assumption, the microalgae–bacteria interaction model was designed in terms of percentages of nitrogen consumption flows; that is, from the total nitrogen consumption, an independent variable “k” was defined as a user-adjustable percentage for the model’s needs, where k represents the percentage of nitrogen assimilated by System 2 and (1 − k) represents the nitrogen assimilated by the microalgae (Figure 6).
There are also dynamics involving the use of BOD or COD as carbon sources by the consortia and interactions with the environment—complex relationships that will not be addressed in this study. For the purposes of the model, these processes were encompassed within the so-called consortium (System 3), where we relied solely on the use of carbon dioxide through photosynthesis and respiration to generate biomass (Figure 7).

Assembled Consortium Model Combining System 1 and System 2

The design of the complete model, which includes System 1, System 2, and System 3 (Consortium), is schematically illustrated in Figure 8.

2.7. Definition of Monod Limiting Substrate Consumption Kinetics and Herbert–Pirt Substrate Distribution

The nutrient consumption kinetics models for both systems (1 and 2) were represented by Monod’s hyperbolic consumption equation [8,13,38]. For System 1, CO2 was considered the limiting substrate, while for System 2, NH4 was considered the limiting substrate. The equations included parameters such as the maximum consumption rate (qimax), the affinity constant (Ki), and the substrate concentration (S) as the independent variables. These values were obtained experimentally in units of mg/L. The general equation that describes this behavior is
q i = q i m a x · i K i + i
The rate of biomass generation is described by the substrate distribution equation according to the Herbert–Pirt or Luedeking–Piret model. This model is primarily based on describing the intracellular functions associated with metabolism and cell synthesis [39].
μ = q i m i α
Based on the previous equations and the yield (Y) definitions for the conversion of carbon dioxide to glucose, glucose to biomass, and the nitrogen source to the intermediate, the corresponding Monod and Herbert–Pirt kinetic equations were formulated for carbon dioxide (carbon source), ammonium ions (nitrogen source), phosphate ions (phosphorus source), biomass, and the intermediate [40]; these are the compounds of interest for the proposed model (Table 2).

2.8. Mass Balances by Component

The developed models are represented by a system of ordinary differential equations obtained from the mass balance applied to a system operated in batch mode. Table 3 illustrates the equations developed for the model.

2.9. Data Fitting and Parameter Estimation of the Model

The experimental data were preprocessed to adapt them to the structure of the proposed model. Subsequently, they were fitted to the corresponding mathematical expressions using linear regressions for the Herbert–Pirt equations and nonlinear regressions for the Monod equations. This process enabled the estimation of the model parameters (Figure 9). All processing was performed using OriginPro, Version 2021. OriginLab Corporation, Northampton, MA, USA.

2.9.1. Parameter Estimation for System 1: CO2 → Glucose → Biomass

The parameters of the mathematical model for System 1 were estimated through an iterative fitting process, ensuring that the simulation reproduced the available experimental biomass data as accurately as possible. This procedure was necessary due to the limitation of not having CO2 measurements over time, as the corresponding sensor was not available—only the initial concentration was recorded. The initial concentrations of CO2 and biomass (X) were used for the simulation in Matlab 2024a; then, initial values for the parameters were assumed for the iteration process. The methodology used for this fitting process is described in Figure 10.

2.9.2. Data Fitting for System 2: NH4+ and PO43−

The parameters of the mathematical model for System 2 were estimated using nonlinear regressions on the experimental phosphorus and nitrogen data. This procedure allowed the determination of the parameters (KN, qNmax, KP, and qPmax) describing the dynamics of these nutrients based on the available experimental measurements, according to the scheme described in Figure 11.

2.10. Calibration of Model Parameters and Validation

The system of differential equations derived from the mass balances for biomass (X), nitrogen (N), phosphorus (P), and the kinetic equations for consumption/generation that make up the mathematical model was implemented and simulated in Simuplot v.6, a bioprocess simulation tool in MATLAB R2024a. Multiple simulations were conducted during both the parameter estimation and calibration stages. The model was calibrated and validated by comparing its outputs with experimental data for nitrogen, phosphorus, and biomass. Initially, the parameter values obtained in the previous stage were used, and they were iteratively refined until a better fit to the experimental data was achieved. Model validation was performed by calculating the standard error of the estimate (Syxs).

3. Results

3.1. Analysis and Processing of Statistical Data from Experimental Trials

The productivity data obtained according to the second experimental design (Table 4) were statistically analyzed. It was observed that productivity ranged from 0.008 to 0.142 g CO2 L−1 day−1. Trial number 1 yielded the highest productivity value, with the combination of factors corresponding to the culture medium: municipal wastewater, a pH range of 6–7, and 18 μmolm−2 s−1 of light.
The statistical analysis of the productivity results suggested representing the growth of the microalgae–bacteria consortium using a quadratic model, with a p-value of 0.0006 and an adjusted R2 of 0.8103 [25]. The analysis of variance (ANOVA) (Table 5) yielded a p-value greater than 0.05 for the pH factor, indicating that it did not have a statistically significant influence. In contrast, the p-values corresponding to the light intensity (p = 0.0002) and culture medium type (p = 0.0454) were below 0.05, thus concluding that these two terms in the model are statistically significant and therefore affect the biomass growth of the microalgae–bacteria consortium [41,42]. The statistical results indicate that the culture medium and light intensity are relevant factors that positively influence the consortium’s productivity.
The interaction graph (Figure 12) shows that at a pH of 6.0, productivity is relatively low, regardless of water type or light intensity (Upper left graph). As the pH increases to 7.0 and 8.0, productivity significantly increases, especially at higher light intensity levels (Bottom right graph). Regarding light intensity and water type (Bottom left graph), the highest productivity was presented by water type number 3, which corresponds to municipal wastewater and for low levels of light (4.0 μmolm−2 s−1), productivity is lower compared to higher levels (11.0 and 18.0 μmolm−2 s−1). The increase in light intensity has a positive impact on productivity, particularly at higher pH levels.
As shown in the graph corresponding to Figure 13, there is a complex interaction among the three factors (pH, light intensity, and culture medium type) affecting the consortium’s biomass productivity. Therefore, by jointly optimizing these three factors, maximum productivity was achieved, with specific values verified for each factor: culture medium, municipal wastewater, pH equal to 6.56, and light intensity equal to 18 μmolm−2 s−1. It is important to note that the experimental trial under optimal conditions was conducted over approximately 7 days with a CO2 concentration of 20–25% v/v and an airflow rate of 1000 mL/min. The response surface and contour plots (Figure 13) depict the effects of the factors—culture medium type and light intensity—on the consortium’s productivity under optimized conditions.

3.2. Development of the Mathematical Model

The mathematical model was constructed for the studied variables: nitrogen (N = f(t)), phosphorus (p = f(t)), and biomass (X = f(t)), using their initial values as input variables corresponding to the conditions at t = 0. The model parameters were treated as constants, and the output variables were the values of the studied variables at a given time t = t.

3.2.1. System 1: Biomass Generation by Microalgae (CO2 → Glucose → Biomass)

Figure 14 illustrates the schematic representation of System 1, depicting the mathematical relationships, functions, and interactions between the input variables (initial CO2 and biomass (X) concentrations), the model parameters, and the output variables.

3.2.2. System 2: NH4+ and PO43− Consumption Through the Formation of an Intermediate

Figure 15 illustrates the schematic representation of System 2, depicting the mathematical relationships, functions, and interactions between the input variables (initial concentrations of nitrogen, phosphorus, and the intermediate), the model parameters, and the output variables.

3.2.3. System 3: Microalgae–Bacteria Consortium Interaction

System 3, which describes the interaction of the consortium, is implicitly included in System 2 through the constant “k”, which is part of the equation for the intermediate formation rate (Figure 15; Table 2).

3.3. Simulation, Estimation, and Calibration of the Model Parameters

The model was simulated using the values of the variables under the system’s initial conditions (Table 6). Figure 16 presents the simulation results of the model using the initially estimated parameter values, prior to calibration (Table 7, Estimated Value). The figure illustrates the behavior of the variables: nitrogen in red (N), phosphorus in blue (P), biomass in black (X), and carbon dioxide in yellow (C).
The parameter estimation process through data fitting resulted in the parameter values listed in Table 7 (Estimated Value). The calibration process of the previously estimated values led to the final calibrated parameter values for the model, as shown in Table 7 (Calibrated Value).
The calibrated parameter values (Table 7: Calibrated Value) were used for the construction of the final mathematical model, which consists of a system of five ordinary differential equations:
d C O 2 d t = 0.25 · C O 2 4 + C O 2 · X   d X d t = ( 1.16 · 10 2 ) · C O 2 4 + C O 2 ( 3.69 · 10 4 ) · X d N d t = 1.55 · N 1 + N · I   d P d t = 2 · P 4 + P · I   d I d t = ( 7.75 · 10 2 ) · N 1 + N ( 3.97 · 10 4 ) · I  
The initial conditions of the mathematical model with the calibrated parameters remain the same as those used in the simulations prior to calibration (Table 6).

3.4. Graphical Comparison and Calculation of the Standard Error of the Estimation

The comparison between the data generated by the final mathematical model and the experimental data are illustrated in the graphs of Figure 17 for the following variables: nitrogen, phosphorus, and biomass.

Standard Error of the Model and Validation

Table 8 presents the results of the calculated standard error of the model (Syxs) and its validation status.

3.5. Global Yields: Comparison Between Experimental Data and Mathematical Model

Table 9 presents the results of yields for biomass and removal efficiency for contaminants (ammonium and phosphate), with values calculated for both the experimental data and the simulated data from the model.
The final analysis indicated that the experiments achieved nitrogen removal of 87.16% and phosphorus removal of 90.34%. In the simulations, these values reached 100% for both nutrients. These results, along with the graphical comparison (Figure 17) and the calculation of the model’s standard error (Table 8), demonstrate a high degree of representativeness of the model for these consortial processes.
Table 10 presents a summary of the most relevant results obtained in this research for both the response surface analysis and mathematical modeling stages.

4. Discussion

In the study on the factors affecting the growth of Chlorella sp., the graphs and statistical analysis confirmed that cultures exposed to higher light intensity rapidly increased their biomass concentration. This was evidenced by the rise in absorbance levels and coloration, which simultaneously reflected accelerated increases in pH and temperature. The high growth rates of microalgae led to a rapid pH increase, causing additional effects, such as the volatilization of certain nutrients, including nitrogen [16]. In fact, if the pH increases excessively, the culture becomes inhibited and loses its ability to grow progressively. Therefore, it is necessary to constantly regulate this control parameter by adding carbon dioxide (CO2), whose concentration is directly proportional to the pH of the medium. According to the findings of [16], a CO2 concentration of 10% v/v resulted in pH values between 8 and 9, while 17.5% v/v CO2 maintained pH levels between 7 and 8, and 25% v/v CO2 led to pH values between 6 and 7.
Under optimal conditions, similar to those described in study [16], our experiment maintained a pH range of 6 to 7 with CO2 injections ranging from 20% to 25% v/v. This approach resulted in notable biomass growth and achieved nitrogen and phosphorus removal efficiencies exceeding 85%. These results conclude that the addition of the optimal amount of CO2 promotes the growth of microalgae by providing favorable pH conditions in the medium, thus improving the biomass production and nitrogen assimilation by the consortium. It is important to mention that the addition of concentrations greater than 30% of CO2 and continuous flow generates a negative effect on the culture medium since it greatly reduces the pH, destabilizing it immediately and inhibiting the growth of microorganisms.
A study by [43] highlighted the impact of carbon sources and nutrient concentrations on the biomass and carbohydrate productivity of A. platensis. The results demonstrated that supplementing the culture medium with NaHCO3 concentrations up to 16 g L−1 significantly enhanced biomass productivity. However, further increasing NaHCO3 concentration did not enhance biomass growth but instead led to its depletion. It was found that 9.8 g L−1 of NaHCO3 was optimal for promoting biomass and carbohydrate accumulation. It was also observed that pH is directly affected by the concentration of bicarbonates supplied in the medium. Indeed, this behavior was also observed by intermittently injecting 25% of gaseous CO2 directly into the culture medium (30 mg/L of aqueous carbonic acid), managing the maintenance of a pH level of 6 to 7 to obtain the best percentages of nutrient removal. Continuing with the report, the mentioned author indicates that two cyanobacteria strains, Lyngbya limnetica and Oscillatoria obscura, were cultivated at pH 9.0, producing a maximum biomass of 1196 mg L−1 and 1226 mg L−1, with a carbohydrate content of 219 mg g−1 and 192 mg g−1, respectively. In addition to bicarbonates, the direct addition of CO2 and the use of other carbon sources, such as pentose and sucrose, have proven to be beneficial for enhancing carbohydrate accumulation. However, there are also cases where bicarbonate addition improved both protein and carbohydrate production.
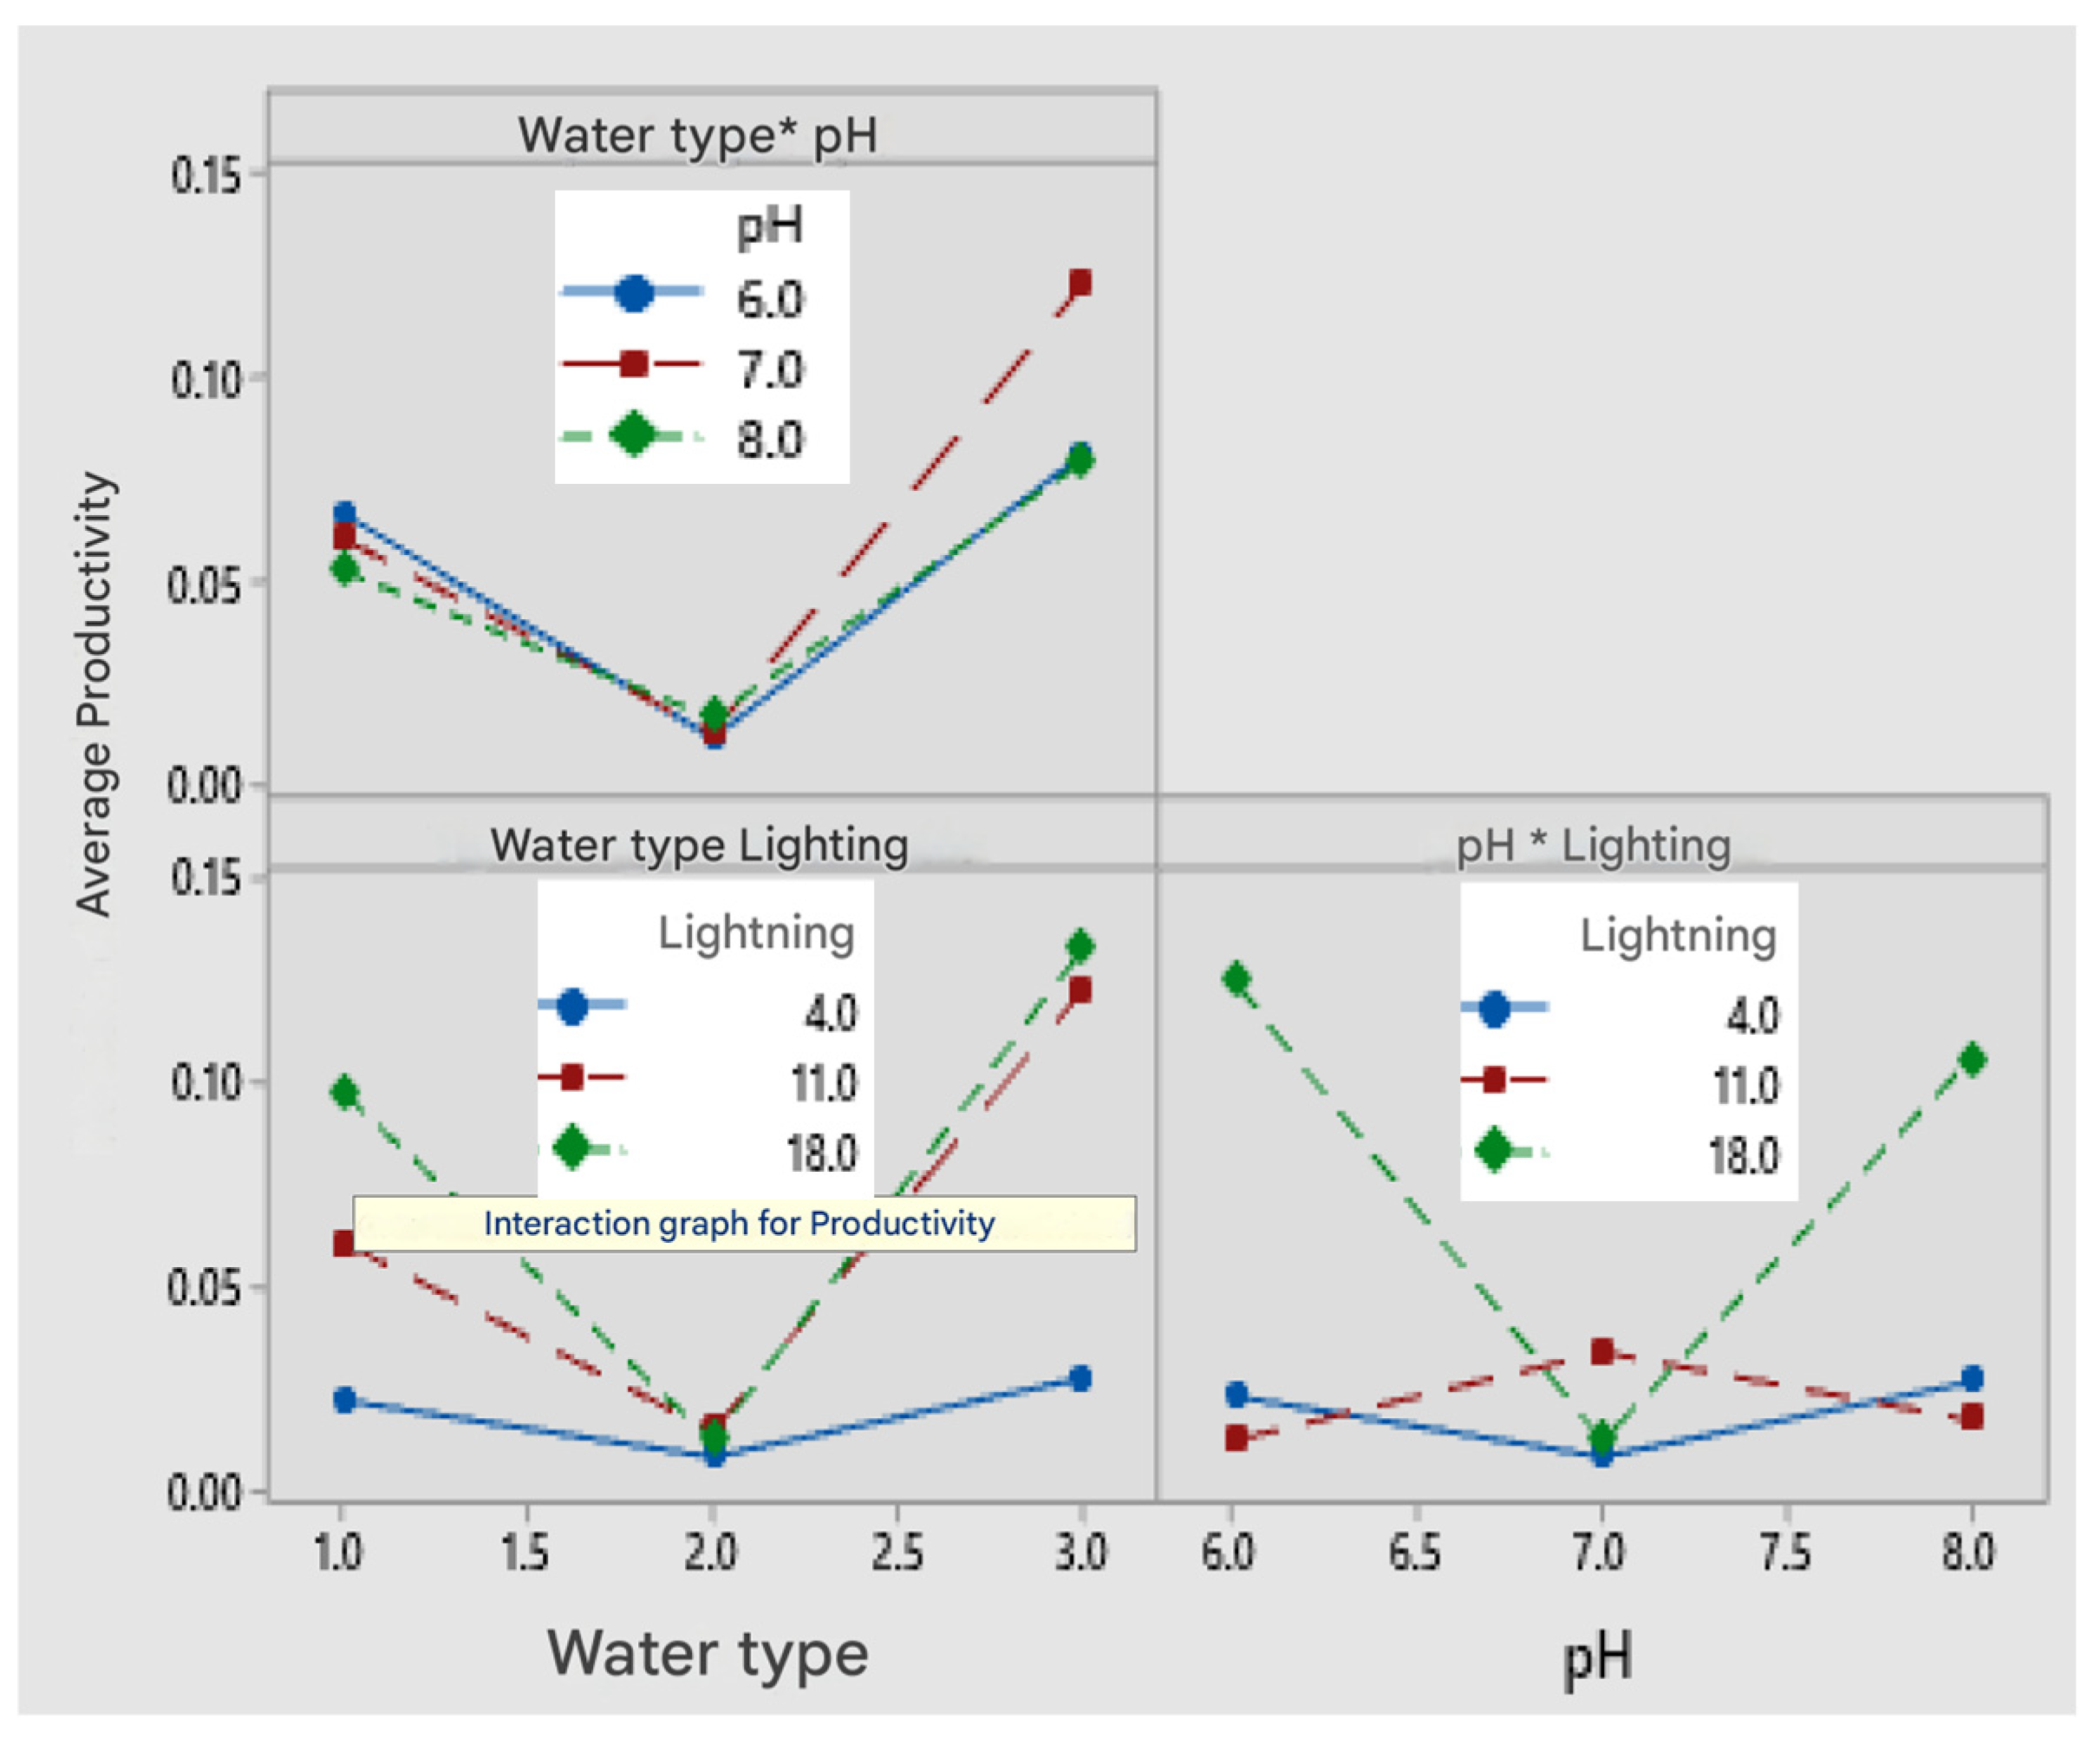
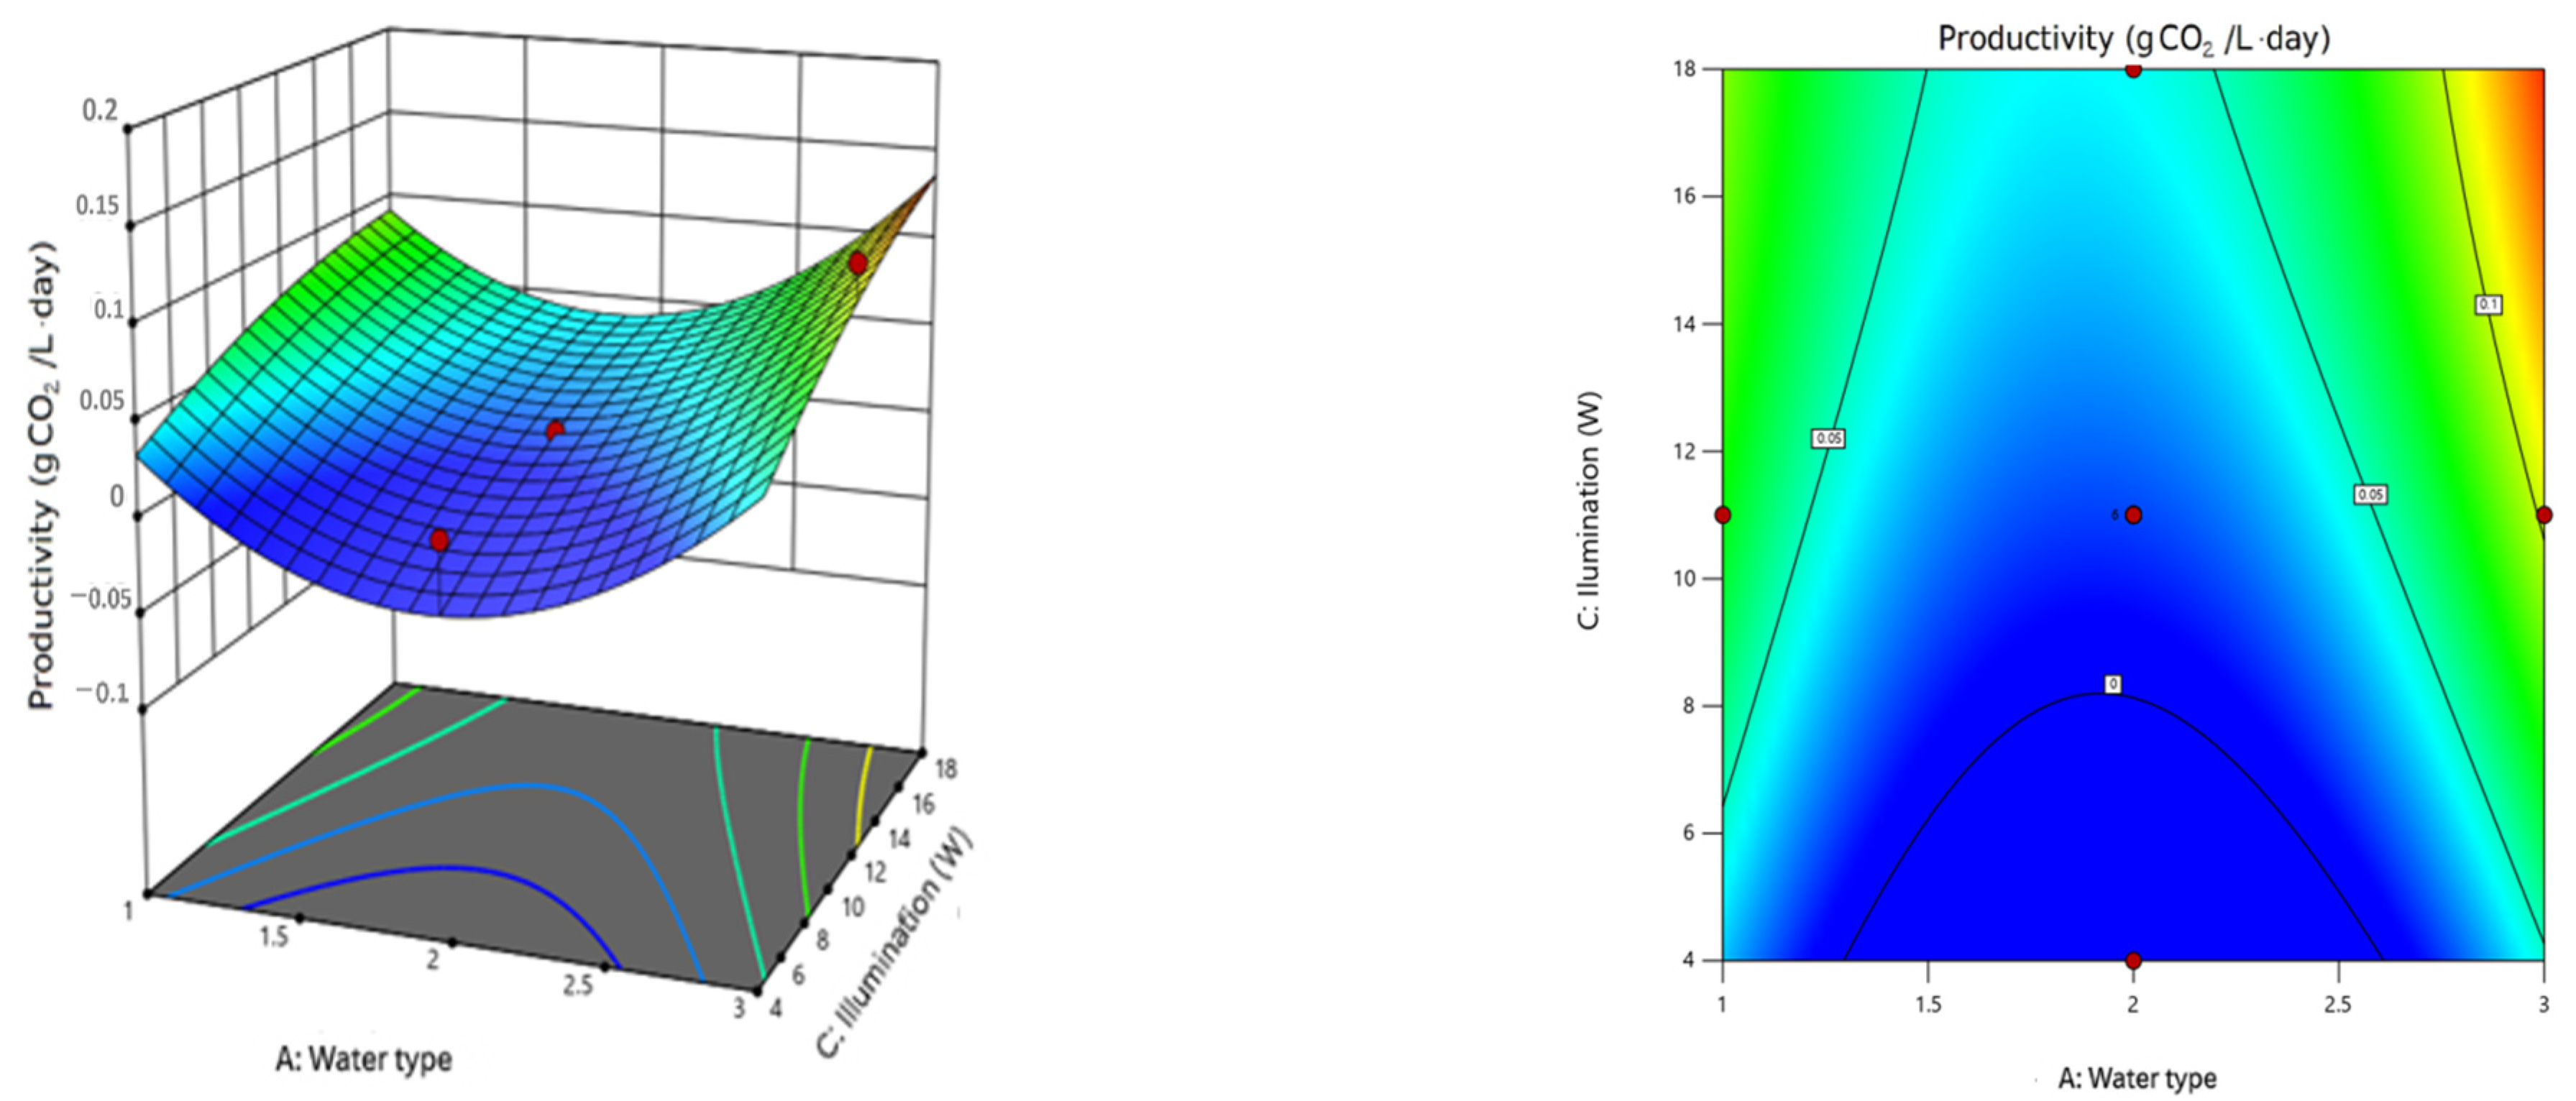
On the other hand, light intensity plays a crucial role in the growth of microalgae; these microorganisms require a sufficient amount of light energy to perform photosynthesis. However, excessive light exposure can also inhibit growth due to overexposure. Our results were consistent with the theory regarding the factors with the greatest influence on microalgae growth. The factors of greatest influence reported in this study are light intensity and culture medium type, while pH has a lesser impact. The graphs and statistical analysis confirmed that cultures exposed to higher light intensity rapidly increased their biomass concentration. En nuetro estudio se probaron 3 intensidades de luz 4μmolm−2 s−1, 11μmolm−2 s−1y 18μmolm−2 s−1, durante la experimentacion se verificó que a medida que las intesidades aumentaban los cultivos tambien incrementaban su población y su porcetaje de remocion de nuetrientes, siendo 18 μmolm−2 s−1 la intensidad optima para el ensayo. Similar to this behavior, the author of [29] reported that the rate of biomass growth and the rate of CO2 consumption increased with increasing light intensity over the crop. In his study, he found that the optimal intensity for chlorella vulgaris was 150 ± 3 μmolm−2 s−1.
In a study carried out by [44] the feasibility of the cultivation of the microalgae Scenedesmus dimorphus and Chlorella pyrenoidosa was evaluated, both separately and in combination with the plant growth-promoting bacterium Azospirillum brasilense, using mixtures of Cheese Acid Whey (SAQ) and Beef Slurry (PV). The results showed that Scenedesmus dimorphus achieved the highest removal of nitrogenous inorganic compounds, being able to grow in a mixture of 50% of each of these effluents (50% PV-50% SAQ) and removing 90% of P-PO4 and 70% of N-NH4, resulting in a biomass productivity of 0.41 ± 0.03 g L−1 d−1 and maintaining its dominance in cultivation. Likewise [44], our study revealed that Chlorella sp. exhibited predominance in the culture medium, showing continuous growth and reaching a biomass productivity of 0.22 g L−1 d−1 and removal percentages of 94% of P-PO4 and 87% of N-NH4. From this comparison, it can be deduced that the microalgae Scenedesmus dimorphus and Chlorella sp. exhibit similar behaviors when cultured in consortium with other bacteria, both showing a notable preference for nitrogen consumption and reaching significant levels of productivity.
The results obtained in this study demonstrated nitrogen and phosphorus removal efficiencies of 87.16% and 94.43%, respectively, which align closely with the values reported by [11] (92.2% for nitrogen and 71.8–82.4% for phosphorus). Discrepancies between the results can be attributed to differences in the experimental conditions and methodological approaches employed. In terms of biomass production, this study optimized growth conditions through controlled variables such as light intensity and culture medium, resulting in a more comprehensive predictive capability compared to the production rates of 7.1–14.9 mg L−1 d−1 reported by [11]. While the authors of [11] relied on physicochemical parameters such as dissolved oxygen and electrical conductivity to monitor system performance in real time, the current study expanded the methodological approach by incorporating a mathematical model to predict nutrient removal dynamics and evaluate system behavior under optimized conditions. These methodological distinctions underscore the complementary approaches used to advance the understanding of microalgae–bacteria consortia for sustainable wastewater treatment.
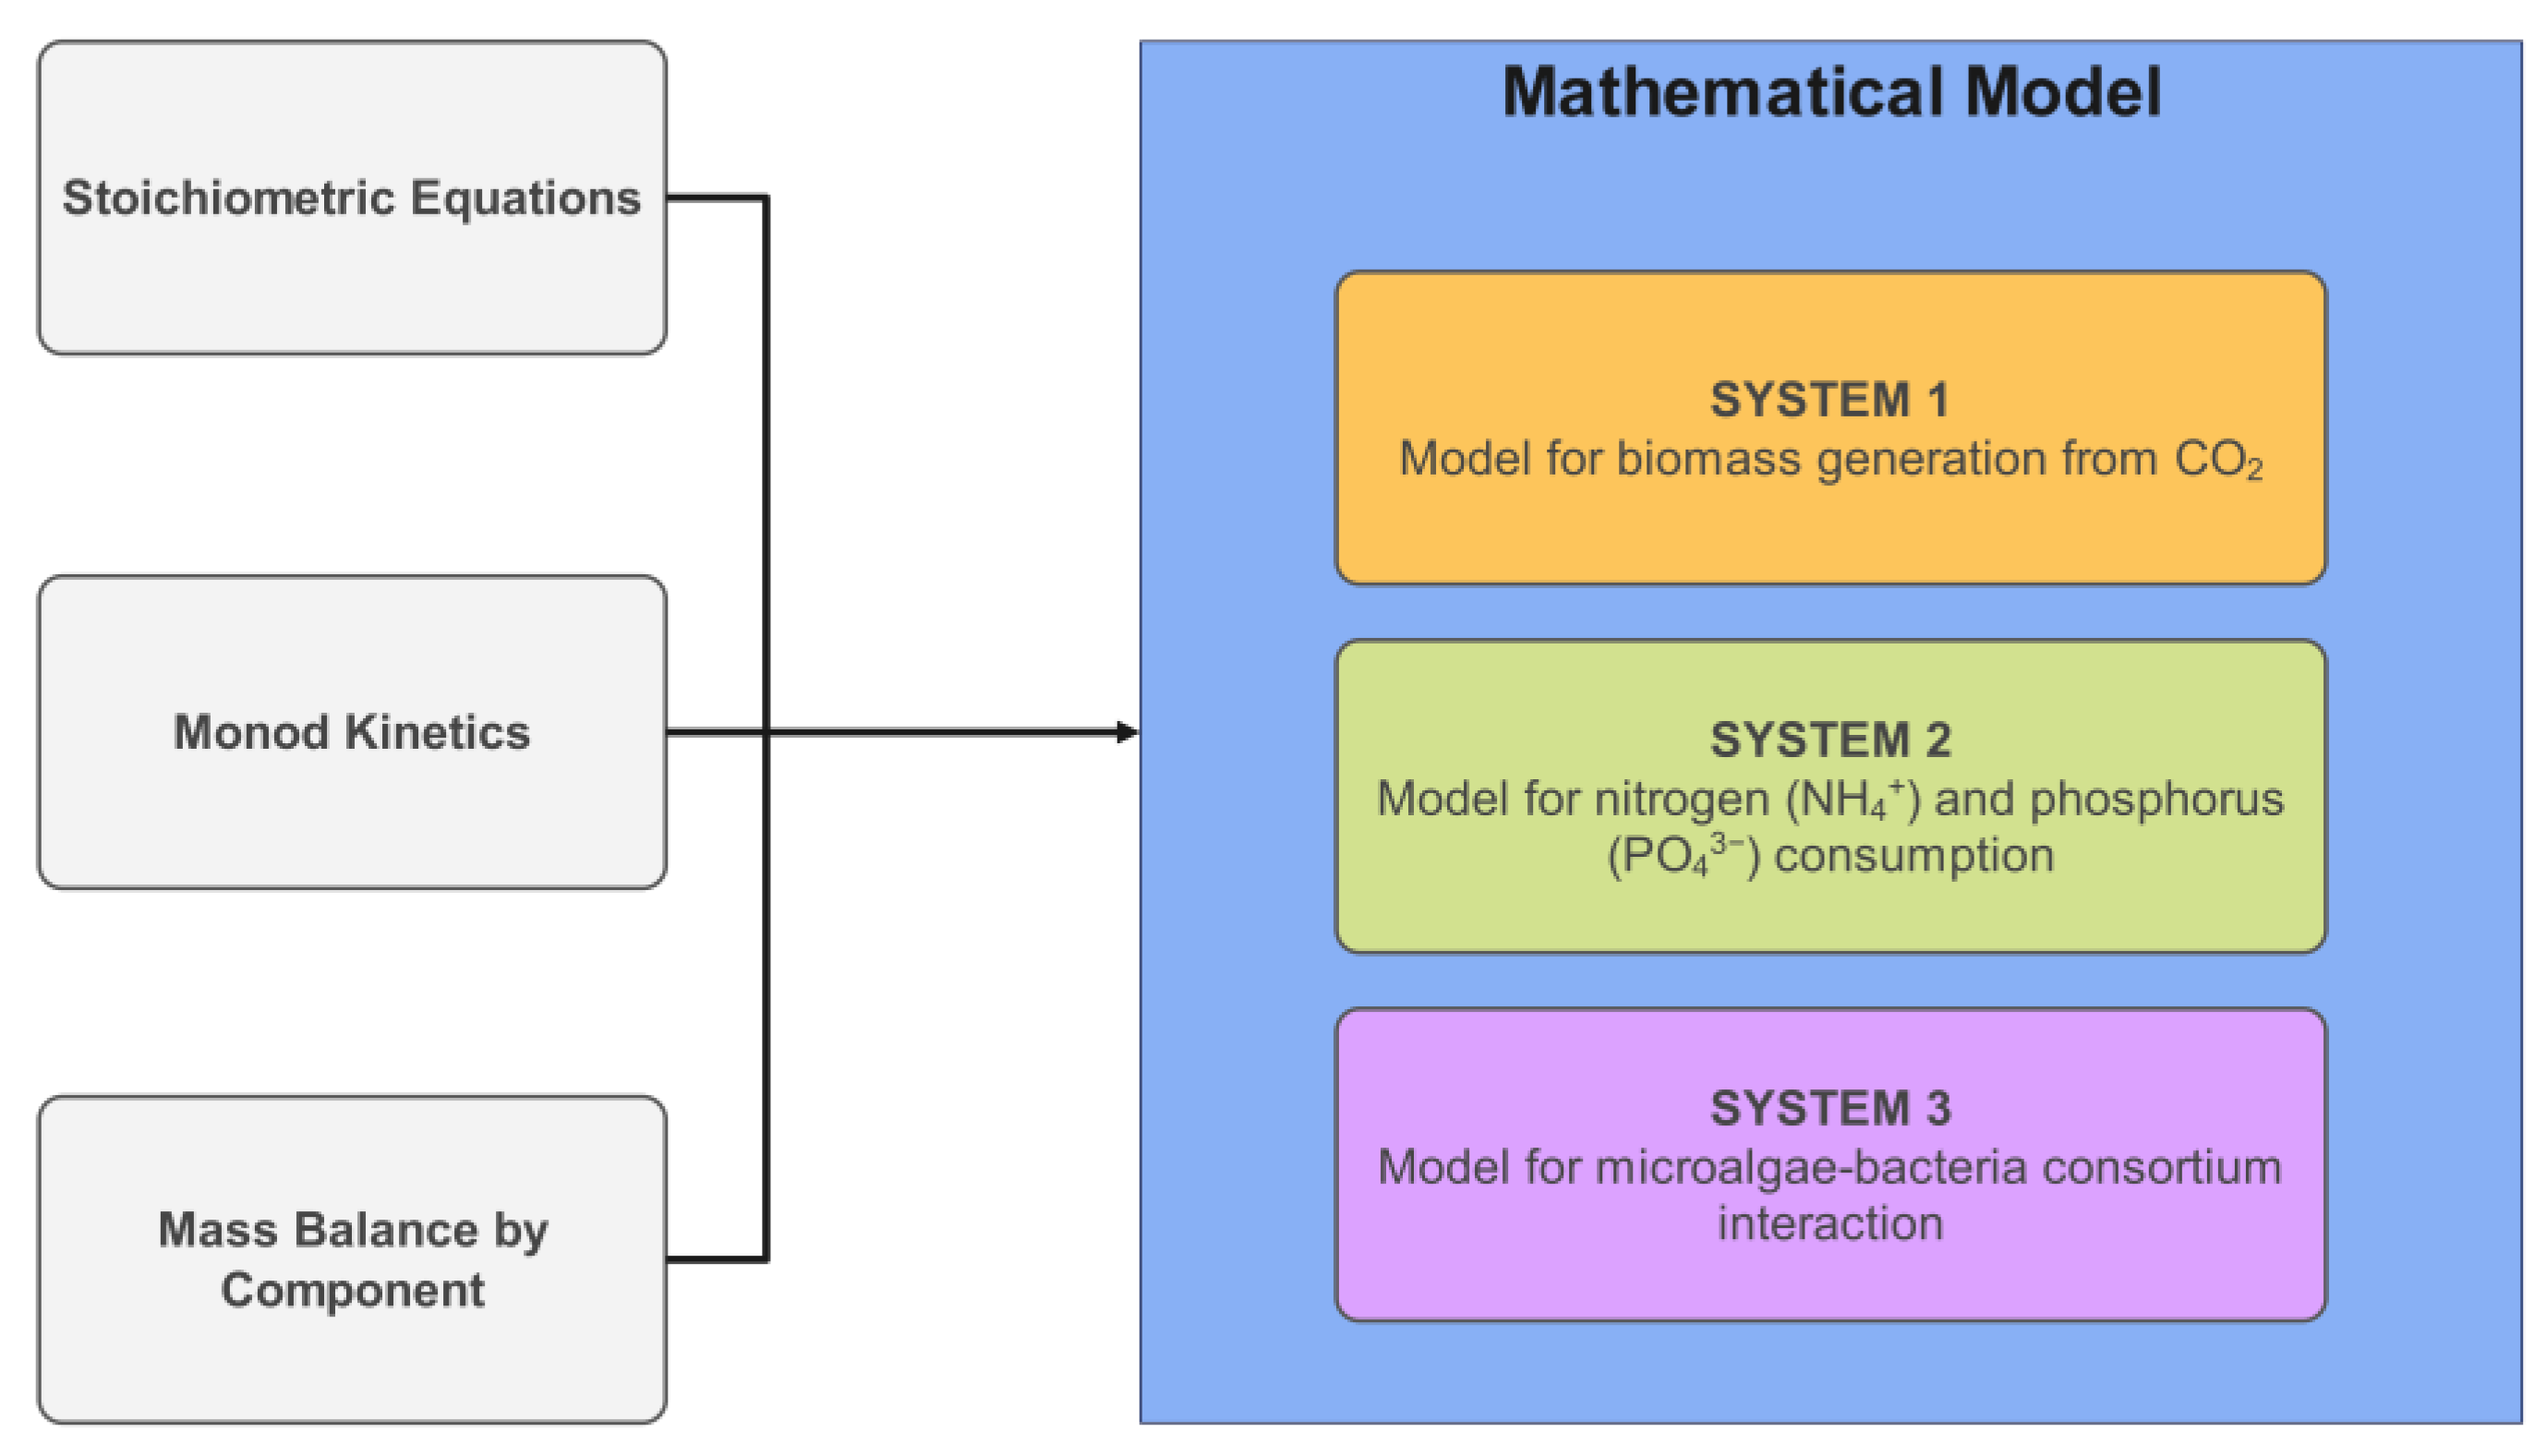
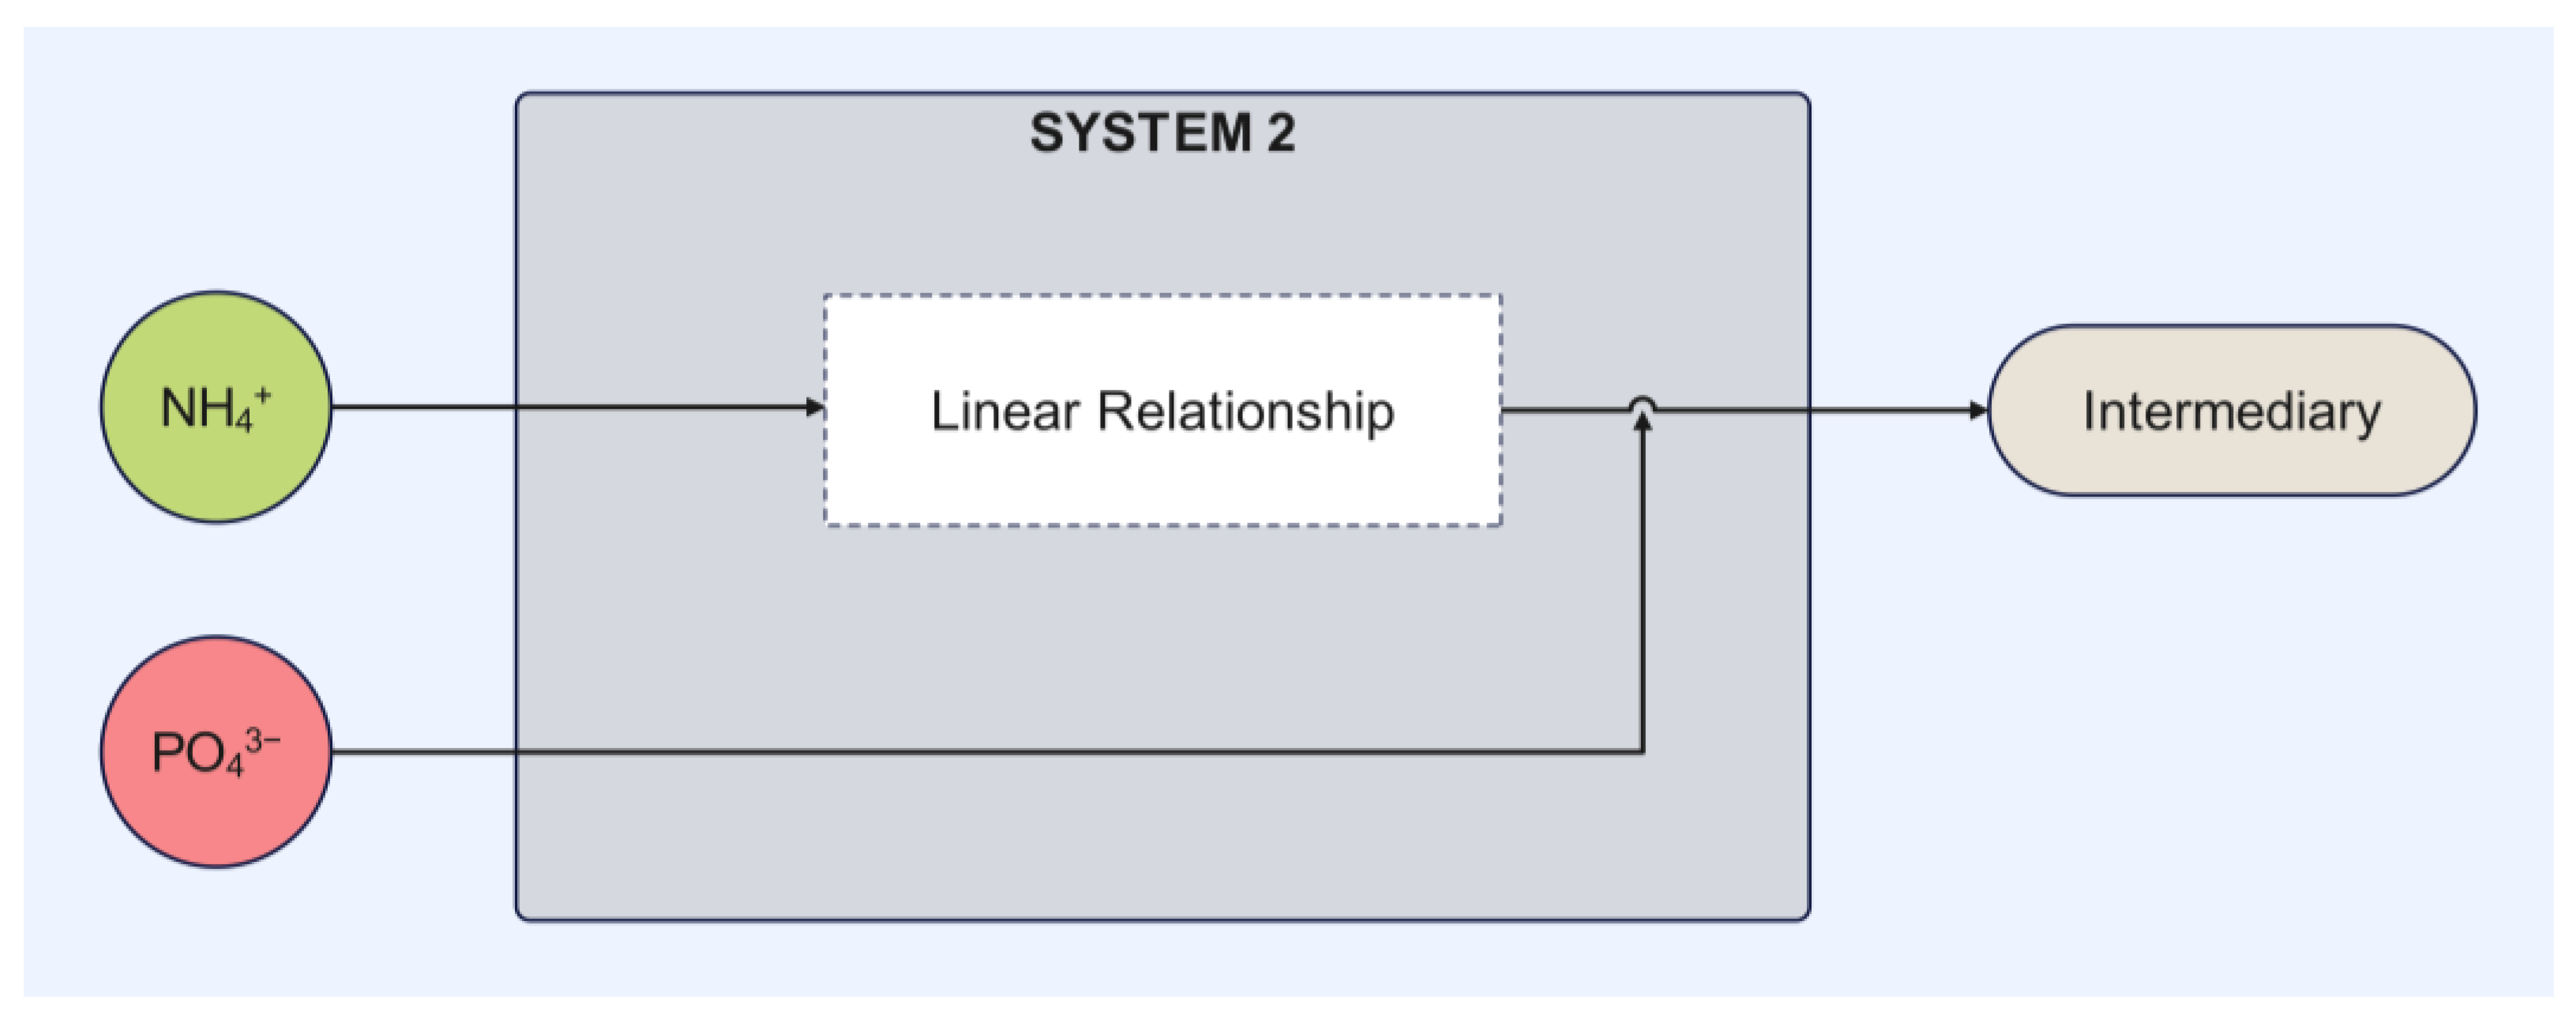
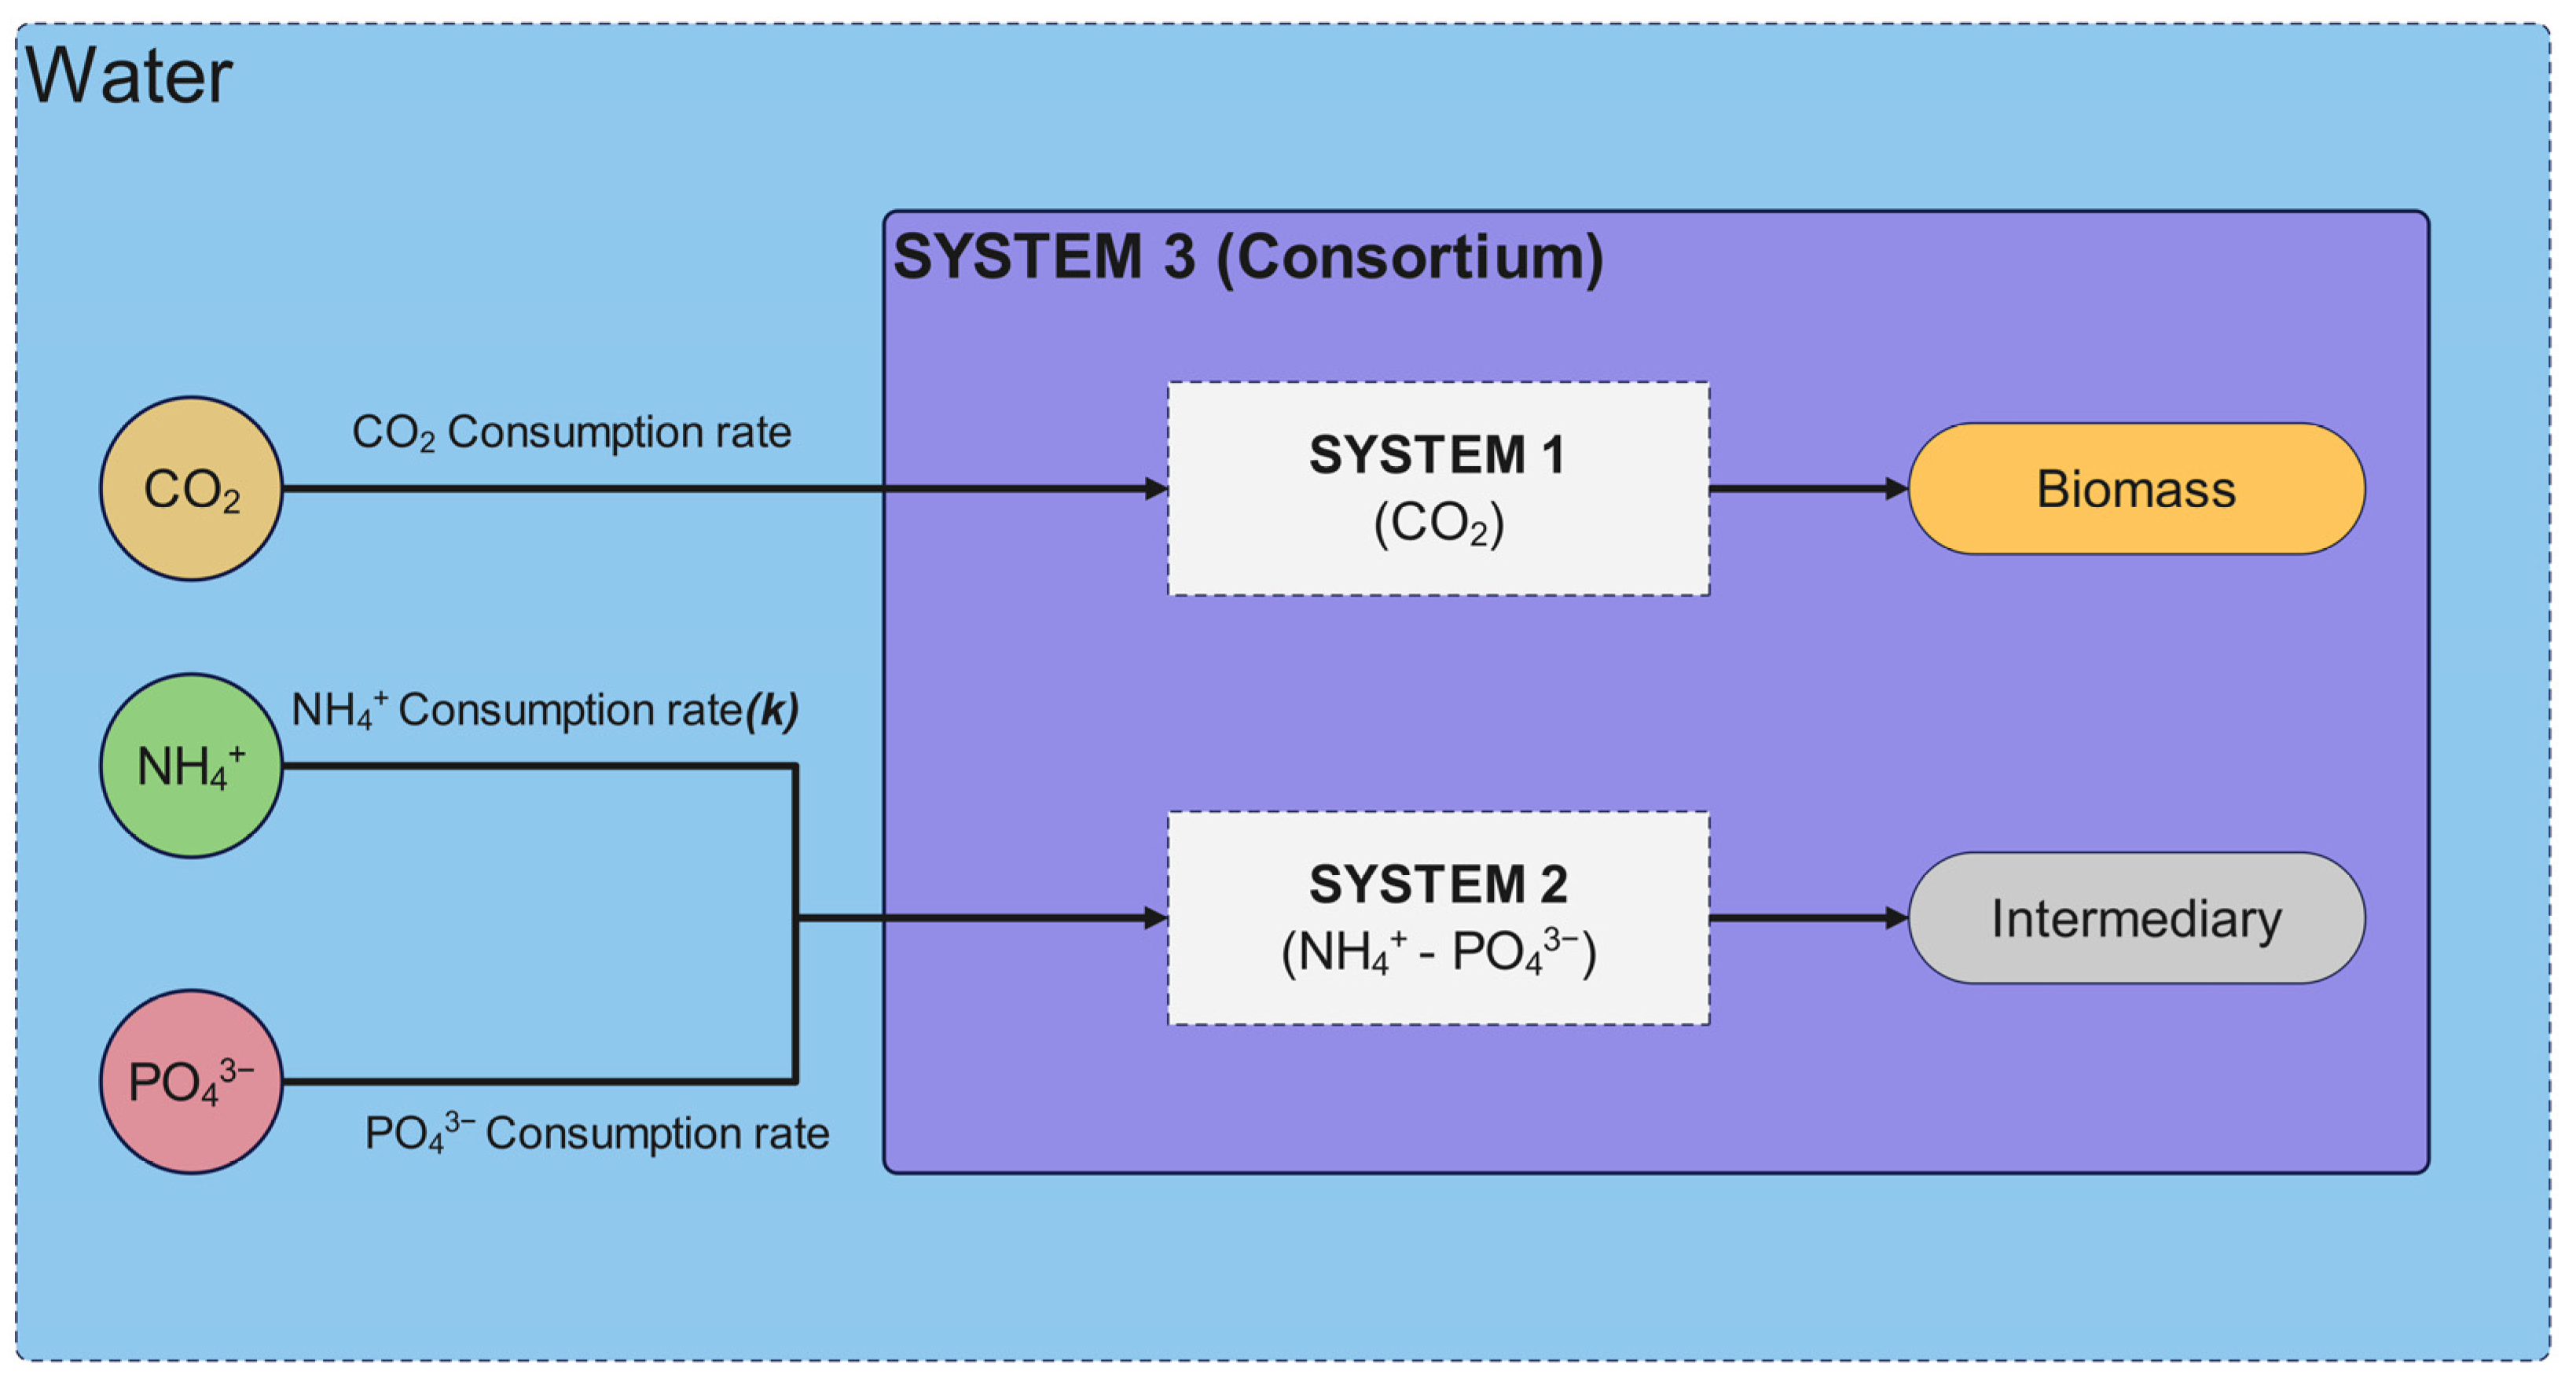
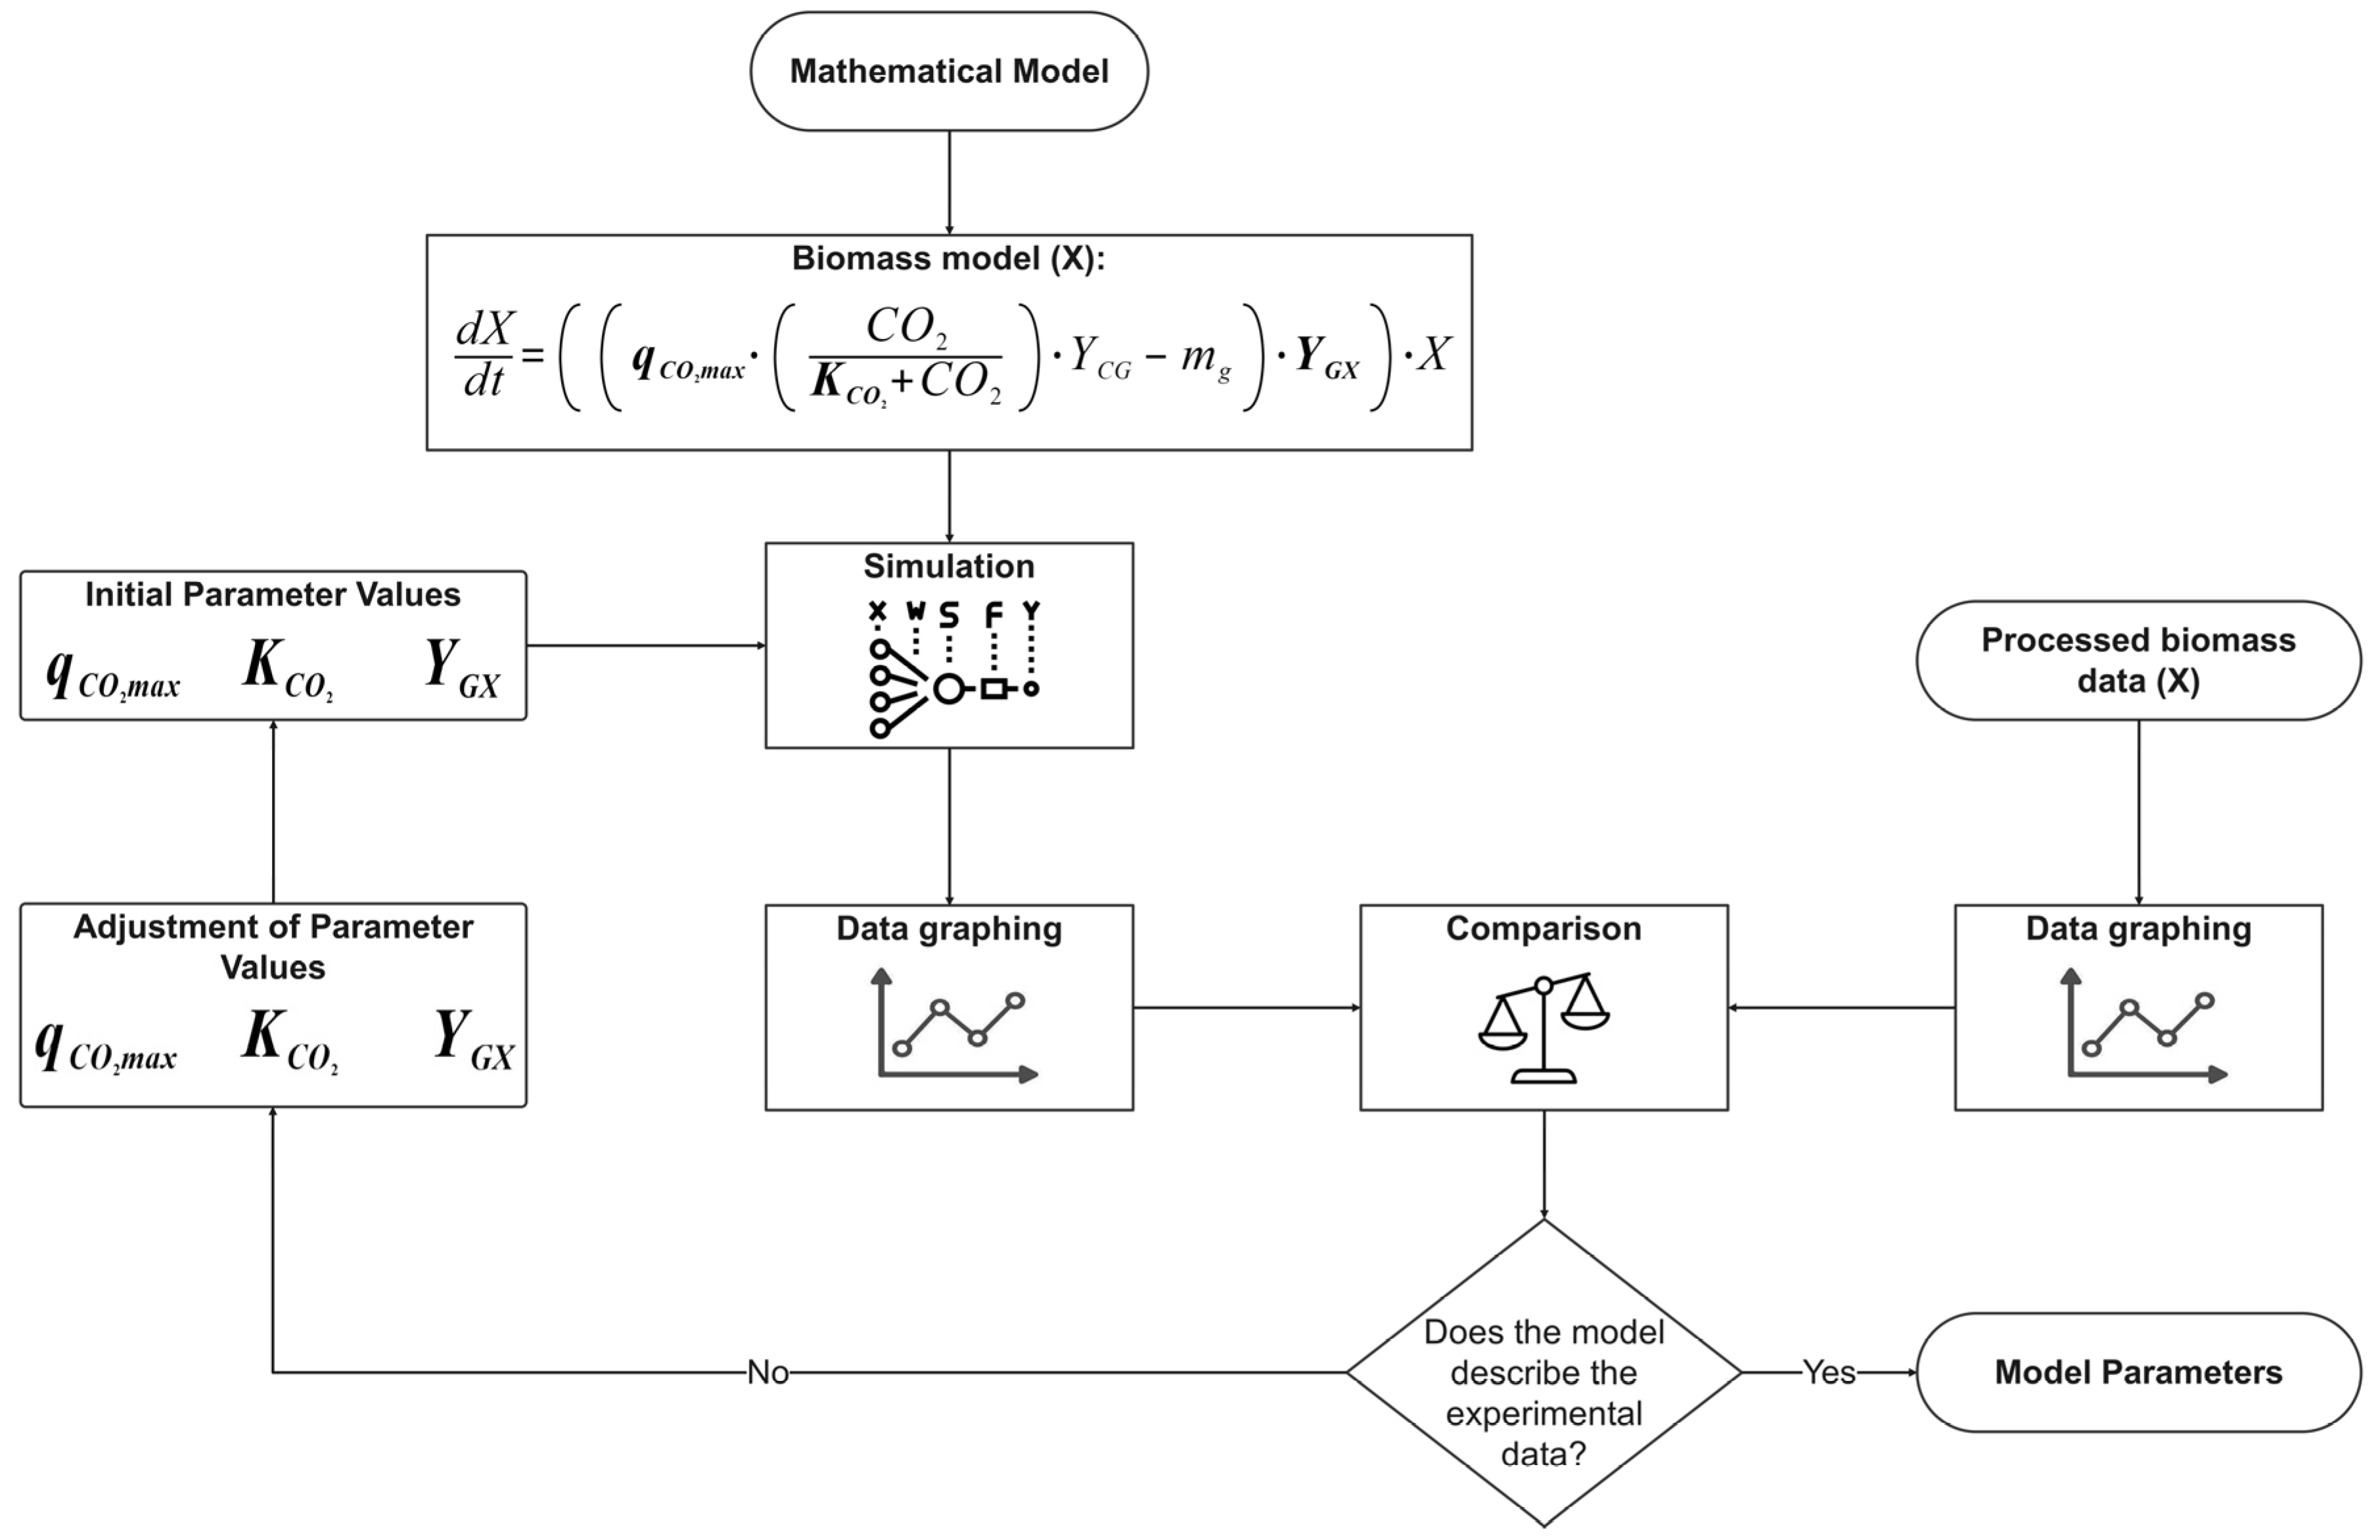
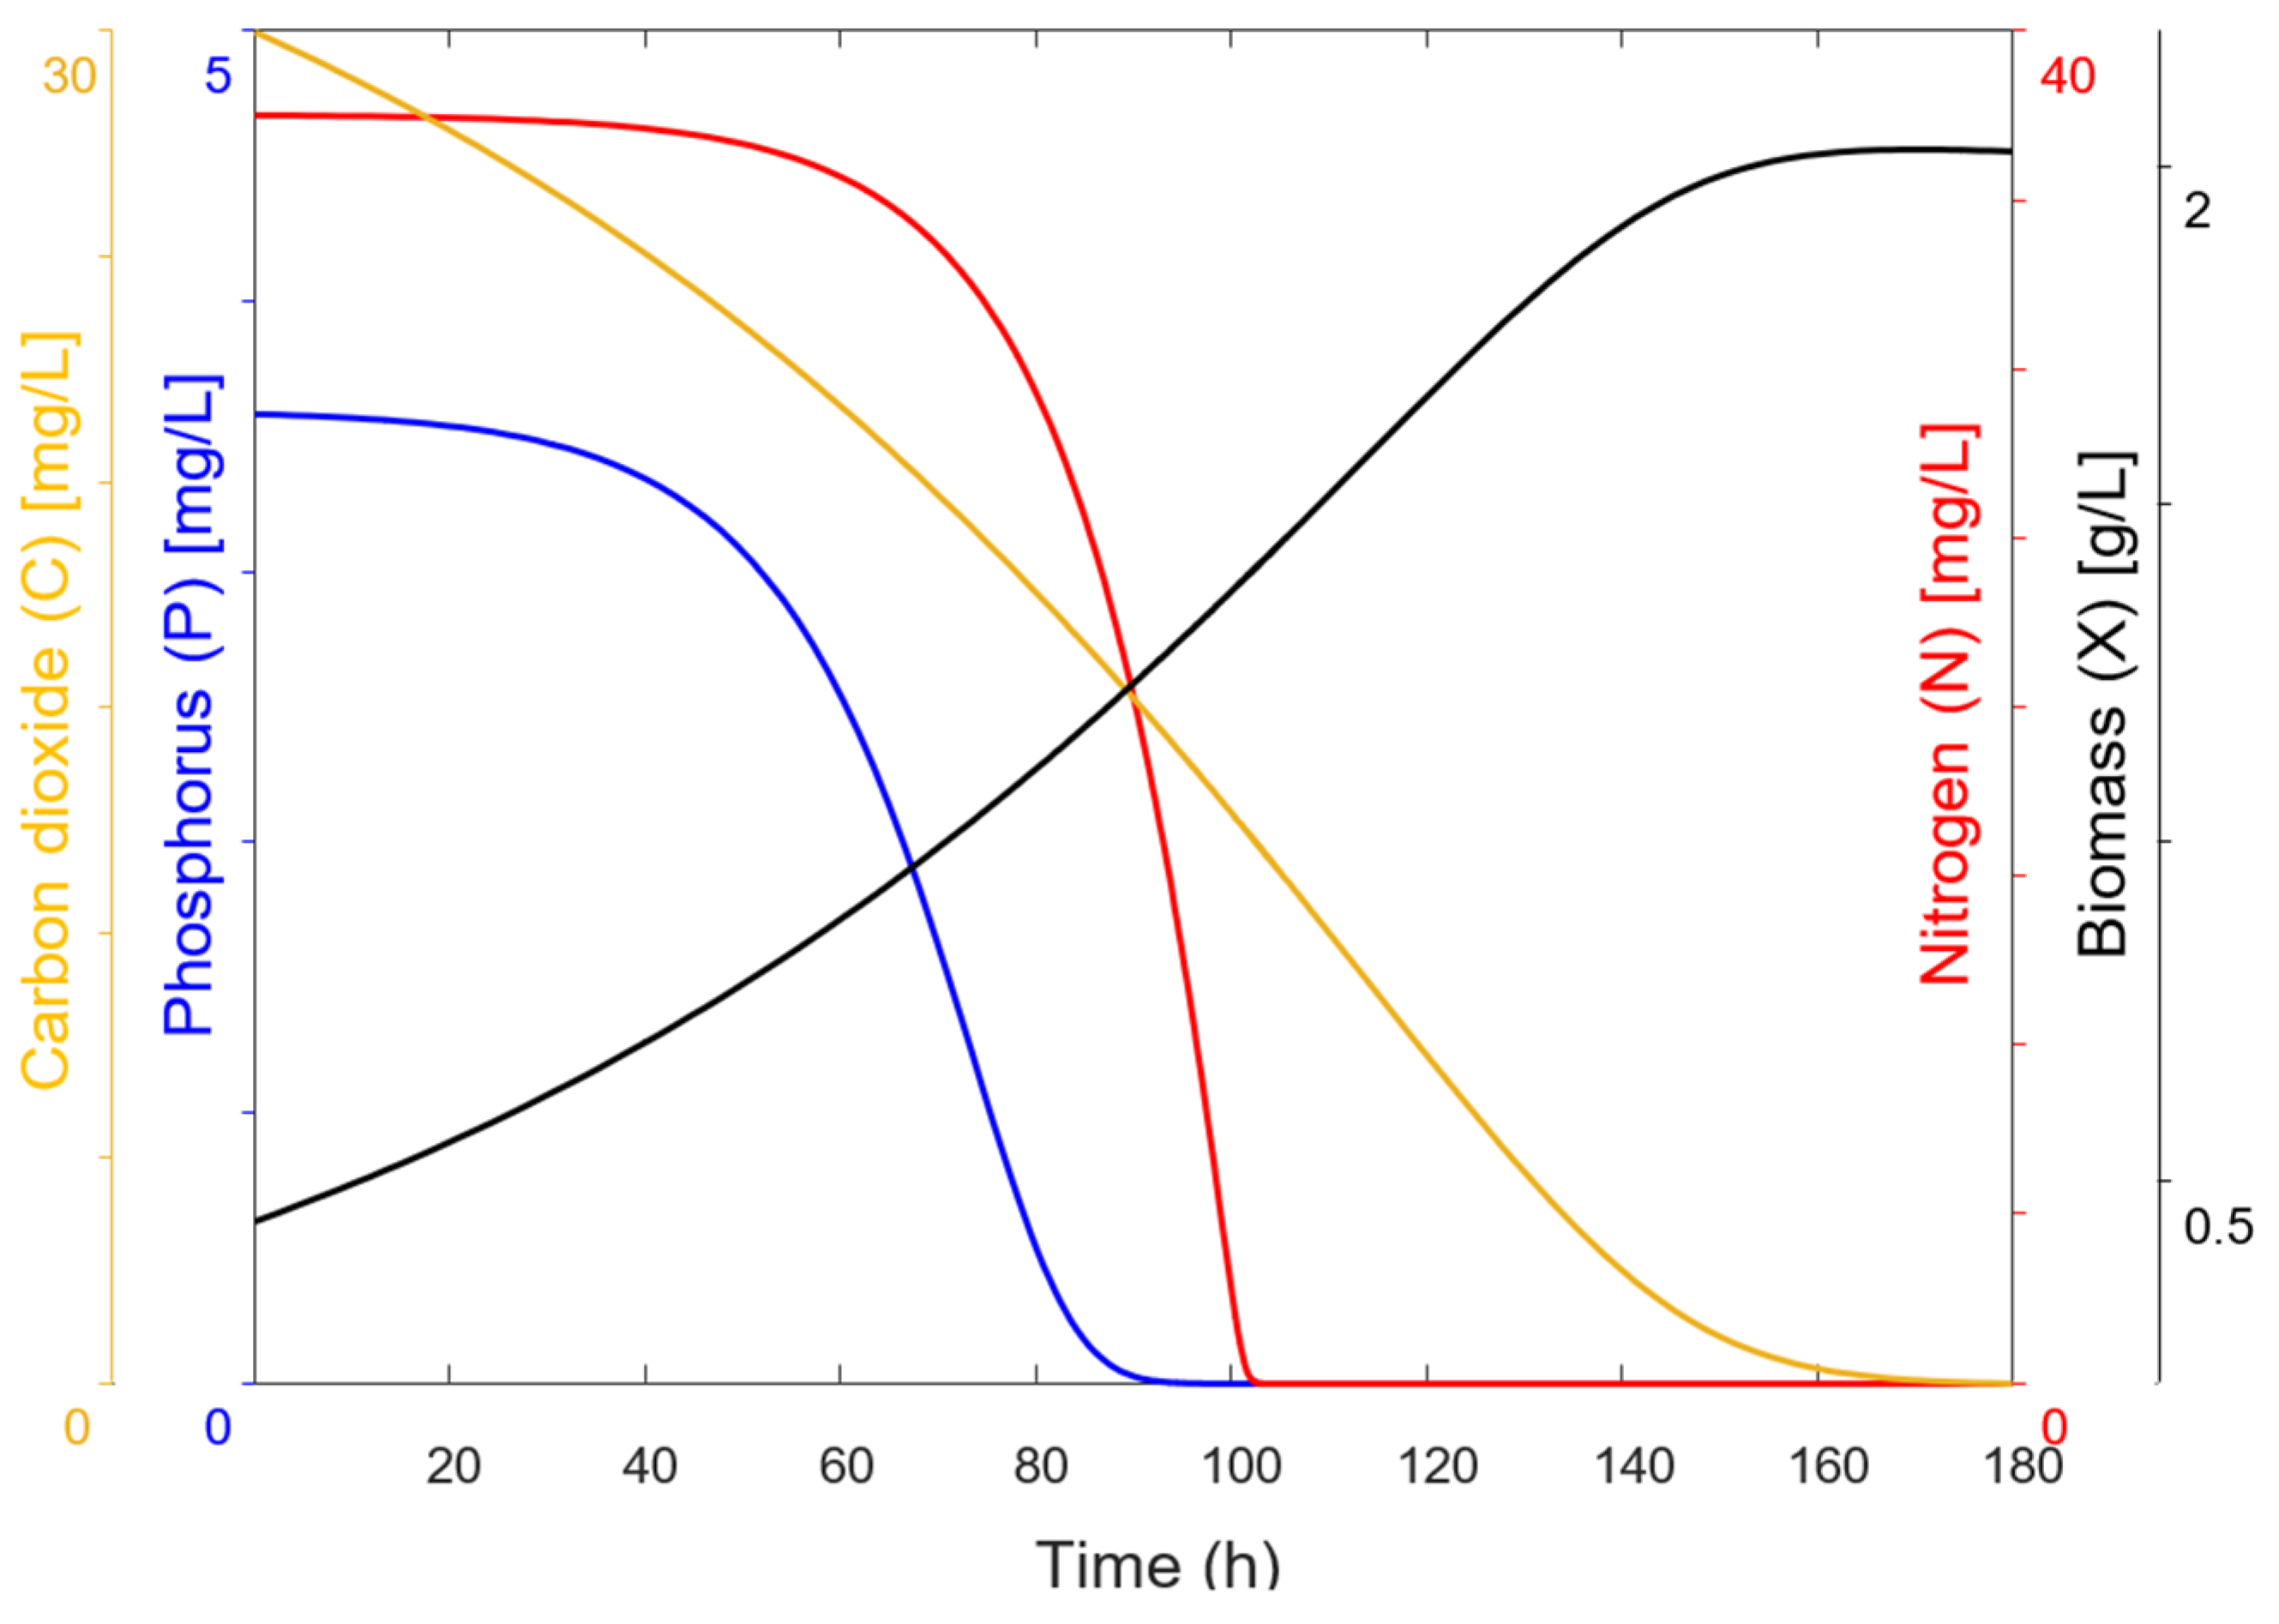
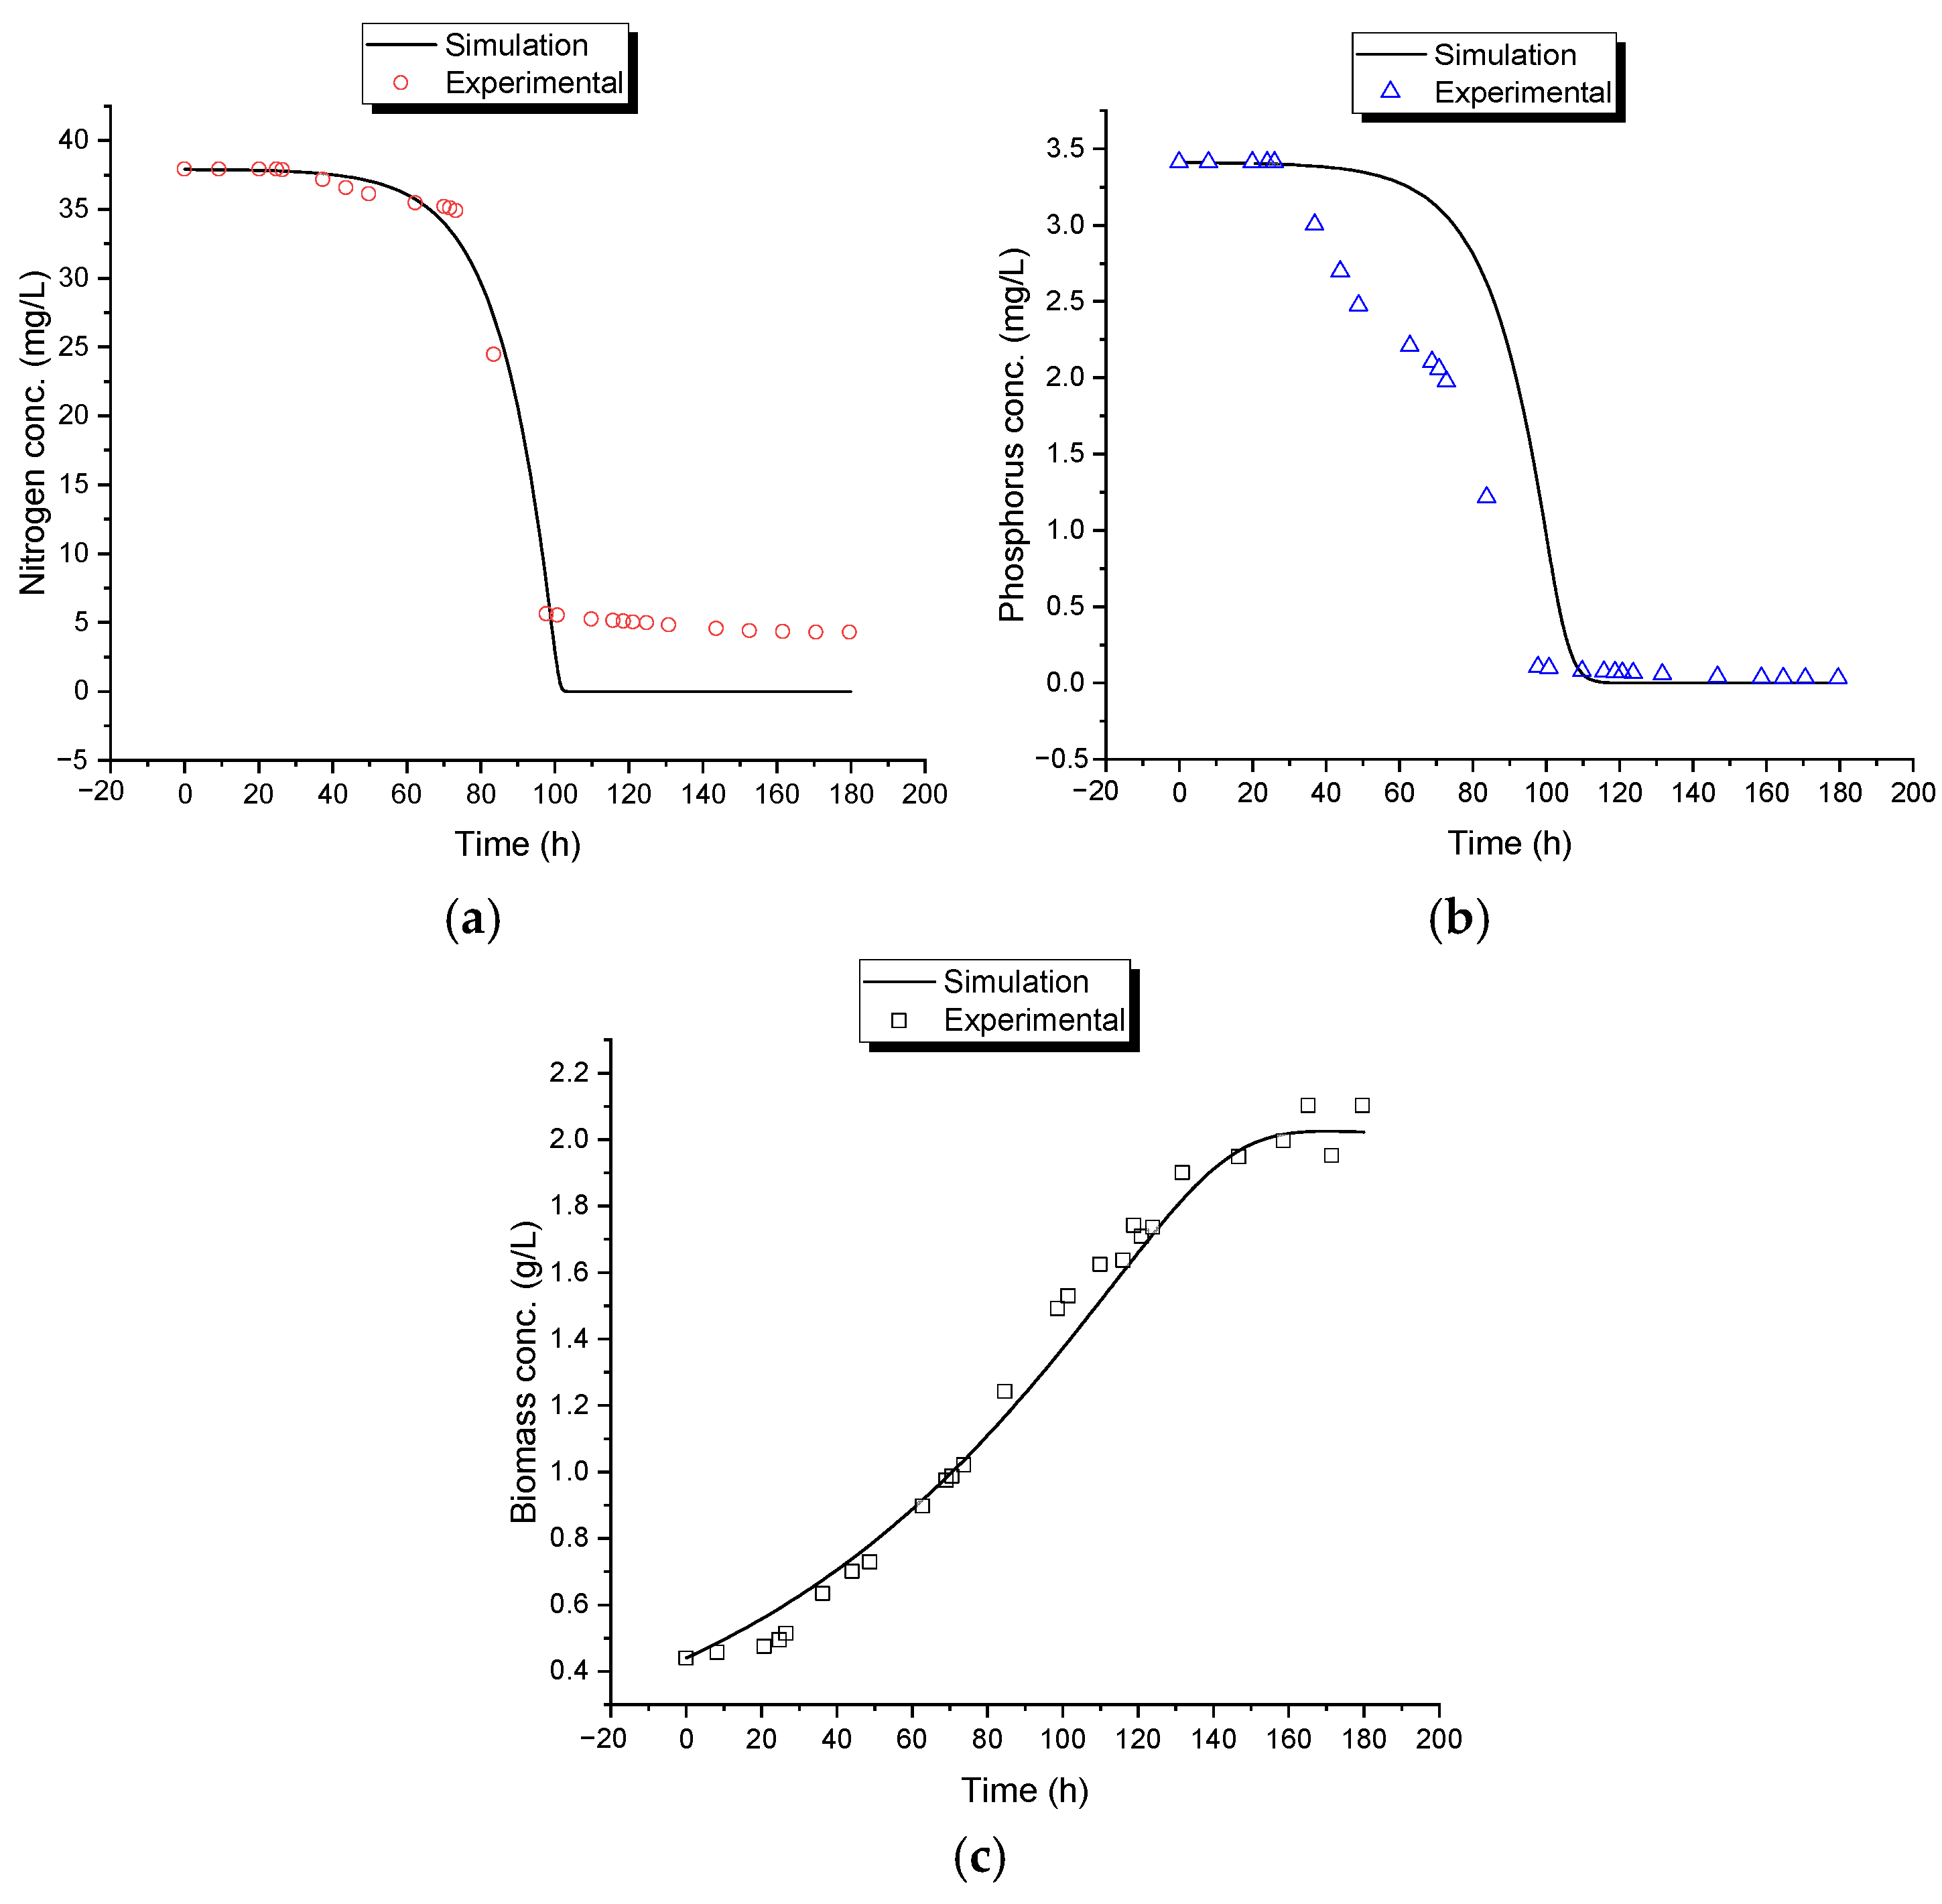
The mathematical model proposed in this study was structured into two independent systems to analyze biomass generation and contaminant removal. System 1, which describes the conversion of CO
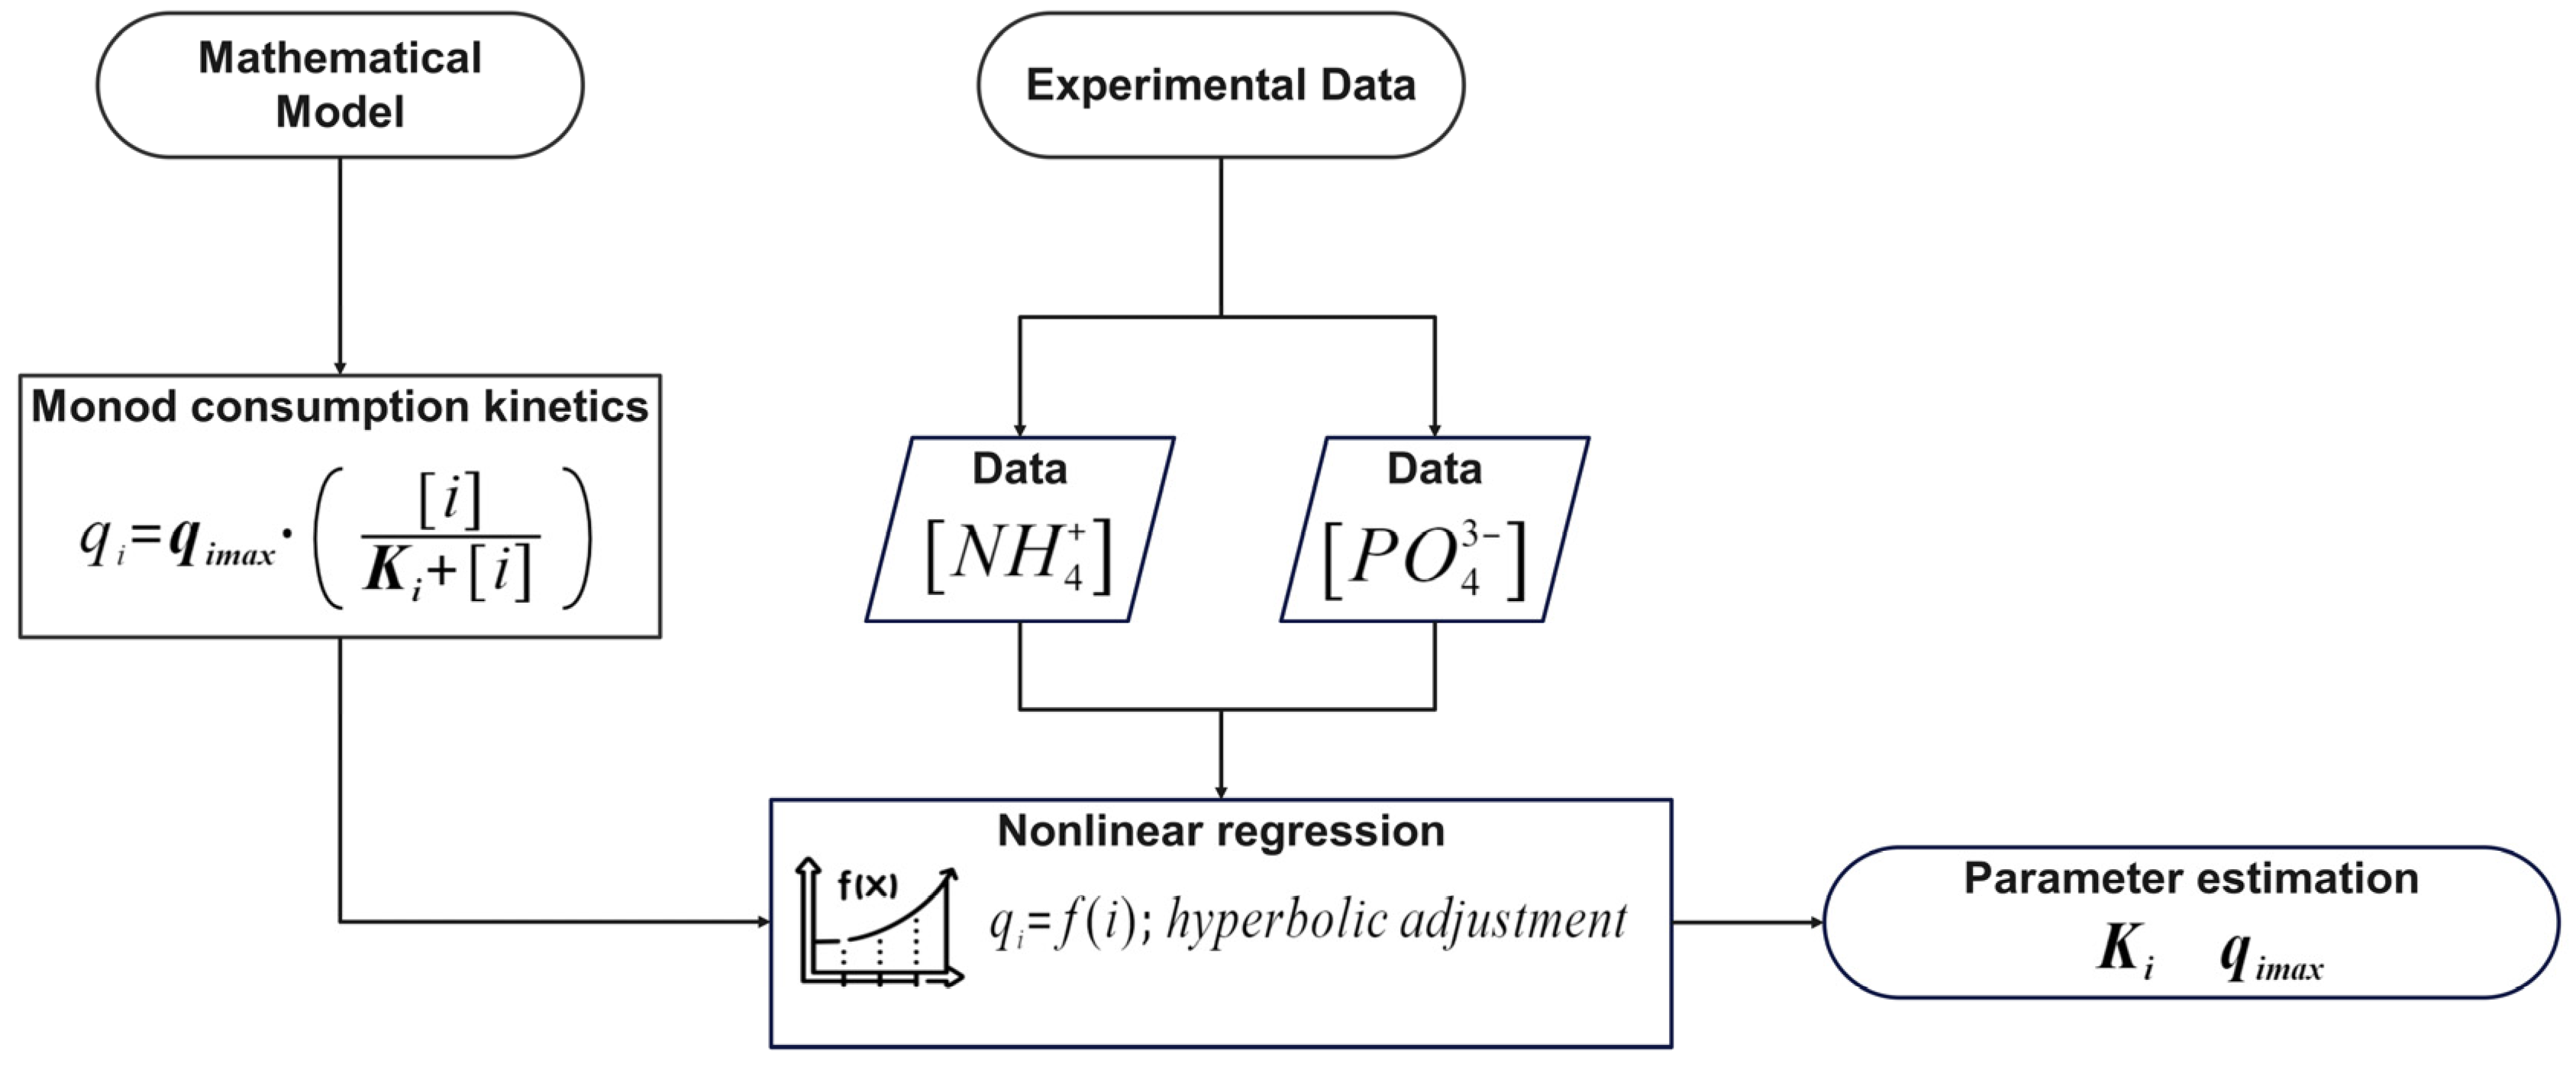
2 into biomass, exhibited high precision in its experimental behavior, with a standard error of 0.07186. The model predicted a biomass concentration of 2.02 g/L, closely matching the 1.95 g/L obtained experimentally. System 2, which describes the assimilation or consumption of nitrogen and phosphorus based on the assumption of an intermediate, exhibited a lower degree of correlation compared to System 1. The phosphorus model was the second most accurate, with a standard error of estimation of 0.63065, while the nitrogen model was the least accurate, with a standard error of estimation of 3.40285. Graphically, the discrepancies between the mathematical model and the experimental data were confirmed in the behavior of these variables, particularly in the final phase of the assimilation process, with greater differences observed for nitrogen. The final values obtained for these variables also support these discrepancies, as seen in the differences in removal percentages between the simulated and experimental data (Table 9). The experimental results showed that both contaminants were not fully consumed, leaving residual traces of 4.88 mg/L of nitrogen and 0.19 mg/L of phosphorus, whereas the model predicted complete removal (0.00 mg/L for both variables), achieving 100% theoretical removal efficiency.
The fact that phosphorus was almost completely consumed, while nitrogen was not, suggests two possible hypotheses: (1) nitrogen may not be acting as a limiting substrate, or (2) other unidentified factors and variables may be influencing the assimilation of both contaminants.
The second hypothesis is supported by studies from various authors who reported removal percentages similar to those in this study. These studies indicate that the removal of these contaminants is influenced by multiple factors, such as ammonium availability in the medium [10,12]; CO2 availability, which stimulates microalgal metabolism [10]; dissolved oxygen levels and the presence of other microorganisms, such as PAOs (polyphosphate-accumulating organisms), which play a role in phosphorus removal [12]; and alkalinity levels, which favor phosphorus removal but also enhance ammonium [12].
It is important to note that the conditions for comparing the results of this study with those obtained by [10] are limited due to several factors, including the different microalgae species used in both studies, the differences in water type and conditions, and most importantly, the microalgae–bacteria consortial relationships, which [10] did not include in their study.
Analyzing Hypothesis (2), it is known that when ammonium concentration is reduced too much, both microalgae and bacteria struggle to efficiently sustain phosphorus removal, preventing its complete [12]. In this study, despite achieving 94.43% phosphorus removal, the presence of residual nitrogen (87.16% ammonium removal) suggests that ammonium availability was sufficient to allow phosphorus uptake. This finding reinforces Hypothesis (2)—although phosphorus is removed in higher proportions, its elimination is not entirely autonomous but rather depends on the sufficient presence of ammonium in the system and other factors that require further investigation.
We would not rule out Hypothesis (1), which considers the possibility that phosphorus could also act as a limiting substrate under certain conditions, especially given that this study was conducted in a consortium where other microorganisms, such as PAOs [12], may be present. The interactions of these organisms within the consortium were not considered in this study. In wastewater treatment systems, phosphorus is typically present in lower concentrations than nitrogen, which could influence its availability for biomass assimilation. Mathematically, under the experimental conditions, using phosphorus as a limiting factor for intermediate formation would, in turn, condition nitrogen assimilation. This hypothesis could be explored by incorporating a stoichiometric relationship that considers phosphorus, nitrogen, and bacterial biomass formation. Evaluating this scenario would allow a comparison between both conditions and help determine under what circumstances phosphorus might restrict nitrogen removal.
Despite the discussed discrepancies, the consortial model proposed in this study, structured as two independent systems, aligns with the independent models proposed by [12] and accurately describes the experimental data with a high degree of precision.
It can be interpreted that the simulated model predicts optimal removal under ideal conditions; however, in reality, limitations imposed by alkalinity, oxygen availability, CO2 availability, and interactions with other microorganisms may affect nutrient removal efficiency.
Given the observed interactions in the system, there is a possibility of reformulating the model into three independent systems, allowing for a more precise representation of nutrient removal dynamics: System 1 would describe microalgae growth (CO2 → Biomass), System 2 would represent the nitrification process by bacteria (NH4+ → NO3), and System 3 would account for phosphorus removal mediated by PAOs (PO43− → Polyphosphates) [12]. The model reformulation should also include a stoichiometric equation that links nitrogen and phosphorus removal (considering PAO metabolism and nitrifying bacteria activity) and account for the dynamics of an open aqueous system, including gas exchange, the evaporation rate, and the equilibrium of key species such as carbon dioxide and carbonic acid, which influence alkalinity and pH regulation.
This revised approach would allow for a more accurate representation of the interdependence between nitrogen and phosphorus removal, considering the differentiated influence of each process and the role of alkalinity in their regulation.
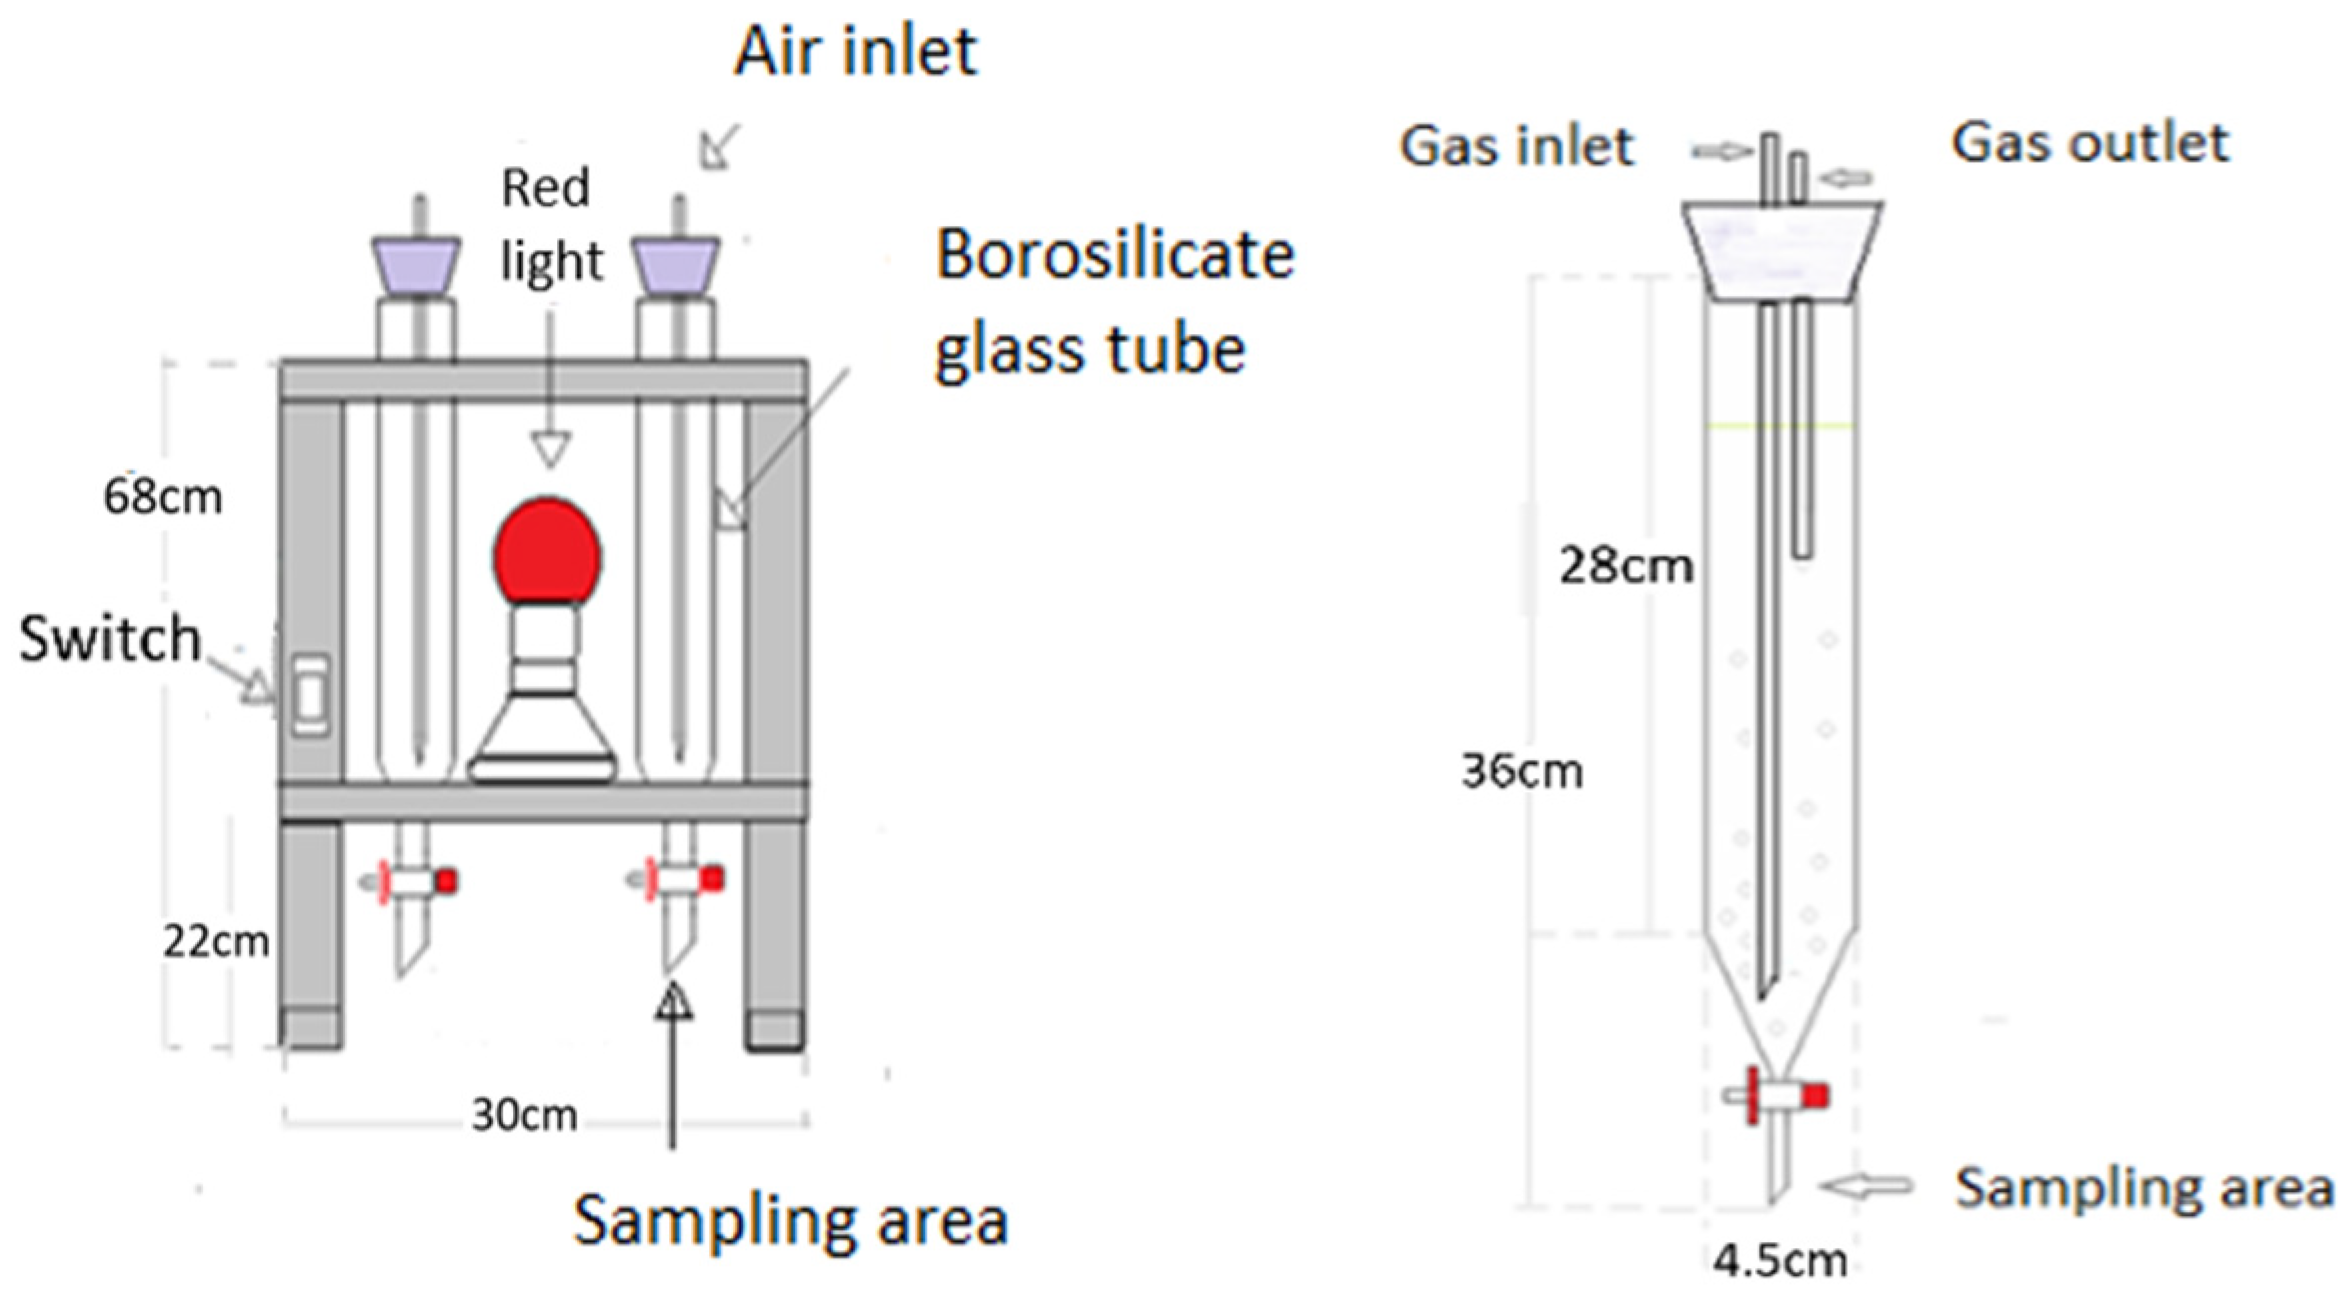
From an economic and practical point of view, the proposed approach is based on open pond technology, which is already implemented and operational in various regions. Therefore, its practical viability is supported by existing infrastructure. The main additional requirements for its application include a process for the inoculation of Chlorella sp. and the establishment of appropriate monitoring and control methods to ensure process stability and efficiency. While a detailed economic assessment was not conducted, the use of an already established system suggests that implementation costs could be minimized by leveraging existing facilities. However, further evaluation is needed to optimize scalability and operational feasibility, particularly in terms of biomass productivity, nutrient removal efficiency, and long-term system performance under real-world conditions.

5. Conclusions

The key influencing factors identified through the response surface analysis were light intensity, with an optimal value of 18 μmolm−2 s−1, and the culture medium type, which was municipal wastewater. Both factors had p-values below 0.05, indicating a significant influence on biomass growth, with light intensity having a stronger effect than the culture medium type. Additionally, the controlled complementary parameters in this study included 20–25% v/v intermittent CO2, a pH range of 6–7, and an aeration rate of 1 L/min.
The experiments in the photobioreactor showed a removal of 94.43% of phosphorus and 87.16% of nitrogen, while the model simulations predicted a 100% removal for both nutrients. This indicates that the model can adequately describe the system’s dynamics, although under real conditions, differences in removal efficiency may exist.
The differentiation of the process into two independent systems—where biomass generation from CO2 occurs separately from the assimilation of nitrogen and phosphorus through the formation of a theoretical intermediate —represents a key contribution of this study. This separation allows for a more precise description of the consortium’s dynamics, as supported by [12], which notes that CO2 uptake by microalgae and nutrient removal are not always coupled.
In this context, the nitrogen consumption rate by bacteria (kqN), representing 90% of the total consortium consumption (qN), directly influences the formation of the intermediate through the introduced factor k. This intermediate, in turn, affects phosphorus removal according to the proposed model. The model established a coupling relationship between nitrogen and phosphorus removal, where phosphorus assimilation depended on the availability of the intermediate generated from nitrogen. Phosphorus variation over time was not only directly linked to its concentration but also to the prior transformation of nitrogen to intermediate within the system.
The model’s fit to experimental data showed some deviations, particularly in nitrogen prediction. These differences may be attributed to the consideration of nitrogen as the limiting reactant for intermediate formation in System 2. The initial concentration of nitrogen was 11 times greater than the initial concentration of phosphorous; therefore, considering that it was also the limiting substrate, mathematically, the remotion of phosphorus was expected to be 100%
From an operational perspective, these findings suggest that optimizing the nitrogen-to-phosphorus ratio in the system could enhance process efficiency. However, due to the complexity of microalgae–bacteria interactions, a more detailed assessment is needed to optimize the model’s scalability and operational feasibility for real-world applications.
There are two hypotheses that should be tested in future studies: one is that nitrogen acted as a limiting substrate, but its removal—and that of phosphorus—was influenced by other factors; the other is that, under certain conditions, phosphorus could also act as a limiting substrate.
Future research should focus on the following:
  • Considering the hypothesis of using phosphorus as a limiting substrate for modeling.
  • Taking into account other factors, possibly environmental, that have affected the contaminant assimilation process.
  • Expanding the model to incorporate phenomena, such as gas exchange with the environment, energy balances that include irradiation as an important environmental factor in open systems, and the interaction of carbonic acid and CO2 as aqueous-phase species and their effect on the system.
  • Coupling the stoichiometry of nitrifying bacteria and PAOs with the CO2 generation of these species and their impact on microalgal biomass.

Author Contributions

F.M.O.-B.: Conceptualization, investigation, methodology, Writing, funding acquisition. J.C.R.-S.: Investigation, visualization, supervision. P.L.C.-R.: Investigation, validation, writing, conceptualization, programing, analysis. All authors have read and agreed to the published version of the manuscript.

Funding

This research was funded by Programa Nacional de Investigación Científica y Estudios Avanzados (PROCIENCIA) and Engineering National University (UNI), Lima-Perú.

Data Availability Statement

The original contributions presented in this study are included in the article. Further inquiries can be directed to the corresponding author. The data are unavailable due to privacy.

Acknowledgments

We thank the Faculty of Chemical Engineering of the National University of Callao and Cesar Calderon, Luis Carrasco, Sonia Herrera, and Agérico Cadillo for providing support. The authors acknowledge the use of AI-assisted tools, such as Sci-space, Poe and ChatGPT-4 (OpenIA, 2024), for paraphrasing and translation support. The AI tools were solely used for language improvement, and all scientific content was developed and validated by the authors.

Conflicts of Interest

The authors declare no conflicts of interest.

References

  1. Ferreira, A.; Melkonyan, L.; Carapinha, S.; Ribeiro, B.; Figueiredo, D.; Avetisova, G.; Gouveia, L. Biostimulant and biopesticide potential of microalgae growing in piggery wastewater. Environ. Adv. 2021, 4, 100062. [Google Scholar] [CrossRef]
  2. Hwang, S.-J. Eutrophication and the Ecological Health Risk. Int. J. Environ. Res. Public Health 2020, 17, 6332. [Google Scholar] [CrossRef] [PubMed]
  3. Geremia, E.; Ripa, M.; Catone, C.M.; Ulgiati, S. A Review about Microalgae Wastewater Treatment for Bioremediation and Biomass Production—A New Challenge for Europe. Environments 2021, 8, 136. [Google Scholar] [CrossRef]
  4. van Chhandama, M.L.; Ruatpuia, J.V.L.; Ao, S.; Chetia, A.C.; Satyan, K.B.; Rokhum, S.L. Microalgae as a sustainable feedstock for biodiesel and other production industries: Prospects and challenges. Energy Nexus 2023, 12, 100255. [Google Scholar] [CrossRef]
  5. Ahmad, I.; Abdullah, N.; Koji, I.; Yuzir, A.; Eva Muhammad, S. Evolution of Photobioreactors: A Review based on Microalgal Perspective. In IOP Conference Series: Materials Science and Engineering; IPO Publishing: Bristol, UK, 2021; Volume 1142, p. 12004. [Google Scholar] [CrossRef]
  6. Abdelfattah, A.; Ali, S.S.; Ramadan, H.; El-Aswar, E.I.; Eltawab, R.; Ho, S.-H.; Elsamahy, T.; Li, S.; El-Sheekh, M.M.; Schagerl, M.; et al. Microalgae-based wastewater treatment: Mechanisms, challenges, recent advances, and future prospects. Environ. Sci. Ecotechnology 2023, 13, 100205. [Google Scholar] [CrossRef]
  7. Herrera, A.; D’Imporzano, G.; Acién Fernandez, F.G.; Adani, F. Sustainable production of microalgae in raceways: Nutrients and water management as key factors influencing environmental impacts. J. Clean. Prod. 2021, 287, 125005. [Google Scholar] [CrossRef]
  8. Sousa, C.A.; Sousa, H.; Vale, F.; Simões, M. Microalgae-based bioremediation of wastewaters—Influencing parameters and mathematical growth modelling. Chem. Eng. J. 2021, 425, 131412. [Google Scholar] [CrossRef]
  9. Arun, S.; Ramasamy, S.; Pakshirajan, K. Mechanistic insights into nitrification by microalgae-bacterial consortia in a photo-sequencing batch reactor under different light intensities. J. Clean. Prod. 2021, 321, 128752. [Google Scholar] [CrossRef]
  10. Kong, W.; Kong, J.; Ma, J.; Lyu, H.; Feng, S.; Wang, Z.; Yuan, P.; Shen, B. Chlorella vulgaris cultivation in simulated wastewater for the biomass production, nutrients removal and CO2 fixation simultaneously. J. Environ. Manag. 2021, 284, 112070. [Google Scholar] [CrossRef]
  11. Le Pham, A.; Luu, K.D.; Duong, T.T.; Dinh, T.M.T.; Nguyen, S.Q.; Nguyen, T.K.; Duong, H.C.; Le, Q.P.T.; Le, T.P. Evaluation of Microalgal Bacterial Dynamics in Pig-Farming Biogas Digestate under Impacts of Light Intensity and Nutrient Using Physicochemical Parameters. Water 2022, 14, 2275. [Google Scholar] [CrossRef]
  12. Yang, J.; Li, Z.; Lu, L.; Fang, F.; Guo, J.; Ma, H. Model-based evaluation of algal-bacterial systems for sewage treatment. J. Water Process Eng. 2020, 38, 101568. [Google Scholar] [CrossRef]
  13. Darvehei, P.; Bahri, P.A.; Moheimani, N.R. Model development for the growth of microalgae: A review. Renew. Sustain. Energy Rev. 2018, 97, 233–258. [Google Scholar] [CrossRef]
  14. Carrasco-Venegas, L.A.; Castañeda-Pérez, L.G.; Martínez-Hilario, D.G.; Medina-Collana, J.T.; Calderón-Cruz, J.C.; Gutiérrez-Cuba, C.; Cuba-Torre, H.R.; Núñez, A.P.; Herrera-Sánchez, S.E. Kinetics of Decolorization of Reactive Textile Dye via Heterogeneous Photocatalysis Using Titanium Dioxide. Water 2024, 16, 633. [Google Scholar] [CrossRef]
  15. Ahumada Forigua, D.A.; Morales Erazo, L.V.; Abella Gamba, J.P.; Gonzalez Cardenas, I.A. Técnicas de titulación ácido-base: Consideraciones metrológicas. Rev. Colomb. Química 2019, 48, 26–34. [Google Scholar] [CrossRef]
  16. Hariz, H.B.; Takriff, M.S.; Ba-Abbad, M.M.; Mohd Yasin, N.H.; Mohd Hakim, N.I.N. CO2 fixation capability of Chlorella sp. and its use in treating agricultural wastewater. J. Appl. Phycol. 2018, 30, 3017–3027. [Google Scholar] [CrossRef]
  17. Natividad Marin, L. Nutrient Recovery from Source Separated Urine: Modelling and Experimental Study. Ph.D. Thesis, James Cook University, Townsville, Australia, 2019. [Google Scholar]
  18. Ministerio de Desarrollo Agrario y Riego. Condiciones Oceanográficas del Mar Peruano Desde Callao a Tacna. Available online: https://www.ana.gob.pe/normatividad/ra-ndeg-071-2017-ana-aaa-maranon-ala-huari (accessed on 20 October 2024).
  19. Dorado González, L.; Dueñas Celis, M.; Suescún Carrero, S.H. Physical Chemical and Microbiological Characterization of Water of a Municipality of the Department of Boyacá-Colombia. Rev. Investig. en Salud Univ. de Boyacá 2022, 9, 44–61. [Google Scholar] [CrossRef]
  20. Rosales-Ayala, F.; Rovira-Quezada, D.; Campos-Rodríguez, R. Calidad de las aguas residuales de tipo especial en la ciudad La Libertad, El Salvador. Rev. Tecnol. en Marcha 2019, 32, 135–145. [Google Scholar] [CrossRef]
  21. Rivas, Z.; Sánchez, J.; Troncone, F.; Márquez, R.; Ledo de Medina, H.; Colina, M.; Gutiérrez, E. Nitrógeno y fósforo totales de los ríos tributarios al sistema lago de Maracaibo, Venezuela. Interciencia 2009, 34, 308–314. [Google Scholar]
  22. Baird, R.; Eaton, A.D.; Rice, E.W.; Bridgewater, L.; American Public Health Association; American Water Works Association; Water Environment Federation. Standard Methods for the Examination of Water and Wastewater, 23rd ed.; American Public Health Association: Washington, DC, USA, 2017; ISBN 9780875532998. [Google Scholar]
  23. Rincon, S.M.; Beyenal, H.; Romero, H.M. A Response Surface Methodology Study for Chlorella vulgaris Mixotrophic Culture Optimization. Microorganisms 2024, 12, 379. [Google Scholar] [CrossRef]
  24. Abomohra, A.; Li, M.; Faisal, S.; Li, L.; Elsayed, M. Maximizing Nitrogen Removal and Lipid Production by Microalgae under Mixotrophic Growth Using Response Surface Methodology: Towards Enhanced Biodiesel Production. Fermentation 2022, 8, 682. [Google Scholar] [CrossRef]
  25. Sánchez-Zurano, A.; Morillas-España, A.; Gómez-Serrano, C.; Ciardi, M.; Acién, G.; Lafarga, T. Annual assessment of the wastewater treatment capacity of the microalga Scenedesmus almeriensis and optimisation of operational conditions. Sci. Rep. 2021, 11, 21651. [Google Scholar] [CrossRef]
  26. Kazeem, M.A.; Hossain, S.M.Z.; Hossain, M.M.; Razzak, S.A. Application of Central Composite Design to Optimize Culture Conditions of Chlorella vulgaris in a Batch Photobioreactor: An Efficient Modeling Approach. Chem. Prod. Process Model. 2018, 13, 20170082. [Google Scholar] [CrossRef]
  27. Hossain, S.M.Z.; Hossain, M.M.; Razzak, S.A. Optimization of CO 2 Biofixation by Chlorella vulgaris Using a Tubular Photobioreactor. Chem. Eng. Technol. 2018, 41, 1313–1323. [Google Scholar] [CrossRef]
  28. Box, G.E.P.; Draper, N.R. Empirical Model-Building and Response Surfaces, 1st ed.; Wiley: New York, NY, USA, 1987; ISBN 9780471810339. [Google Scholar]
  29. Almomani, F. Kinetic modeling of microalgae growth and CO2 bio-fixation using central composite design statistical approach. Sci. Total Environ. 2020, 720, 137594. [Google Scholar] [CrossRef]
  30. Montgomery, D.C. Design and Analysis of Experiments, 9th ed.; John Wiley & Sons: Hoboken, NJ, USA, 2017; ISBN 9781119113478. [Google Scholar]
  31. Galanakis, C.M. Microalgae: Cultivation, Recovery of Compounds and Applications, 1st ed.; Elsevier: Amsterdam, The Netherlands, 2021; ISBN 0128212187. [Google Scholar]
  32. Aditya, L.; Mahlia, T.M.I.; Nguyen, L.N.; Vu, H.P.; Nghiem, L.D. Microalgae-bacteria consortium for wastewater treatment and biomass production. Sci. Total Environ. 2022, 838, 155871. [Google Scholar] [CrossRef]
  33. Yoshida, H.; van Oossanen, S.; Barbosa, M.J.; Janssen, M. Light and carbon limited photosynthesis of Chlorella sorokiniana. Algal Res. 2023, 69, 102934. [Google Scholar] [CrossRef]
  34. Salbitani, G.; Carfagna, S. Ammonium Utilization in Microalgae: A Sustainable Method for Wastewater Treatment. Sustainability 2021, 13, 956. [Google Scholar] [CrossRef]
  35. Wang, X.; Jin, X.; Wang, H.; Hu, Z.; Shen, B. Synergetic utilization of sewage sludge and microalgae: A review and proposal. Bioresour. Technol. Rep. 2022, 19, 101146. [Google Scholar] [CrossRef]
  36. Janpum, C.; Pombubpa, N.; Monshupanee, T.; Incharoensakdi, A.; In-Na, P. Advancement on mixed microalgal-bacterial cultivation systems for nitrogen and phosphorus recoveries from wastewater to promote sustainable bioeconomy. J. Biotechnol. 2022, 360, 198–210. [Google Scholar] [CrossRef]
  37. Sarker, N.K.; Kaparaju, P. A Critical Review on the Status and Progress of Microalgae Cultivation in Outdoor Photobioreactors Conducted over 35 Years (1986–2021). Energies 2023, 16, 3105. [Google Scholar] [CrossRef]
  38. Viruela, A.; Aparicio, S.; Robles, Á.; Borrás Falomir, L.; Serralta, J.; Seco, A.; Ferrer, J. Kinetic modeling of autotrophic microalgae mainline processes for sewage treatment in phosphorus-replete and -deplete culture conditions. Sci. Total Environ. 2021, 797, 149165. [Google Scholar] [CrossRef] [PubMed]
  39. Singh, V.; Mishra, V. Enhanced biomass production and nutrient removal efficiency from urban wastewater by Chlorella pyrenoidosa in batch bioreactor system: Optimization and model simulation. Desalination Water Treat. 2020, 197, 52–66. [Google Scholar] [CrossRef]
  40. Bekirogullari, M.; Figueroa-Torres, G.M.; Pittman, J.K.; Theodoropoulos, C. Models of microalgal cultivation for added-value products—A review. Biotechnol. Adv. 2020, 44, 107609. [Google Scholar] [CrossRef]
  41. Romero-Villegas, G.I.; Burboa-Charis, V.A.; Navarro-López, E.; Cerón-García, M.C.; Acién-Fernandez, F.G.; Estrada-Alvarado, M.I.; Rout, N.P.; Cira-Chávez, L.A. Biomass production and urban centrate nutrient removal using native microalgae tolerant to high nitrogen concentration and temperature. J. Appl. Phycol. 2021, 33, 2921–2931. [Google Scholar] [CrossRef]
  42. Mohit, A.; Remya, N. Optimization of biochar production from greywater grown polyculture microalgae using microwave pyrolysis. Bioresour. Technol. 2023, 388, 129666. [Google Scholar] [CrossRef]
  43. Alam, M.A.; Xu, J.-L.; Wang, Z. Microalgae Biotechnology for Food, Health and High Value Products, 1st ed.; Springer: Singapore, 2020; ISBN 978-981-15-0168-5. [Google Scholar]
  44. Cuello, M.C.; Chamorro, E.R. Evaluar la Biorremediación de efluentes industriales/municipales con consorcios de Microalgas-bacterias Promotoras del Crecimiento, Aprovechando la Biomasa Generada para Producir Compuestos Orgánicos de Alto Valor Agregado. Actas Jorn. Y. Even. Académicos UTN 2019, 4, 2019. [Google Scholar] [CrossRef]
Figure 1. Methodology framework.
Water 17 01160 g001
Figure 2. Prototype of the photobioreactor viewed from the front (Left Side). Borosilicate glass tube (Right Side).
Water 17 01160 g002
Figure 4. Schematic representation of the construction of System 1.
Water 17 01160 g004
Figure 5. Schematic representation of the construction of System 2.
Water 17 01160 g005
Figure 6. Detail of the construction of the nitrogen consumption model by microalgae and bacteria.
Water 17 01160 g006
Figure 7. Model of the relationship between carbon dioxide consumption and biomass generation in the consortium.
Water 17 01160 g007
Figure 8. Consortium model with the two assembled systems.
Water 17 01160 g008
Figure 9. Methodology followed for the processing of experimental data.
Water 17 01160 g009
Figure 10. Methodology followed for the estimation of the model parameters for System 1.
Water 17 01160 g010
Figure 11. Methodology followed for the estimation of the model parameters for System 2.
Water 17 01160 g011
Figure 12. Interaction graph of factors on productivity. * represents an interaction between variables.
Water 17 01160 g012
Figure 13. Response surface plot (left) and contour plot (right) for culture medium type versus light intensity. Developed using Design Expert software Version 13.
Water 17 01160 g013
Figure 14. Schematic representation of the mathematical model for System 1.
Water 17 01160 g014
Figure 15. Schematic representation of the mathematical model for System 2.
Water 17 01160 g015
Figure 16. Results of the mathematical model simulation prior to parameter calibration.
Water 17 01160 g016
Figure 17. Comparison between the experimental data behavior and the mathematical model prediction for (a) nitrogen, (b) phosphorus, (c) biomass.
Water 17 01160 g017
Table 1. Characterization of wastewater from the Puca Puca wastewater treatment plant (PTAR) conducted in this study.
ParameterUnitResult
Total ColiformsMPN/100 mL5,400,000.0
Escherichia coliMPN/100 mL170.0
Helminth EggsEggs/L<1.0
Ammoniummg NH4/L37.980
Biochemical Oxygen Demand (BOD5)mg/L109.5
Chemical Oxygen Demand (COD)mg/L235.9
Nitratemg/L1.10
Nitritemg/L<0.05
P-Phosphatemg/L3.41
Table 2. Mathematical expressions of the model.
ExpressionDescription
q C O 2 = q C O 2 m a x · C O 2 K C O 2 + C O 2 Hyperbolic consumption of carbon dioxide.
q N = q N m a x · N K N + N Hyperbolic consumption of nitrogen.
q P = q P m a x · P K P + P Hyperbolic consumption of phosphorus.
V I n t = k · q N m N d Specific rate of intermediate formation.
Y N I = 1 d Nitrogen-intermediate yield.
Y C G = 1 a Carbon dioxide-to-glucose yield.
Y G X = 1 b Glucose-to-biomass yield.
q G l u c = q C O 2 · Y C G Relationship between CO2 consumption and glucose formation.
μ = q G l u c m g b Specific growth rate.
Table 3. System of differential equations of the model.
NExpressionDescription
1. d C O 2 d t = q C O 2 · X Differential equation describing the variation of carbon dioxide over time.
2. d X d t = μ · X Differential equation describing the variation in biomass over time.
3. d N d t = q N · I Differential equation describing the variation of nitrogen over time.
4. d P d t = q P · I Differential equation describing the variation of phosphorus over time.
5. d I d t = V I n t · I Differential equation describing the variation in the intermediate over time.
Table 4. Diseño experimental usando diseño compuesto central centrado en caras.
TrialFactor 1Factor 2Factor 3Response
A: Water TypeB: pHC: IlluminationProductivity
μmolm−2 s−1 g CO2 L−1 day−1
136180.142
227180.012
327180.011
427180.013
527180.015
61640.025
718180.087
817110.061
92740.008
1028110.017
1127110.018
1226110.012
31327110.015
143640.021
1537110.123
1638180.125
173840.034
1827110.014
1916180.109
201840.019
Table 5. ANOVA of the quadratic model for the response variable productivity.
SourceSum of SquaresDFMean SquareF-Valuep-Value
Model0.035890.004010.020.0006
A-Type of water0.002110.00215.220.0454
B-pH0.000110.00010.18360.6774
C-Ilumination0.013510.013534.100.0002
AB0.000110.00010.18130.6793
AC0.000410.00041.130.3121
BC0.000310.00030.66610.4334
A20.014010.014035.180.0001
B20.000110.00010.26860.6156
C20.000310.00030.79690.3930
Residual0.0040100.0004
Lack of Fit0.003950.0008144.27<0.0001
Pure Error0.000055.467 × 10−6
Total Cor0.039819
Table 6. Initial conditions of the variables of the model for simulation.
Input VariableDescriptionValueUnitsReference
NInitial NH4+ Concentration37.98mg/LMeasured Experimental Value
IInitial Intermediate Concentration0.001mg/LAssumed Value
PInitial PO43− Concentration3.41mg/LMeasured Experimental Value
CO2Initial Dissolved Carbon Dioxide Concentration in Wastewater30.00mg/LAssumed Value Based on Standard Concentrations
XInitial biomass Concentration0.44g/LMeasured Experimental Value
Table 7. Estimated and calibrated parameter values of the mathematical model.
ParameterEstimated ValueCalibrated ValueUnitsSource
q C O 2 m a x -0.25[mgC/gX·h]Value calculated by iteration.
q N m a x 3.26001.55[mgN/mgI·h]Value initially estimated by data fitting and calibrated by iteration.
q P m a x 0.127852.00[mgP/mgI]Value initially estimated by data fitting and calibrated by iteration.
K C O 2 -4.00[mgC/L]Value calculated by iteration.
K N 25.25001.00[mgN/L]Value initially estimated by data fitting and calibrated by iteration
K P 0.516084.00[mgP/L]Value initially estimated by data fitting and calibrated by iteration
Y N I = 1 d 0.74070.0556[mgN/mgI]Value initially estimated by data fitting and calibrated by iteration
Y C G = 1 a -0.17[mgC/mgG]Value calculated by stoichiometry.
Y G X = 1 b -3.60[mgG/mgX]Value calculated by iteration.
k -90.00%Assumed value.
m N 0.007140.00714[mgN/gI·h]Value initially estimated by data fitting and calibrated by iteration.
m g 0.001330.00133[mgG/gX·h]Value calculated by stoichiometry.
Table 8. Calculated standard error of the model and validation status.
VariableSyxsValidation Status
Biomass0.07186Validated
Nitrogen3.40285Validated
Phosphorus0.63065Validated
Table 9. Yields for nitrogen, phosphorus, and biomass for both experimental and simulated data, respectively.
VariableMoleculeExperimental DataModel Simulation Data
Initial Final Removal Efficiency InitialFinalRemoval Efficiency
Ammonium mg/L[NH4+]37.984.8887.16%37.980.00100.00%
Phosphate mg/L[PO43−]3.410.1994.43%3.410.00100.00%
Biomass g/L[CO0.48H1.83N0.11P0.01]0.441.95-0.442.02-
Table 10. Summary of the key findings of the research.
Surface Response Analysis Results
Significant FactorsOptimized ValuesUnits
Type of waterMunicipal waste waterN/A
Illumination18μmolm−2 s−1
pH6.56N/A
Experimental vs. Mathematical Model Results
Removal EfficiencySE of the Model
VariableExperimental DataSimulation DataSyxs
Ammonium87.16%100.00%3.40285
Phosphate 94.43%100.00%0.63065
BiomassN/AN/A0.07186
Disclaimer/Publisher’s Note: The statements, opinions and data contained in all publications are solely those of the individual author(s) and contributor(s) and not of MDPI and/or the editor(s). MDPI and/or the editor(s) disclaim responsibility for any injury to people or property resulting from any ideas, methods, instructions or products referred to in the content.

