Article

Laboratory Experiments of Surge Pressure Loads Acting on Downstream Dams and Reservoir Banks Caused by Landslides in Narrow, Elongated Reservoirs

1
Hubei Key Laboratory of Intelligent Yangtze and Hydroelectric Science, Yichang 443000, China
2
Yangtze Power Co., Ltd., Yichang 443000, China
3
Institute for Disaster Management and Reconstruction, Sichuan University, No. 122 Huanghe Middle Road Section 1, Shuangliu District, Chengdu 610207, China
4
State Key Laboratory of Hydraulics and Mountain River Engineering, Sichuan University, No. 24 South Section 1, Yihuan Road, Chengdu 610065, China
5
China Three Gorges Construction Engineering Corporation, No. 288, East Section of Fucheng Avenue, High-Tech Industrial Development Zone, Chengdu 610094, China
*
Authors to whom correspondence should be addressed.
Water 2025, 17(8), 1133; https://doi.org/10.3390/w17081133
Submission received: 14 March 2025 / Revised: 7 April 2025 / Accepted: 8 April 2025 / Published: 10 April 2025

Abstract

:
Mountain reservoirs are often exposed to geological hazards, particularly landslides, posing significant risks to dam stability. This study conducted scaled experiments to investigate the surge pressure loads induced by landslides entering reservoirs under controlled conditions. Landslide volumes ranging from 500 cm3 to 2000 cm3 and slope angles of 35° and 45° were tested under different scenarios. Key parameters, including landslide volume, slope angle, water depth, and the distance between the landslide impact point and the dam were systematically varied to evaluate their effects on the maximum impact pressure along the reservoir bank. Through a systematic analysis of landslide volume, slope angle, water depth, and impact distance, their effects on maximum impact pressure were evaluated. Dimensional analysis and regression modeling were then used to develop a predictive model for maximum impact pressure. The results indicate that larger landslide volumes and steeper slopes amplify impact pressure, whereas greater water depths and larger distances from the impact point reduce it. Empirical equations for predicting impact pressure on reservoir banks and dam faces demonstrated strong agreement with experimental data. These findings offer crucial insights into the mechanisms influencing impact pressures in reservoirs and provide practical guidance for dam stability assessments under landslide-induced surge conditions.

1. Introduction

Mountain reservoirs are frequently susceptible to geological hazards, such as landslides, which pose substantial risks to reservoirs and dam stability [1,2]. Reservoir-induced landslides differ from typical mountain landslides due to distinct factors, including instability triggered by water impoundment, reservoir-induced seismicity, and cyclic water level fluctuations. Notably, several factors can trigger instability in reservoir banks. These include the initial filling of a reservoir and sudden or periodic water level drawdowns [3,4]. A catastrophic example illustrating these risks is the 1963 Vajont Dam disaster in Italy, where a massive landslide of approximately 270 million cubic meters entered the reservoir, generating a 250 m high wave that overtopped the dam and caused nearly 2000 fatalities among downstream communities [5,6]. The Three Gorges Reservoir is another representative region for studying reservoir-induced landslides [7,8]. Since its impoundment on 1 June 2003, multiple landslide events have been triggered by fluctuating water levels. For instance, on 13 July 2003, a massive landslide with an estimated volume of approximately 24 million cubic meters occurred in Qianjiangping Village along the Qinggan River, a tributary of the Yangtze River. This event generated waves over 20 m high, capsizing 22 vessels and resulting in 14 fatalities and 10 missing persons [9].
Extensive research has been conducted on surge waves generated by landslides in reservoirs. Wave generation mechanisms have been investigated through physical experiments, numerical simulations, and field observations [10,11,12,13]. Studies indicate that landslide volume, velocity, and impact angle significantly affect wave generation processes [14,15]. Heller and Hager [11] developed the impulse product parameter, a foundational approach for predicting wave characteristics based on landslide parameters, identifying seven prominent factors that determine maximum impulse wave height. Additionally, investigations into wave propagation have explored transformations, energy dissipation, and run-up heights [16,17,18]. Mohammed and Fritz [12] examined three-dimensional deformable granular landslides and their wave generation characteristics, providing insights into complex sliding mass behavior. When a landslide occurs in a mountainous river-type reservoir, the resulting surge waves initially impact the adjacent areas, often causing significant effects on the opposite bank. Narrow reservoirs present distinct hydrodynamic characteristics compared to open water bodies. Zhang et al. [19] investigated the effects of reservoir geometry on landslide-generated wave characteristics during propagation, finding that wave amplitudes decrease with increasing reservoir width, while wave heights and troughs exhibit complex dependence on geometric parameters. Deng et al. [20] highlighted the role of strong wave reflections from the opposite bank in narrow reservoirs, which significantly alter wave propagation patterns. Evers et al. [21] also confirmed that wave height decay in confined channels differs from that in open water, with channel geometry playing a critical role in shaping wave behavior.
Throughout this process, damage to downstream dams and riverbanks is primarily attributed to impact loads generated by these waves, rather than the water mass itself [22]. In narrow mountainous river-type reservoirs, the transmission of impact pressure exhibits more predictable attenuation patterns [23,24,25]. However, despite extensive studies on landslide-generated surge waves, research on the pressure characteristics of these waves in mountainous river-type reservoirs remains limited, particularly regarding the quantitative characterization and attenuation patterns of surge-induced pressures [26,27,28,29,30]. This knowledge gap is particularly critical, as excessive pressure loads may lead to dam overtopping or structural failure, posing severe risks to downstream regions [31,32,33]. The risks are further exacerbated when surge pressures act on natural dams formed by earthquakes, landslides, debris flows, or glacial melts.
In this study, a series of flume experiments were conducted to examine the pressure load characteristics of landslide-generated surge waves in narrow, elongated reservoirs, specifically focusing on their effects on reservoir banks and dams. By simulating the entry of landslide material into the water and the subsequent generation of impulse waves, this study aimed to elucidate the spatial and temporal distributions of impact pressures along reservoir boundaries. The influence of key parameters such as landslide volume, velocity, and water depth on impact pressure magnitudes and patterns is systematically analyzed. These insights contribute to a deeper understanding of the dynamic loading conditions experienced by reservoir banks and dams during landslide-generated impulse wave events.

2. Experimental Setup and Methodology

2.1. Flume Setup and Instrumentation

The experiment was conducted at the State Key Laboratory of Hydraulics and Mountain River Engineering at Sichuan University in Chengdu, China. Generally, the length of mountain river-type reservoirs is relatively long, while the width is significantly shorter in comparison. Therefore, constructing a model with both a large length and width is highly challenging. As a result, this experiment used a model of a mountain river with a scale of approximately 1:200 in length and width. Although the river width in the experimental model appeared to be small, the physical phenomena, such as surge generation and pressure load characteristics, were still well-demonstrated in the experiments. The model dimensions were primarily based on the characteristics of the Jinsha River channel.
The experimental setup consisted of a 2.4 m long flume with inner dimensions of 0.1 m in width and 0.3 m in height, featuring a rectangular cross-section and no slope. It included a steel-framed landslide system with a chute and material box. The chute’s slope could be adjusted from 0–45° using a lifting push rod. Positioned 1 m upstream, the chute measured 1 m in length, 0.17 m in width, and 0.2 m in height. The material box atop the chute was 0.33 m long, 0.17 m wide, and 0.2 m high. The water levels were controlled by the dams, which were located 0.8 m from the chute. The experimental facility is shown in Figure 1a, and a photograph of the actual flume setup is presented in Figure 1c. High-precision pressure sensors (CY200, Chengdu YYD Technology Co., Ltd., Chengdu, China), with a measuring range of 0–20 kPa and an accuracy of ±0.1%, were placed at five measuring locations (location 1–5) along the chute’s opposite bank and one on the movable dam’s surface (location 6). Measuring points 1–5 are 6 cm apart in the flow direction, and point 6 is located at H/2 in the altitude direction. Transparent acrylic sheets line the sink and chute walls and bottom for visibility. The locations of the sensors are illustrated in Figure 1b.

2.2. Experimental Conditions and Procedure

The intensity of waves generated by landslide materials entering a reservoir is influenced by multiple factors, including the volume of the landslide material, the sliding angle, the sliding distance, the particle size distribution, and the reservoir water level. In this study, we systematically varied parameters such as the landslide volume (500 cm3 to 2000 cm3), sliding angles (35° and 45°), reservoir water levels (3 cm to 12 cm), and distances from the dam (10 cm to 60 cm). The sliding distance was held constant at approximately 80 cm, and the particle size distribution of the landslide material was selected as uniform sand within the range of 2 mm to 3 mm, with a d50 of approximately 2.5 mm. Figure 2 illustrates the typical sequence of landslide material movement, from its initial release to final deposition in the reservoir. By keeping the sliding distance and particle size distribution constant, this research aimed to investigate the effects of landslide entry into the reservoir on downstream dams and the opposite bank. The experimental conditions and parameters are presented in Table 1 and Table 2.
Experiments were conducted by releasing prepared landslide materials (a mixture of gravel and sand) from the material box into the reservoir section. The landslide material volume was varied to investigate the influence of landslide scale on impact characteristics. Before each experiment, the landslide materials were placed in the material box, and the reservoir section was filled with water to the preset level. The landslide materials were then released instantaneously by rapidly lifting the gate, allowing them to enter the water body and propagate toward the model dam and reservoir banks. Impact pressures on the model dam and reservoir banks were continuously measured by pressure sensors. A comprehensive series of experiments was conducted with different landslide material volumes, sliding angles, and water depths to cover a wide range of representative scenarios.

2.3. Data Analysis Techniques

Pressure sensor data were processed using signal processing techniques to obtain temporal and spatial distributions of impact pressure on reservoir banks and dam faces. Raw pressure data were filtered to remove noise while preserving relevant pressure fluctuations induced by landslide-generated impulse waves [31,32]. Fast Fourier Transform (FFT) analysis was conducted by dividing pressure time series into suitable windows, computing FFT for each window, and averaging the resulting frequency-domain spectra across multiple windows. Dominant frequencies corresponding to peaks in the frequency spectrum were identified. The spatial distribution of impact pressures was investigated by comparing pressure data from different sensor locations, examining peak pressures, rise times, decay times, and their spatial variations along the impacted surfaces.

3. Results

3.1. Impact Pressure Distribution on the Reservoir Bank

The impact pressure distribution on the reservoir bank was analyzed to understand the characteristics of the pressure fluctuations induced by the landslide-generated impulse waves. Figure 3 illustrates the pressure load time series at different measuring points (S1–S5) along the reservoir bank for representative experimental conditions. The pressure load time series exhibits a consistent pattern across different cases and measuring locations. The pressure rapidly increases to a peak within a short duration, typically less than 1 s in the experiments conducted in this paper, followed by a quick decline. Subsequently, the pressure gradually attenuates over time until reaching a stable state. The rapid increase in pressure load and peak occurrence coincides with the initial impact of the landslide materials on the water body, producing the most significant pressure fluctuations during the earliest phase. The complex waveforms observed during this initial phase indicate the intense interactions between the landslide materials, water flow conditions, and the reservoir boundaries.
Figure 4 presents a more detailed comparison of the pressure load variations along the reservoir bank for different landslide volumes, slope angles, and water depths. The peak pressure loads consistently decrease from measuring point 1 to point 5, indicating a gradual attenuation of impact pressure with increasing distance from the landslide impact zone. Measuring points 1 and 2, located in the direct impact region, experience the highest pressure magnitudes and nearly simultaneous peak occurrences. As the distance from the impact zone increases, the peak pressures at measuring points 3, 4, and 5 progressively decrease, and the time of peak occurrence is notably delayed. These observations highlight the spatial and temporal decay of the impact pressure along the reservoir bank and the influence of the local geometry on the pressure distribution.
The frequency-domain analysis of the pressure signals along the reservoir bank reveals the dominant frequencies of the pressure fluctuations Fdom induced by the landslide-generated impulse waves. Figure 5 illustrates the variations of the dominant frequencies with respect to the water depth for different slope angles. The dominant frequencies of the pressure fluctuations exhibit an increasing trend with increasing water depth, ranging from 0.28 Hz to 0.524 Hz. These observations suggest a positive correlation between the water depth and the frequency content of the pressure fluctuations. The higher frequencies associated with greater water depths indicate more rapid pressure oscillations and more intense interactions between the landslide materials and the water body. The dominant frequencies of wave pressure signals in prototype landslides may numerically differ from the model test results. However, the patterns of dominant frequency variations observed in the model tests can still provide valuable insights for studying prototype landslide wave behavior.
Figure 6 illustrates the relationship between water depth and maximum impact pressure under varying slope angles and landslide volumes. Generally, the maximum impact pressure decreases with increasing water depth, though the rate and pattern of this decline varies across different experimental conditions. On a 35° slope, the reduction in maximum impact pressure is gradual, with a noticeable slowing trend as water depth increases. On a 45° slope, a similar decreasing trend is observed, although minor deviations occur depending on the landslide volume. Notably, the most pronounced decreases in maximum impact pressure are typically observed at shallower depths (e.g., between 3 cm and 6 cm). These findings highlight the significant influence of water depth on the maximum impact pressure along reservoir banks, with a consistent overall trend of decreasing pressure as water depth increases.
Figure 7 illustrates the variation in maximum impact pressure with landslide volume under different slope angles and water depths. Within the experimental range, the minimum landslide volume of 500 cm3 corresponds to the lowest maximum impact pressure, while the maximum volume of 2000 cm3 results in the highest. Overall, a positive correlation is observed between landslide volume and maximum impact pressure, as larger landslide volumes transfer greater energy to the water body, thereby increasing the impact pressure.
For water depths of 6 cm, 9 cm, and 12 cm under both 35° and 45° slope conditions, the relationship between maximum impact pressure and landslide volume follows a linear trend. However, at a water depth of 3 cm, the trend shows a slight acceleration in the increase of maximum impact pressure with increasing landslide volume. This deviation may be attributed to the amplification of landslide–water interactions in shallow water conditions, where larger landslide volumes further intensify these interactions, resulting in an accelerated growth in impact pressure. This analysis underscores the influence of water depth on the relationship between landslide volume and maximum impact pressure, with shallow water conditions amplifying the pressure growth trend.
Figure 8 shows the maximum impact pressure under two different slopes across various working conditions. The figure demonstrates that the maximum impact pressure is higher at a 45° slope than at a 35° slope. When comparing results across different water depths (6 cm, 9 cm, and 12 cm), the difference in maximum impact pressure between the 45° and 35° slopes remains relatively consistent. However, at a water depth of 3 cm, there is a notable rise in maximum impact pressure when the slope increases from 35° to 45°. These observations indicate that the landslide volume, water depth, and slope angle significantly influence the maximum impact pressure on the reservoir bank. In general, a larger landslide volume, a steeper slope, and a shallower water depth lead to higher impact pressures on the reservoir bank.

3.2. Empirical Equation for Predicting Impact Pressure on the Reservoir Bank

Under most circumstances, the pressure load caused by surges is determined by the volume V of the slider, the sliding angle θ, the sliding distance L, the water depth H, the river width B, the width of the landslide shear outlet Bw, and the density ρ of the water. Several additional physical parameters may also influence the resulting pressure. Considering all the physical parameters presents a highly complex issue. This part of the study primarily focuses on the parameters involved in the experiments.
P m a x = f g ,   V ,   B , H , θ , L , B w
Dimensional analysis was conducted based on the experimental parameters, yielding dimensionless parameters with clear physical meaning as follows:
P m a x ρ g H = f V 1 3 B , H B ,   L B w ,   tan θ
To quantitatively assess the impact pressure distribution along the reservoir bank, a regression analysis was performed considering various influencing factors. The regression equation for the maximum impact pressure along the reservoir bank is presented as follows:
P m a x ρ g H = 0.107 V 1 3 B 2.77 H B 1.458 L B w 0.961 tan θ 2.293
where Pmax is the maximum impact pressure (Pa), ρ is the water density (kg/m3), g is the gravitational acceleration (m/s2), B is the river width (m), Bw is the width of the landslide shear outlet (m), L is the sliding distance (m), and H is the water depth (m). The coefficient of determination (R2) for this regression equation is 0.91, indicating a good fit between the experimental data and the proposed relationship.
The regression equation highlights the significant positive influence of the landslide volume and slope angle on the impact pressure along the reservoir bank. Conversely, the water depth and distance from the landslide impact point exhibit a negative influence on the impact pressure. The regression coefficients indicate that landslide volume exerts the strongest influence on impact pressure. The next most influential factors are, in descending order, slope angle, water depth, and distance from the impact point. Figure 9 compares the experimental values of the impact pressure along the reservoir bank with the calculated values using the regression equation, showing a reasonable agreement.

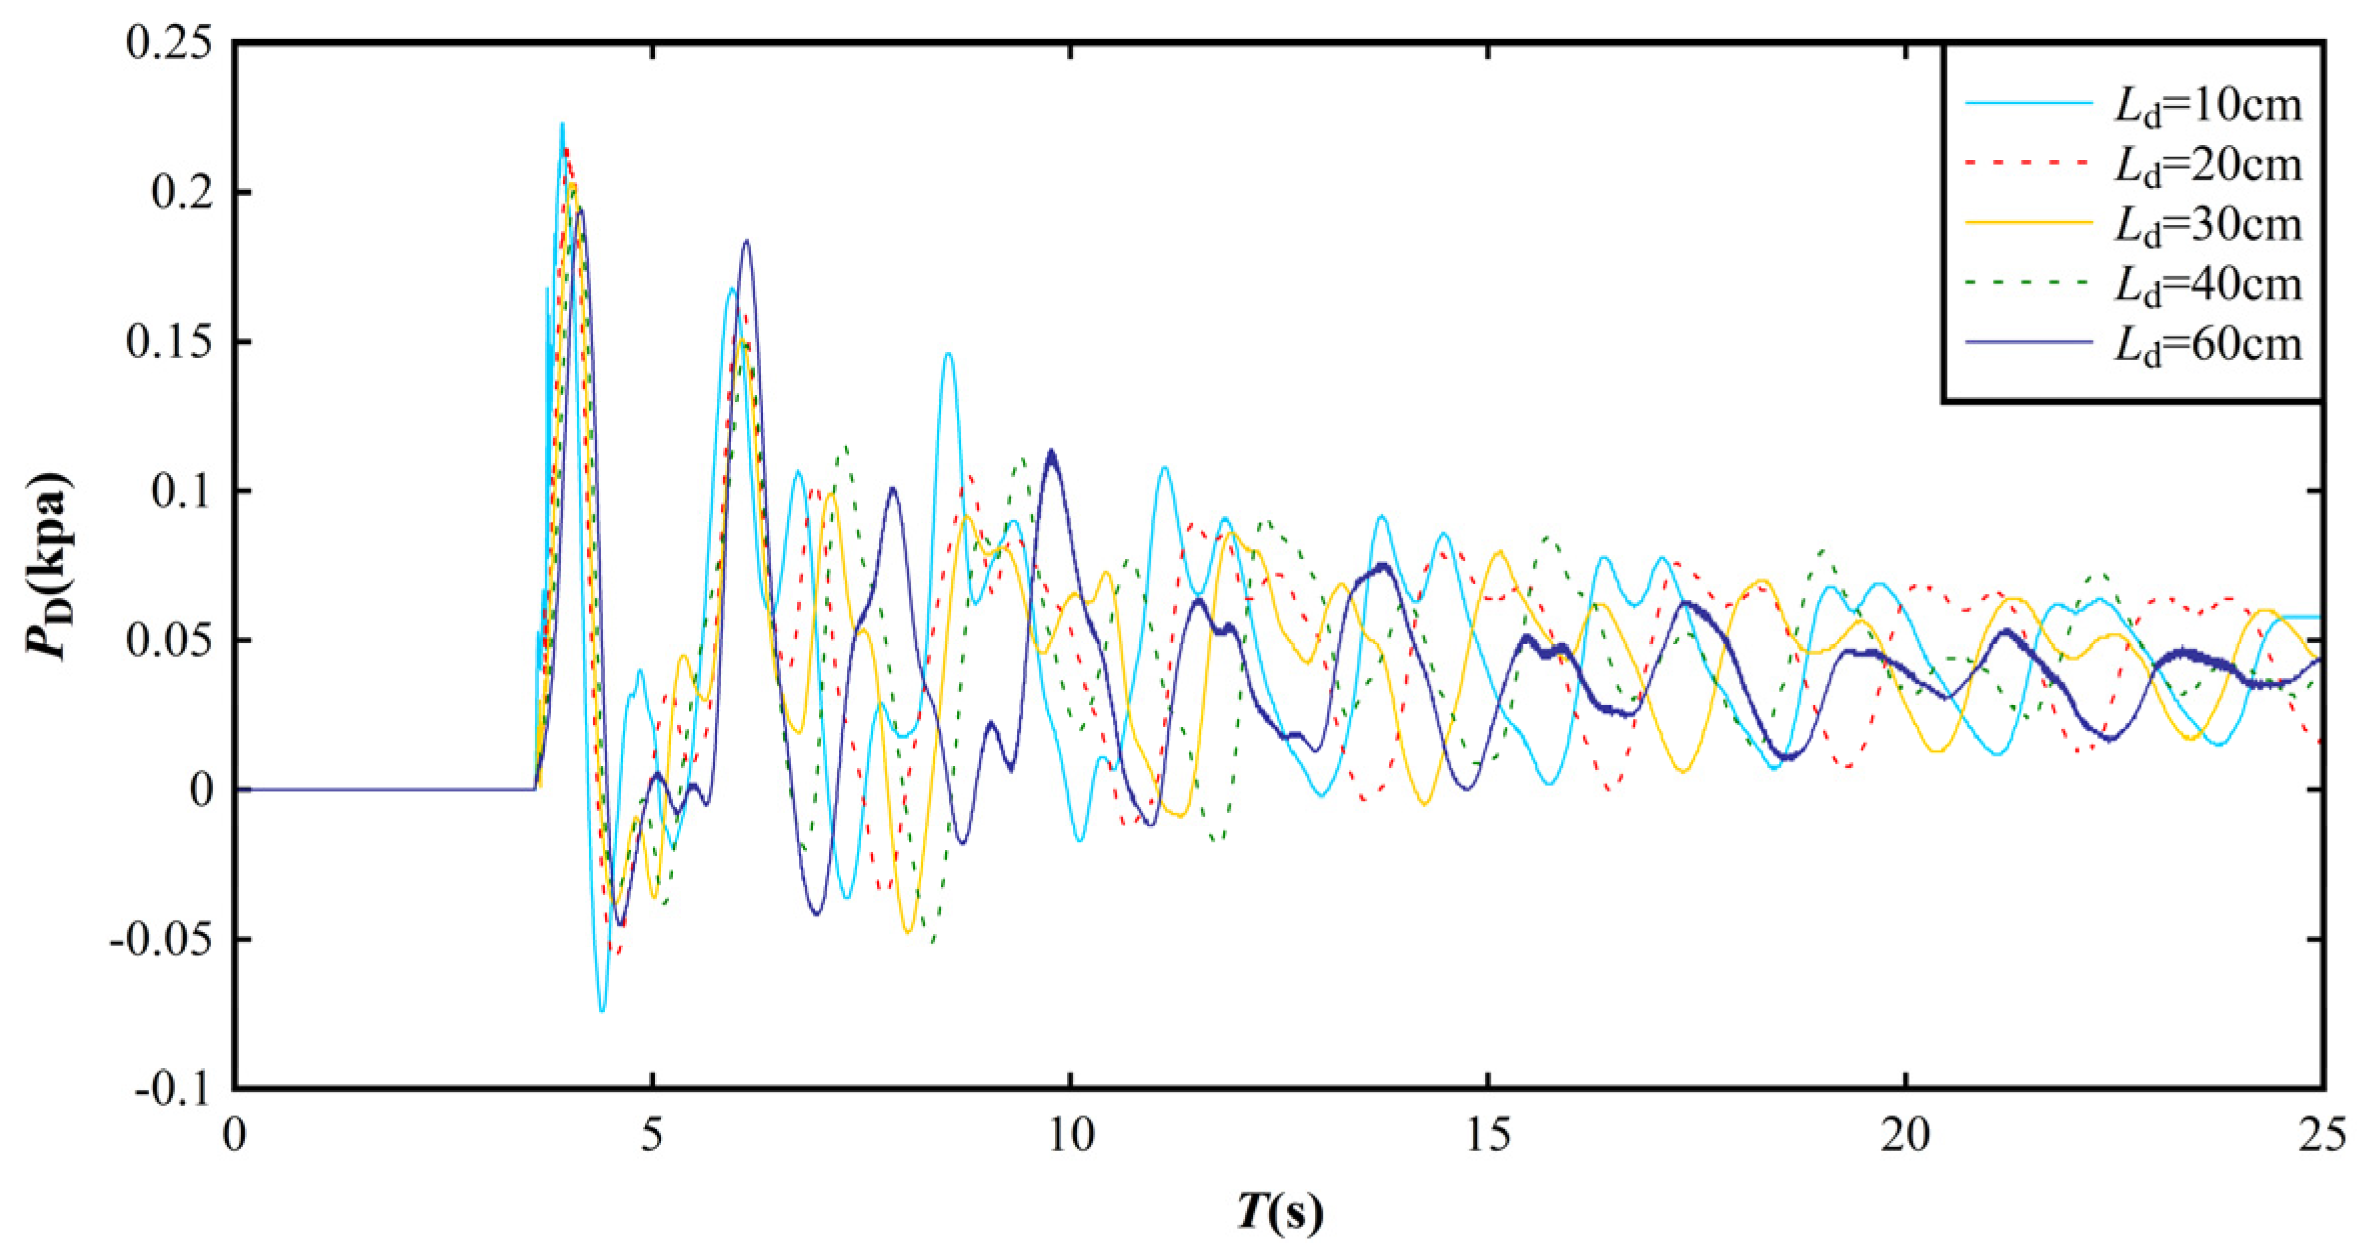
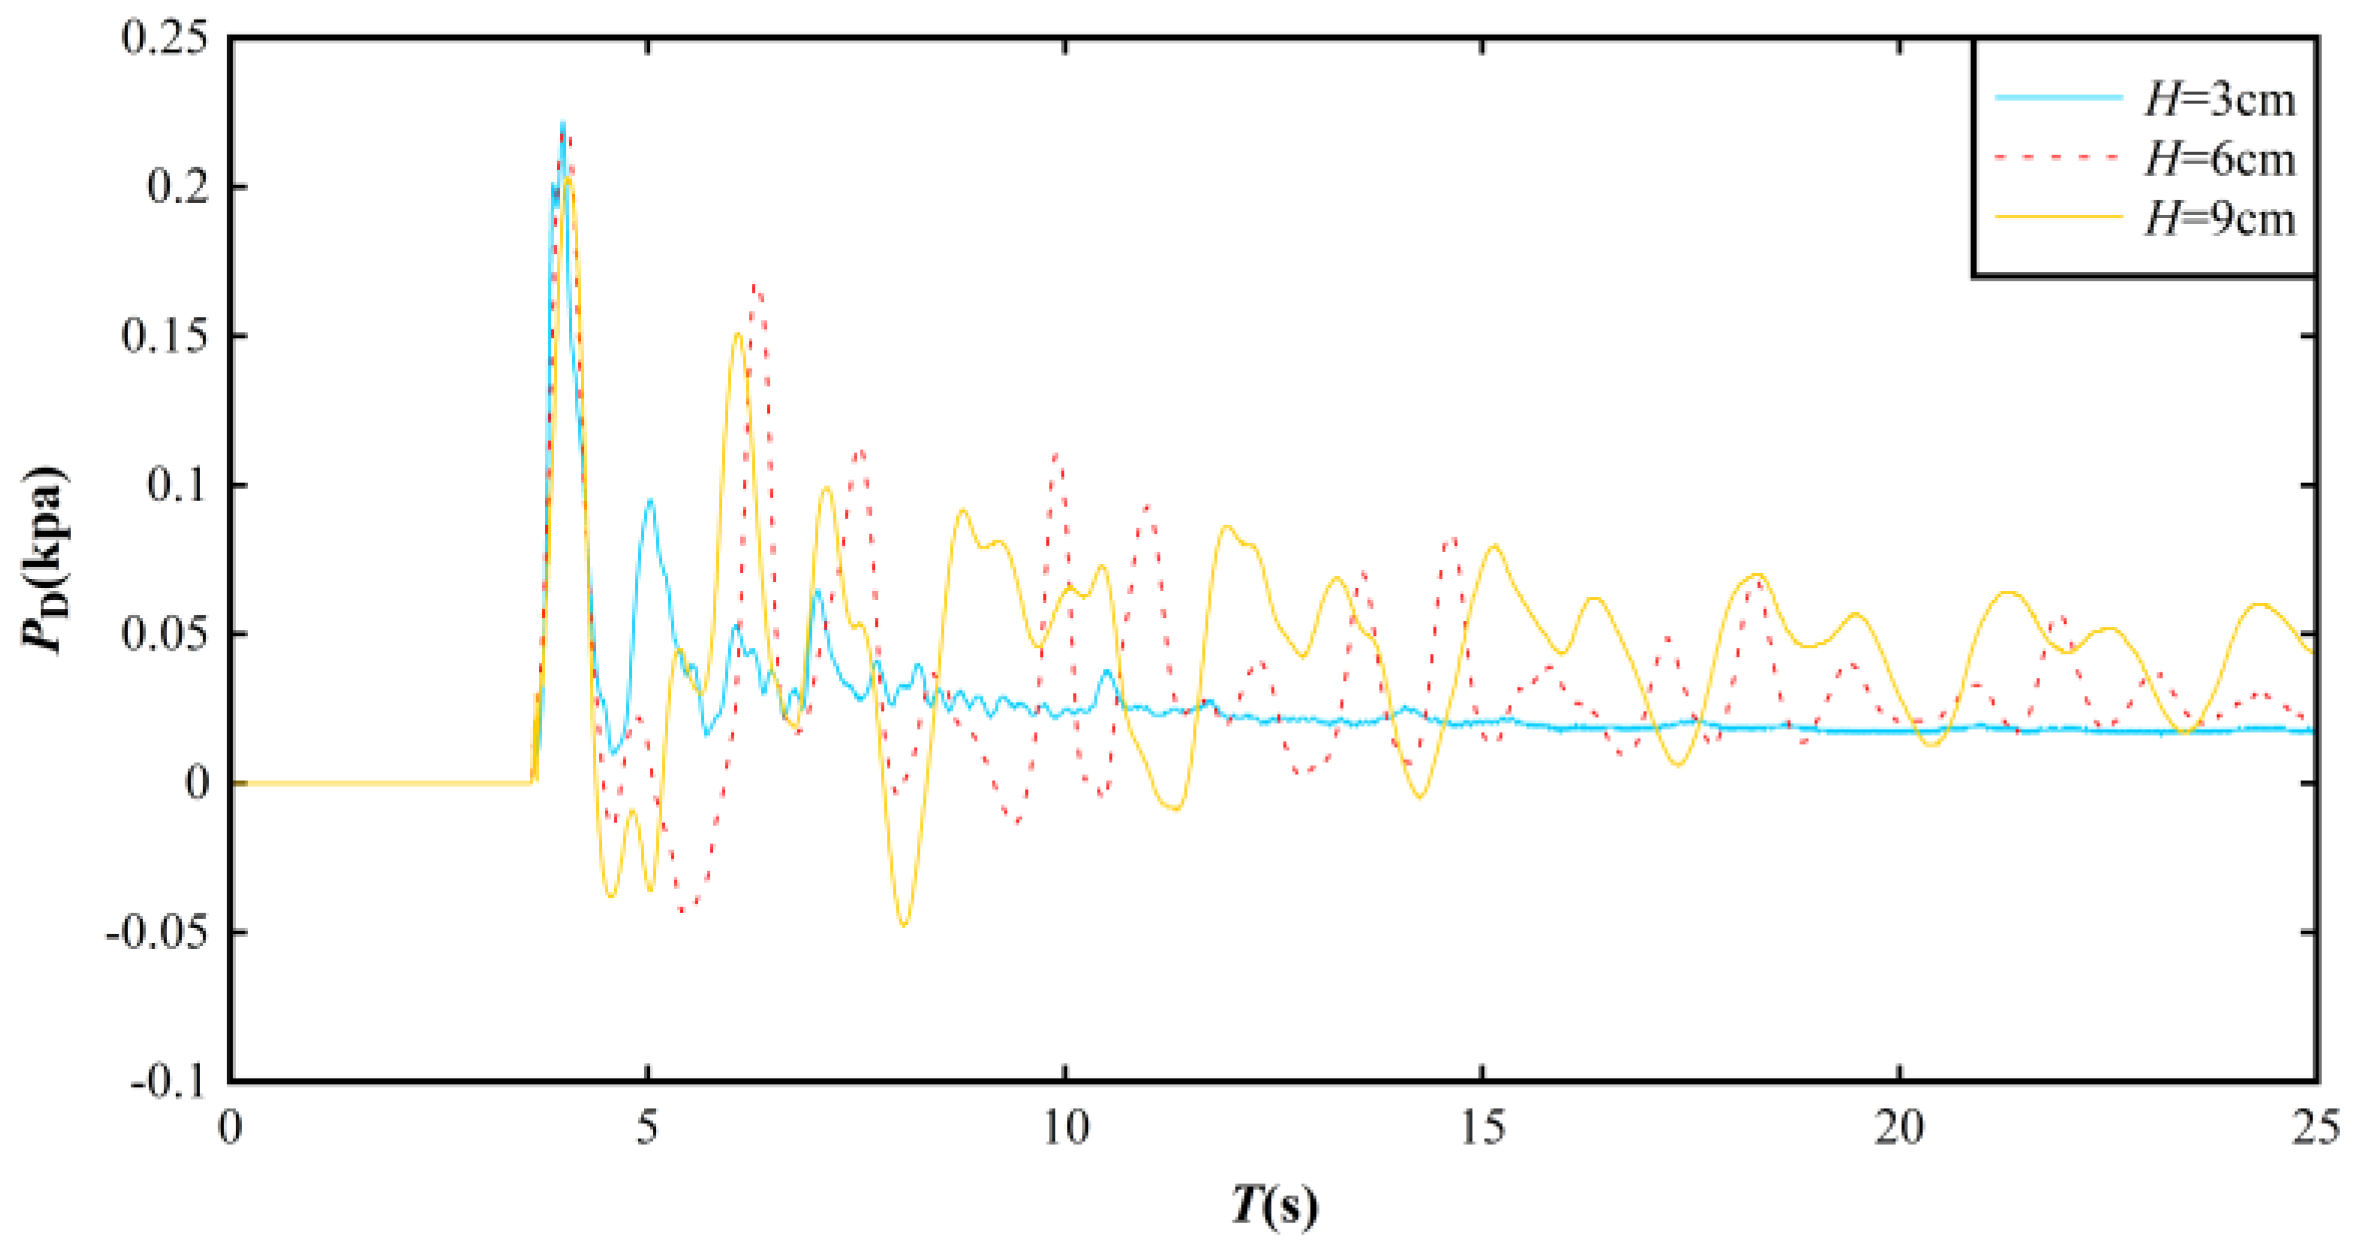
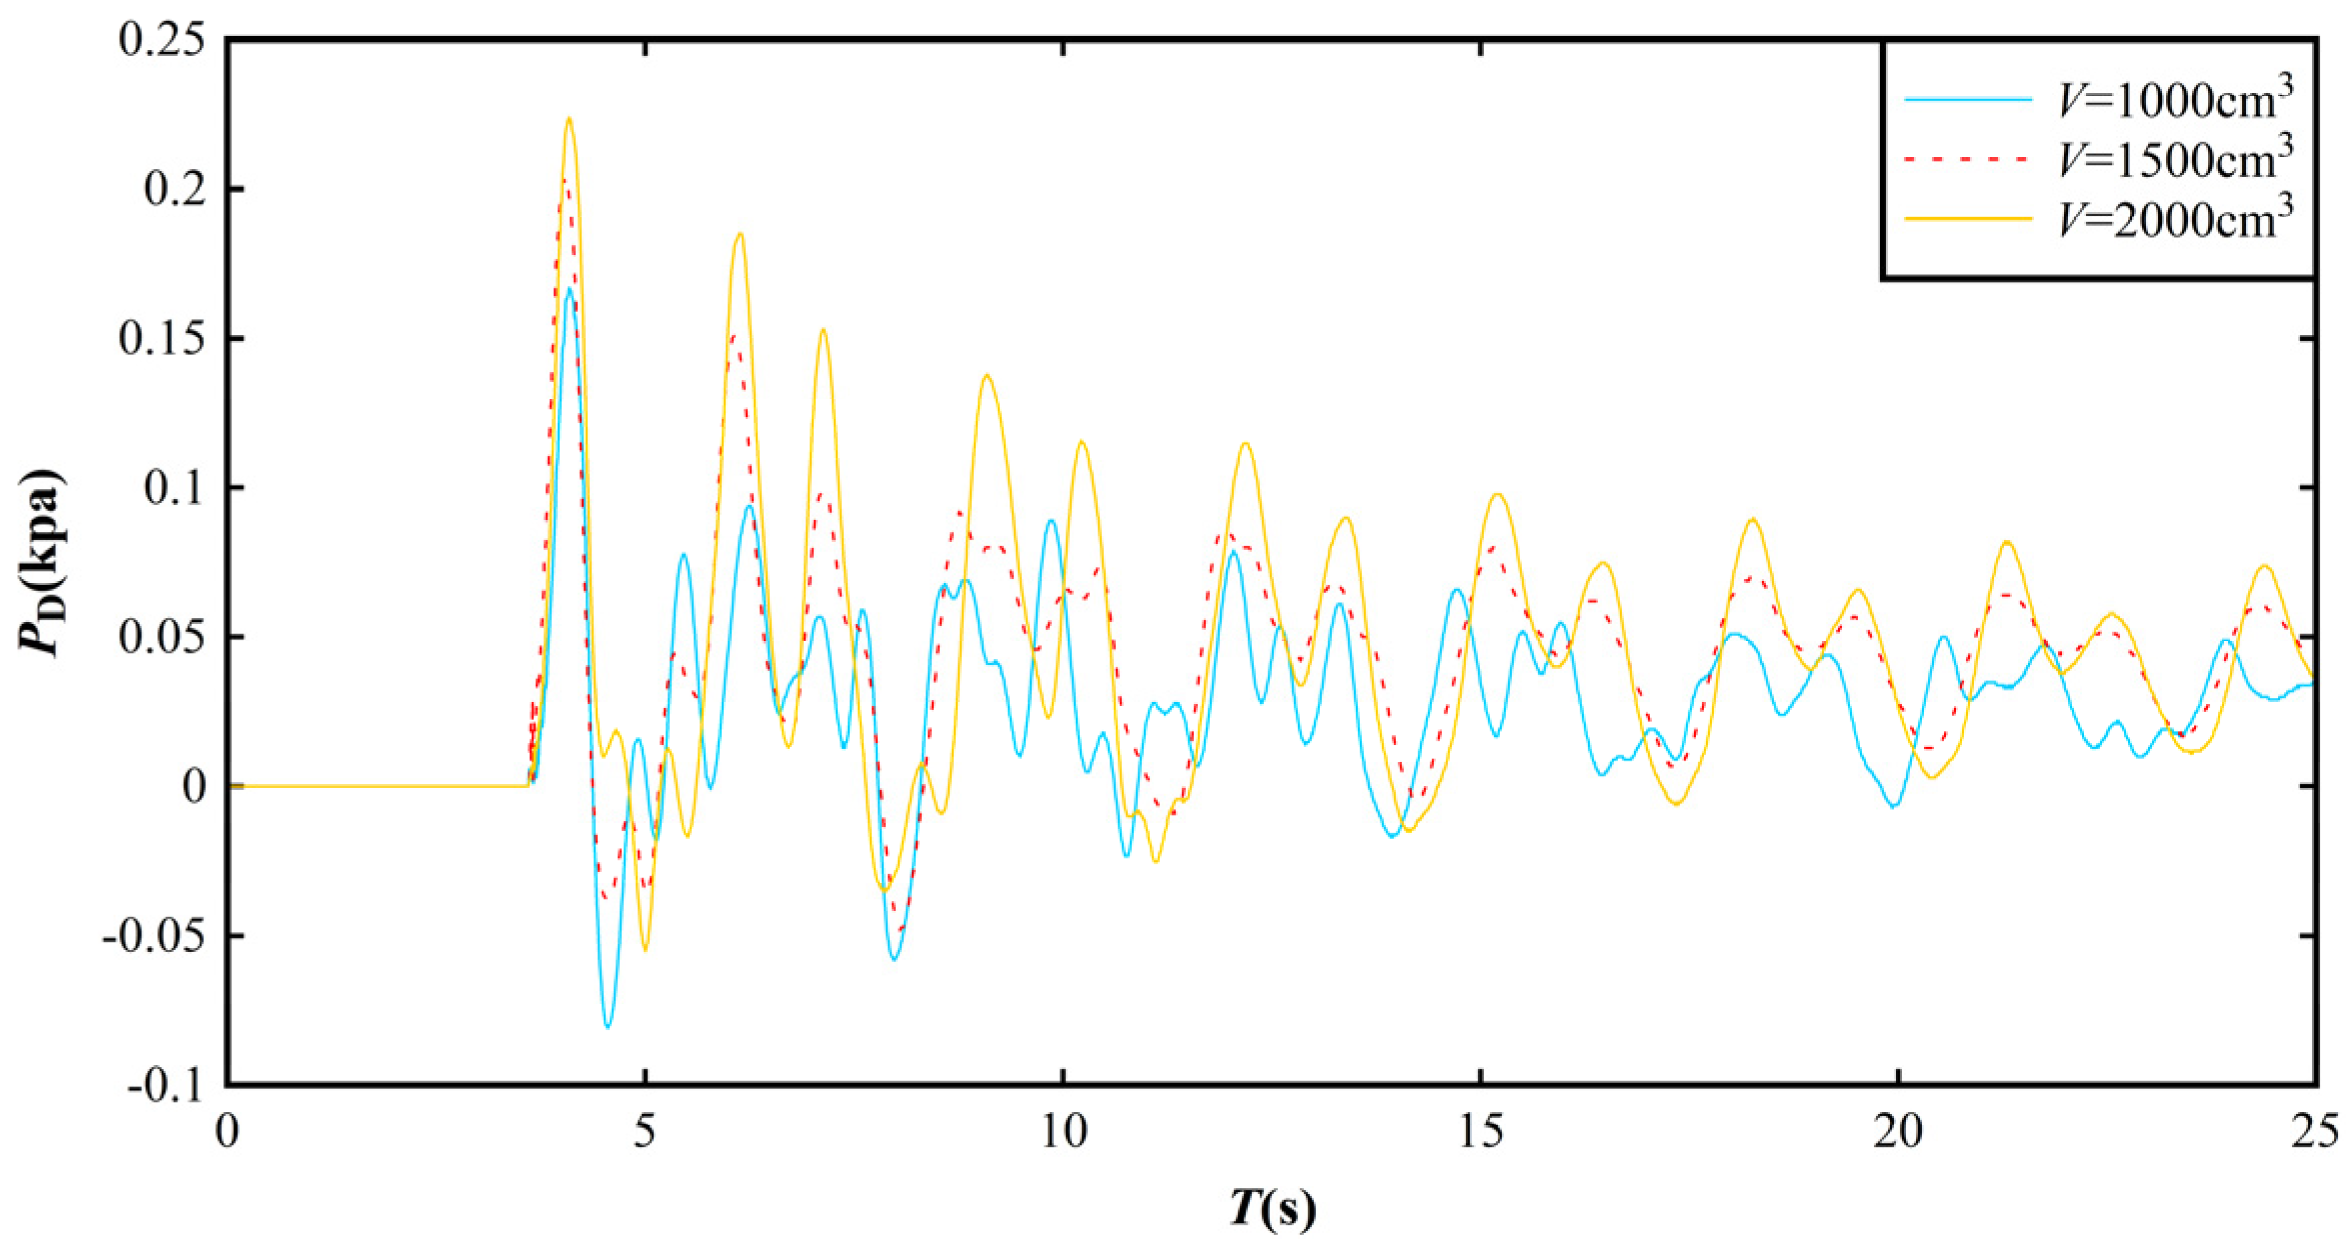
3.3. Impact Pressure Distribution on the Dam Surface

We studied the impact of various typical factors on the impulsive pressure of the dam body and evaluated the potential hazards of landslide shock waves on the dam structure. The typical variations of impulsive pressure at different distances between the dam and the landslide are shown in Figure 10. The attenuation law of pressure changes at different distances between the dam and the landslide is consistent, with the peak pressure appearing at the first wave crest before gradually decaying over time until reaching a stable state. Peak pressure increases significantly as the distance between the dam and the landslide entry point decreases.
Figure 11 shows the changes in impulsive pressure at different water depths: V = 1500 cm3, Ld = 30 cm. The peak impulsive pressure under different water depths appears at the first wave crest, with slight differences in numerical values, but not significant. In the cases of H = 6 cm and H = 9 cm, the pressure shows periodic attenuation changes over time; however, at H = 3 cm, after the first wave crest, the pressure rapidly decays over time, reaching stability in a short period. This phenomenon occurs because of the shallow water depth in this case. When combined with a large landslide volume and the short distance between the dam and the landslide point, the landslide material effectively blocks the reservoir area. This blockage creates a discontinuity in the reservoir and reduces the water capacity between the dam and the landslide entry point. Consequently, there is insufficient time and space for periodic water oscillations to develop.
The changes in impulsive pressure under different landslide volumes are shown in Figure 12. When the landslide volume is 1000 cm3, the overall impulsive pressure is minimal in this paper. With an increase in landslide volume, there is a significant increase in impulsive pressure, as the increase in landslide volume triggers larger surges of energy.

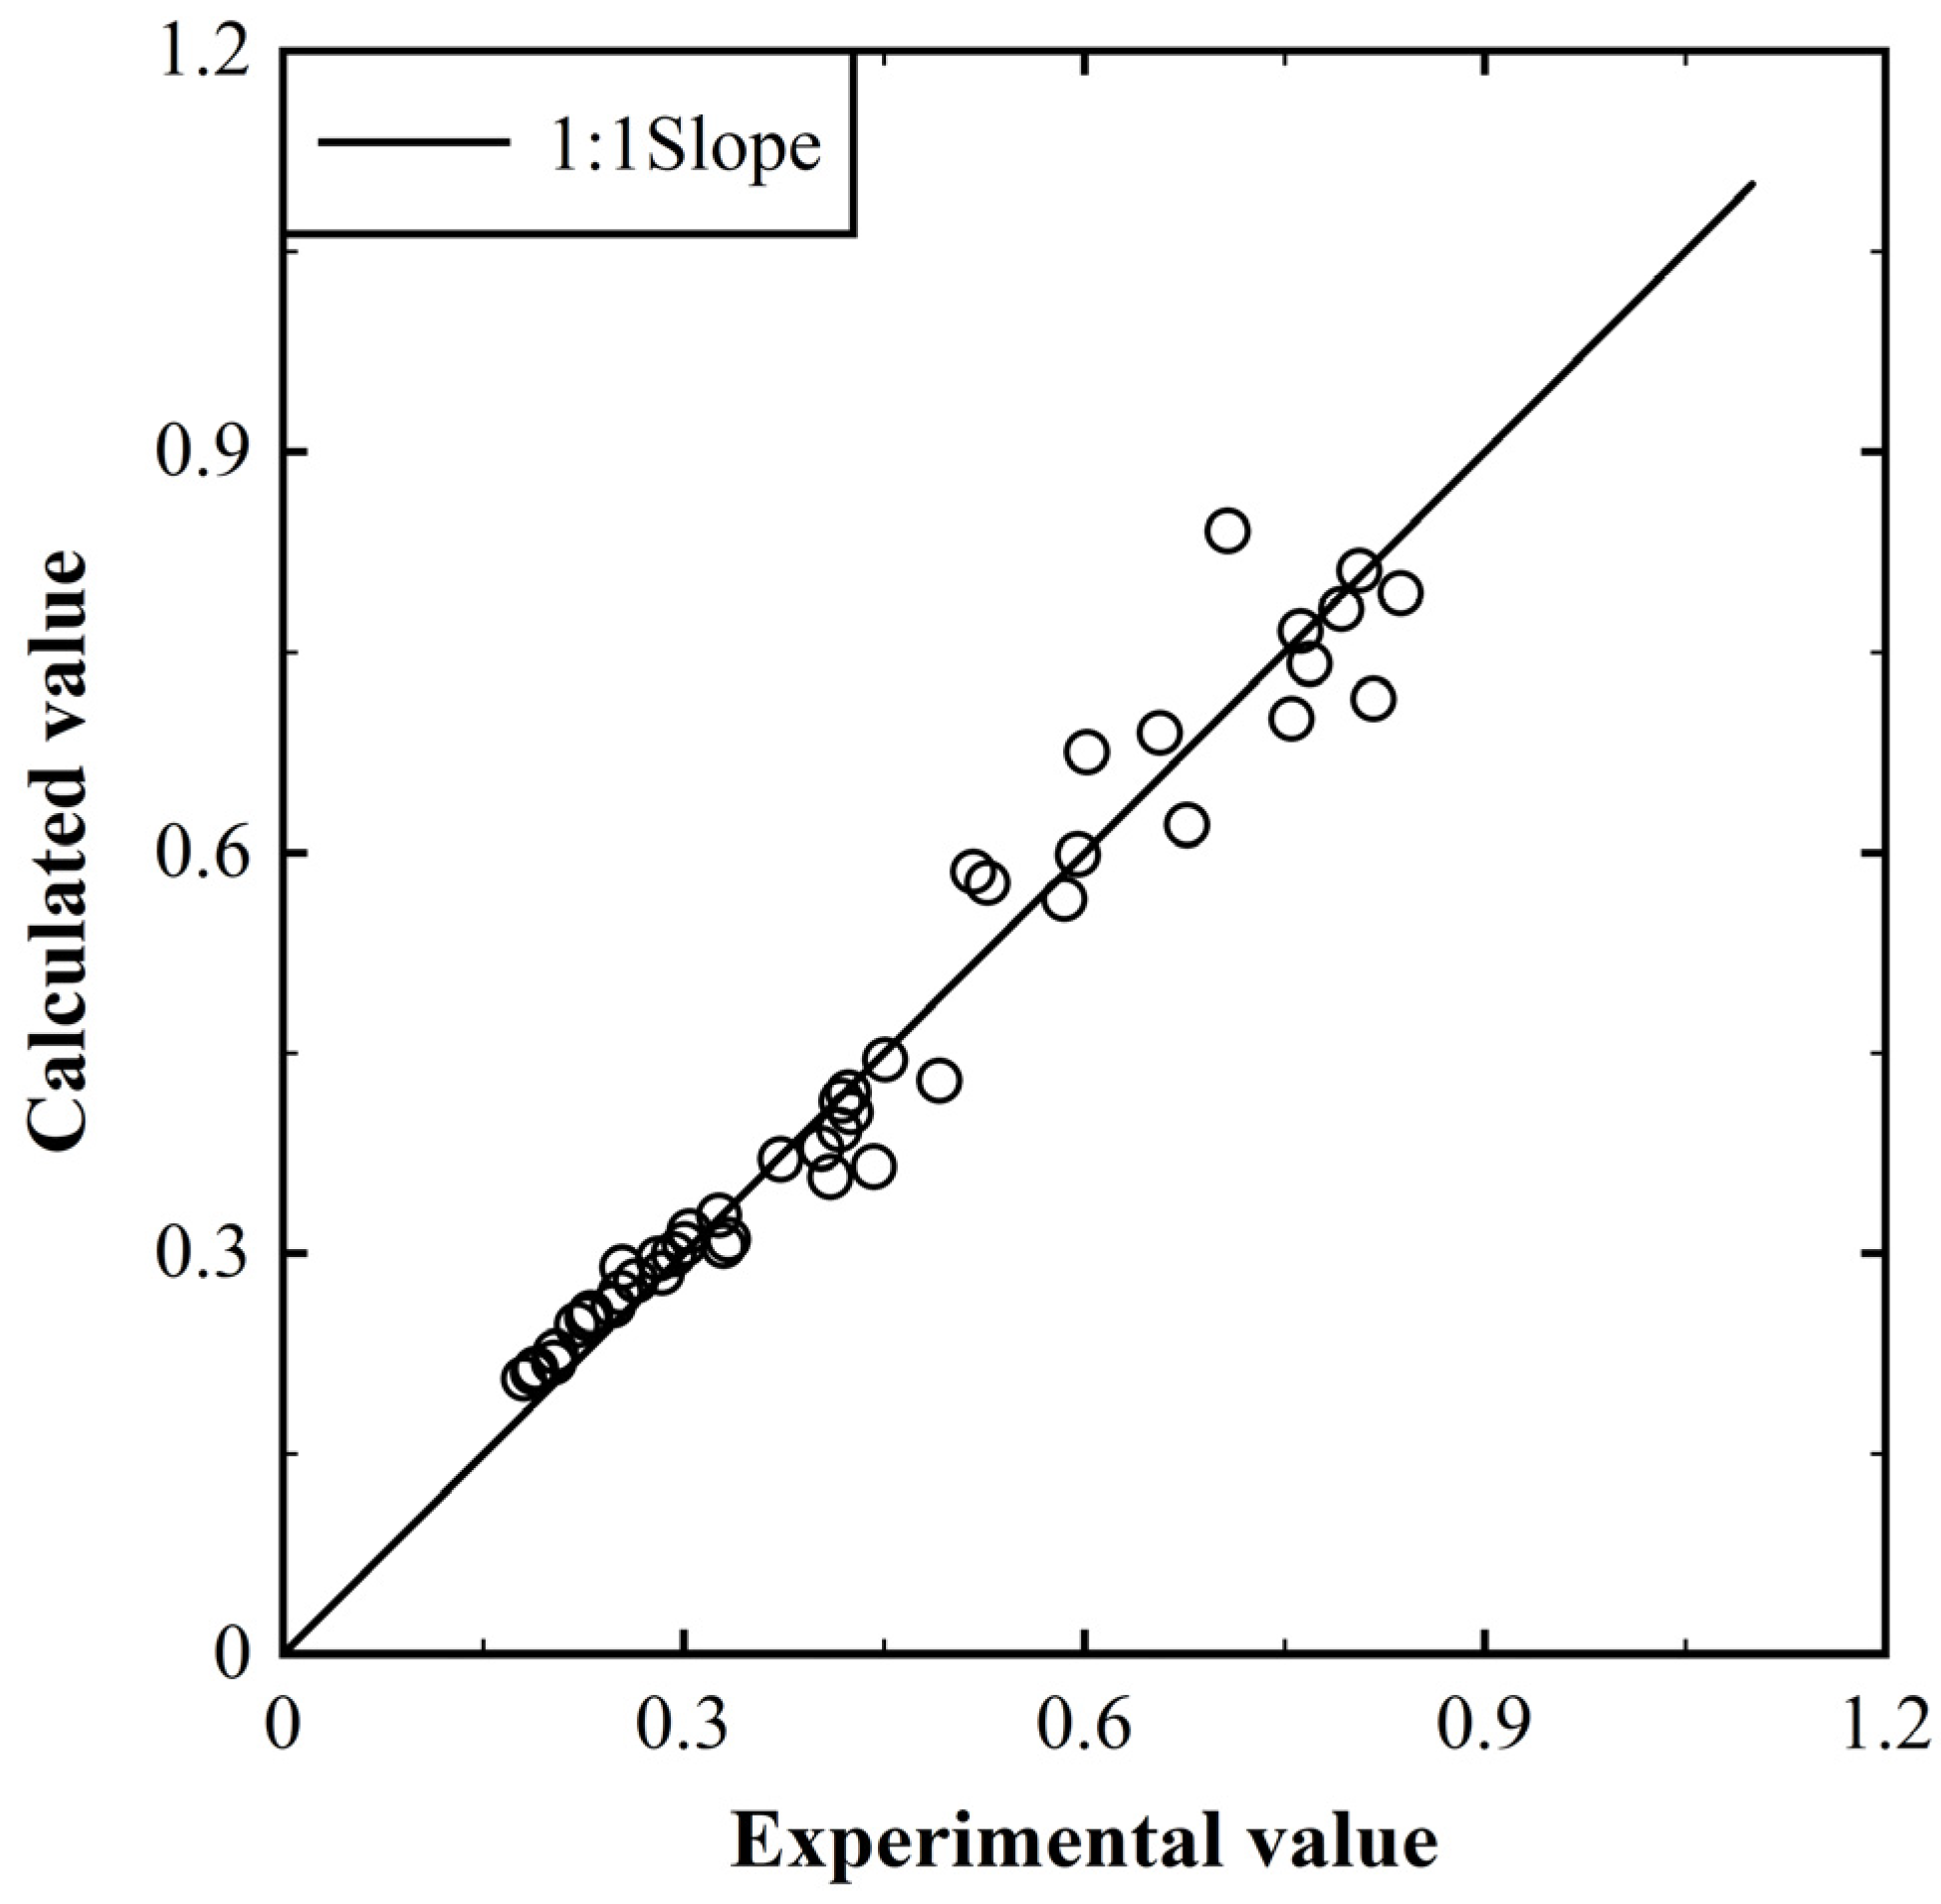
3.4. Empirical Equation for Predicting Impact Pressure on the Dam Surface

Through regression analysis, a detailed analysis was conducted to elucidate the specific effects of various factors on the maximum impact pressure loads exerted on the dam. A parameter, Ld, representing the distance between the dam and the landslide point was introduced. In this study, the maximum impact pressure on the dam is predominantly influenced by the following key parameters:
P D m a x = f ρ , g ,   V ,   B , H , L d
Based on dimensional analysis, the dimensionless parameters with clear physical meaning are obtained as follows:
P D m a x ρ g H = f V 1 3 B , H B ,   L d B
The derivation of the regression equation for the maximum impact pressure loads acting on the dam is as follows:
P D m a x ρ g H = 0.205 V 1 3 B 1.314 H B 0.918 L d B 0.052
In the equation, PDmax is the maximum impact pressure (Pa) on the dam, ρ is the water density (kg/m3), g is the gravitational acceleration (m/s2), B is the river width (m), H is the water level (m), and Ld is the distance between the dam and the landslide point (m). The coefficient of determination (R2) of this regression equation is 0.96, indicating a good fit between the experimental data and the relationship established in this paper.
From the above equation, it can be inferred that the distance Ld, the water depth H, and the river width B exhibit a negative correlation with the impact pressure. In contrast, the landslide volume demonstrates a pronounced positive effect on the impact pressure. A comparison between the experimentally measured values and the calculated values of the maximum impact pressure is presented in Figure 13. As illustrated in Figure 13, the discrepancy between the calculated values derived from the regression equation and the experimental values is minimal. This indicates that the regression equation provides a reliable and accurate prediction of the maximum impact pressure exerted on the dam.

4. Discussion

The study’s findings have significant implications for dam safety assessment and reservoir management in landslide-prone mountainous regions. The established relationships between impact pressure, landslide material characteristics, and flow conditions provide a framework for predicting potential impact loads on dams and reservoir banks under different landslide scenarios. This information can guide the design and reinforcement of hydraulic structures, ensuring their resilience against landslide-induced impacts.

4.1. Practical Applicability of Developed Equations

The empirical equations developed in this study offer practical tools for engineers and reservoir managers to assess potential impact pressures on dams and reservoir banks during landslide events. For practical implementation, these equations require readily measurable input parameters including river width (B), water level (H), landslide volume (V), and distance between the dam and potential landslide location (Ld). These parameters can be obtained through standard surveying techniques, geological assessments, and reservoir monitoring systems. While the equations were derived from scaled physical models, the dimensionless formulation allows for application across different scales, though practitioners should consider potential scale effects when applying to very large systems. For preliminary risk assessments, these equations can provide valuable first-order estimates of potential impact pressures to identify critical areas requiring more detailed analysis or monitoring.

4.2. Implications for Dam Safety and Reservoir Management

The findings have clear implications for improving the safety and operational management of reservoirs in landslide-prone areas. The spatial distribution of impact pressure emphasizes the importance of identifying vulnerable sections of dams and banks for targeted reinforcement. Additionally, the analysis of water level fluctuations highlights the need to account for landslide-generated waves in reservoir operations and emergency planning. Recognizing dominant wave frequencies can also inform the design of early warning systems. Furthermore, the influence of landslide material properties on impact dynamics and flow behavior underlines the importance of conducting detailed geological surveys and material characterization to improve hazard assessments and develop effective mitigation strategies.

5. Conclusions

This study presents a comprehensive experimental investigation of the impact characteristics of landslide materials entering reservoirs and their effects on dams and reservoir banks. The main conclusions are as follows:
1. The maximum impulsive pressure consistently occurs at the first wave crest and gradually attenuates over time until reaching stability. Closer proximity between the dam and the landslide results in higher peak pressures, with a consistent attenuation pattern across varying conditions.
2. Empirical equations for predicting the impact pressure on both the reservoir bank and the dam were established, providing reliable estimation tools for dam safety evaluations based on key parameters including landslide volume, slope angle, water depth, and impact distance.
3. Landslide volume and slope angle exert significant positive influence on impact pressure, whereas water depth and distance from the impact point exhibit negative influence. Larger landslide volumes and steeper slope angles amplify peak pressure due to increased energy transfer, while greater water depth reduces peak pressure through enhanced damping effects.
This study has several limitations that should be acknowledged. The experimental design was limited to testing only two slope angles (35° and 45°), and it employed fixed particle size distribution and density of landslide materials to isolate geometric effects. The physical model incorporated geometric simplification and did not fully account for three-dimensional effects present in complex reservoir topography. Additionally, scale effects inherent in laboratory experiments may influence the direct application of the results to prototype conditions. Future research should incorporate a wider range of slope angles, investigate the influence of varying material properties, address topographic complexities through advanced 3D modeling, and validate findings with field measurements where possible. Additional research directions should include developing coupled numerical models that integrate the empirical relationships established in this study, investigating the systematic classification of wave types under different conditions and their relationship to pressure loads, examining the dynamic response of dam structures to the identified pressure loads, and exploring effective mitigation measures to reduce impact pressure in high-risk areas.

Author Contributions

Conceptualization, W.Z. and Z.N.; methodology, H.W., W.Z. and Z.N.; software, H.W. and H.Y.; validation, H.Y., W.Z. and Z.N.; formal analysis, H.W.; investigation, H.Y.; resources, Z.N.; data curation, H.Y.; writing—original draft preparation, H.W. and W.Z.; writing—review and editing, Z.N.; visualization, H.W.; supervision, W.Z. and Z.N.; project administration, W.Z. and Z.N.; funding acquisition, W.Z. and Z.N. All authors have read and agreed to the published version of the manuscript.

Funding

This research was funded by Hubei Key Laboratory of Intelligent Yangtze and Hydroelectric Science, China Yangtze Power Co., Ltd., project number: 2422020009, the National Natural Science Foundation of China, grant number: 52479070 and 52309101, Joint Funds of National Natural Science Foundation of China, grant number: U23A20668, and China Postdoctoral Science Foundation, grant number: 2024T170613 and 2023M732478.

Data Availability Statement

All data, models, or codes that support the findings of this study are available from the corresponding author upon reasonable request.

Conflicts of Interest

Author Hantao Wang was employed by Yangtze Power Co., Ltd. Author Hang Yang was employed by China Three Gorges Construction Engineering Corporation. The remaining authors declare that the research was conducted in the absence of any commercial or financial relationships that could be construed as a potential conflict of interest.

References

  1. Huang, R.; Fan, X. The landslide story. Nat. Geosci. 2013, 6, 325–326. [Google Scholar] [CrossRef]
  2. Froude, M.J.; Petley, D.N. Global fatal landslide occurrence from 2004 to 2016. Nat. Hazards Earth Syst. Sci. 2018, 18, 2161–2181. [Google Scholar] [CrossRef]
  3. Iqbal, J.; Tu, X.; Gao, W. The Impact of Reservoir Fluctuations on Reactivated Large Landslides: A Case Study. Geofluids 2019, 2019, 16. [Google Scholar] [CrossRef]
  4. Montiel, E.; Parra, N. Stability of a slope to the filling of a reservoir, understanding the behavior of a fractured rock mass. In Proceedings of the 8th South American Congress on Rock Mechanics, Buenos Aires, Argentina, 15–18 November 2015. [Google Scholar]
  5. He, K.; Li, X.; Yan, X. The landslides in the Three Gorges Reservoir Region, China and the effects of water storage and rain on their stability. Environ. Geol. 2008, 55, 55–63. [Google Scholar]
  6. Yin, Y.; Huang, B.; Wang, W. Reservoir-induced landslides and risk control in Three Gorges Project on Yangtze River, China. J. Rock Mech. Geotech. Eng. 2016, 8, 577–595. [Google Scholar] [CrossRef]
  7. Manenti, S.; Salis, N.; Todeschini, S. 3D WCSPH modelling of landslide-water dynamics during 1963 Vajont disaster. Sci. Rep. 2024, 14, 27504. [Google Scholar] [CrossRef]
  8. Dykes, A.P.; Bromhead, E.N. Hazards from lakes and reservoirs: New interpretation of the Vaiont disaster. J. Mt. Sci. 2022, 19, 1717–1737. [Google Scholar] [CrossRef]
  9. Dai, F.C.; Deng, J.H.; Tham, L.G.; Law, K.T.; Lee, C.F. A large landslide in Zigui County, Three Gorges area. Can. Geotech. J. 2004, 41, 1233–1240. [Google Scholar] [CrossRef]
  10. Panizzo, A.; De Girolamo, P.; Petaccia, A. Forecasting impulse waves generated by subaerial landslides. J. Geophys. Res. Ocean. 2005, 110, C12025. [Google Scholar] [CrossRef]
  11. Heller, V.; Hager, W.H. Impulse product parameter in landslide generated impulse waves. J. Waterw. Port Coast. Ocean Eng. 2010, 136, 145–155. [Google Scholar] [CrossRef]
  12. Mohammed, F.; Fritz, H.M. Physical modeling of tsunamis generated by three-dimensional deformable granular landslides. J. Geophys. Res. Ocean. 2012, 117, C11015. [Google Scholar] [CrossRef]
  13. Lindstrøm, E.K.; Pedersen, G.K.; Jensen, A.; Glimsdal, S. Experiments on slide generated waves in a 1:500 scale fjord model. Coast. Eng. 2014, 92, 12–23. [Google Scholar] [CrossRef]
  14. Ataie-Ashtiani, B.; Nik-Khah, A. Impulsive waves caused by subaerial landslides. Environ. Fluid Mech. 2008, 8, 263–280. [Google Scholar] [CrossRef]
  15. Zweifel, A.; Hager, W.H.; Minor, H.E. Plane impulse waves in reservoirs. J. Waterw. Port Coast. Ocean Eng. 2006, 132, 358–368. [Google Scholar] [CrossRef]
  16. Heller, V.; Spinneken, J. Improved landslide-tsunami prediction: Effects of block model parameters and slide model. J. Geophys. Res. Ocean. 2013, 118, 1489–1507. [Google Scholar] [CrossRef]
  17. Romano, A.; Bellotti, G.; Risio, M.D. Wavenumber-frequency analysis of the landslide-generated tsunamis at a conical island. Coast. Eng. 2013, 81, 32–43. [Google Scholar] [CrossRef]
  18. Zitti, G.; Ancey, C.; Postacchini, M.; Brocchini, M. Impulse waves generated by snow avalanches: Momentum and energy transfer to a water body. J. Geophys. Res. Earth Surf. 2016, 121, 2399–2423. [Google Scholar] [CrossRef]
  19. Heller, V.; Hager, W.H.; Minor, H.E. Landslide Generated Impulse Waves in Reservoirs: Basics and Computation; ETH Zürich: Zürich, Switzerland, 2009; pp. 1–172. [Google Scholar]
  20. Fritz, H.M.; Hager, W.H.; Minor, H.E. Near field characteristics of landslide generated impulse waves. J. Waterw. Port Coast. Ocean Eng. 2004, 130, 287–302. [Google Scholar] [CrossRef]
  21. Evers, F.M.; Hager, W.H.; Boes, R.M. Spatial impulse wave generation and propagation. J. Waterw. Port Coast. Ocean Eng. 2019, 145, 04019011. [Google Scholar] [CrossRef]
  22. Chen, H.Y.; Cui, P.; Chen, X.Q.; Zhu, X.H.; Zhou, G.G.D. Laboratory experiments of water pressure loads acting on a downstream dam caused by ice avalanches. Landslides 2015, 12, 1131–1138. [Google Scholar] [CrossRef]
  23. Ruffini, G.; Heller, V.; Briganti, R. Numerical modelling of landslide-tsunami propagation in a wide range of idealised water body geometries. Coast. Eng. 2019, 153, 103518. [Google Scholar] [CrossRef]
  24. Ataie-Ashtiani, B.; Yavari-Ramshe, S. Numerical simulation of wave generated by landslide incidents in dam reservoirs. Landslides 2011, 8, 417–432. [Google Scholar] [CrossRef]
  25. Kisacik, D.; Troch, P.; Van Bogaert, P. Experimental study of pressure distributions due to the breaking wave impacts on a vertical wall with an overhanging horizontal cantilever slab. Ocean Eng. 2019, 177, 142–154. [Google Scholar]
  26. Pu, J.H.; Hussain, K.; Shao, S.D.; Huang, Y.F. Shallow sediment transport flow computation using time-varying sediment adaptation length. Int. J. Sediment Res. 2014, 29, 171–183. [Google Scholar] [CrossRef]
  27. Chen, X.; Hofland, B.; Altomare, C.; Oosterlo, P.; Uijttewaal, W. Forces on a vertical wall on a dike crest due to overtopping flow. Coast. Eng. 2015, 95, 94–104. [Google Scholar] [CrossRef]
  28. Cuomo, G.; Allsop, W.; Bruce, T.; Pearson, J. Breaking wave loads at vertical seawalls and breakwaters. Coast. Eng. 2010, 57, 424–439. [Google Scholar] [CrossRef]
  29. Ravindar, R.; Sriram, V.; Schimmels, S.; Stagonas, D. Characterization of breaking wave impact on vertical wall with recurve. ISH J. Hydraul. Eng. 2019, 25, 153–161. [Google Scholar] [CrossRef]
  30. Lugni, C.; Brocchini, M.; Faltinsen, O.M. Wave impact loads: Wave impact loads: The role of the flip-through. Phys. Fluids 2006, 18, 122101. [Google Scholar] [CrossRef]
  31. Oumeraci, H.; Klammer, P.; Partenscky, H.W. Classification of breaking wave loads on vertical structures. J. Waterw. Port Coast. Ocean Eng. 1993, 119, 381–397. [Google Scholar] [CrossRef]
  32. Kirkgöz, M.S. Breaking wave impact on vertical and sloping coastal structures. Ocean Eng. 1995, 22, 35–48. [Google Scholar] [CrossRef]
  33. Hattori, M.; Arami, A.; Yui, T. Wave impact pressure on vertical walls under breaking waves of various types. Coast. Eng. 1994, 22, 79–114. [Google Scholar] [CrossRef]
Figure 1. Experimental setup in both top view and side view (a); locations of the sensors (b); photograph of the actual experimental flume setup (c).
Water 17 01133 g001
Figure 2. Sequential photographs showing the landslide material movement: (a) initial release from the material box; (b) material sliding along the chute; (c) impact with bank; (d) final spreading and deposition in the reservoir.
Water 17 01133 g002
Figure 3. Pressure time series at measuring points along the reservoir bank for a representative experimental condition (θ = 45°, V = 2000 cm3, H = 12 cm).
Water 17 01133 g003
Figure 4. Pressure change characteristics of measuring points along the landslide within 1 s after entering the river: θ = 45°, V = 500 cm3, H = 3 cm (a); θ = 45°, V = 1000 cm3, H = 6 cm (b); θ = 45°, V = 1500 cm3, H = 9 cm (c); θ = 45°, V = 2000 cm3, H = 12 cm (d); θ = 35°, V = 500 cm3, H = 3 cm (e); θ = 35°, V = 2000 cm3, H = 12 cm (f).
Water 17 01133 g004
Figure 5. The relationship between the dominant frequency and water depth for different slopes: θ = 35° (a); θ = 45° (b).
Water 17 01133 g005
Figure 6. The relationship between water depth and maximum impact pressure under varying slope angles and landslide volumes: θ = 35° (a); θ = 45° (b).
Water 17 01133 g006
Figure 7. The variation in maximum impact pressure with landslide volume under different slope angles and water depths: θ = 35° (a); θ = 45° (b).
Water 17 01133 g007
Figure 8. The maximum impact pressure under two different slopes across various working conditions: V = 1000 cm3 (a); V = 2000 cm3 (b).
Water 17 01133 g008
Figure 9. Comparison of calculated values and experimental values of impact pressure along the reservoir bank.
Water 17 01133 g009
Figure 10. The dam and landslide experience varying degrees of impact pressure at different distances: V = 1500 cm3, H = 9 cm.
Water 17 01133 g010
Figure 11. The change in impact pressure under different water depths: V = 1500 cm3, Ld = 30 cm.
Water 17 01133 g011
Figure 12. Variations in impact pressure with different landslide volumes: H = 9 cm, Ld = 30 cm.
Water 17 01133 g012
Figure 13. Comparison of calculated and experimental values of dam impact pressure.
Water 17 01133 g013
Table 1. Reservoir bank impact pressure test parameter table.
d50 (mm)θ = 35°θ = 45°
H (cm)V (cm3)H (cm)V (cm3)
2.535003500
3100031000
3150031500
3200032000
65006500
6100061000
6150061500
6200062000
95009500
9100091000
9150091500
9200092000
1250012500
121000121000
121500121500
122000122000
Table 2. Dam impact pressure test parameter table.
d50 (mm)θ (°)H = 3 cmH = 6 cmH = 9 cm
V (cm3)Ld (cm)V (cm3)Ld (cm)V (cm3)Ld (cm)
2.545100010100010100010
100020100020100020
100030100030100030
100040100040100040
100060100060100060
150010150010150010
150020150020150020
150030150030150030
150040150040150040
150060150060150060
200010200010200010
200020200020200020
200030200030200030
200040200040200040
200060200060200060
Disclaimer/Publisher’s Note: The statements, opinions and data contained in all publications are solely those of the individual author(s) and contributor(s) and not of MDPI and/or the editor(s). MDPI and/or the editor(s) disclaim responsibility for any injury to people or property resulting from any ideas, methods, instructions or products referred to in the content.

