Article

Estimation of Solöz River Water Balance Components and Rainfall Runoff Pattern with WEAP Model 1

Environmental Engineering Department, Faculty of Engineering, Bursa Uludağ University, 16059 Bursa, Türkiye
*
Author to whom correspondence should be addressed.
Water 2025, 17(8), 1129; https://doi.org/10.3390/w17081129
Submission received: 9 February 2025 / Revised: 14 March 2025 / Accepted: 24 March 2025 / Published: 10 April 2025
(This article belongs to the Special Issue Advance in Hydrology and Hydraulics of the River System Research 2025)

Abstract

:
In this study, in order to draw a road map for lake water budget modeling, model calibration was performed with statistical results by modeling in a stream that feeds the lake basin and has flow observation results. The aim was to make a preliminary estimation and evaluation for calibration of the model result to be obtained in streams without flow observation results in the lake basin. The WEAP (“Water Evaluation and Planning” System) model was used for this purpose. With WEAP, Soloz Stream was selected to determine the amount of flow in streams with no flow. Soloz Stream was selected to determine the amount of flow in streams that do not flow with WEAP. Climate data, flow values obtained from Princeton University climate data, and flow observation results from the data obtained by including the spring flows of DSI (General Directorate of State Hydraulic Works) were modeled comparatively. Studies on the hydrology part of the model are limited in the literature, and this study contributes to the literature with a hydrological evaluation. In this context, the total annual water budget was extracted together with the water budget components, and an estimation was made with the model result for the main flow in the stream from the flow continuity curve. As a result of this study, the findings obtained from the modeling research with WEAP indicate that the model results and the observed results are compatible based on statistical calibration parameters. However, the consistent results observed include the source measurements, so the flow results obtained from precipitation alone are not consistent enough, and it is observed that the model gives reasonable results when climate and source flows are modeled together.

1. Introduction

Today, water is of vital importance for human health and ecosystems, as well as a necessity for the development of countries. Water scarcity is becoming an increasingly prominent and widespread problem. This problem causes many social and economic problems. The conservation and utilization of our natural resources is very important for ensuring sustainable development. All these elements can only be evaluated within the scope of sustainable water management. The current approach to water resource management is to carry out resource management on a basin basis and in an “integrated” manner with other natural resources. The integrated management of water resources, an element of the environment and a driving force for major sectors of socioeconomic development such as energy, agriculture, and health, is one of the fundamental components of sustainable development. In addition to the efficient use of water resources, it is of great importance to take into account the needs of future generations based on the natural regeneration process. The main objectives of integrated basin management are to promote and ensure the sustainable use of existing water resources, and to improve and prevent the destruction of aquatic ecosystems and other ecosystems dependent on them.
Lakes are recognized as one of the most important stores of terrestrial reserves. They play an important role in surface water and the regional regulation of the climate, balancing ecosystems, and biodiversity conservation [1]. Lake water resources are also widely used in different human-related activities such as water conservation, hydropower, irrigation, and agriculture [2,3,4]. In recent decades, lakes in different regions have undergone varying degrees of change due to global climate change [5,6,7]. Global warming, or the rapid increase in surface temperatures, has accelerated the melting of polar glaciers and surrounding sea ice; this phenomenon has also increased humidity, resulting in more precipitation and further increasing the inequality in the distribution of lake water storage [8,9]. Consequently, changes in lakes and reservoirs are receiving increasing attention, and all their morphodynamic properties (e.g., water area, water level, and water storage) are particularly observed in changing environments [10]. The current status and the changing trend in lake water storage form the basis for the estimation of terrestrial water availability and are a special topic for the assessment of current and future water resources. As a result, lake water storage changes play an important role in the global hydrological cycle and influence the hydrological process [11,12].
Seasonal variation in lake water storage is a very important element of global and regional water budgets. Although lake water storage varies in typical basins [11,13,14,15] and seasonal fluctuations in typical lakes and reservoirs have been previously investigated [16], currently, in situ lake water storage measurements are sparse, especially in developing countries [17]. Because heterogeneous in situ networks have always been poorly shared at the global level, global seasonal variation has been difficult to estimate and remains unknown.
WEAP is a program based on an integrated approach to water resource planning; created in 1988, it is a flexible, integrated, and transparent planning tool to assess the sustainability of current water demand and supply dynamics and alternative scenarios over long periods of time.
Selek and Aslan [18] introduced the WEAP program in their study as follows. WEAP software aims to efficiently plan basin water hydrology in integrated water resource management. Thanks to the program, water budgets can be calculated according to various scenarios by entering existing basin information into the program so that management analysis can be performed. Within this study, we plan to calculate the water budget with different models, as well as to calculate the water budget with the WEAP model, compare the results, and validate the model.
Goshime et al. [19] simulated the water budget of the Rift Valley Lakes in Ethiopia with the WEAP model, compared the flow observation results in the lakes with the flow results obtained from precipitation, and observed that close results were obtained; water needs were calculated with the model, demand flow and unmet flows were calculated separately for today, short-term and future periods; water budget and water level graphs were calculated comparatively; data such as water budget area change volume change were calculated; and the study was concluded.
The WEAP model [20] was applied to several lake basins in Ethiopia and Kenya to integrate water supply and demand. WEAP was used to assess possible outcomes. For example, the impact of planned water resource development (irrigation and water supply) on Lake Tana water level was studied [21]. It has also been used to simulate the future allocation of surface water resources in the Didessa sub-basin of the Abbay River Basin [22]. Gedefaw et al. [23] applied the WEAP model to assess expansion and climate change scenarios for water resources in the Awash River Basin of Ethiopia, and the potential impact of irrigation. The WEAP model was chosen because it allows for scenario-based analysis of water resources. Demand and supply are determined by considering various water resources and hydrological components [24]. The model also allows for the simulation of domestic, irrigation, and ecological water consumption over time and considering the space required for integrated water resource assessment [25,26,27].
In this study, in order to draw a roadmap for lake water budget modeling, firstly, modeling was performed in a stream that feeds the lake basin and has flow observation results available, and model calibration was performed with the statistical results. The aim was to make a preliminary estimation and evaluation for calibration of the model result to be obtained in streams without flow observation results in the lake basin. The findings obtained are given in the following sections. One of the most distinctive features of this study is that there are no previous academic studies on lake surface water hydrology in this basin. There are continuous flowing streams that form the main streams feeding Iznik lake, and Solöz Stream is one of the streams forming the main stream. The reason for the selection of Solöz Stream for this study is as follows.
Since there are no flow observation results in each main stream sub-basin, we wanted to investigate whether the total flow rate at the junction of the stream and the lake could be determined based only on the amount of precipitation. It was possible to obtain the results of regular flow observations made by DSİ in Solöz Stream between 1995 and 2002. If data for a longer time interval could be obtained, it would be desirable to work on it, but the most regular flow observation results among the sub-basins were the measurements made in Solöz Stream between these dates. We thought that it would be valuable to understand the usefulness of the results obtained by modeling in streams without flow observation results.

2. Materials and Methods

2.1. Study Site

Soloz Stream is located in the Lake Iznik Basin, and Lake Iznik is located in the southeast of the Marmara Region. It extends for 32 km in the east–west direction, starting from Karsak Threshold in the east of Gemlik Bay, mainly in the South Marmara section of the Marmara Region. It is a sub-basin of the Marmara Basin. The lake area is surrounded by the Samanlı Mountains from the north, the high threshold area separating it from the Pamukova area from the east, and Gürle Mountain and Avdan Mountains from the south. Located roughly between 40°21′–40°36′ north parallels and 29°11′–29°29′ east meridians, the area in which Lake Iznik is located extends in the east–west direction. In terms of climatic characteristics, a transitional type of climate is observed in which the maximum rainfall falls in winter and spring, and the winters are mild and the summers are not too hot. In the area where the lowest temperature falls in January and the highest in July and August, the average temperatures decrease as you go from the plains around the lake to the mountainous areas and increase slightly as you go horizontally from north to south and from west to east. In this area, where precipitation is mostly in the form of rain and snow in high mountainous areas, the wettest season is winter [28]. The Soloz Stream locator map and flow map with basin boundary are shown in Figure 1.

2.2. Modeling and Data with Weap Model

WEAP (Version: 2024.0.0) can automatically identify watersheds and rivers (using digital elevation data), calculate land area (disaggregated by elevation band and land cover), download historical climate data (by elevation band) for each watershed, and generate a climate summary background map layer. This greatly simplifies the process of establishing and modeling catchment hydrology. WEAP can automatically download global datasets for elevation, land cover, and climate when required. It was chosen not only because it includes a hydrology model but because it can also project water use. Many hydrology models are used, and there are also models for planning. However, this model, which combines both features, not only gives good results but is also very practical in terms of use.
HydroSHEDS is a database and its data are available in GIS format, providing the framework for a wide range of assessments including hydrological, environmental, conservation, socioeconomic, and human health applications. HydroSHEDS DEM data are used in the WEAP model. HydroSHEDS digital elevation data are based on high-resolution elevation data acquired from the Shuttle Radar Topography Mission (SRTM) during NASA’s Space Shuttle flight. The ESA-CCI-LC land cover data come from the Moderate Resolution Imaging Spectrometer (MERIS) satellite and PROBA-V and a combination of AVHRR and SPOT-VGT data, forming a complete land cover classification sequence with a spatial resolution of 300 m, covering the period from 1992 to 2015 (24 years). With the WEAP model, the aforementioned data are automatically downloaded and the application automatically models the data for the catchment. Besides this, the DEM map is automatically downloaded and watershed boundaries can be automatically identified by the Watershed Identification Mode [20].
HydroSHEDS DEM data are available in two different resolutions: 500 m (15 arc seconds, each cell 500 m × 500 m, each 1 degree × 1 degree tile contains 240 × 240 cells) and 90 m (3 arc seconds, each cell 90 m × 90 m, each 1 degree × 1 degree tile contains 1200 × 1200 cells). The original resolution of the ESA-CCI-LC Land Cover data is 300 m, but it is up-sampled to 500 m or down-sampled to 90 m to match the selected DEM resolution [29].
The climate dataset provides near-surface meteorological data (Tmin, Precipitation, Wind) to drive land surface models and other terrestrial modeling systems. It blends reanalysis data with observations and disaggregate them in time and space monthly at 0.25 degrees latitude/longitude. The dataset was created by the Terrestrial Hydrology Group at Princeton University.
WEAP provides access to a variety of “built-in” global gridded climate datasets, both past and future (climate change scenarios from global circulation models (GCMs)), including temperature, precipitation, relative humidity, and wind speed data at daily and monthly time steps at 0.25 degree (roughly 28 km) spatial resolution. The historical dataset was created by the Terrestrial Hydrology Group at Princeton University and covers the period of 1948–2014 (an earlier version covered the period 1948–2010—both datasets are available in WEAP). It blends reanalysis data with observations [20].
The main streams in the Lake Iznik Basin are Karasudere, Iznik Stream, Kıran Stream, Soloz Stream, Nadir Stream, and Karsak Stream. Apart from these, there are many streams with seasonal and continuous flow.
In this study, the water budget components, flow continuity curve, and calibration results of Solöz Creek were analyzed between 1995–2002.
Of these, Soloz Stream was selected and model results were obtained by calculating the flow amount from the amount of precipitation, without having flow observation results on this stream available, and the flow observation results obtained from DSİ and the flow results obtained from the amount of precipitation were also modeled comparatively; finally, model calibration was made thanks to the statistical results.
The flow observation results obtained from DSI are monthly averages. These datasets can be obtained in Excel form, but they need to be processed in order to be used in the model. If data are available, working with daily data can give more detailed results, but it may not be possible to use long-term and regular datasets in this detail; in such cases, very useful results can be obtained with monthly data if it is long-term. Climate data can be downloaded automatically from Princeton University’s website. These data can also be obtained on a monthly and daily basis. However, which datasets are selected should be planned carefully and rationally.

3. Results and Discussion

3.1. Rainfall Runoff Method (Soil Moisture Method)

This one-dimensional, two-compartment (or “bucket”) soil moisture accounting scheme is based on empirical functions that describe evapotranspiration, surface runoff, sub-surface runoff (i.e., interflow), and deep percolation for a watershed unit. This method allows for the characterization of land use and/or soil type impacts on these processes. The deep percolation within the watershed unit can be transmitted to a surface water body as baseflow or directly to groundwater storage if an appropriate link is made between the watershed unit node and a groundwater node.
A watershed unit can be divided into N fractional areas representing different land uses/soil types, and a water balance is computed for each fractional area, j of N. The climate is assumed to be uniform over each sub-catchment, and the water balance is given as follows:
R d j d z 1 , j d t = P e t P E T t k c , j t 5 z 1 , j 2 z 1 , j 2 3 P e t z 1 , j R R F j f j k s , j z 1 , j 2 ( 1 f j ) k s , j z 1 , j 2
where z1,j = [1, 0] is the relative storage given as a fraction of the total effective storage of the root zone, (mm) for land cover fraction, j. The effective precipitation, Pe, includes snowmelt from accumulated snowpacks in the sub-catchment, where mc is the melt coefficient given as follows:
m c = 0 1 T i T s T l T s   i f   T i < T s T i > T l T s T i T l
where Ti is the observed temperature for month i, and Tl and Ts are the melting and freezing temperature thresholds, respectively. Snow accumulation, Aci, is a function of mc and the observed monthly total precipitation, Pi, given by the following relation:
A c i = A c i 1 + ( 1 m c ) P i
with the melt rate, mr, defined as follows:
m r = A c i m c
The effective precipitation, Pe, is then computed as follows:
P e = P i m c + m r
If the timestep length is less than one month, then the snow accumulation and melt model is modified to restrict the snow melt rate by the total heat available to transform ice to water. The total heat available is calculated as the sum of the net solar radiation and the heat introduced to the snowpack by rainfall. Albedo is computed for the net solar radiation calculation as a broken linear function of snow accumulation and timestep length, ranging in value from Albedo Lower Bound to Albedo Upper Bound, according to the table below. In this way, a monthly model needs a much deeper snowpack to hit the upper bound, which accounts for snow getting older or melting during the month. For example, in a monthly model, NumDays = 30 (+/−), so the values in the first column below are 0 mm, 30 mm, 150 mm, and 300 mm. If the depth of snow at the beginning of January was 60 mm, the Albedo would be 0.19. Any snow depth over the last value is equal to the Albedo Upper Bound. The user is able to change what the Albedo Lower Bound and Albedo Upper Bound are, but if left blank they will default to 0.15 and 0.25.
In Equation (1), the calculation for the potential evapotranspiration, PET, adopts the Penman–Monteith equation modified for a standardized crop of grass that is 0.12 m in height with a surface resistance of 69 s/m. In this implementation, two modifications to the equation were made: the Albedo varies over a range of 0.15 to 0.25 as a function of snow cover (although the user can override this calculation and specify the Albedo directly), and the soil heat flux term, G, is ignored.
Continuing with Equation (1), the kc,j is the crop/plant coefficient for each fractional land cover. The third term represents the surface runoff, where RRFj is the Runoff Resistance Factor of the land cover. Higher values of RRFj lead to less surface runoff. The fourth and fifth terms are the interflow and deep percolation terms, respectively, where the parameter ks,j is an estimate of the root zone saturated conductivity (mm/time) and fj is a partitioning coefficient related to soil, land cover type, and topography that fractionally partitions water both horizontally and vertically. Thus, the total surface and interflow runoff, RT, from each sub-catchment at time t is
R T t = j = 1 N A j P e ( t ) z 1 , j R R F j + f j k s , j z 1 , j 2
For applications where no return flow link is created from a catchment to a groundwater node, the baseflow emanating from the second bucket will be computed as follows:
S m a x d z 2 d t = j = 1 N ( 1 f j ) k s , j z 1 , j 2 k s 2 z 2 2
where the inflow to this storage, Smax, is the deep percolation from the upper storage given in Equation (1), and Ks2 is the saturated conductivity of the lower storage (mm/time), which is given as a single value for the catchment and therefore does not include a subscript, j. Equations (1) and (7) are solved using a predictor–corrector algorithm.
When an alluvial aquifer is introduced into the model and a runoff/infiltration link is established between the watershed unit and the groundwater node, the second storage term in Equation (7) is ignored, and the recharge R (volume/time) to the aquifer is
R = j = 1 N A j ( 1 f j ) k s , j z 1 , j 2
where A is the watershed unit’s contributing area. The stylized aquifer characterizes the height of the water table relative to the stream, where individual river segments can either gain or lose water to the aquifer.

3.2. Soloz Basin Water Budget and Calibration Values

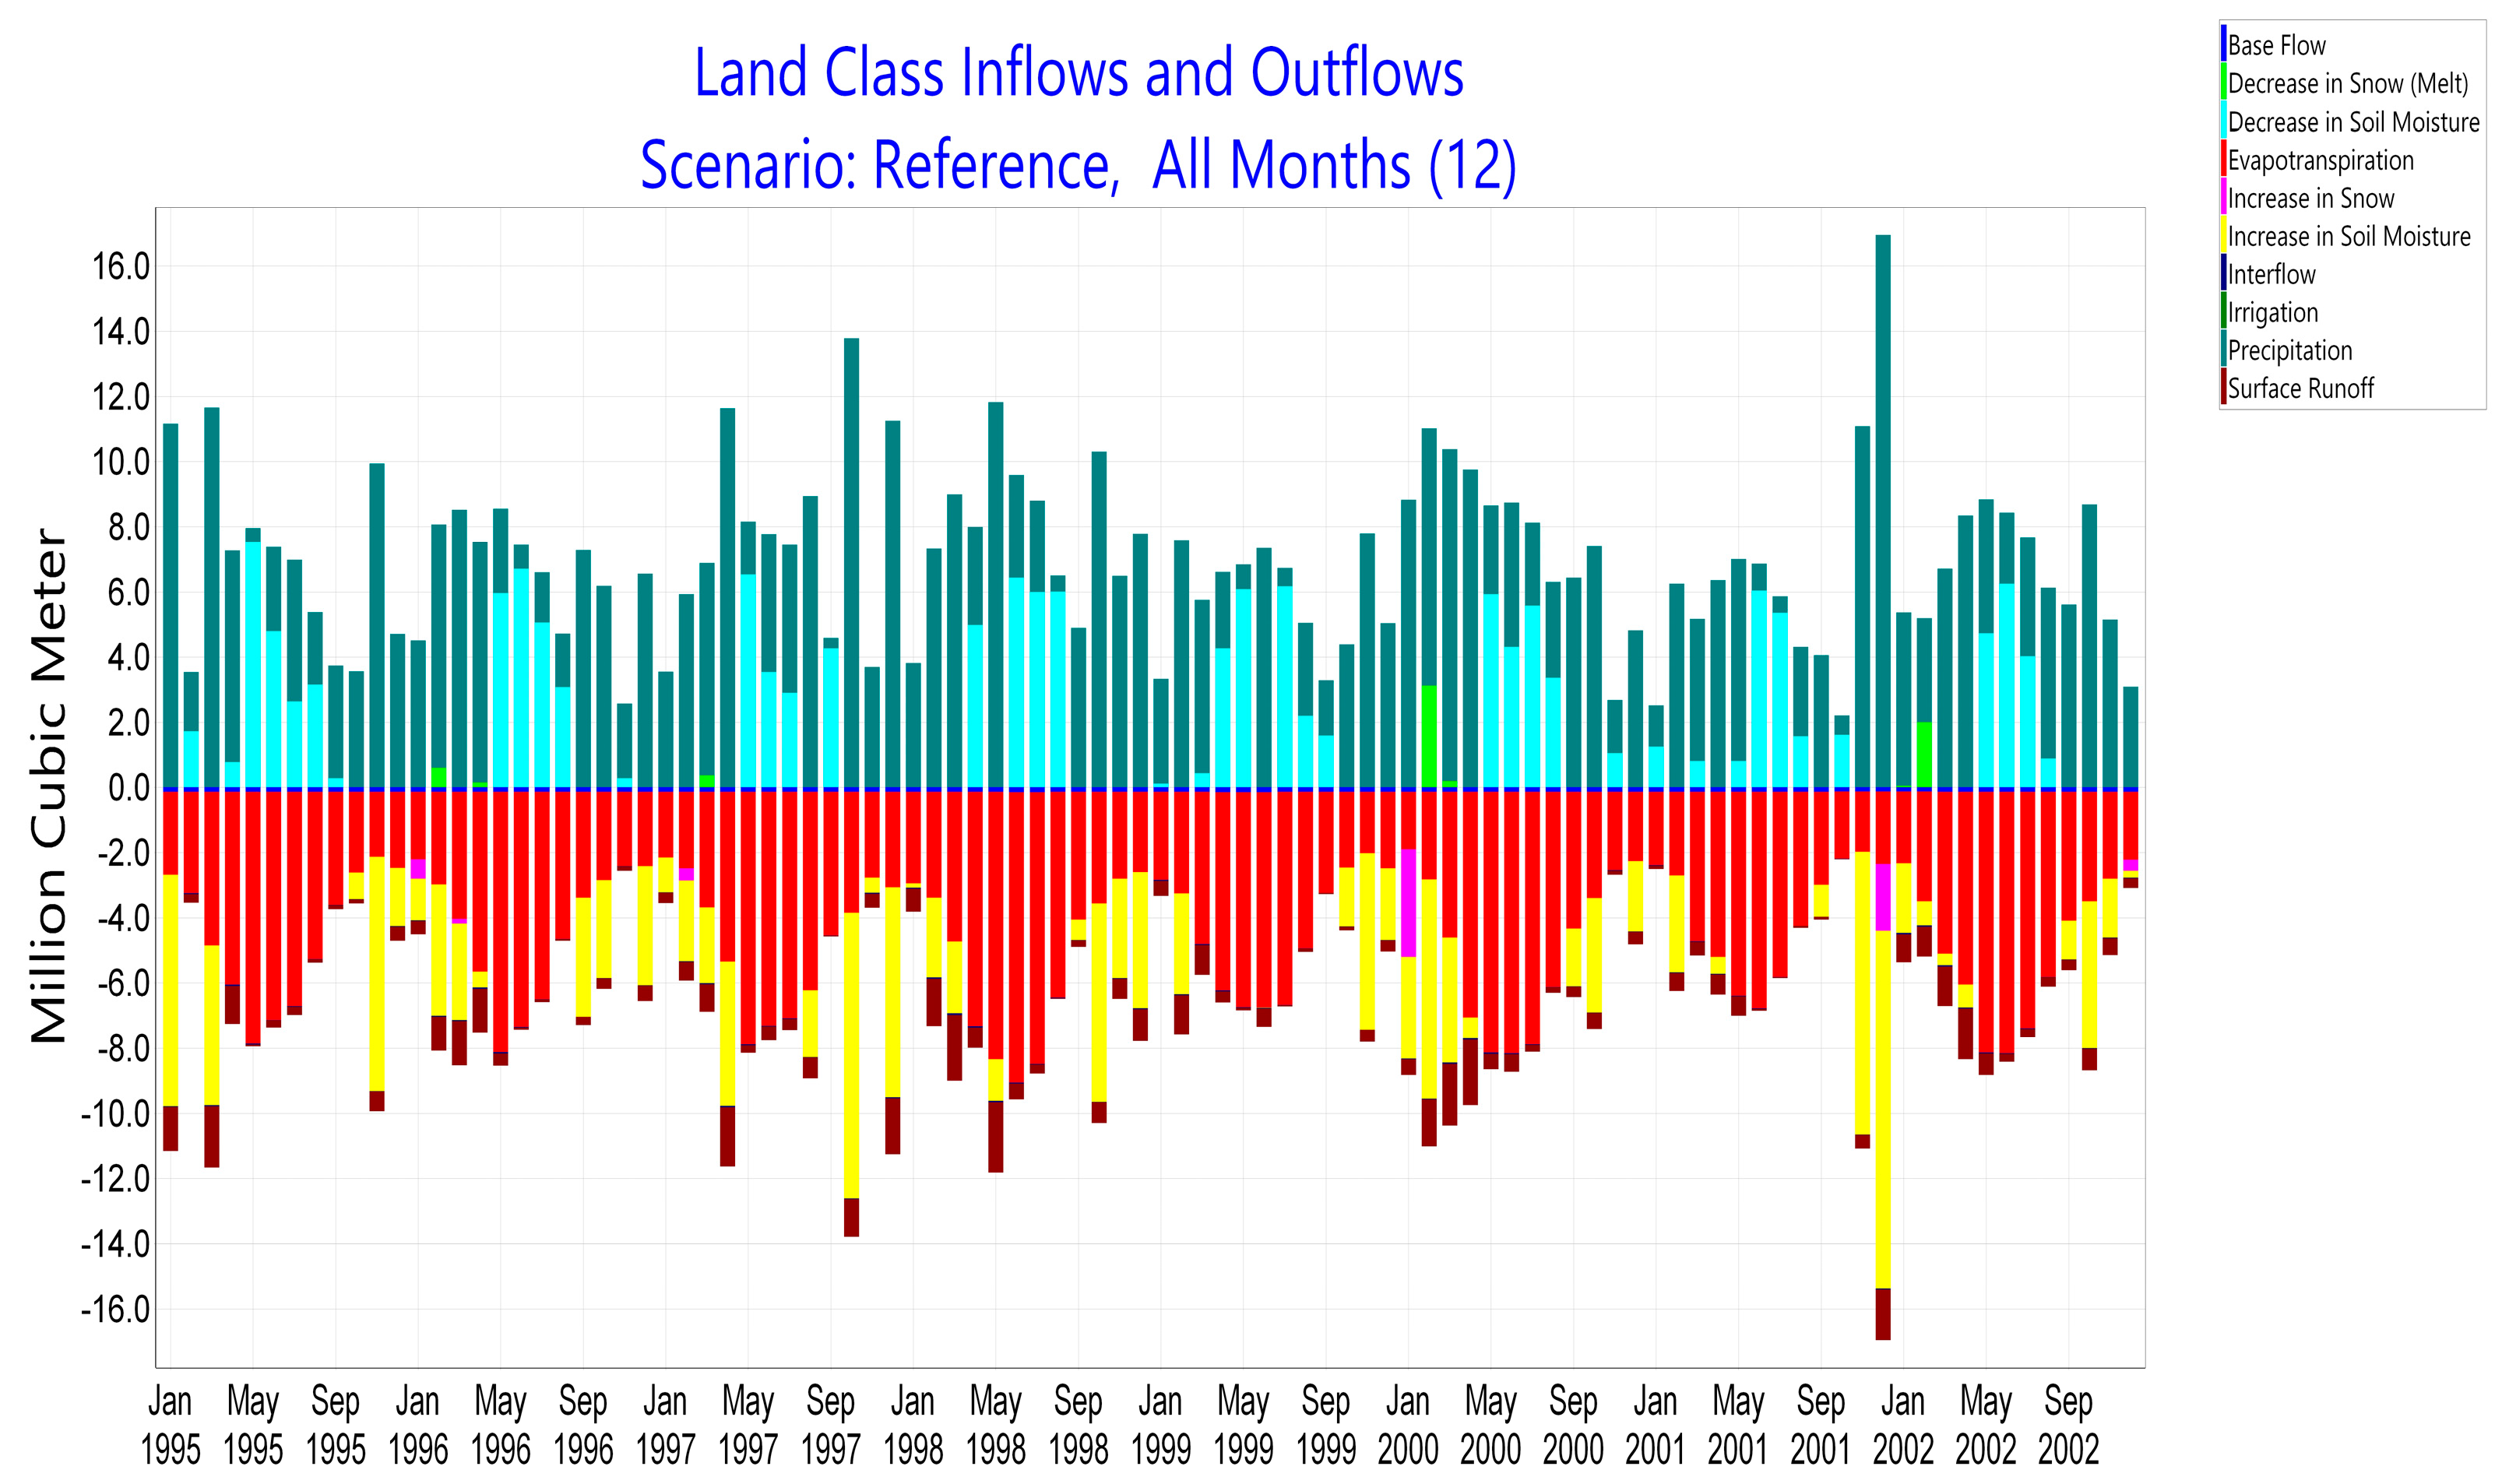
For the Solöz Basin, the basin water budget was calculated between 1995 and 2002. The aim of this study was to test the accuracy of the model results with calibration results from streams without source measurements in the Lake Iznik basin. Since the DSI source measurements in Soloz Stream were made between 1995 and 2002, the model results were prepared according to the data between these dates to verify the model results. The obtained water budget varies according to the years. However, it is seen that it shows a reasonable and logical distribution for many parameters such as precipitation, evaporation, and decrease in soil moisture, as shown in Figure 2. The inflows to the basin consist of precipitation, decrease in soil moisture, decrease in snow melt, and increase in snow, increase in soil moisture, evaporation, surface runoff, and intermediate flows, which can also be expressed as outflows from the basin, as seen as minus at the bottom of the graph. The detailed water budget components created for the Soloz Basin and the total water budget change over the years are as shown in Table 1.
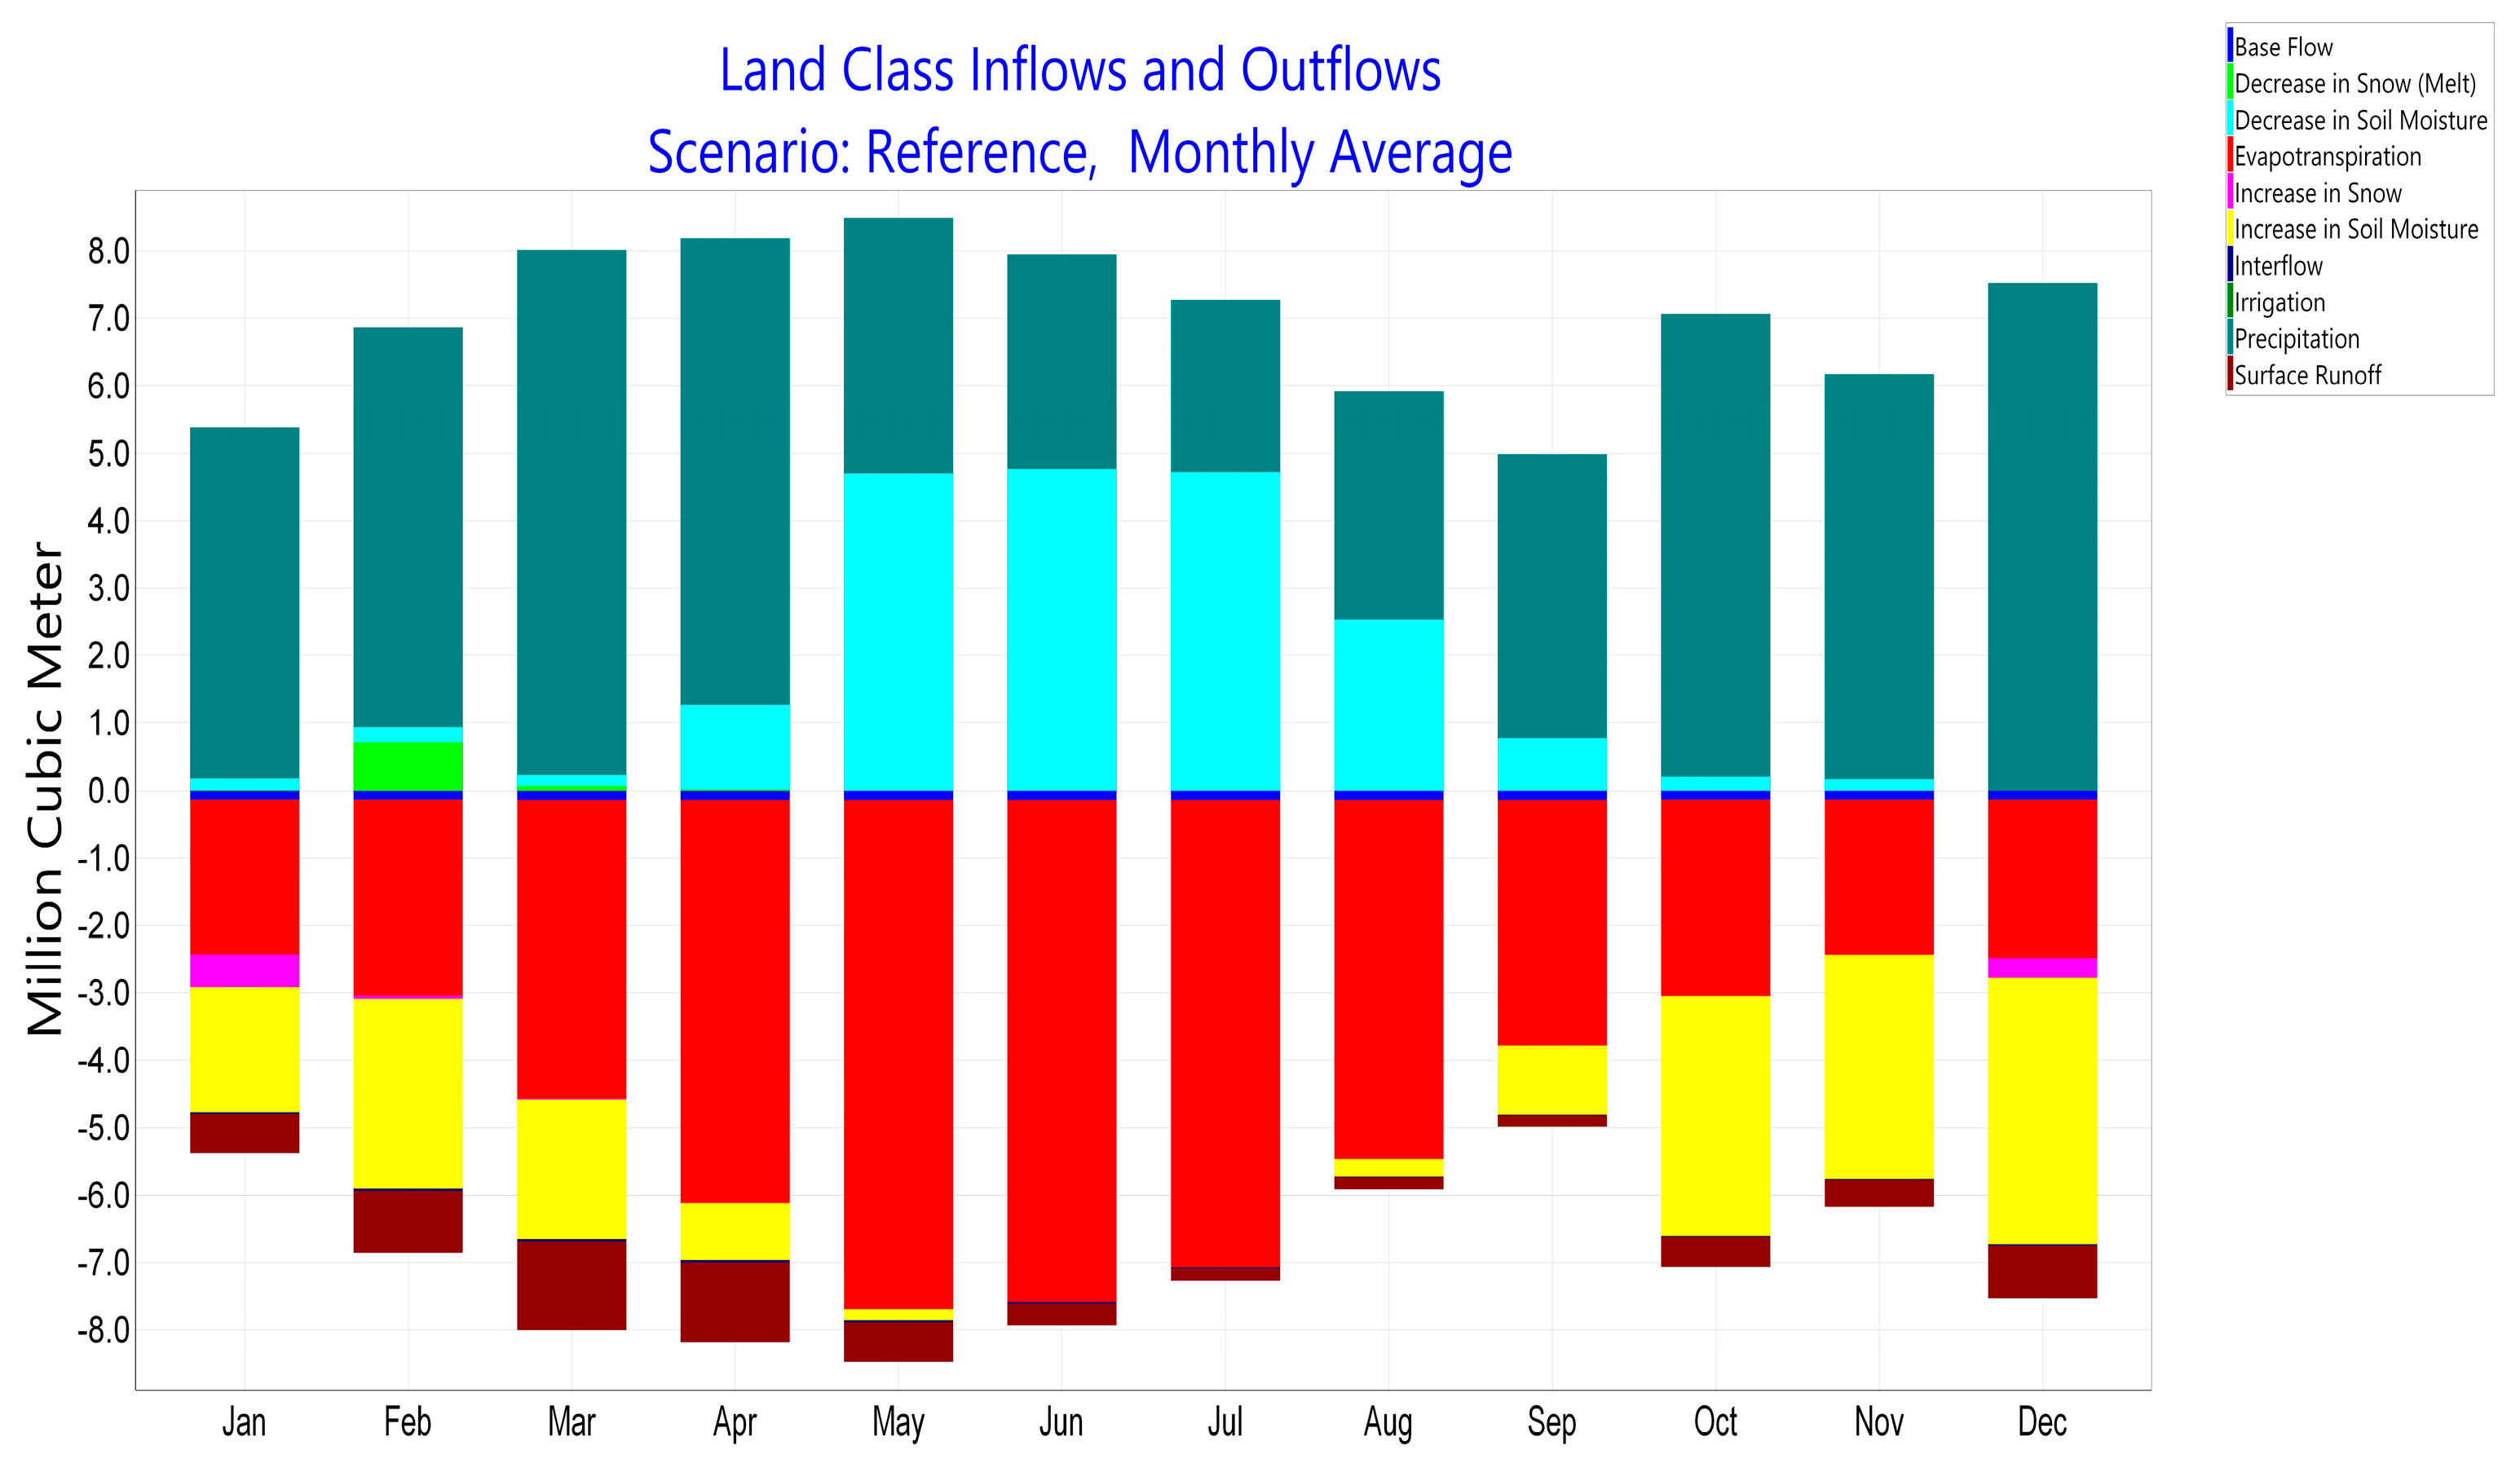
We can see the water budget components numerically in Table 1 and graphically in Figure 2. The values shown below the graphs and expressed as (−) in the tables represent the outflow flows in the river water budget, while those shown as (+) represent the inflow flows. Table 1 shows the water budget by year. We see that the water budget in Soloz Stream, which is a continuous flow stream, was at a − value in 1997. This situation gives us the idea that there was an interaction with the groundwater and that it fed the groundwater. The changes in the annual average values of the water budget components in Soloz Basin according to time are given in Figure 3 below.
The variations in the monthly average values of the water budget components in Soloz Basin with respect to time are given in Figure 2 below. As expected, it is observed that there was an increase in the amount of decrease in soil moisture in the summer months, an increase in snowmelt in February and March, and precipitation reached its lowest level in August and September. The results obtained from the graph show that evaporation in the lower part of the graph reaches its maximum level in May, June, and July; soil moisture and surface runoff are at minimum levels in August, September, and October; and the increase in snowmelt reaches its maximum level in January and February. The average values of the water budget components between 1995 and 2002, annually, are as follows: base flow 1,657,712 m3; decrease in snow (melt) 808,190 m3; decrease in soil moisture 19,631,862 m3; evapotranspiration 54,077,500 m3; increase in snow 850,514 m3; increase in soil moisture 19,863,125 m3; interflow 282,406 m3; precipitation 63,351,577 m3; surface runoff 7,052,375 m3 (Figure 2 and Figure 3 and Table 2).
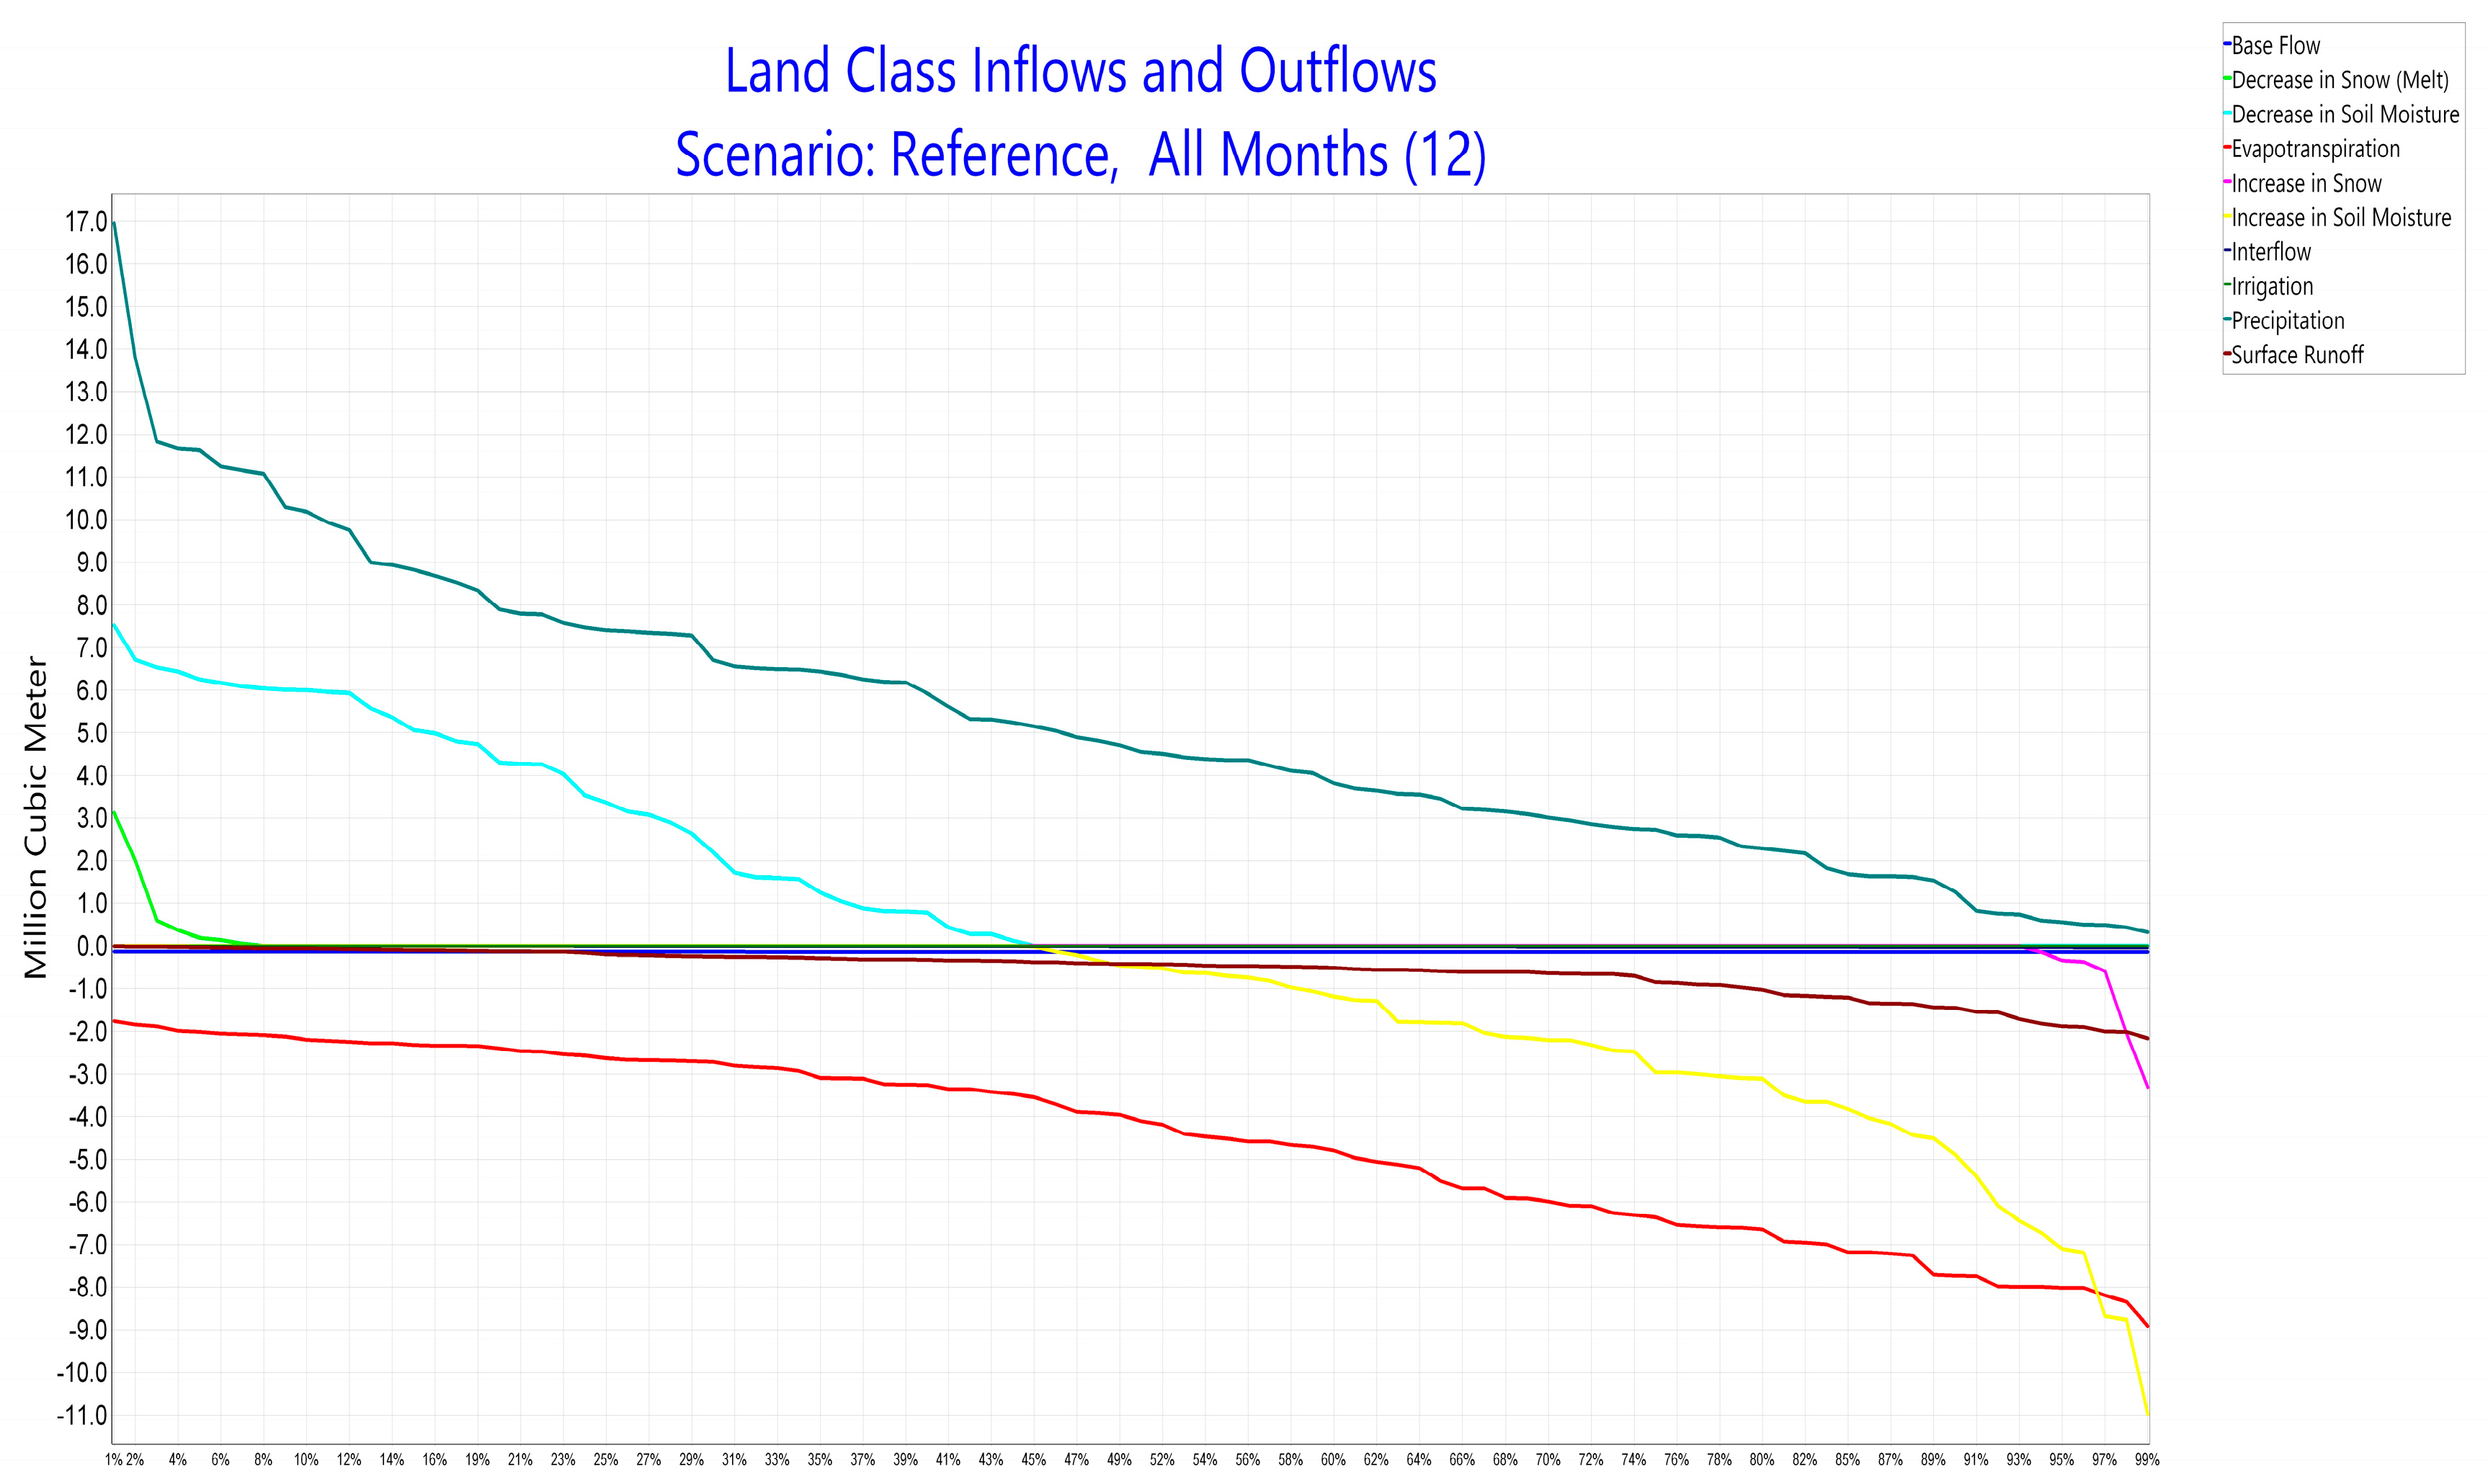
The flow continuity curve gives us information about the instantaneous flow in Soloz Creek. Accordingly, the amount of precipitation 90% of the time was 1,263,536 m3; decrease in soil moisture 0; decrease in snow melt, 0; increase in snow, 0; surface runoff 142,621 m3; increase in soil moisture 4,899,010 m3; evaporation 7,737,900 m3; intermediate flows 41,940.4 m3; and surface runoff 1,449,120 m3.
The flow continuity curve and the change in water budget components is seen in Figure 4, denoting the output currents and the other input currents.
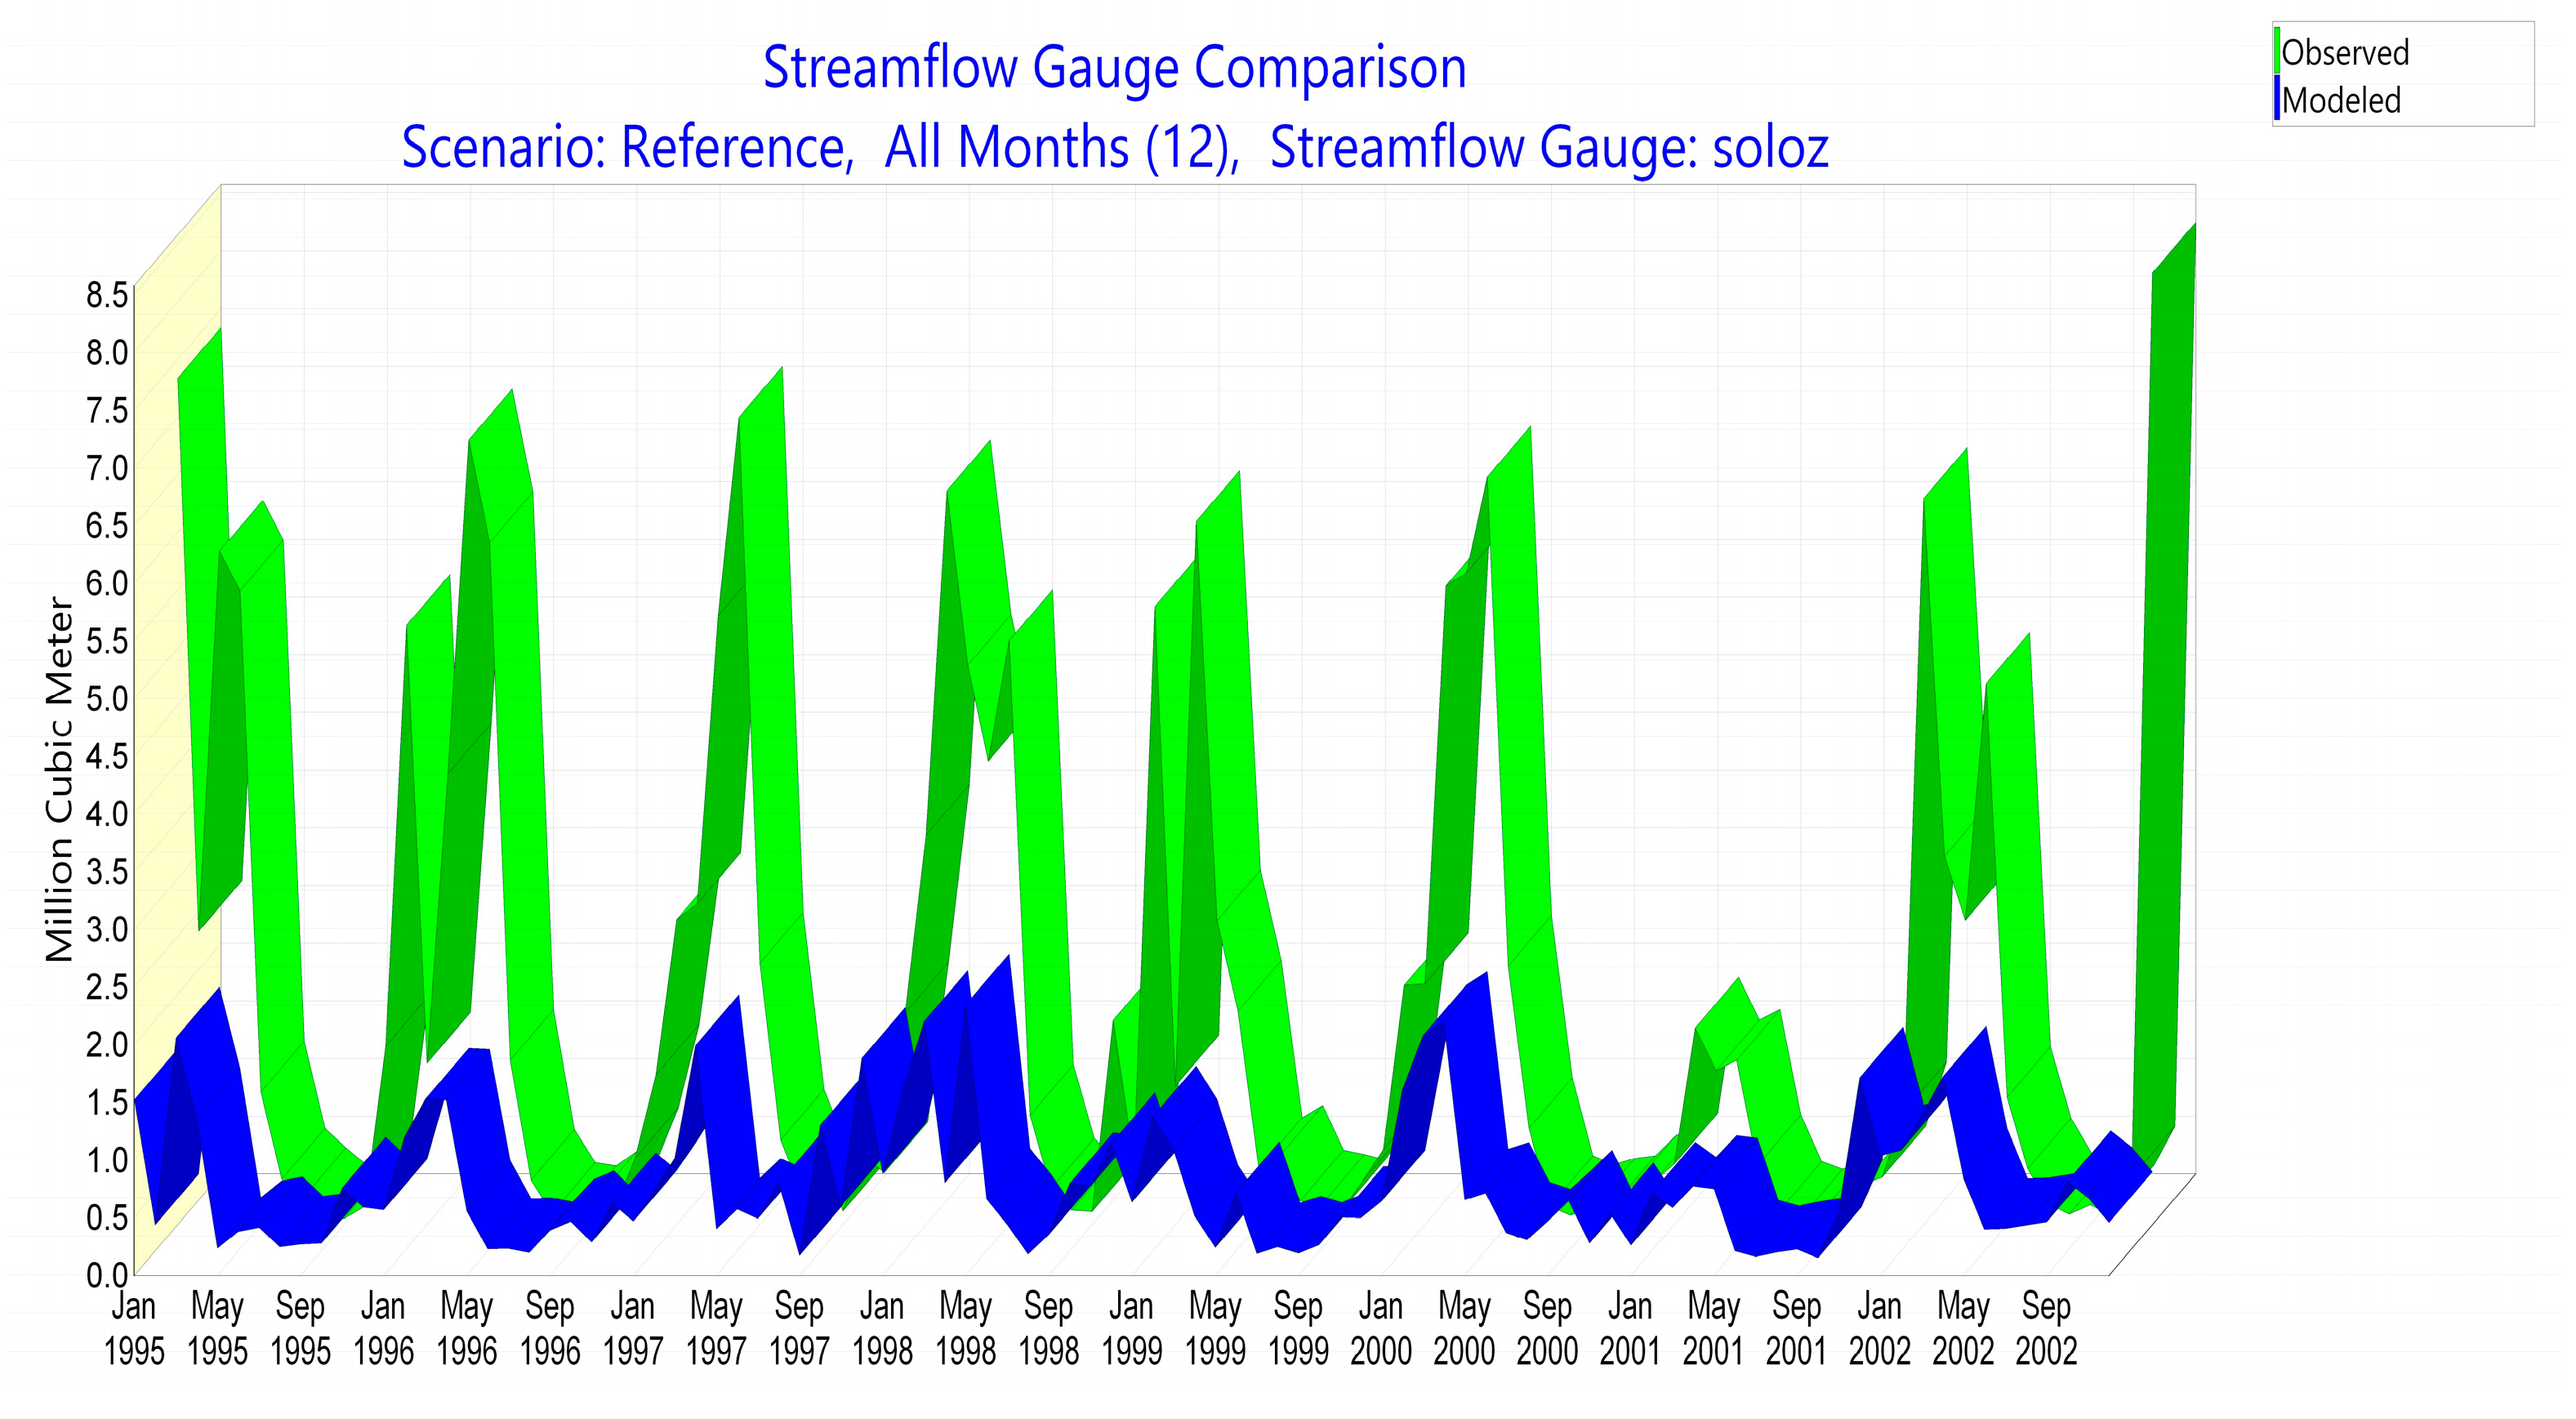
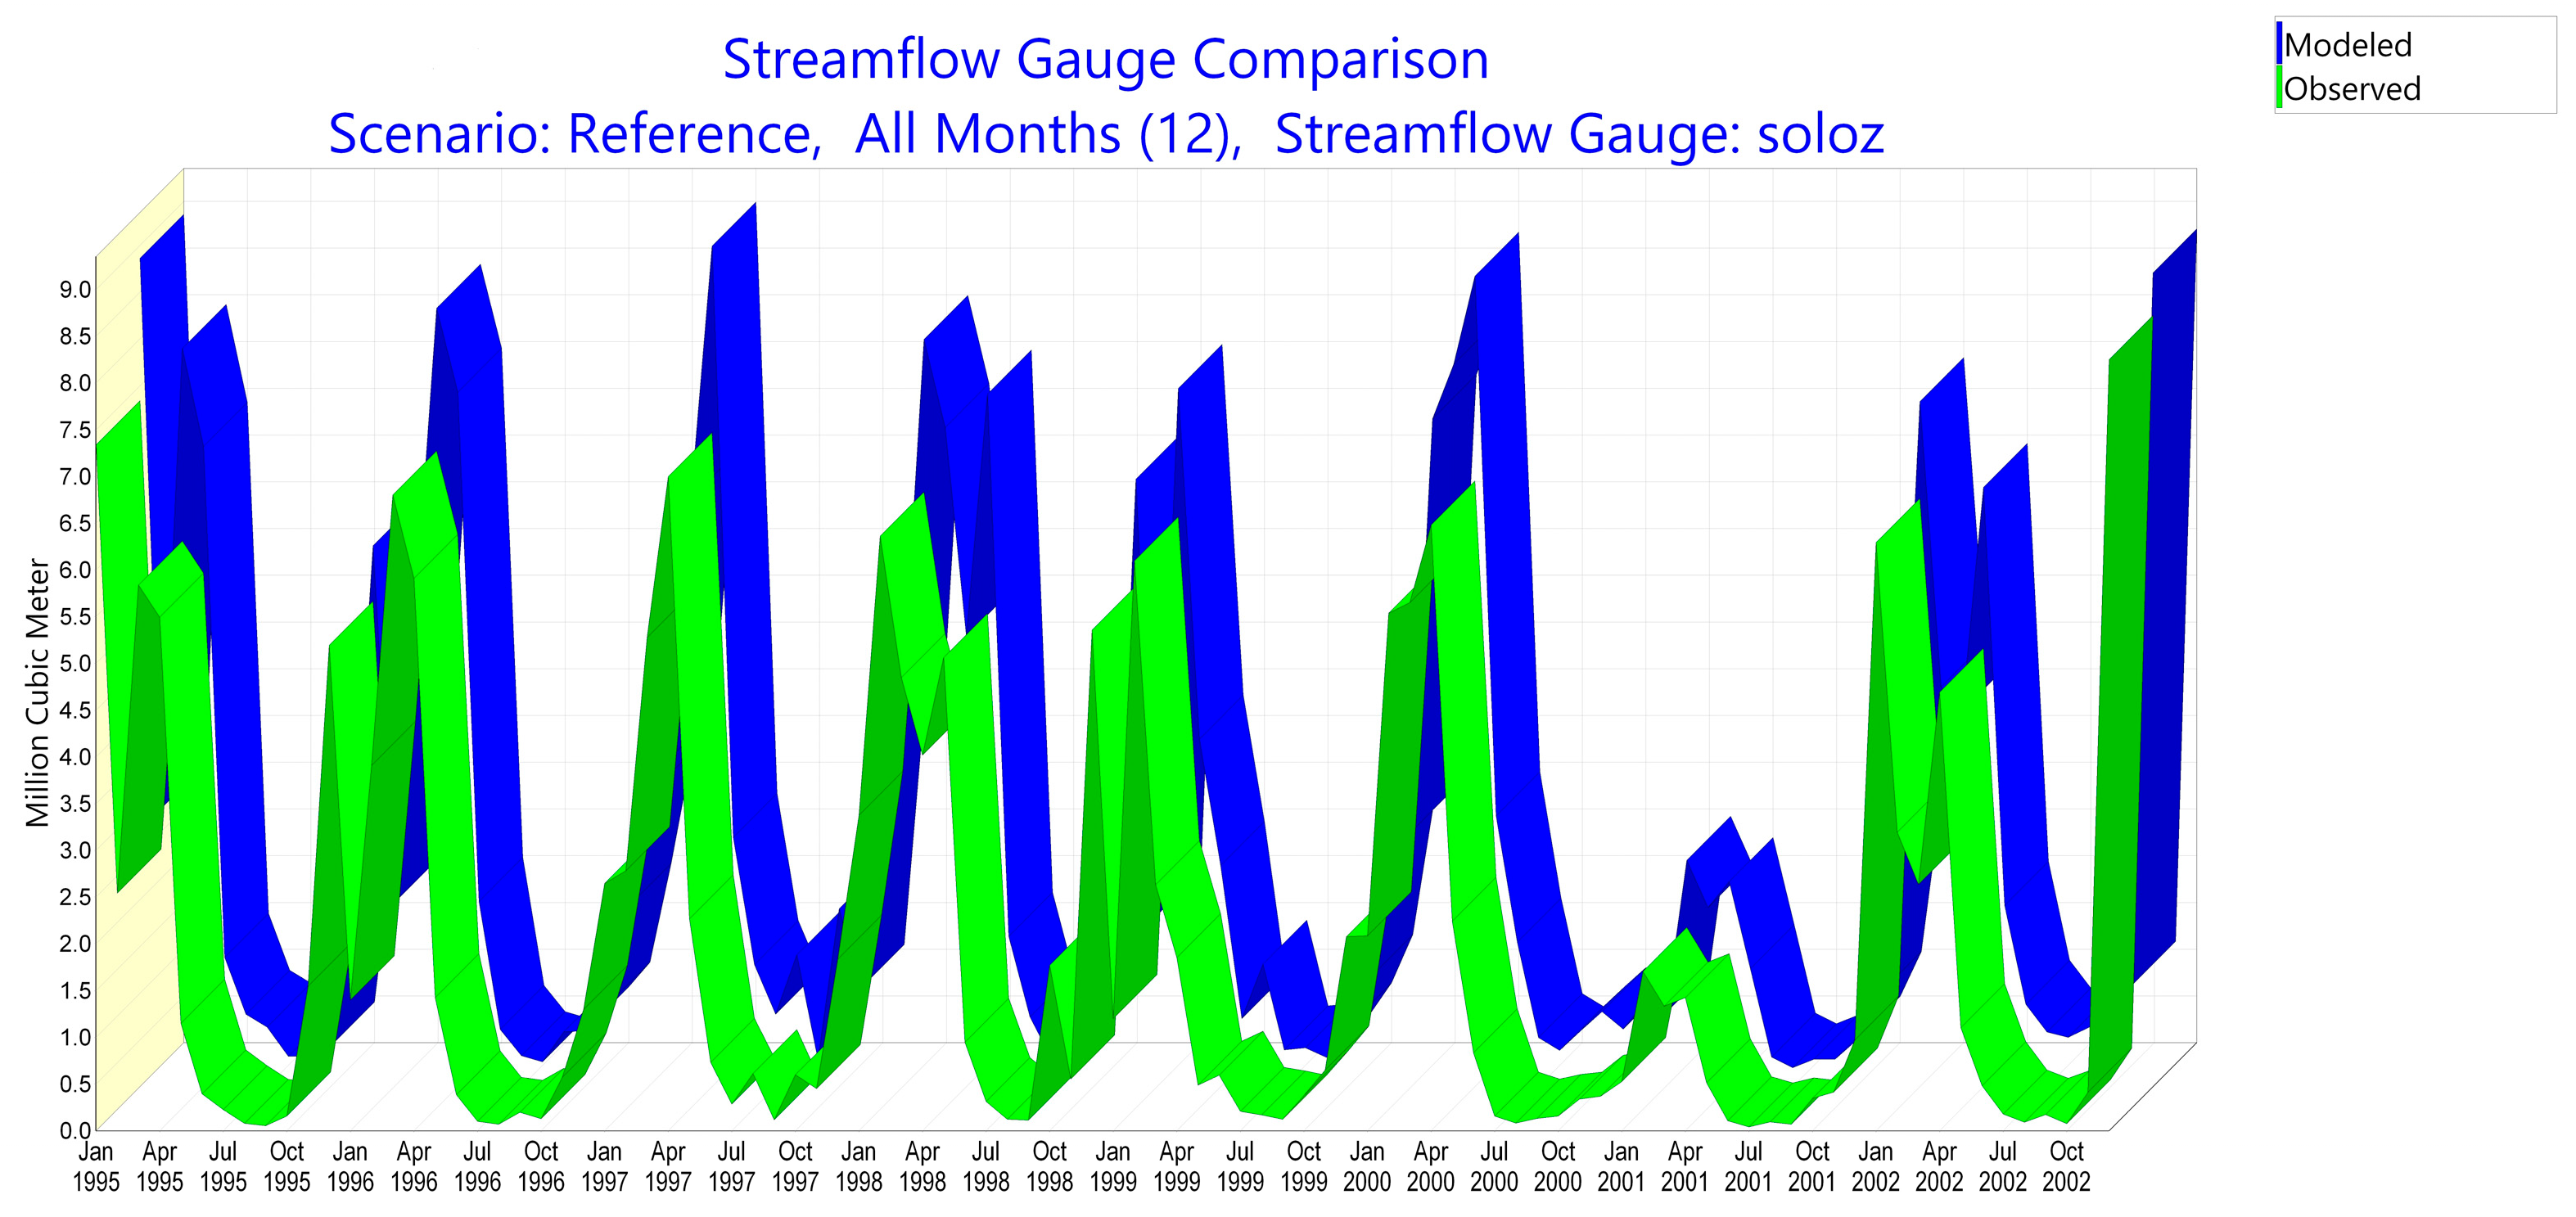
The graphs in Figure 5 and Figure 6 show the modeled and observed flow results between 1995 and 2002. These graphs were created by obtaining flow values from the precipitation values. The current observation results are shown in blue, obtained as a result of the measurement taken from DSİ. The flow results shown in green are the model results obtained with the climate data from Princeton University. While the graph is expected to show a similar or even close distribution, it is observed that the flow amounts calculated only with climate data are quite low compared to the observed flow results. Statistical analysis was also performed during the calibration phase.
The performance of the model was assessed not only by visual inspection of the match between simulated and observed hydrographs but also by evaluating model performance using Nash–Sutcliffe efficiency (NSE), coefficient of determination (R2), and Normalized Root Mean Square Error NRMSE (%). NRMSE measures the accuracy of a prediction model by comparing predicted values to observed values, normalized to the range, mean, or standard deviation of the observed data. NSE is a popular performance indicator that measures the relative magnitude of the residual variance of the simulated flow compared to the observed flow. It shows how well a model of the simulated hydrograph fits a model of the observed hydrograph. The coefficient of determination (R2) is a measure of the fraction of the variation in the observed streamflow data that is repeated in the simulated streamflow data [19].
The graph below shows the modeled and observed flow results between 1995 and 2002 by adding rainfall values, flow values, and spring flows. While NSE 0.028; R2 0.56; NRMSE 114% in the model calibration results without the inclusion of source streams (Table 3 and Figure 5), the model calibration results with the inclusion of source streams gave very good results of NSE 0.83; R2 0.98; NRMSE 48%. It is observed that the graph shows a similar distribution. Statistical analysis was also performed during the calibration phase (Table 4 and Figure 6).
As a result of the statistical evaluation, it was observed that reasonable results were obtained. It was determined that parameters such as NSE, R2, NRMSE remained within reasonable ranges.

4. Conclusions

With WEAP, Soloz Stream was tested using calibration results for the determination of flow quantification in non-flowing streams in the Lake Iznik Basin. In this stream, DSI flow observation results are available for between 1995 and 2002. The flow results obtained from the climate data and the model results generated with the climate data from Princeton University and DSİ source measurements were comparatively analyzed. Studies on the hydrology aspect of the model are limited in the literature, and this study contributes to the literature with a hydrological evaluation.
While preparing this study with the WEAP model, the Iznik Basin was firstly evaluated as a whole, and then it was divided into sub-basins and the amount of flow at the point where each sub-basin connects to Lake Iznik was extracted. However, since there were no flow observation results in each sub-basin created at this point, we wanted to investigate whether the total flow amount at the junction of the stream and the lake could be determined from the amount of precipitation only. The results of regular flow observations in Solöz Stream made by DSİ were obtained for between 1995 and 2002. If we could have obtained data for a longer time interval, we would have wished to work on it, but the most regular flow observation results among the sub-basins were the measurements made on Solöz Stream between these dates. By looking at the calibration results, we aimed to decide how to model the net flow amount at the point where Solöz Stream joins Lake Iznik with the results of this study and to determine to what extent the results from modeling with the flow amount obtained from precipitation in streams without flow observation results would be accurate, or whether we could even obtain accurate results. When we evaluated the calibration results obtained and concluded that the flow observation results obtained from precipitation with the WEAP model in the Lake Iznik basin constitute a limitation in modeling the Lake Basin, much better calibration results were obtained with the addition of spring flow to the model; therefore, it was concluded that spring flows should be taken into account when determining the net flow amount from the sub-basin in streams without flow observation results available, and that different methods should be investigated.
If we look at the Solöz annual water budget, it is seen that it has values ranging from −9431.27 m3 to 17,790.4 m3. It is normal for the water budget to take positive values in a continuously flowing stream, but there was an idea to link the (−) value to the relationship of the river with the groundwater. Moreover, in this case, i.e., when it takes (−) values, the idea that the river feeds the groundwater was developed.
When looking at the inflow and outflow flows of the model area class, it was observed that the graph shows a uniform distribution, and the inflow flows to the river water budget are located in the upper part of the graph, while the outflow flows are located in the lower part of the graph and are (−). According to the flow continuity curve, the inlet and outlet flows were analyzed separately 90% of the time.
In the calibration results, good results were obtained, with NSE = 0.83; R2 = 0.98; NRMSE = % 48. These calibration results were obtained by evaluating the source currents and climate data together.
In this context, the total annual water budget together with the water budget components were extracted, and an estimation was made with the model results for the main flow in the stream from the flow continuity curve. In addition, the calibration phase was examined to answer the question “Are the model results compatible with the observed results?”. Thus, the performance of the model was examined in a stream with a certain flow rate, and a road map for the application in streams with uncertain flow rates was determined. In addition, the working mechanism and performance of the model were evaluated. When looking at the literature within the scope of the results obtained, we find that Cebe and Inan [29], in their study, found the amount of surface runoff cannot be calculated based on precipitation alone; measuring the source is necessary for accurate estimation. In addition to precipitation data, they concluded that measuring the water source is very important to accurately calculating the surface runoff.
Paudel and Benjenkar [30], in their study, found that surface runoff can be calculated from rainfall. They found that the inclusion of source measurements increases the accuracy of runoff calculations.
Pasculli et al. [31] found that surface runoff can be calculated from rainfall and spring measurements, and that the inclusion of spring measurements improves the accuracy of surface runoff calculations. Therefore, measuring the water source in addition to rainfall data is crucial to accurately calculating runoff.
The results of this study are in agreement with the aforementioned studies found in the literature. The findings from this modeling study with WEAP indicate that model results and observed results are in agreement based on statistical calibration parameters. However, the observed concordant results include source measurements, so the flow results obtained from precipitation alone do not give sufficiently concordant findings, and it is observed that the model gives reasonable results when climate and source flows are modeled together.

Author Contributions

Conceptualization, B.S.G. and F.K.; methodology, B.S.G. and F.K.; software, B.S.G.; validation, B.S.G. and F.K.; formal analysis, B.S.G. and F.K.; investigation, B.S.G. and F.K.; data curation, B.S.G. and F.K.; writing—first draft preparation, B.S.G. and F.K.; writing the last version, review, editing and visualization, B.S.G. and F.K.; supervision, B.S.G. and F.K. All authors have read and agreed to the published version of the manuscript.

Funding

This research was funded by Bursa Uludag University Scientific Research Projects within the scope of General Research Project with the project titled “DETERMINATION OF IZNIK LAKE WATER BALANCE AND SUSTAINABILITY WITH WEAP MODEL”. Funding number: FGA-2025-1987.

Data Availability Statement

The original contributions presented in this study are included in the article. Further inquiries can be directed to the corresponding author.

Conflicts of Interest

The authors declare no conflicts of interest.

References

  1. Chen, T.; Song, C.; Ke, L.; Wang, J.; Liu, K.; Wu, Q. Estimating seasonal water budgets in global lakes by using multi-source remote sensing measurements. J. Hydrol. 2021, 593, 125781. [Google Scholar]
  2. Johnston, B.R.; Hiwasaki, L.; Klaver, I.J.; Castillo, A.R.; Strang, V. Water, Cultural Diversity, and Global Environmental Change: Emerging Trends, Sustainable Futures? Springer: Berlin/Heidelberg, Germany, 2011. [Google Scholar]
  3. Wada, Y.; Wisser, D.; Bierkens, M.F. Global modeling of withdrawal, allocation and consumptive use of surface water and groundwater resources. Earth Syst. Dyn. Discuss 2014, 5, 15–40. [Google Scholar]
  4. Zarfl, C.; Lumsdon, A.E.; Berlekamp, J.; Tydecks, L.; Tockner, K. A global boom in hydropower dam construction. Aquat. Sci. 2015, 77, 161–170. [Google Scholar]
  5. Williamson, C.E.; Saros, J.E.; Vincent, W.F.; Smol, J.P. Lakes and reservoirs as sentinels, integrators, and regulators of climate change. Limnol. Oceanogr. 2009, 54, 2273–2282. [Google Scholar]
  6. Zhang, B.; Wu, Y.; Zhu, L.; Wang, J.; Li, J.; Chen, D. Estimation and trend detection of water storage at Nam Co Lake, central Tibetan Plateau. J. Hydrol. 2011, 405, 161–170. [Google Scholar]
  7. Sterling, S.M.; Ducharne, A.; Polcher, J. The impact of global land-cover change on the terrestrial water cycle. Nat. Clim. Change 2013, 3, 385–390. [Google Scholar]
  8. Wang, J.; Song, C.; Reager, J.T.; Yao, F.; Famiglietti, J.S.; Sheng, Y.; MacDonald, G.M.; Brun, F.; Schmied, H.M.; Marston, R.A.; et al. Recent global decline in endorheic basin water storages. Nat. Geosci. 2018, 11, 926–932. [Google Scholar]
  9. Erler, A.R.; Frey, S.K.; Khader, O.; D’Orgeville, M.; Park, Y.; Hwang, H.; Lapen, D.R.; Peltier, W.R.; Sudicky, E.A. Simulating climate change impacts on surface water resources within a lake-affected region using regional climate projections. Water Resour. Res. 2019, 55, 130–155. [Google Scholar]
  10. Cr’etaux, J.-F.; Abarca-Del-Río, R.; Bergé-Nguyen, M.; Arsen, A.; Drolon, V.; Clos, G.; Maisongrande, P. Lake volume monitoring from space. Surv. Geophys. 2016, 37, 269–305. [Google Scholar]
  11. Hirschi, M.; Seneviratne, S.I.; Schär, C. Seasonal variations in terrestrial water storage for major midlatitude river basins. J. Hydrometeorol. 2006, 7, 39–60. [Google Scholar]
  12. Yeh, P.J.F.; Famiglietti, J. Regional terrestrial water storage change and evapotranspiration from terrestrial and atmospheric water balance computations. J. Geophys. Res. Atmos. 2008, 113, D09108. [Google Scholar] [CrossRef]
  13. Sheffield, J.; Ferguson, C.R.; Troy, T.J.; Wood, E.F.; McCabe, M.F. Closing the terrestrial water budget from satellite remote sensing. Geophys. Res. Lett. 2009, 36, L07403. [Google Scholar] [CrossRef]
  14. Pan, M.; Sahoo, A.K.; Troy, T.J.; Vinukollu, R.K.; Sheffield, J.; Wood, E.F. Multisource estimation of long term terrestrial water budget for major global river basins. J. Clim. 2012, 25, 3191–3206. [Google Scholar] [CrossRef]
  15. Hamlington, B.; Reager, J.; Chandanpurkar, H.; Kim, K.Y. Amplitude modulation of seasonal variability in terrestrial water storage. Geophys. Res. Lett. 2019, 46, 4404–4412. [Google Scholar] [CrossRef]
  16. Borja, S.; Kalantari, Z.; Destouni, G. Global Wetting by Seasonal Surface Water Over the Last Decades. Earth’s Future 2020, 8, e2019EF001449. [Google Scholar] [CrossRef]
  17. Duan, Z.; Bastiaanssen, W. Estimating water volume variations in lakes and reservoirs from four operational satellite altimetry databases and satellite imagery data. Remote Sens. Environ. 2013, 134, 403–416. [Google Scholar] [CrossRef]
  18. Selek, Z.; Aslan, C. Utilization of WEAP Model in Integrated Water Resources Management: The Case of Lake Burdur Basin. Gazi J. Eng. Sci. 2019, 5, 54–64. [Google Scholar]
  19. Goshime, D.W.; Haile, A.T.; Rientjes, T.; Absi, R.; Ledesert, B.; Siegfried, T. Implications of Water Abstraction on the Interconnected Central Rift Valley Lakes sub-basin of Ethiopia Using WEAP. J. Hydrol. Reg. Stud. 2021, 38, 100969. [Google Scholar] [CrossRef]
  20. Weap. Available online: https://www.weap21.org (accessed on 25 August 2024).
  21. Alemayehu, T.; McCartney, M.; Kebede, S. Modelling to evaluate the water resource implications of planned infrastructure development in the Lake Tana subbasin, Ethiopia. Ecohydrol. Hydrobiol. 2010, 10, 211–221. [Google Scholar]
  22. Adgolign, T.B.; Srinivasa-Rao, G.V.R.; Abbulu, Y. WEAP modelling of surface water resources allocation in Didessa sub-basin, West Ethiopia. Sustain. Water Resour. Manag. 2015, 2, 55–70. [Google Scholar] [CrossRef]
  23. Gedefaw, M.; Hao, W.; Denghua, Y.; Qin, T.; Wang, K.; Girma, A.; Batsuren, D.; Abiyu, A. Water resources allocation systems under irrigation expansion and climate change scenario in Awash River Basin of Ethiopia. Water 2019, 11, 1966. [Google Scholar] [CrossRef]
  24. McCartney, M.P.; Girma, M.M. Evaluating the downstream implications of planned water resource development in the Ethiopian portion of the Blue Nile River. Water Int. 2012, 37, 362–379. [Google Scholar] [CrossRef]
  25. Arranz, R.; McCartney, M. Application of the Water Evaluation and Planning (WEAP) Model to Assess Future Water Demands and Resources in the Olifants Catchment, South Africa; IWMI Working Paper 116; IWMI: Colombo, Sri Lanka, 2007. [Google Scholar]
  26. Mounir, Z.M.; Ma, C.M.; Amadou, I. Application of water evaluation and planning (WEAP): A model to assess future water demands in the Niger River (In Niger Republic). Mod. Appl. Sci. 2011, 5, 38–49. [Google Scholar] [CrossRef]
  27. Hassan, D.; Rais, M.N.; Ahmed, W.; Bano, R.; Burian, S.J.; Ijaz, M.W.; Bhatti, F.A. Future water demand modeling using water evaluation and planning: A case study of the Indus Basin in Pakistan. Water Resour. Manag. 2019, 5, 637–643. [Google Scholar] [CrossRef]
  28. Meşeli, A. Environmental Problems in Iznik Lake Basin. J. Dicle Univ. Ziya Gökalp Fac. Educ. 2010, 14, 134–148. [Google Scholar]
  29. Cebe, K.; Inan, A. Estimation of Runoff into Havran Dam Lake with SWMM. Eur. J. Sci. Technol. 2020, 152–160. [Google Scholar] [CrossRef]
  30. Paudel, S.; Benjankar, R. Integrated Hydrological Modeling to Analyze the Effects of Precipitation on Surface Water and Groundwater Hydrologic Processes in a Small Watershed. Hydrology 2022, 9, 37. [Google Scholar] [CrossRef]
  31. Pasculli, A.; Longo, R.; Sciarra, N.; Di Nucci, C. Surface Water Flow Balance of a River Basin Using a Shallow Water Approach and GPU Parallel Computing—Pescara River (Italy) as Test Case. Water 2022, 14, 234. [Google Scholar] [CrossRef]
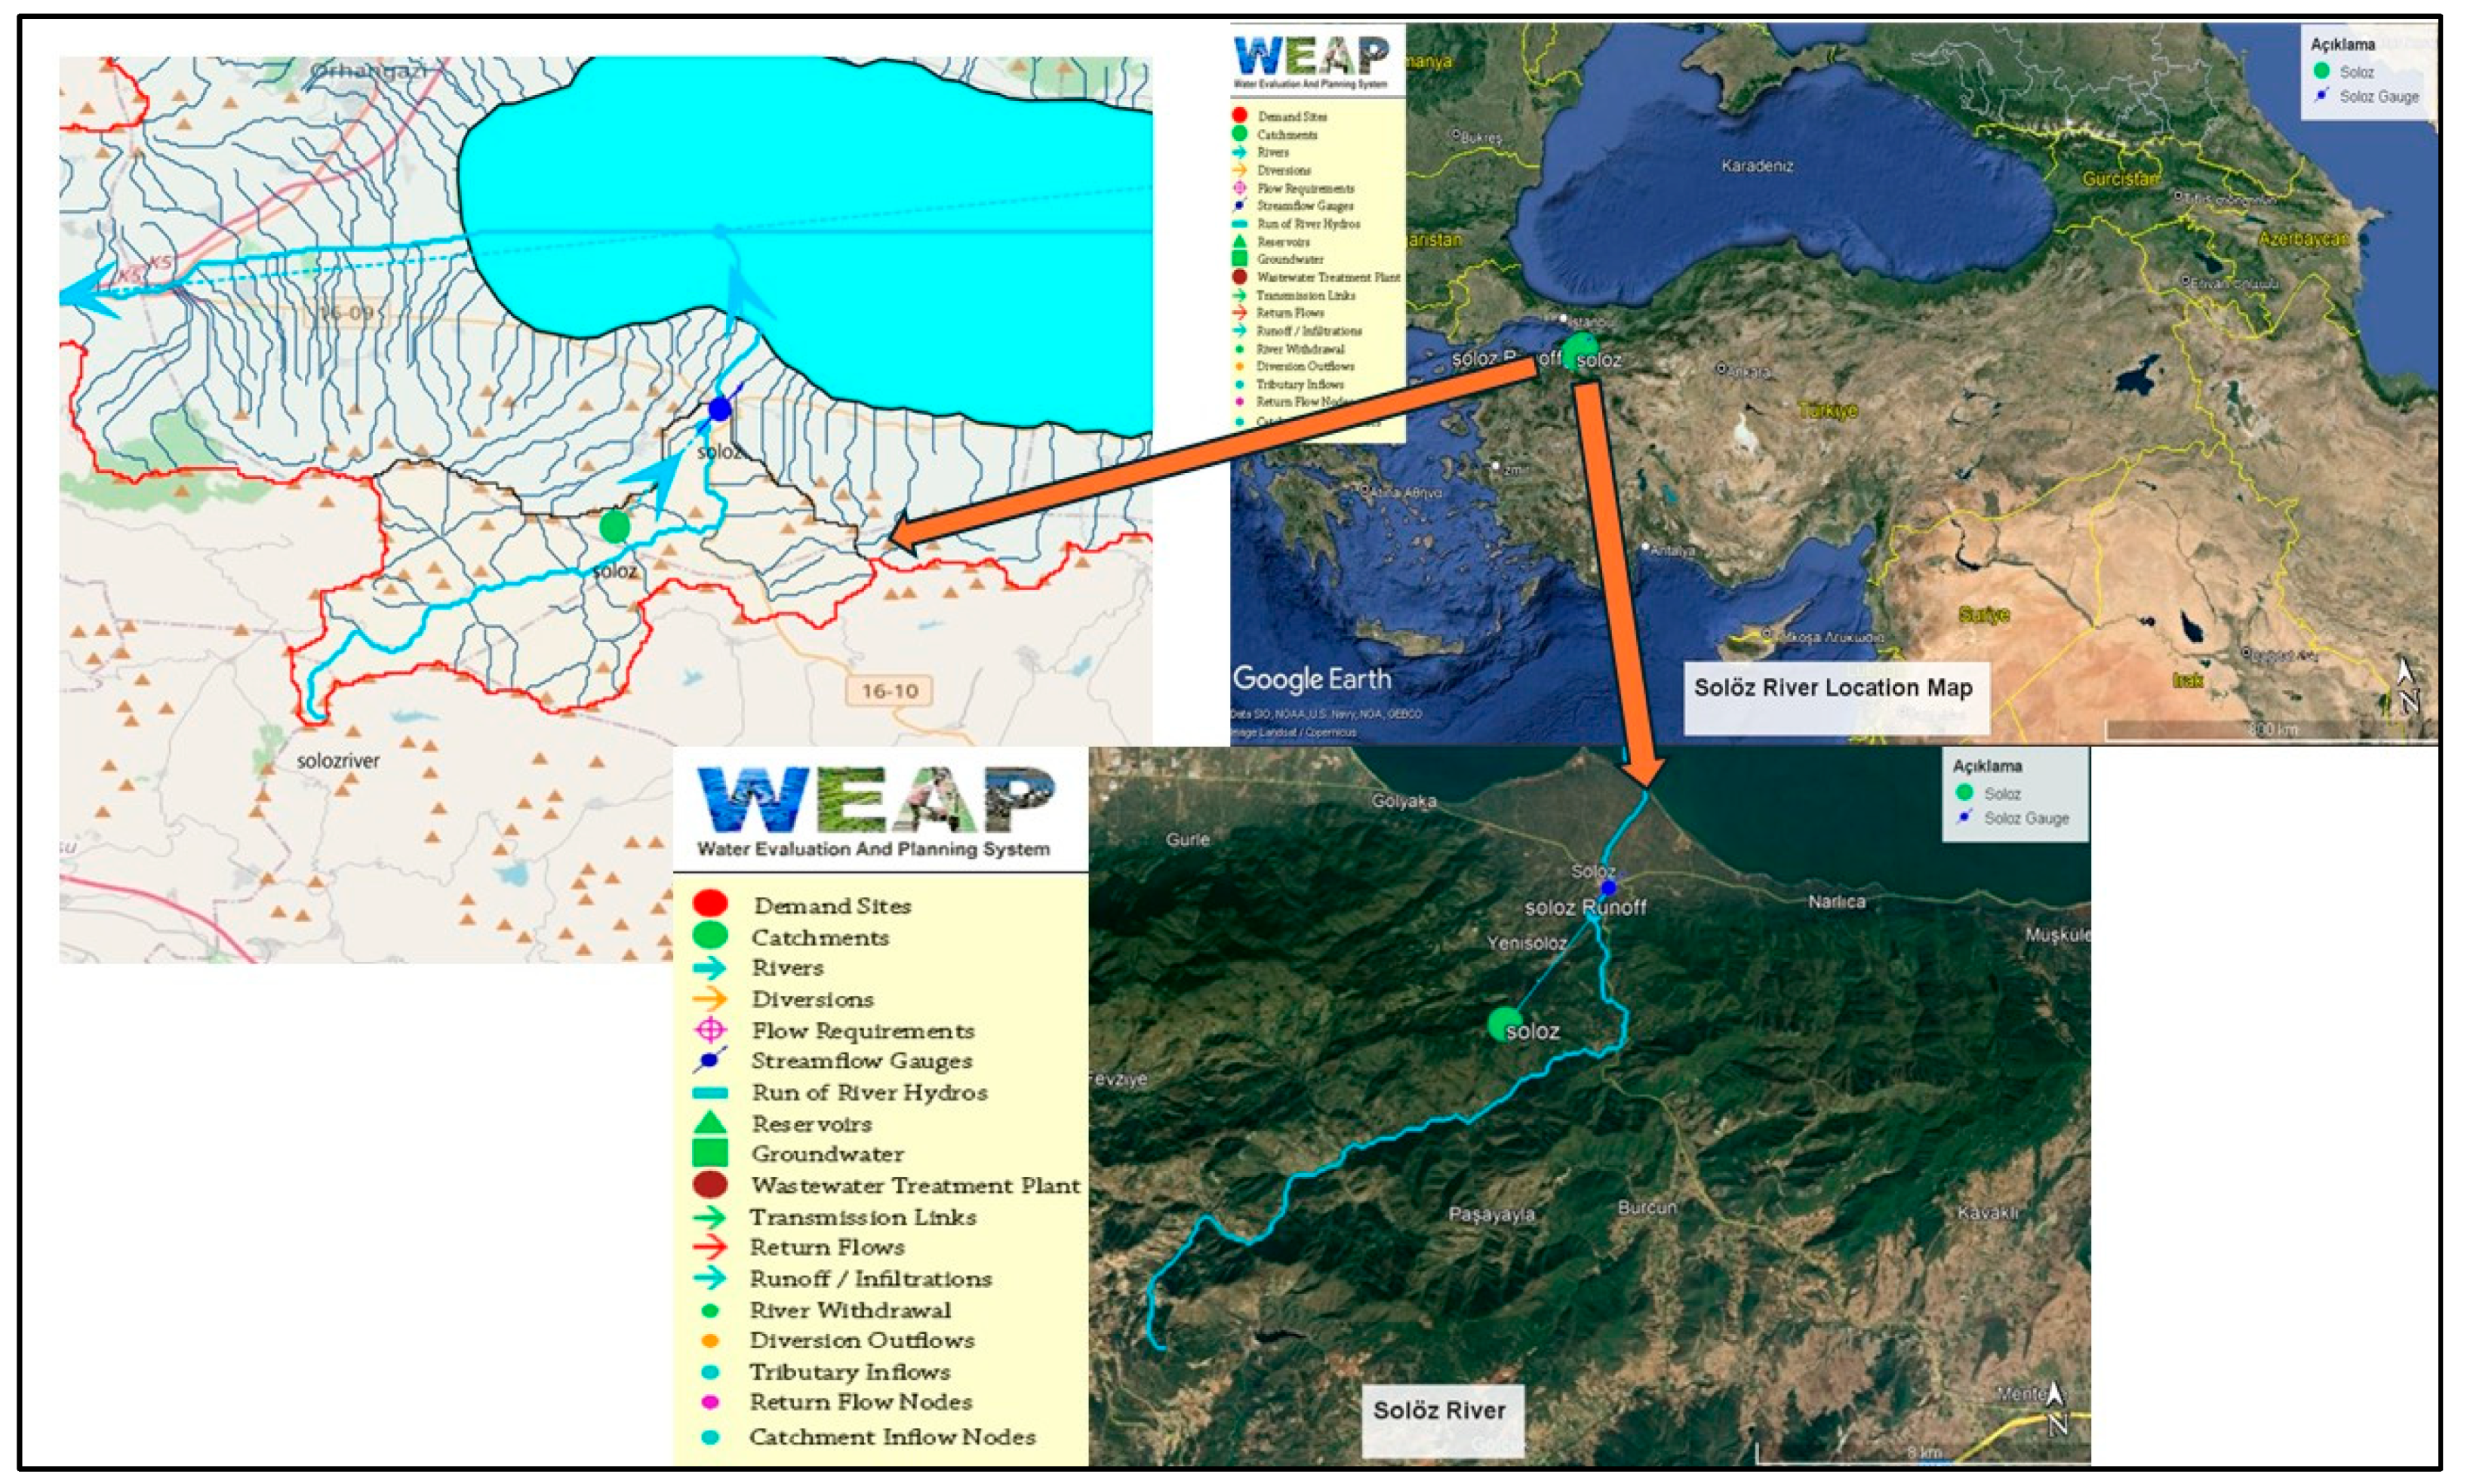
Figure 1. Soloz Stream locator map and flow map with basin boundary.
Water 17 01129 g001
Figure 2. Distribution of Solöz River water budget components over time.
Water 17 01129 g002
Figure 3. Distribution of Solöz River water budget components over time for monthly average.
Water 17 01129 g003
Figure 4. Solöz River water budget components flow continuity curve.
Water 17 01129 g004
Figure 5. Comparative modeling of model results from Solöz River rainfall and calibration parameters for comparative modeling of measurement results with WEAP.
Water 17 01129 g005
Figure 6. Comparative modeling of model results and measurement results obtained from Solöz River source flows and precipitation amounts with WEAP.
Water 17 01129 g006
Table 1. Water balance components table (cubic meter).
Variable19951996199719981999200020012002
Base Flow−1,684,720−1,657,600−1,626,500−1,693,010−1,697,580−1,670,610−1,620,100−1,611,610
Decrease in Snow (Melt)0739,160373,269003,307,17302,045,918
Decrease in Soil Moisture20,876,82021,090,41517,230,84923,419,48120,880,38320,216,32917,445,97315,894,642
Evapotranspiration−52,940,200−50,919,900−54,780,100−62,046,400−50,741,400−57,560,400−46,151,300−57,480,200
Increase in Snow0−739,160−373,26900−3,307,170−2,045,920−337,797
Increase in Soil Moisture−21,788,800−19,061,300−28,015,600−20,009,600−12,530,200−21,734,900−24,119,500−11,644,700
Interflow−268,206−257,589−296,958−376,246−242,836−303,659−179,500−334,258
Precipitation62,402,16256,694,56075,988,61970,860,80248,866,21769,578,90661,175,11561,246,232
Surface Runoff−6,590,210−5,875,680−8,509,720−10,141,100−4,516,880−8,517,580−4,503,140−7,764,760
Sum6804.8712,891.5−9431.2714,030.617,790.48039.091669.5913,456
Table 2. Water budget components 90% of the time.
Variable90%
Base Flow−142,621
Decrease in Snow (Melt)0
Decrease in Soil Moisture0
Evapotranspiration−7,737,900
Increase in Snow0
Increase in Soil Moisture−4,899,010
Interflow−41,940.4
Precipitation1,263,536
Surface Runoff−1,449,120
Table 3. Calibration metrics for model results from Solöz River rainfall and calibration parameters for comparative modeling of measurement results with WEAP.
Calibration MetricsValue Obtained by Comparing Model Results and Observed ValuesReasonable Range
NSE0.028>0.5 weak
0.75–1 very good
1 perfect
R20.56>0.5 weak
0.7–0.9 very good
1 perfect
NRMSE (%)114100–80 weak
>50 very good
50–80 acceptable
Table 4. Calibration metrics for comparative modeling of model results and measurement results obtained from Solöz river source flows and precipitation amounts With WEAP.
Calibration MetricsValue Obtained by Comparing Model Results and Observed ValuesReasonable Range
NSE0.83>0.5 weak
0.75–1 very good
1 perfect
R20.98> 0.5 weak
0.7–0.9 very good
1 perfect
NRMSE (%)48100–80 weak
>50 very good
50–80 acceptable
Disclaimer/Publisher’s Note: The statements, opinions and data contained in all publications are solely those of the individual author(s) and contributor(s) and not of MDPI and/or the editor(s). MDPI and/or the editor(s) disclaim responsibility for any injury to people or property resulting from any ideas, methods, instructions or products referred to in the content.