Article

Kinetic Modeling of Volatile Fatty Acids Production Using Cassava Wastewater as Low-Cost Substrate

by
Lina Marcela Sanchez-Ledesma
1,*,
Jenny Alexandra Rodríguez-Victoria
1 and
Howard Ramírez-Malule
2,*
1
Escuela de Ingeniería de Recursos Naturales y del Ambiente, Universidad del Valle, Cali 760042, Colombia
2
Escuela de Ingeniería Química, Universidad del Valle, Cali 760042, Colombia
*
Authors to whom correspondence should be addressed.
Water 2025, 17(7), 991; https://doi.org/10.3390/w17070991
Submission received: 3 March 2025 / Revised: 23 March 2025 / Accepted: 26 March 2025 / Published: 28 March 2025
(This article belongs to the Section Wastewater Treatment and Reuse)

Abstract

:
The production of volatile fatty acids (VFAs) through the acidogenic fermentation of wastewater has garnered significant attention in recent years. This study examines the kinetics of VFA production in batch reactors using cassava wastewater as a substrate under previously identified conditions (initial pH of 5.7, S/M ratio of 4 gCOD/gVS, and temperature of 34 ± 1 °C). Additionally, this study identifies the best-fit models for estimating kinetic parameters related to the consumption of soluble organic matter and VFA production. VFA production yields ranged from 0.15 to 0.44 gCODVFA/gCOD over the 12-day fermentation period, with the highest yield observed on day 9. The acids produced consisted of 29.7% acetic acid, 43.3% propionic acid, and 27.0% butyric acid. The modified Gompertz and first-order with residual models effectively described the consumption of soluble organic matter, while the first-order and BPK models accurately represented the VFA production. These models showed the highest R2 values and the lowest RMSE and AIC values. Cassava wastewater is a low-cost substrate with potential for VFA recovery. Its kinetic modeling provides valuable insights for the design, control, and scale-up of acidogenic reactors.

1. Introduction

Cassava wastewater (CWW) is a by-product of the process used to extract sour starch from cassava. Approximately 85% of the water required to produce one ton of starch is discharged as wastewater, while the remainder evaporates [1]. Water that comes into contact with cassava dissolves a significant amount of materials, resulting in a potentially polluting effluent. This effluent has a high organic load, including soluble carbohydrates and proteins, as well as elevated cyanide concentrations. It is also acidic, due to high levels of lactic and acetic acids, and smaller amounts of formic, propionic, and butyric acids [2,3,4]. If untreated, this effluent can significantly deteriorate surface water sources near starch production areas, making them unsuitable for other uses, such as human consumption, fishing, and recreation [5].
Laboratory and pilot-scale studies have demonstrated that CWW can be treated using anaerobic digestion technologies [2,3,5,6], owing to the high concentration of readily biodegradable sugars. While methane is typically considered the primary product of this process, research indicates that certain intermediate products can have higher value. For instance, volatile fatty acids (VFAs) generated during the acidogenic stage of anaerobic digestion, also known as acidogenic fermentation (AF), are of particular interest [7,8]. VFAs play a crucial role in biological nutrient removal and are widely used industries such as pharmaceuticals, food, and chemicals. Additionally, they serve as precursors for various bio-based products, including biogas, biodiesel, bioplastics, biohydrogen, biofertilizers, and biosurfactants [9,10], along with other promising real-world applications [11,12].
The process of AF for VFA production involves the hydrolysis of particulate matter, followed by acidification. Both stages are significantly influenced by environmental and operational variables [13]. Analyzing the impact of these variables, along with the metabolic reactions in AF, is complex in experimental studies. However, modeling and simulation tools can aid in interpreting these effects [14,15,16]. These tools also enable the extrapolation and prediction of microbial community dynamics and behavior under untested conditions, facilitating the rapid and efficient optimization of the AF process [17].
Several studies have evaluated and modeled VFA production from wastewater [16,18,19,20,21]. The choice of the model type depends on the research objectives and the available data to determine essential parameters [17]. Models can be classified as kinetic, parametric, or non-ideal reactor models based on their characteristics [22]. Kinetic models are used when bioreactor data include time series of concentrations for various components. They enable the estimation of kinetic parameters related to microbial growth, substrate utilization, and product formation under varying operational and environmental conditions [17,23]. Kinetic models can be either structured or unstructured. Structured models account for metabolic pathways and are typically more complex. In contrast, unstructured models are simpler and treat microorganisms as a component or reactant of the system [24]. Given that AF is a multi-product process, the development of unstructured models to describe it has become a viable alternative. Kinetic modeling provides valuable information for understanding and developing new bioreactors for AF, predicting reactor performance, supporting pilot-scale studies, and optimizing processes [15,25]. According to Ramos and Márquez [26], kinetic models are an effective tool during the design phase to enhance process productivity.
The scientific literature demonstrates that various kinetic models—such as first-order, first-order with residue, second-order, Logistic, Monod with growth, Fitzhugh, Monomolecular, modified Gompertz, Transfer, and Richards—have been applied to experimental data from the AF of wastewater [15,16,18,27]. The effectiveness of kinetic models in describing wastewater AF dynamics depends on their assumptions, complexity, and ability to accurately capture key process characteristics, such as substrate consumption, microbial growth, inhibition, lag phases, and system limitations. Coelho et al. [18] used dairy wastewater as a substrate in batch reactors, employing an inoculum collected from a brewery UASB reactor. They also chemically inhibited methanogenesis using chloroform at a concentration of 0.05% v/v. The authors determined that the first-order kinetic model with residual provided the best fit for the hydrolysis of particulate organic matter and substrate consumption, as it accounts for a fraction that remains unhydrolyzed or undegraded. Additionally, the first-order and Fitzhugh models, which describe an exponential phase, were suitable for representing VFA production. Morais et al. [16] used swine wastewater under conditions similar to those of Coelho et al. [18]. They found that the first-order kinetic model with residual was the best fit for the hydrolysis of particulate organic matter. However, none of the evaluated models accurately represented the soluble biodegradable organic matter consumption curve, as it did not account for the increase in soluble organic matter concentration due to hydrolysis. The models describing logistic functions, such as the Richards and Logistic models, were the most appropriate for representing VFA production from swine wastewater. In a subsequent study, Morais et al. [15] found that the first-order kinetic model with residual was the best fit for both the hydrolysis curve of particulate organic matter and substrate consumption when bovine slaughterhouse wastewater was used. They concluded that mathematical models describing exponential growth, such as the first-order, cone, and Fitzhugh models, were the most suitable for representing the kinetics of VFA production. Trisakti et al. [28] evaluated various kinetic models—Modified Gompertz, Logistic, and Monod—to describe microbial growth (based on volatile suspended solids values) and VFA production during the acidogenesis of palm oil mill effluent at an agitation speed of 250 rpm, a pH of 5.5, and a temperature of 55 °C. The authors concluded that the Logistic model most accurately represented both microbial growth and VFA production.
Based on the above, the best-fitting model for VFA production depends on the type and characteristics of the substrate used in AF. Kinetic modeling of VFA production from CWW remains limited, with only one study on acid production using cassava residues identified to date [29]. In that study, Undiandeye et al. [29] investigated the potential of ensiled mixtures of cassava peel and CWW as substrates for medium-chain carboxylate production. They also modeled the chain elongation process using first-order, modified Gompertz, and dual pool models. Therefore, this study aims to examine the kinetics of VFA production from CWW at a laboratory scale and to fit a model for the process, specifically for substrate utilization and VFA production. The results provide valuable insights for the design, operation, and scale-up of acidogenic reactors.

2. Materials and Methods

2.1. Substrate and Inoculum

CWW was used as a substrate for the AF process. The substrate underwent physicochemical characterization and was stored at 4 °C for less than 24 h to preserve its properties.
The acidogenic reactors used in the experimental setup were inoculated with sludge from an Upflow Anaerobic Sludge Blanket (UASB) reactor at a pig slaughterhouse wastewater treatment plant. To enrich the inoculum with acidogenic microorganisms, it was gradually adapted to the CWW. These microorganisms transform the carbohydrates in CWW into VFAs. After adaptation, the inoculum underwent heat pretreatment at 85 °C for 30 min [30] to inhibit methanogenic archaea activity and promote VFA accumulation, preventing their conversion to methane.

2.2. Experimental Setup

To examine the kinetics of VFA production, batch flow amber glass flasks with a total volume of 400 mL (200 mL for the reaction and 200 mL for the headspace) were used as acidogenic reactors. Each reactor was operated at a substrate to microorganism (S/M) ratio of 4 gCOD/gVS. The initial pH of the mixture was adjusted to 5.7 using Na2HPO4 (Thermo Fisher Scientific Inc., Waltham, MA, USA) or HCl (Merck KGaA, Darmstadt, Germany) solutions. Each reactor was equipped with a magnetic stir bar to ensure complete mixing and a cap containing two NaOH (Merck KGaA, Darmstadt, Germany) pellets for CO2 absorption. The reactors were sealed with rubber septa and aluminum seals and incubated at 34 ± 1 °C for the established fermentation period. The S/M ratio, pH, and temperature were selected based on the results of our previous studies [31,32]. The kinetics of VFA production from CWW were evaluated over a 12-day period, with daily measurements. For each fermentation time, three acidogenic reactors were set up, resulting in a total of 36 reactors for the experimental setup. After the fermentation period, a sample of the liquid phase was collected from each reactor and analyzed for pH, total solids (TS), volatile solids (VS), soluble chemical oxygen demand (SCOD), total VFAs, total alkalinity, bicarbonate alkalinity, total carbohydrates, and VFA composition.
The yield, VFA productivity, and available soluble organic matter (CODA) were calculated using Equations (1) [33], (2), and (3) [15], respectively.
Y i e l d = C O D V F A _ f C O D V F A _ i T C O D i C O D V F A _ i
P r o d u c t i v i t y = C O D V F A _ t C O D V F A _ i t
C O D A = S C O D f C O D V F A _ f
where CODVFA_f refers to the fraction of soluble COD in the VFA form at the end of the trial, CODVFA_i represents the fraction of soluble COD in the VFA form at the beginning of the trial (day zero), TCODi indicates the total COD added in the batch reactor, CODVFA_t represents the total VFA concentration expressed as COD on a specific day, t refers to the collection time, CODA indicates the fraction of COD soluble available and not referring to VFAs, and SCODf denotes the soluble COD measured at the end of the trial.

2.3. Analytical Methods

The pH, total and bicarbonate alkalinity, TS, and VS were determined following standard methods [34]. An iris HI801 spectrophotometer (Hanna Instruments, Woonsocket, RI, USA) was used to measure TCOD, SCOD, ammonia nitrogen, and orthophosphates. These measurements were performed by adapting the USEPA method 410.4, the Nessler method, and the ascorbic acid method, respectively. Total carbohydrates were analyzed using the phenol–sulfuric acid method described by Dubois et al. [35]. Total VFAs were analyzed by adapting the potentiometric titration method described by DiLallo and Albertson [36]. VFA composition was determined using a Perkin Elmer gas chromatograph model Clarus 590 equipped with a flame ionization detector (FID) (T = 250 °C). Nitrogen served as the gas carrier. Filtered liquid samples were injected into an Elite-FFAP capillary column (30 m length, 0.25 mm ID, 0.25 μm DF) in split mode with a 20:1 split ratio [32].

2.4. Kinetic Model Fitting

The kinetic models selected to describe the consumption of soluble organic matter [21,23] and VFA production [18,21] from CWW are presented in Table 1 and Table 2, respectively. Further details of each selected model are available in the study by Morais [21].
A nonlinear least squares regression analysis was performed to estimate the parameters of the selected kinetic models. The estimation was carried out using the Generalized Reduced Gradient (GRG) Nonlinear optimization algorithm provided by Microsoft Excel’s Solver tool (Version 2108). This optimization strategy determines whether an optimal solution has been reached by examining the gradient or slope of the objective function, verifying if the partial derivatives are equal to zero as the input values (or decision variables) vary [37]. This tool has also been used in other studies that analyzed the kinetics of acidogenic fermentation for VFA production [18,21].
In our study, the sum of squared errors (SSEs) was adopted as the objective function. In the first iteration, the SSEs was calculated based on the initial parameter values. In the second iteration, these parameters were slightly adjusted, and the SSEs was recalculated. This process was repeated multiple times until the lowest possible SSEs value was reached. The algorithm was executed using the forward differentiation method to compute the partial derivatives and a convergence criterion of 0.0001 was set to estimate the best possible values.
The appropriate model for describing the consumption of soluble organic matter and VFA production was initially chosen based on the coefficient of determination (R2), calculated using Equation (4). R2 assesses the dispersion of observations by examining the differences between theoretical and actual values. A value closer to 1 indicates a better model fit [38].
Additionally, the root mean square error (RMSE), defined in Equation (5), was used to quantify the difference between modeled and experimental data. The Akaike Information Criterion (AIC), calculated using Equation (6), was employed to prevent overfitting. The RMSE and AIC criteria help balance model complexity and predictive accuracy. Minimizing both RMSE and AIC is essential for achieving a better model fit.
R2, RMSE, and AIC are widely recognized statistical indicators that help evaluate how well kinetic models fit experimental data [21,28,38].
R 2 = 1 i Y i _ e x p Y i _ e s t 2 i Y i _ e x p Y ¯ 2
R M S E = i Y i _ e x p Y i _ e s t 2 N
A I C = N   l n i Y i _ e x p Y i _ e s t 2 N + 2 k + 2 k k + 1 N k 1 p a r a N k < 40
where Yi_exp is the experimental data value, Yi_est is the value estimated by the model, Ȳ is the average of the experimental data, N is the number of experimental observations, and k is the number of model parameters.

3. Results and Discussion

3.1. Physicochemical Characterization of Substrate and Inoculum Solids Concentration

Table 3 and Table 4 present the physicochemical characterization of the CWW and the solids concentration of the inoculum used in the acidogenic reactors. The measured values are consistent with those reported in previous studies [30,31].

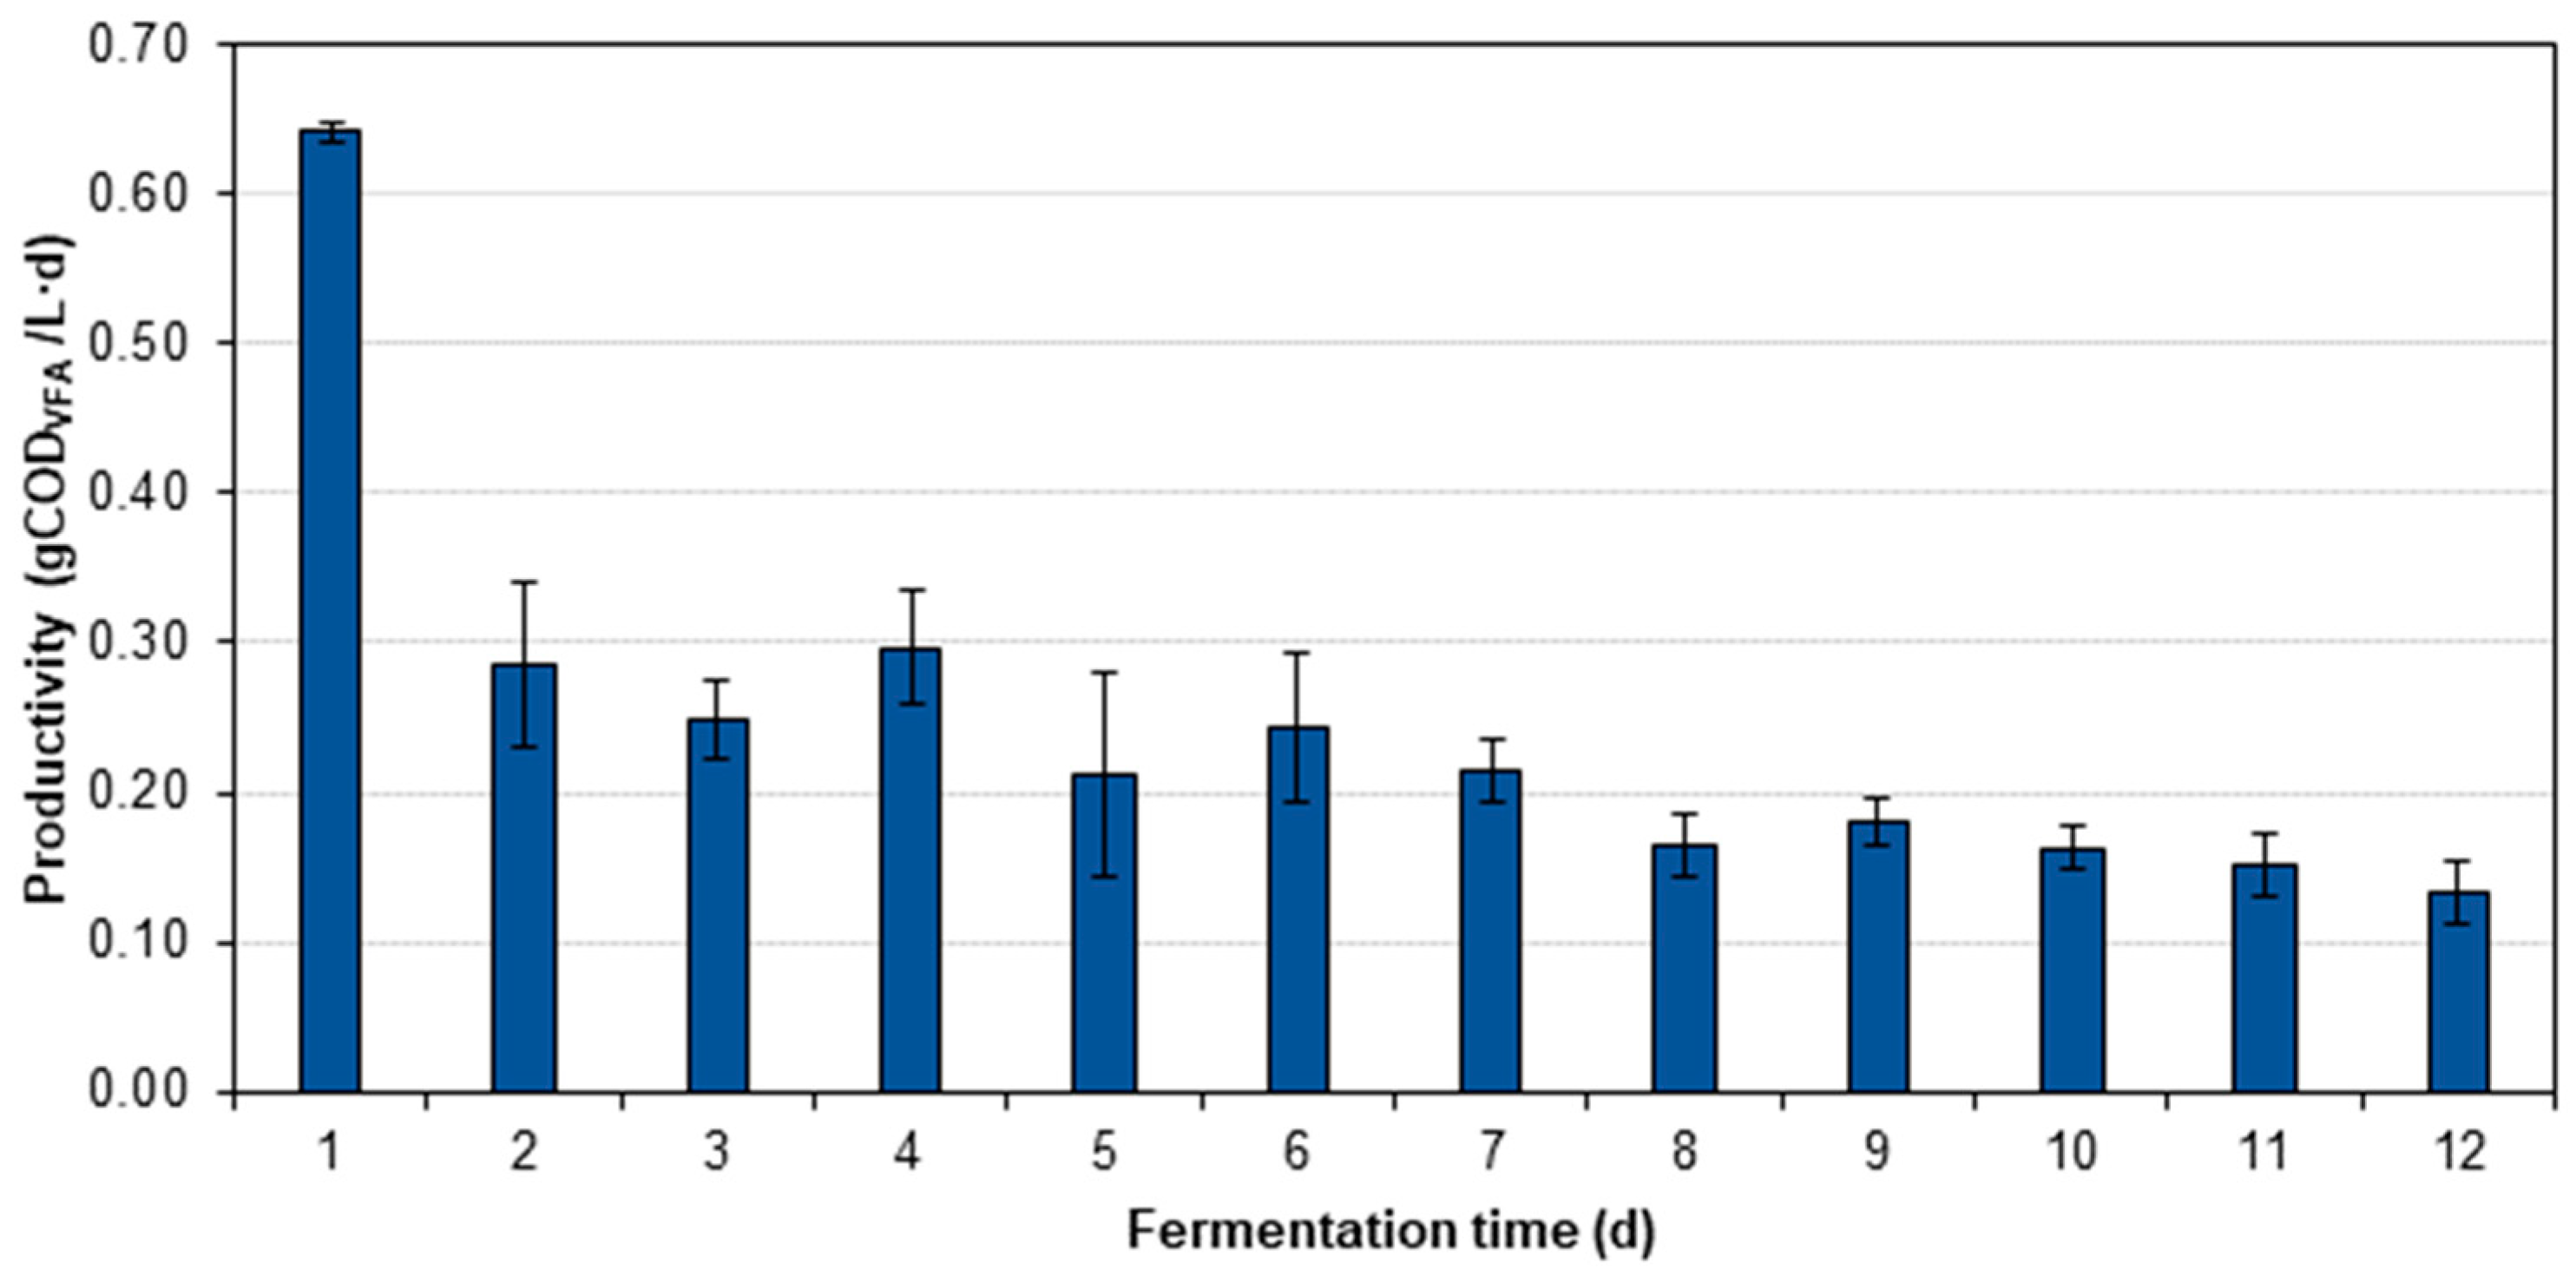
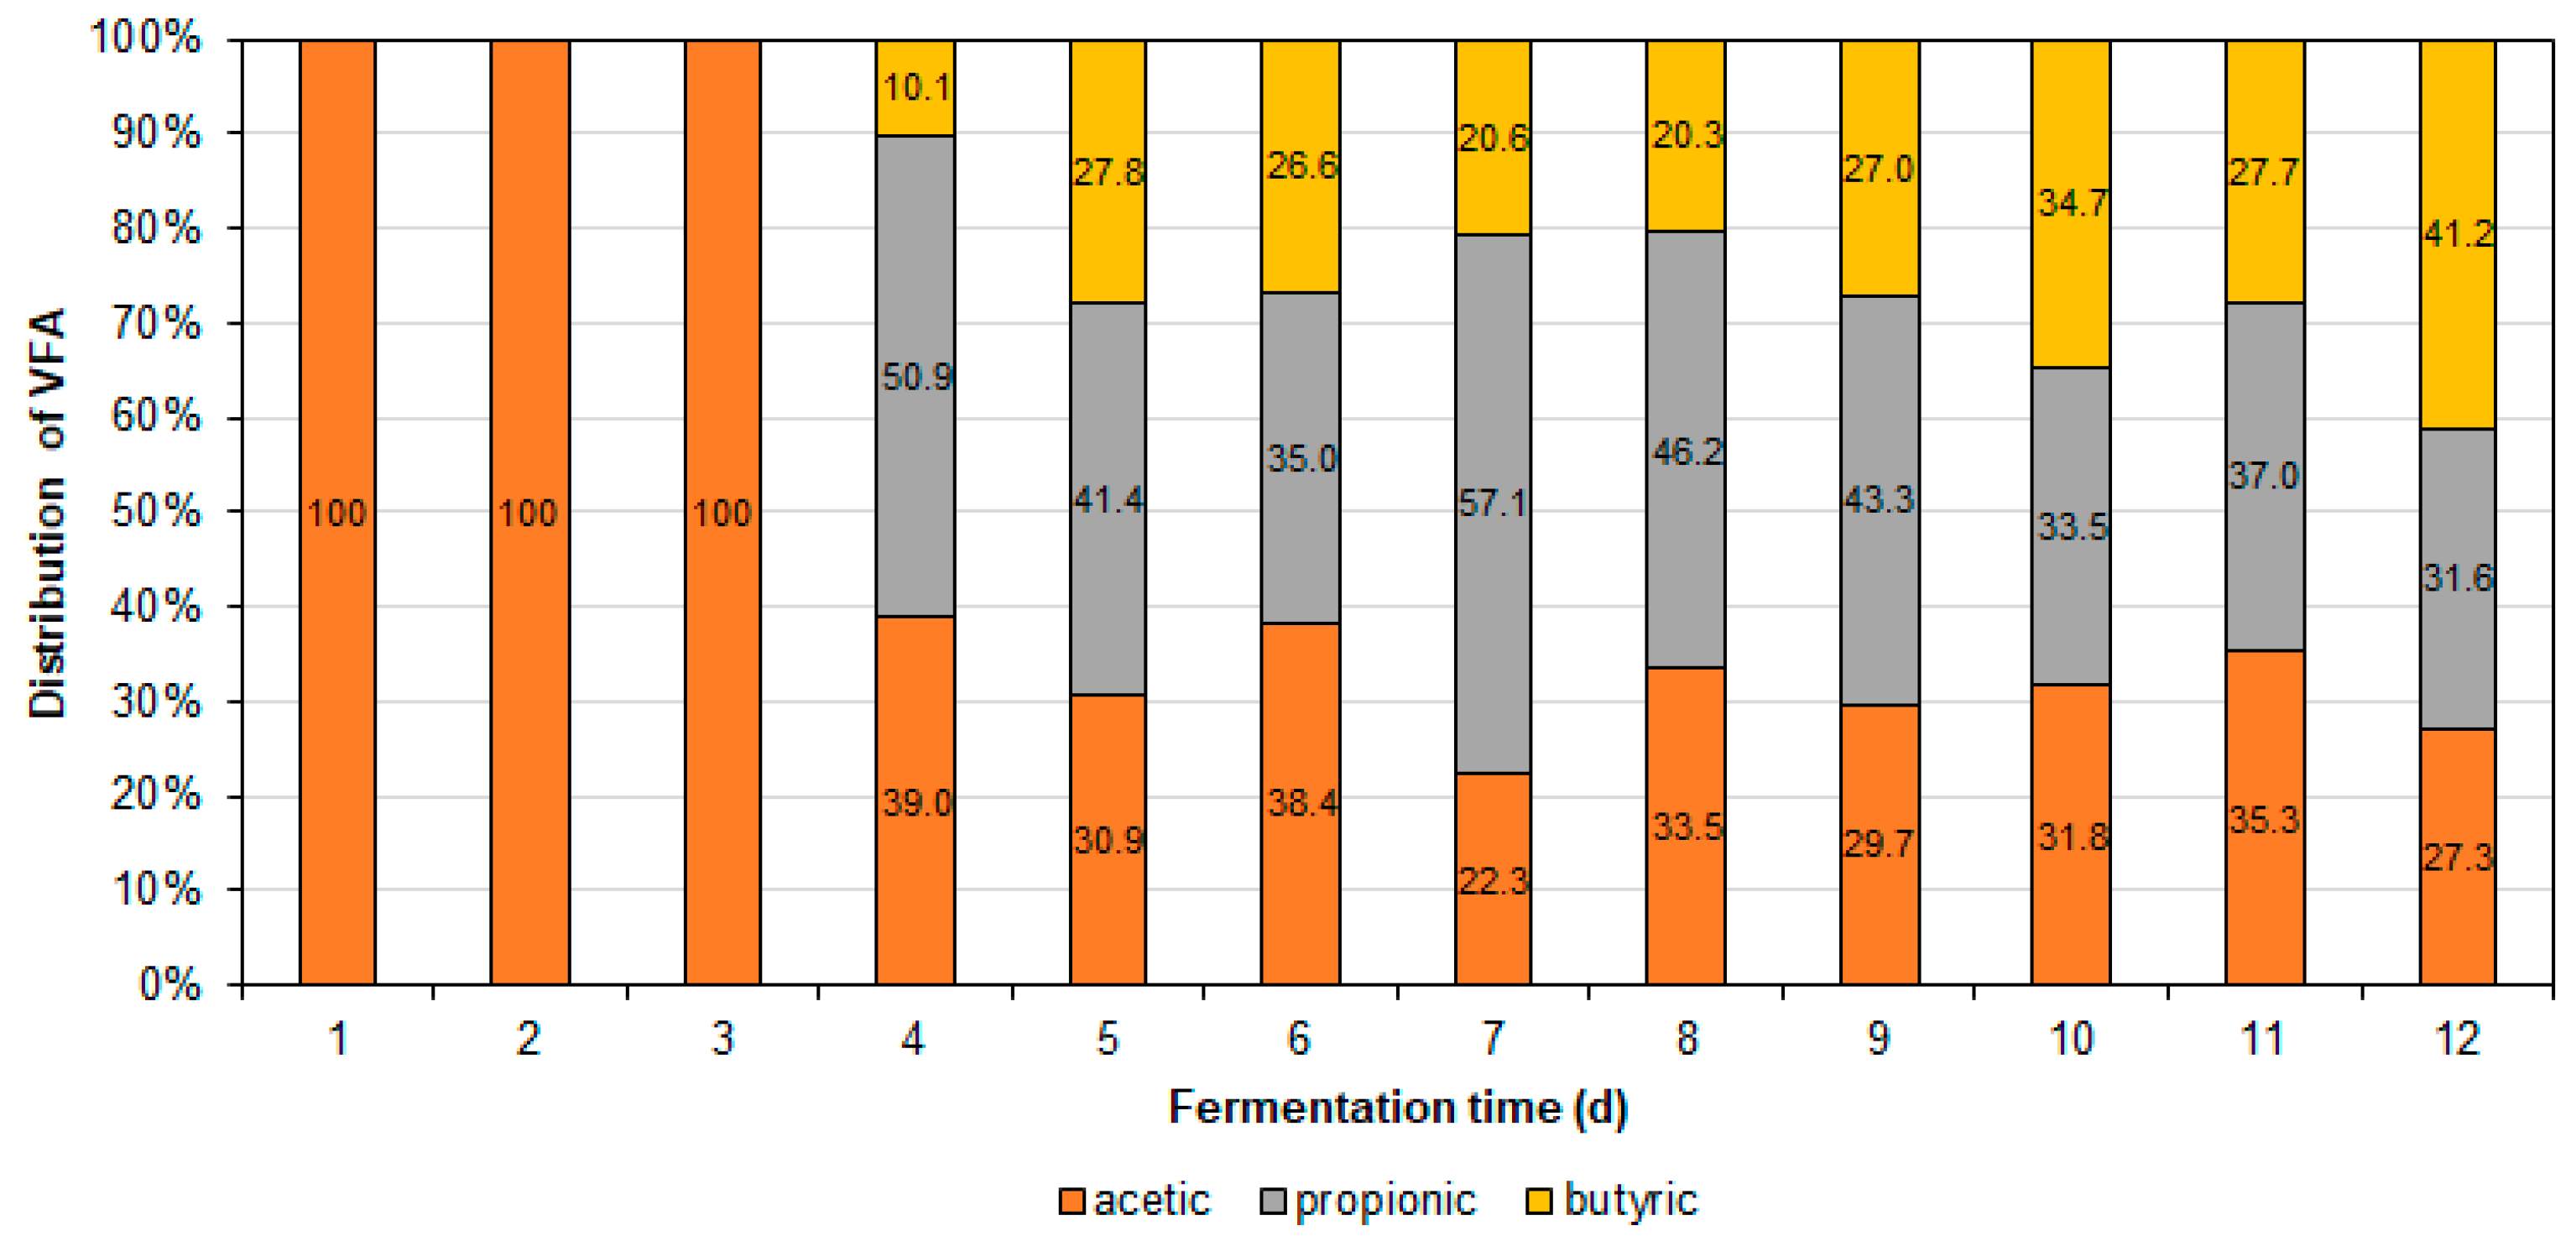
3.2. Yield, Productivity, and VFA Distribution

Figure 1 shows the final VFA concentration and yield over the evaluated fermentation period.
Figure 1 indicates that the final VFA concentration increases with fermentation time up to approximately 9 days, after which VFA production stabilizes and slightly declines. The yield increased from 0.17 gCODVFA/gCOD (1787.77 mgHAc/L) on day 1 to 0.44 gCODVFA/gCOD (2705.11 mgHAc/L) on day 9, and then decreased slightly to 0.43 gCODVFA/gCOD (2680.46 mgHAc/L) on day 12. The curve representing the VFA production from CWW shows an asymptotic increase over time, similar to that observed by Cheah et al. [39].
The yields obtained in this study align with those reported by Morais et al. [16] in the AF of swine wastewater. In their study, 40 ± 5% of the applied organic matter was converted into VFAs, yielding 0.40 mgCOD/mgCODA. Hasan et al. [6] evaluated the effect of temperature (30 to 50 °C) and alkalinity (2 to 4 g/L sodium bicarbonate) on the VFA production from CWW in batch reactors. Under conditions of 30 °C, 3 g/L sodium bicarbonate, 2 g/L reducing sugars, pH 5.9, and 45 h of fermentation, they reported yields of 0.45 gTVFA/gCOD (3400 mgTVFA/L).
In contrast, our yields were significantly lower than those reported in studies using different types of wastewaters. Coelho et al. [18] achieved yields of 0.83 mgCODCA/mgCODA using dairy wastewater as a substrate over 7 days of fermentation. In another study, Coelho et al. [19] reported yields of 0.82 mgCODCA/mgCODA over 14 days of fermentation using residual glycerol from biodiesel production, with 95% of the applied glycerol converted into VFAs.
The lower yields obtained with CWW are attributed to the specific characteristics of the substrate and inoculum used. Other influencing factors—such as pH, temperature, and S/M ratio—were assessed in our previous studies [31,32], and the optimal conditions were selected for kinetic evaluation. Specifically, the presence of cyanide in the substrate, the low concentrations of proteins and lipids, and the limited availability of essential nutrients (nitrogen and phosphorus) may have restricted VFA production from CWW compared to the yields observed for dairy wastewater and residual glycerol from biodiesel production.
Similarly, Morais et al. [15] reported a yield of 0.76 gCOD/gCODA from bovine slaughterhouse wastewater. They attributed the high yield to the biodegradability of the substrate, adequate nutrient concentrations, and natural buffering, which favored acidogenic microorganism metabolism. This study highlights that the nutrient concentration and buffering capacity are key factors that can be adjusted in acidogenic reactors treating CWW to enhance yields. Hasan et al. [6] also concluded that increasing the medium alkalinity enhances VFA production in CWW fermentation.
For CWW, Niz et al. [40] reported acidification degrees of 75.8% on day 4 and 84.1% on day 15 of fermentation using adapted and unadapted inoculum which was pretreated thermally. Variations in yield, concentration, and productivity are largely attributed to differences in process operating parameters. Simonetti et al. [41] highlighted that the nature of the feedstock affects its biodegradability, while its concentration influences VFA levels. Liu et al. [42] note that variations in the initial carbon-to-nitrogen ratio can influence the conversion of carbohydrates and proteins, leading to differences in total VFA generation and its components. Additionally, sufficient concentrations of micronutrients and trace metals are essential for cell maintenance, metabolism, growth, and transport processes [43]. Wang et al. [44] studied the effect of the carbohydrate-to-protein (Car/Pro) ratio, ranging from 0.25 to 3, on VFA production using typical model substrates, including solubilized (bovine serum albumin-BSA and dextran), as well as hydrolyzed (amino acids and glucose) substrates. For solubilized substrates, the authors observed that as the Car/Pro ratio increased from 0.25 to 1, the maximum VFA yield rose from 0.64 to 0.71 mgCOD/mgCODsubstrate. However, when the Car/Pro ratio increased to 3, the maximum VFA yield significantly decreased to 0.50 mgCOD/mgCODsubstrate. A similar trend was observed for the hydrolyzed substrates, with maximum VFA production values of 0.60, 0.66, 0.72, 0.65, and 0.61 mgCOD/mgCODsubstrate at Car/Pro ratios of 0.25, 0.5, 1, 2, and 3, respectively. The authors concluded that both the Car/Pro ratio and the type of organic substrate significantly affect the hydrolysis and acidogenesis processes during AF.
Figure 2 illustrates the productivity of VFAs from CWW. The highest productivity was observed on the first day of the experiment, followed by a gradual decline throughout the fermentation period. This trend can be explained by physiological and biochemical mechanisms that influence substrate utilization, microbial activity, and metabolic shifts throughout the acidogenic fermentation process.
Specifically, the productivities on days 1 and 12 were 0.642 and 0.133 gCODVFA/L·d, respectively. These results suggest that CWW is an easily fermentable substrate for acidogenic microorganisms, as substantial VFA production occurred within the first two days of fermentation. This finding aligns with the observations of Hasan et al. [6] during the AF of CWW.
The average productivity in our experiment was 0.245 gCODVFA/L·d, comparable to the value reported by Coelho et al. [19] for residual glycerol (0.27892 ± 0.06246 g/L·d). However, it differed significantly from the average VFA productivity observed by Coelho et al. [18] for dairy wastewater, which was 0.99965 ± 0.59735 g/L·d.
The productivity in AF is influenced by operational parameters, such as substrate concentration and residence time (both hydraulic and solids or run length for batch studies). In a review of the scientific literature, Simonetti et al. [41] found that higher substrate concentrations tend to increase productivity. Elevated substrate levels generally result in higher product concentrations, leading to greater productivity. The authors also concluded that productivity decreases as residence time increases. Shorter residence times correspond to smaller reactor volumes or shorter reaction times, which enhances productivity. They observed the highest productivities (above 10 g/L·d) at feed concentrations between 128 and 149 gCOD/L, with hydraulic residence times ranging from 1 to 5 days.
To optimize productivity, substrate concentration must be high enough to sustain maximum microbial activity, yet not exceed levels that could cause substrate inhibition, acidification, or the accumulation of toxic intermediates, which may slow microbial activity or compromise process efficiency. Similarly, the residence time should be short enough to maintain high yields, but if too short, it may lead to incomplete substrate conversion, reduced overall yields, or the loss of key microorganisms if their retention in the system is not ensured.
Figure 3 illustrates the distribution of VFAs produced throughout the fermentation period. During the first three days, only acetic acid was produced. From day 4 to day 12, a mixture of acetic, propionic, and butyric acids was observed. The proportions of butyric and propionic acids fluctuated slightly over time. As fermentation time varied from 4 to 12 days, the proportion of butyric acid increased from 10.1 to 41.2%, while the proportion of propionic acid decreased from 50.9 to 31.6%. Variations in VFA ratios during fermentation can be attributed to microbial, biochemical, and environmental factors that influence the metabolic pathways of acidogenic bacteria. Key factors, such as substrate availability and microbial preference, community dynamics, hydrogen partial pressure, and pH fluctuations with their inhibitory effects, can alter the microbial metabolism at different stages of fermentation, leading to fluctuations in acid ratios.
These results are qualitatively consistent with the findings of Coelho et al. [19] and Coelho et al. [18]. They observed a higher selectivity in the production and yield of acetic, propionic, and butyric acids during the AF of residual glycerol and dairy wastewater, respectively. Similarly, Morais et al. [15] reported a distribution of 59, 15, and 11% for acetic, butyric, and propionic acids, respectively, in the AF of bovine slaughterhouse wastewater. However, they also observed the production of caproic acid without the addition of electron donors.
For CWW, Amorim et al. [14] evaluated the effects of methanogenesis inhibition methods (acetylene at 1% v/v in the headspace and heat treatment at 120 °C for 30 min), inoculum types (bovine rumen and sludges from municipal and textile industrial wastewater treatment plants), and organic loading (10, 20, and 40 g/L in terms of COD) on hydrogen and carboxylic acid production in batch reactors. When assessing the pretreatment methods and the combined effects of different inoculum types and organic loads, the authors found that the main products were acetic, butyric, propionic, and caproic acids, along with ethanol. The same metabolites were detected by Amorim et al. [45] when evaluating caproic acid production through carbon chain elongation during fermentative hydrogen production, achieved by adding ethanol to the medium. The authors examined two initial substrate concentrations (10 and 20 g/L as COD) by diluting CWW with tap water. They set an initial pH of 5.5 for the acidogenic phase and a pH of 7.0 to promote carbon chain elongation. In previous studies, the conditions tested favored the production of caproic acid from CWW. However, in our study, this acid was not detected. This absence is likely due to the operating conditions, the microbial community, and the nature of the substrate used in the AF process. These factors may have favored the production of propionic acid over butyric acid. According to Undiandeye et al. [29], lactic, acetic and butyric acids, as well as ethanol, can be precursors of medium-chain carboxylic acids (those with six to twelve carbon atoms) through a chain elongation process. This process is a sequential reaction in which electron donors, such as lactic acid or ethanol, are utilized by microorganisms to elongate VFAs via a reverse β-oxidation pathway [46]. To produce medium-chain carboxylic acids with an even number of carbon atoms, butyric acid elongates to form caproic acid. This acid then elongates to form caprylic acid, and so on [29].
Additionally, Niz et al. [40] evaluated the potential for VFA production from the AF of CWW using both adapted and non-adapted inoculum sludge. They tested conditions with and without methanogenesis inhibition techniques in batch reactors (1 gTVS/gCOD and 32 ± 2 °C). The main product was butyric acid, which accounted for 50 and 64% of the total VFA produced when the inoculum was adapted and unadapted, respectively, as well as thermally pretreated. Hasan et al. [6] achieved the highest yield for CWW at 30 °C using 3 g/L sodium bicarbonate, 2 g/L reducing sugars, a pH of 5.9, and 45 h of fermentation. The primary products were acetic acid (63%), butyric acid (22%), and propionic acid (12%). According to Morais et al. [15], the kinetic parameters indicated that acetic acid was formed the fastest, while butyric acid formed the slowest during the AF of bovine slaughterhouse wastewater. These findings are consistent with those observed in our study (Figure 3).

3.3. Kinetic Model Fitting of AF

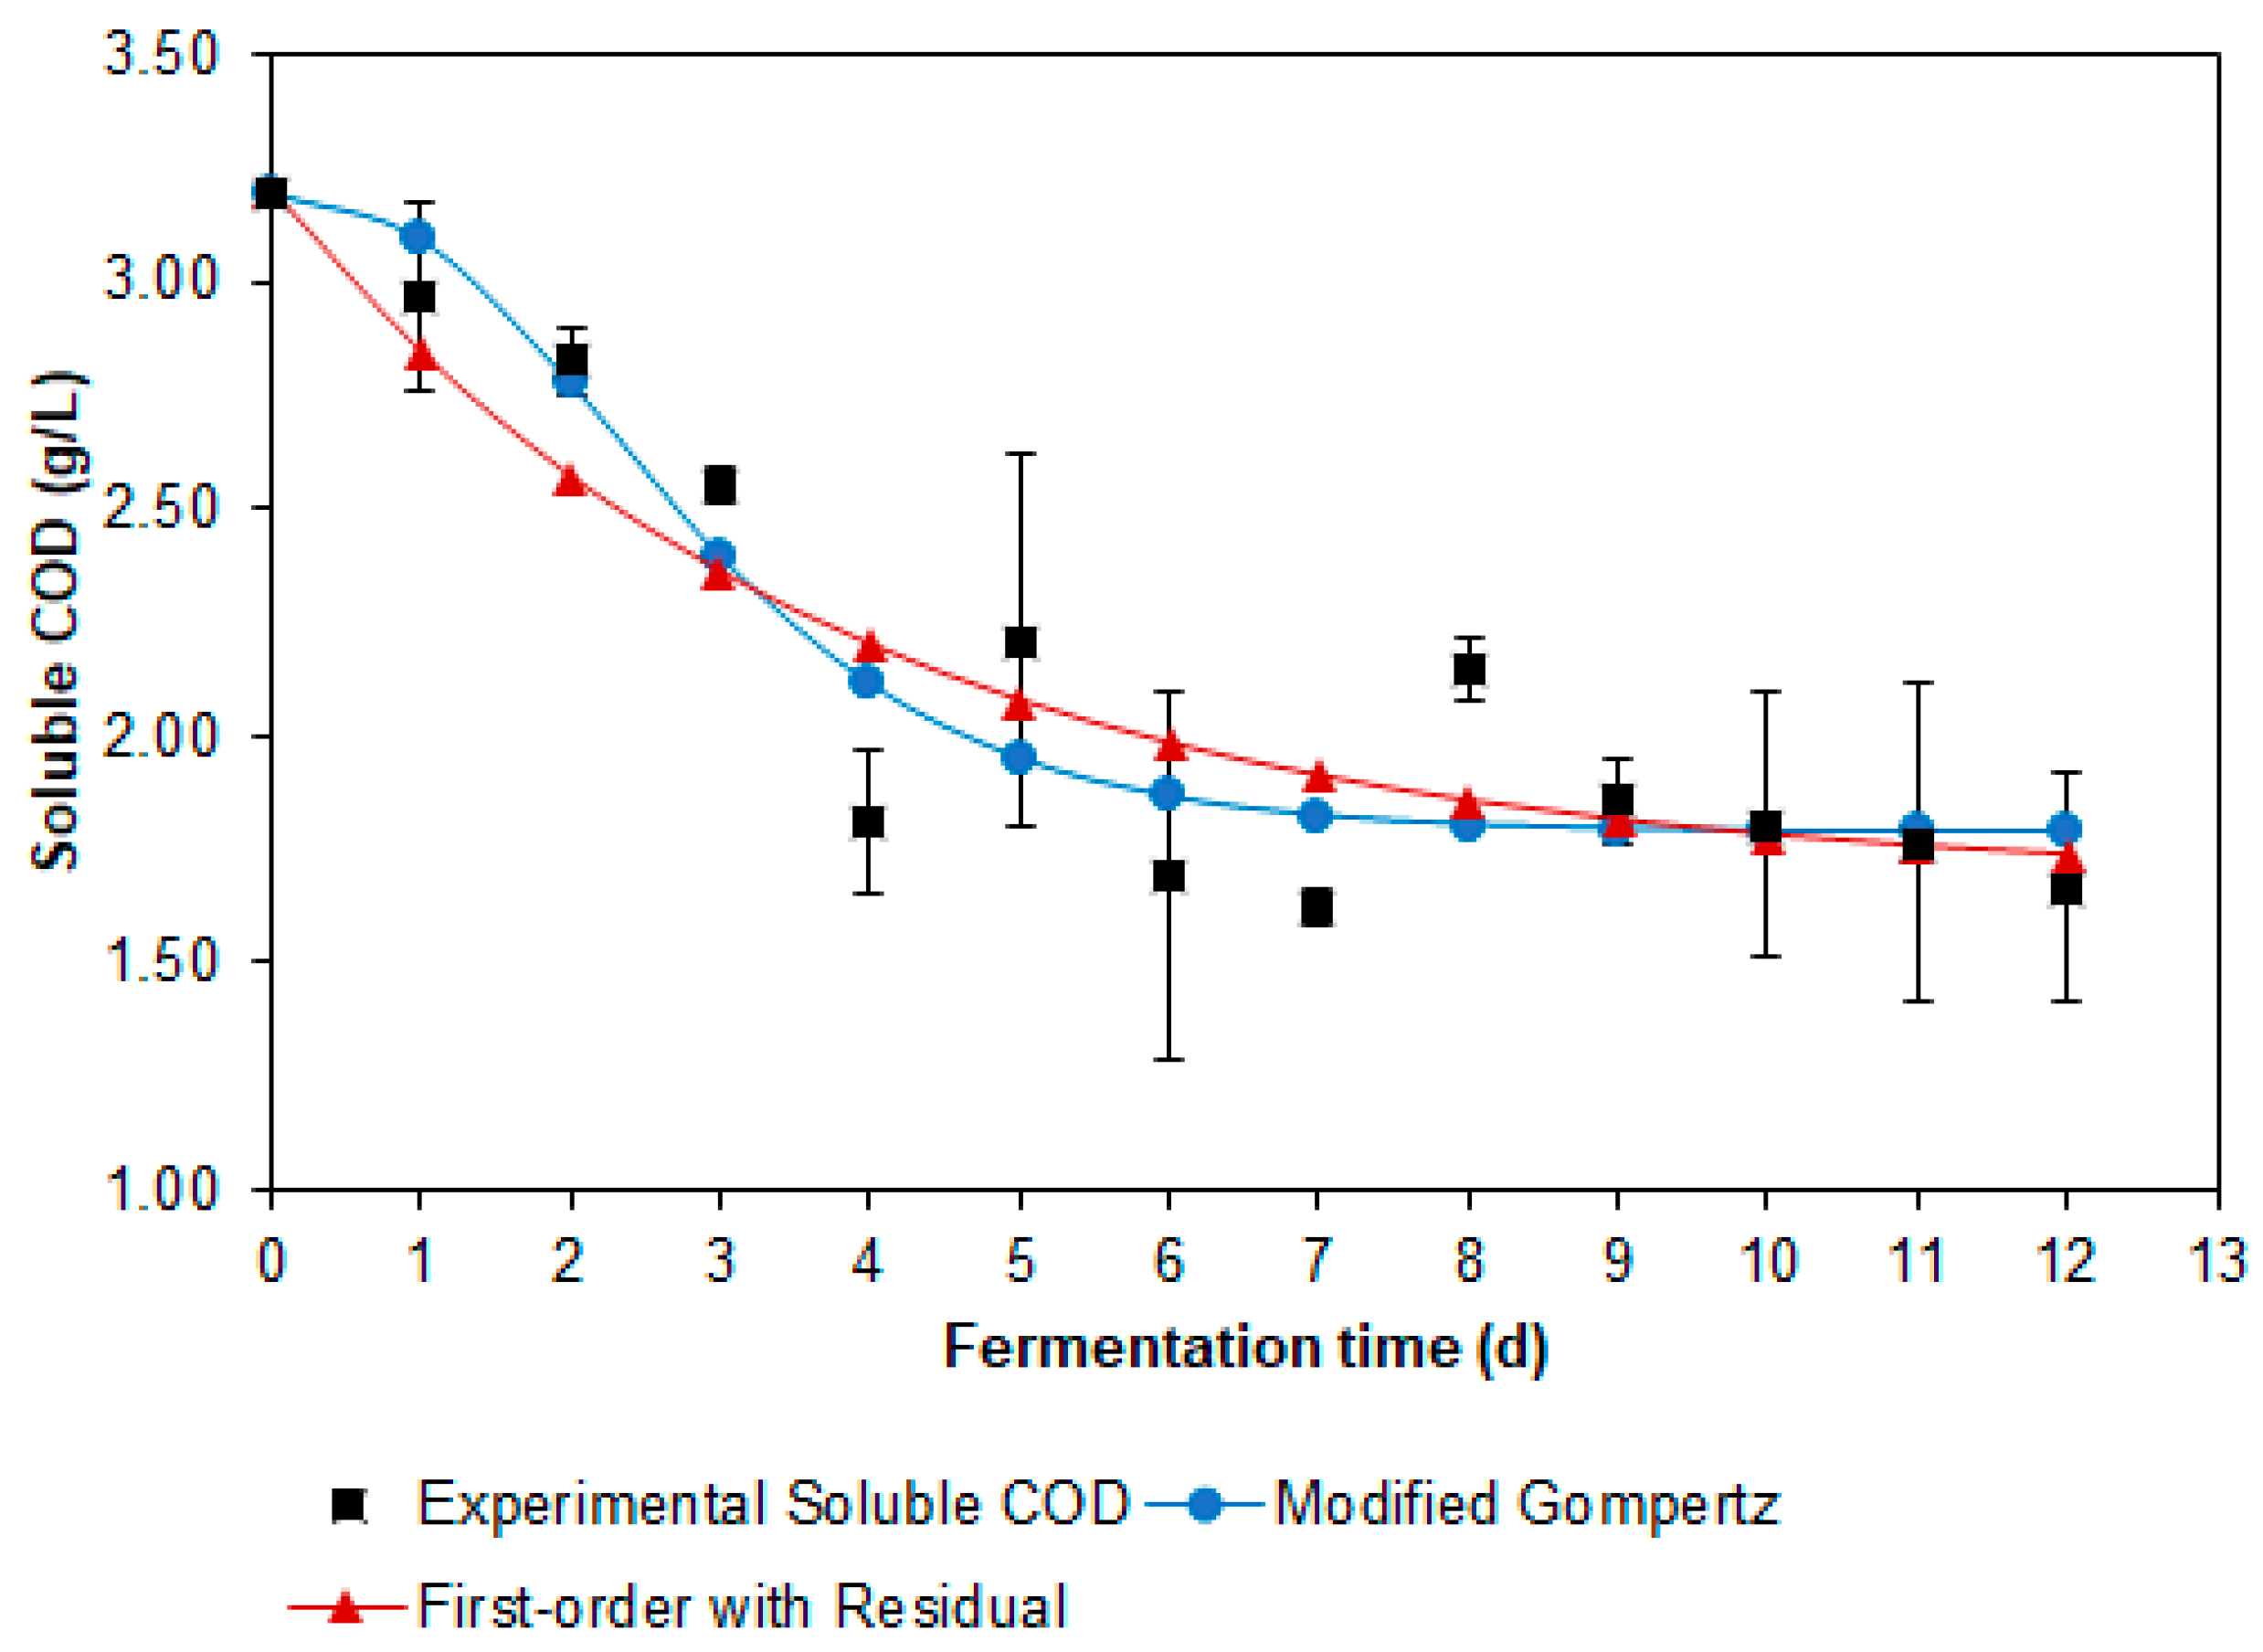
3.3.1. Modeling of Soluble Organic Matter Consumption

Table 5 presents the estimated kinetic parameters along with the R2, RMSE, and AIC values for the models used to describe the consumption of soluble organic matter. This term refers to the soluble COD that is not in the form of VFAs but can be converted into VFAs.
The results indicated that the modified Gompertz model best described the conversion of soluble organic matter. The R2, RMSE, and AIC values were 0.885, 0.177, and −36.291, respectively. Given the complexity of AF with mixed cultures—a bioprocess involving multiple metabolic pathways—R2 values exceeding 0.80 were deemed satisfactory for describing the consumption of soluble organic matter in this study. An R2 value of 0.885 suggests that the model explained 88.5% of the variability in soluble organic matter conversion, effectively capturing most of the underlying dynamics while leaving minimal unexplained variation. Additionally, an RMSE of 0.177 indicates a relatively low error, demonstrating that the model’s predictions closely align with observed data, reinforcing its reliability in predicting the bioprocess. The low AIC (−36.291) reflects a well-balanced trade-off between model fit and complexity, confirming that the modified Gompertz model efficiently captured key process features without overfitting, outperforming alternative models.
According to this model, the Rmax, λ, and Smax were 0.396 gCOD/L·d, 0.929 d, and 1.412 gCOD/L, respectively. The moderate maximum substrate conversion rate (Rmax) suggests a steady degradation process, likely regulated by microbial activity and substrate availability. The short latency phase (λ) indicates that the microbial community adapted quickly to the environment, facilitating an efficient initiation of biodegradation. Additionally, the maximum substrate conversion (Smax) reflects the system’s capacity to effectively process the organic load. These parameters further confirm that the modified Gompertz model accurately describes the conversion kinetics of soluble organic matter in this mixed-culture bioprocess.
The first-order with residual kinetic model also provided a good fit to the experimental data. The R2, RMSE, and AIC values for this model were 0.847, 0.204, and −38.915, respectively. Although both models performed well, the modified Gompertz model proved superior in terms of fit and accuracy, making it more suitable for describing soluble organic matter conversion. However, the first-order with residue model is simpler and has a lower AIC, which may make it preferable in cases where a more straightforward process description is required.
In the first-order with residue model, the biodegradation rate constant (KB of 0.267 d−1) indicates moderate biodegradation efficiency (effective but not rapid). This value suggests that approximately 26.7% of the biodegradable substrate is degraded per day, following exponential kinetics.
In contrast, the first-order, Logistic, Monod with growth, and Logarithmic kinetic models did not fit the experimental data well (R2 ≤ 0.753, RMSE ≥ 0.260, AIC ≥ −31.152). As a result, the kinetic parameters from these models were excluded from further discussion.
Figure 4 illustrates the concentration of soluble organic matter throughout the fermentation period. It compares the experimentally measured values with those predicted by the best-fit models.
The results of our study are consistent with previous research. The modified Gompertz model, an unstructured approach, is widely applied to describe substrate consumption, particularly in AF for hydrogen production [23,47]. This study underscores the model’s reliability as an alternative for characterizing substrate consumption in VFA production. Notably, the Rmax and λ values derived from the modified Gompertz model have not yet been reported for CWW or other substrates used in VFA production.
Boshagh et al. [23] highlighted various models for predicting substrate degradation, including Logistic, ADM1, Michaelis–Menten, Luedeking–Piret, Gompertz, Stover-Kincannon, first-order, Grau second-order, and Logarithmic. The selection of an appropriate model often depends on the dataset’s quality, level of detail, and the parameters analyzed. Similarly, Mu et al. [47] demonstrated that the modified Gompertz model effectively describes substrate utilization kinetics during hydrogen production from waste using mixed cultures.
Morais et al. [15] reported that the first-order and first-order with residual models effectively described the consumption of soluble organic matter during the AF of bovine slaughterhouse wastewater. The first-order with residual model, with an R2 of 0.963 and an AIC of −27.21, provided a superior fit by incorporating residual biodegradable organic matter. They determined a KB value of 0.26 ± 0.07 d−1, closely matching the value obtained in our study for CWW. Similarly, de Sousa e Silva [20] identified the first-order with residual kinetic model as the most accurate for dairy wastewater, achieving R2 values of 0.904 to 0.999 and AIC values between −69.82 and −22.77 for S/M ratios ranging from 0.8 to 1.9 gCOD/gVSS. The KB values ranged from 0.24 to 0.57 d−1. Higher S/M ratios (1.6 and 1.9 gCOD/gVSS) were associated with faster kinetics. Coelho et al. [18] also found the first-order with residual kinetic model most suitable for dairy wastewater. They reported an R2 of 0.999, an AIC of −25.950, and a KB value of 0.86 ± 0.31 d−1.
Nevertheless, our results differ slightly from other studies. Coelho et al. [19] investigated the AF of residual glycerol and observed that substrate consumption followed first-order kinetics. Among the three models tested—first-order, Monod with growth, and Logistic—the Logistic model provided the best fit, with the highest R2 and lowest NRMSE. For this substrate, the KB value was 0.05 ± 0.01 d−1. Additionally, Morais et al. [16] evaluated several models, including first-order, first-order with residual, Monod with growth, and Logistic, for the AF of swine wastewater but found that none adequately fit the experimental data.
To date, we have not found any KB values in the scientific literature for the AF of CWW aimed at VFA production.
The KB in AF is influenced by several factors related to process conditions, such as temperature, pH, and stirring and mixing rates. Additionally, the nature of the substrate—including its concentration, composition, and complexity—as well as the microbial composition play crucial roles in the kinetics of substrate degradation.

3.3.2. Modeling of VFA Production from CWW

Table 6 presents the estimated parameters, along with the R2, RMSE, and AIC values, for the models describing VFA production from CWW.
The results indicate that all tested models provided a satisfactory fit to the experimental VFA production data. The R2 values ranged from 0.836 to 0.926, RMSE values from 0.136 to 0.202, and AIC values from −49.315 to −39.229. Among these models, the exponential kinetic models—first-order, BPK, Fitzhugh, Monomolecular, and Transference—demonstrated the best fit. Notably, the BPK model achieved the highest R2 value (0.926) and the lowest RMSE (0.136), while the first-order model recorded the lowest AIC value (−49.315).
The Logistic, modified Gompertz, and Richards models also exhibited high R2 values (≥0.920). However, their RMSE (≥0.140) and AIC (≥−45.966) values were higher than those of the best-fit models. In contrast, the second-order and Cone kinetic models did not fit the experimental data adequately, and their kinetic parameters were excluded from further discussion.
For models with a good fit, the estimated KVFA values ranged from 0.239 to 0.297 d−1. The highest values were observed in the first-order and Monomolecular models. The Fitzhugh model estimated an n value of 1.239, while all models predicted a λ value of 0 d. The µm values ranged from 0.263 to 0.474 g/L·d, except for the estimate from the Richards model, which was omitted due to its significant deviation from the predictions of the other models.
Figure 5 compares the experimentally measured VFA production values with those predicted by the best-fit models.
The curve exhibits an inverted L-shape, characteristic of processes with a high production rate during the initial incubation days and either no or a very short lag phase. A similar curve was reported by Morais [21] for VFA production from slaughterhouse wastewater. The rapid increase in VFA production during the early days indicates high microbial activity and substrate availability. In our study, the inoculum had a high biomass concentration (VS/TS = 0.72) and underwent progressive adaptation to the substrate before the experiment, facilitating rapid fermentation. Additionally, the organic matter was readily available and easily biodegradable, enabling swift microbial assimilation and conversion.
Based on the adjusted curve (Figure 5), the VFA concentration at the end of the fermentation period was 1.564 gCOD/L. Within the first six days—half of the incubation period −86% of this concentration was achieved. Several biochemical and operational factors may have contributed to this accelerated VFA production, including the presence of easily degradable carbohydrates, the predominance of acidogenic bacteria in the microbial consortium, suitable pH and temperature conditions, the inhibition of methanogenic activity through thermal pretreatment, and a batch bioreactors operation.
Our findings align with previous studies on VFA production kinetics. Morais et al. [15] demonstrated that exponential kinetic models, including the Cone, first-order, and Fitzhugh models, effectively describe the VFA production from bovine slaughterhouse wastewater. Among these, the Cone model provided the best fit, with an R2 of 0.995 and an AIC of −37.08. The estimated KVFA value (0.30 ± 0.07 d−1) closely matched the value obtained in our study for CWW.
Similarly, de Sousa e Silva [20] evaluated various S/M ratios (0.8, 1.2, 1.6, and 1.9 gCOD/gVSS) for VFA production from dairy wastewater. They concluded that exponential models, particularly the Fitzhugh model (R2 ranging from 0.985 to 0.999 and AIC from −60.450 to −31.027), were best suited for this process. Among the tested S/M ratios, 0.8 gCOD/gVSS yielded the most favorable results, with KVFA values between 0.09 and 0.17 d−1.
For dairy wastewater, Coelho et al. [18] found that exponential-phase models, such as the first-order and Fitzhugh models, were suitable for simulating VFA production. The first-order model provided the best fit (R2 of 0.997 and AIC of −21.683), with an estimated KVFA of 0.60 ± 0.06 d−1. Another study by Coelho et al. [19] on the AF of residual glycerol concluded that the Fitzhugh and modified Gompertz models best described the cumulative VFA production. The Fitzhugh model achieved a lower NRMSE and an estimated KVFA of 0.61 ± 0.05 d−1.
In contrast, Morais et al. [16] found that logistic growth models, such as the Richards and Logistic models, were more suitable for representing VFA production from swine wastewater. The Richards model provided the best fit, with an R2 of 0.993 and an AIC of −41.072.
Research on modeling VFA production from cassava processing residues, particularly wastewater, remains scarce in the scientific literature. Undiandeye et al. [29] evaluated first-order, modified Gompertz, and dual pool models for medium-chain carboxylic acid production (caproic, heptanoic, and caprylic acids) from mixtures of cassava peel silage and wastewater. All models showed good fit (R2 > 0.974), but the dual pool model had the lowest RMSE (≤0.004) and AIC (≤−37.09).
Several studies agree on the kinetic model that best describes the VFA production curve during the AF of wastewater. However, the KVFA value results from a complex interaction of substrate characteristics, operating conditions, and microbial activity. Higher KVFA values indicate faster VFA production for a given substrate, as reflected in the inverted L-shape of the production curve. In contrast, lower KVFA values correspond to an elongated S-shaped production curve, signifying slower VFA generation.
In the Fitzhugh and Cone models, the form factor n indicates the presence (n ≥ 1) or absence (n < 1) of a lag phase, reflecting the affinity of microorganisms for the soluble substrate. In our study, the Fitzhugh model estimated an n value of 1.239 (Table 6), suggesting the presence of a lag phase. During this phase, hydrolytic bacteria break down particulate material into soluble compounds, which acidogenic and acetogenic bacteria utilize to initiate VFA production (exponential phase) [15]. However, the lag phase in our study was likely very brief, as the λ value estimated by the Monomolecular, Transference, modified Gompertz, Logistic, and Richards models was 0 days.
This brief lag phase can be attributed to the rapid adaptation of microorganisms to the established environmental and operational conditions, as well as the high biodegradability of CWW. The absence of a lag phase suggests that the microorganisms were already metabolically active and prepared to convert organic matter into VFAs. The physicochemical characterization of the substrate (Table 3) showed that 89.8% of the total COD was in soluble form, indicating that hydrolysis was not a limiting step in the AF of CWW.
The absence or reduction of the lag phase significantly enhances process efficiency and scalability. A rapid fermentation onset increases yields in less time, reduces retention periods, and improves overall efficiency. Additionally, accelerated VFA production can facilitate integration with downstream processes, such as bioplastics or bioenergy production. In large-scale systems, a fast substrate conversion shortens operating times and optimizes reactor capacity. However, accelerated AF may require monitoring and control strategies for pH and other parameters to maintain stability in continuous reactors.
The observed discrepancies between the n and λ values, as noted by Coelho et al. [18], may result from differences in the parameters used by each mathematical model. Advanced optimization tools for estimating kinetic parameters could yield more accurate results, particularly for λ, which may approach but not reach zero. According to Fang et al. [48], various algorithms can be used to estimate parameters in biochemical reaction simulations, such as particle swarm optimization (PSO). Bai et al. [49] modeled substrate degradation and the influence of pH on VFA production using waste-activated sludge through a modified ADM1. They demonstrated that the improved PSO algorithm was the most effective method for parameter estimation.
After the lag phase, the VFA production curve exhibits an exponential growth pattern (Figure 5) and stabilizes toward the end of the evaluation period. The shape of the production curve may reflect the biodegradability characteristics of the substrate, the production of inhibitory compounds, and the kinetics of biological processes [50]. Morais et al. [15] observed a similar kinetic behavior in bovine slaughterhouse wastewater, where the VFA production curve also followed an exponential pattern. This indicated high VFA productivity in the initial days of incubation, a short lag time, and consequently a high yield of acidogenic microorganisms. VFA production stabilizes when the biodegradable fraction of organic matter is depleted and only the recalcitrant fraction remains [15]. In our study, the initial concentration of carbohydrates—the primary organic compound of the substrate—was 1906 mg/L (Table 3). By the end of the experimental period (day 12), this concentration had decreased to 38.42 mg/L.
The Modified Gompertz, Logistic, Transference, and BPK models (Table 6) were used to estimate the μm. The highest µm value (0.474 gCOD/L·d) was estimated by the Transference model, followed by the BPK (0.382 gCOD/L·d), modified Gompertz (0.284 gCOD/L·d), and Logistic (0.263 gCOD/L·d) models. The Transference model provided the closest approximation to the experimentally determined maximum productivity (0.642 gCODVFA/L·d), demonstrating its applicability for estimating this parameter. Similarly, Morais et al. [15] reported μm values for bovine slaughterhouse wastewater ranging from 0.33 ± 0.05 to 0.46 ± 0.09 gCOD/L·d, obtained using the Logistic and Transference models, respectively.
Finally, the poor fit of some models selected to represent VFA production from CWW may be attributed to their failure to account for a decrease in product concentration, which renders them unsuitable for accurately describing the experimental data.

4. Conclusions

CWW is a promising substrate for VFA production through AF. The maximum VFA yield, 0.44 gCODVFA/gCOD, was achieved on the ninth day of fermentation, with VFAs primarily consisting of propionic, acetic, and butyric acids. The highest experimentally calculated productivity, 0.642 gCODVFA/L·d, occurred on the first day of fermentation.
The modified Gompertz and first-order with residual models provided the best fit for describing soluble organic matter consumption during the AF of CWW. The first-order kinetic model with residual estimated a KB value of 0.267 d−1. Additionally, the first-order and BPK models accurately described the VFA production data, with the selected models estimating a KVFA value of 0.297 d−1, a λ value of 0 d, and a µm value of 0.474 gCOD/L·d. The kinetic parameters derived from these models can guide the design of new acidogenic reactors and the development of strategies for controlling and simulating VFA production using CWW as a low-cost substrate.

Author Contributions

Conceptualization, L.M.S.-L., J.A.R.-V., and H.R.-M.; methodology, L.M.S.-L., J.A.R.-V., and H.R.-M.; validation, L.M.S.-L.; formal analysis, L.M.S.-L.; investigation, L.M.S.-L.; resources, L.M.S.-L.; data curation, L.M.S.-L.; writing—original draft preparation, L.M.S.-L.; writing—review and editing, J.A.R.-V. and H.R.-M.; visualization, L.M.S.-L.; supervision, J.A.R.-V. and H.R.-M.; project administration, H.R.-M.; funding acquisition, H.R.-M. and L.M.S.-L. All authors have read and agreed to the published version of the manuscript.

Funding

This research was funded by the Universidad del Valle (project CI-21237) and the Ministerio de Ciencia, Tecnología e Innovación de Colombia—MinCiencias (convocatoria No. 933—2023).

Data Availability Statement

All data generated or analyzed during this study are included in this published article.

Conflicts of Interest

The authors declare no conflicts of interest.

References

  1. Howeler, R.H.; Oates, C.G.; Costa Allem, A. Strategic Environmental Assessment. An Assessment of the Impact of Cassava Production and Processing on the Environment and Biodiversity. 2001. Volume 5. Available online: http://ciat-library.ciat.cgiar.org/Articulos_Ciat/biblioteca/Strategic_environmental_assessment.pdf (accessed on 25 March 2025).
  2. Torres, P.; Rodríguez, J.A.; Uribe, I.E. Tratamiento de Aguas Residuales Del Proceso de Extracción de Almidón de Yuca En Filtro Anaerobio: Influencia Del Medio de Soporte. Sci. Et Tech. Año IX 2003, 3, 75–80. [Google Scholar]
  3. Pérez Vidal, A.; Torres Lozada, P.; Silva Leal, J. Tratamiento Anaerobio de Las Aguas Residuales Del Proceso de Extracción de Almidón de Yuca. Optimización de Variables Ambientales y Operacionales. Dyna 2009, 76, 139–148. [Google Scholar]
  4. Sarria Núñez, H. Contaminación y Toxicidad de Las Aguas Residuales de Las Rallanderías Del Norte Del Cauca, Colombia. Ph.D. Thesis, Universidad Complutense de Madrid, Madrid, Spain, 2011. [Google Scholar]
  5. Torres, P.; Rodríguez, J.; Rojas, O. Extracción de Almidón de Yuca. Manejo Integral y Control de La Contaminación Hídrica. Livest. Res. Rural. Dev. 2005, 17, 1–11. [Google Scholar]
  6. Hasan, S.D.M.; Giongo, C.; Fiorese, M.L.; Gomes, S.D.; Ferrari, T.C.; Savoldi, T.E. Volatile Fatty Acids Production from Anaerobic Treatment of Cassava Waste Water: Effect of Temperature and Alkalinity. Environ. Technol. 2015, 36, 2637–2646. [Google Scholar] [CrossRef] [PubMed]
  7. Bhatt, A.H.; Ren, Z.; Tao, L. Value Proposition of Untapped Wet Wastes: Carboxylic Acid Production through Anaerobic Digestion. iScience 2020, 23, 101221. [Google Scholar] [CrossRef]
  8. de Sousa e Silva, A.; Morais, N.W.S.; Coelho, M.M.H.; Pereira, E.L.; dos Santos, A.B. Potentialities of Biotechnological Recovery of Methane, Hydrogen and Carboxylic Acids from Agro-Industrial Wastewaters. Bioresour. Technol. Rep. 2020, 10, 100406. [Google Scholar] [CrossRef]
  9. Li, W.W.; Yu, H.Q. From Wastewater to Bioenergy and Biochemicals via Two-Stage Bioconversion Processes: A Future Paradigm. Biotechnol. Adv. 2011, 29, 972–982. [Google Scholar] [CrossRef]
  10. Atasoy, M.; Owusu-Agyeman, I.; Plaza, E.; Cetecioglu, Z. Bio-Based Volatile Fatty Acid Production and Recovery from Waste Streams: Current Status and Future Challenges. Bioresour. Technol. 2018, 268, 773–786. [Google Scholar] [CrossRef]
  11. Trancone, G.; Policastro, G.; Spasiano, D.; Race, M.; Parrino, F.; Fratino, U.; Fabbricino, M.; Pirozzi, F. Treatment of Concrete Waste from Construction and Demolition Activities: Application of Organic Acids from Continuous Dark Fermentation in Moving Bed Biofilm Reactors. Chem. Eng. J. 2025, 505, 159536. [Google Scholar] [CrossRef]
  12. Trancone, G.; Spasiano, D.; Race, M.; Luongo, V.; Petrella, A.; Pirozzi, F.; Fratino, U.; Piccinni, A.F. A Combined System for Asbestos-Cement Waste Degradation by Dark Fermentation and Resulting Supernatant Valorization in Anaerobic Digestion. Chemosphere 2022, 300, 134500. [Google Scholar] [CrossRef]
  13. Li, W.; Huang, J.; Shi, Z.; Han, W.; Lü, T.; Lin, Y.; Meng, J.; Xu, X.; Hou, P. Machine Learning Enabled Prediction and Process Optimization of VFA Production from Riboflavin-Mediated Sludge Fermentation. Front. Environ. Sci. Eng. 2023, 17, 135. [Google Scholar] [CrossRef]
  14. Amorim, N.C.S.; Amorim, E.L.C.; Kato, M.T.; Florencio, L.; Gavazza, S. The Effect of Methanogenesis Inhibition, Inoculum and Substrate Concentration on Hydrogen and Carboxylic Acids Production from Cassava Wastewater. Biodegradation 2018, 29, 41–58. [Google Scholar] [CrossRef] [PubMed]
  15. Morais, N.W.S.; Coelho, M.M.H.; Ferreira, T.J.T.; Pereira, E.L.; Leitão, R.C.; dos Santos, A.B. A Kinetic Study on Carboxylic Acids Production Using Bovine Slaughterhouse Wastewater: A Promising Substrate for Resource Recovery in Biotechnological Processes. Bioprocess Biosyst. Eng. 2021, 44, 271–282. [Google Scholar] [CrossRef]
  16. Morais, N.W.S.; Coelho, M.M.H.; Silva, A.d.S.e.; Pereira, E.L.; Leitão, R.C.; dos Santos, A.B. Kinetic Modeling of Anaerobic Carboxylic Acid Production from Swine Wastewater. Bioresour. Technol. 2020, 297, 122520. [Google Scholar] [CrossRef]
  17. Atasoy, M.; Scott, W.T.; Regueira, A.; Mauricio-Iglesias, M.; Schaap, P.J.; Smidt, H. Biobased Short Chain Fatty Acid Production—Exploring Microbial Community Dynamics and Metabolic Networks through Kinetic and Microbial Modeling Approaches. Biotechnol. Adv. 2024, 73, 108363. [Google Scholar] [CrossRef]
  18. Coelho, M.M.H.; Morais, N.W.S.; Pereira, E.L.; Leitão, R.C.; dos Santos, A.B. Potential Assessment and Kinetic Modeling of Carboxylic Acids Production Using Dairy Wastewater as Substrate. Biochem. Eng. J. 2020, 156, 107502. [Google Scholar] [CrossRef]
  19. Coelho, M.M.H.; Morais, N.W.S.; Ferreira, T.J.T.; Silva, F.S.S.; Pereira, E.L.; dos Santos, A.B. Carboxylic Acids Production Using Residual Glycerol as a Substrate in Anaerobic Fermentation: A Kinetic Modeling Study. Biomass Bioenergy 2020, 143, 105874. [Google Scholar] [CrossRef]
  20. de Sousa e Silva, A.; Tavares Ferreira, T.J.; Sales Morais, N.W.; Lopes Pereira, E.; Bezerra dos Santos, A. S/X Ratio Impacts the Profile and Kinetics of Carboxylic Acids Production from the Acidogenic Fermentation of Dairy Wastewater. Environ. Pollut. 2021, 287, 117605. [Google Scholar] [CrossRef]
  21. Morais, N.W.S. Recuperacao de Subprodutos (Metano e Ácidos Carboxílicos) Em Sistemas Anaeróbios Tratando Residuos Agroindustriais. Master’s Thesis, Universidade Federal do Ceará, Fortaleza, Brazil, 2019. [Google Scholar]
  22. Policastro, G.; Luongo, V.; Frunzo, L.; Fabbricino, M. A Comprehensive Review of Mathematical Models of Photo Fermentation. Crit. Rev. Biotechnol. 2021, 41, 628–648. [Google Scholar] [CrossRef]
  23. Boshagh, F.; Rostami, K.; van Niel, E.W.J. Application of Kinetic Models in Dark Fermentative Hydrogen Production–A Critical Review. Int. J. Hydrogen Energy 2022, 47, 21952–21968. [Google Scholar] [CrossRef]
  24. Mu, Y.; Wang, G.; Yu, H.Q. Kinetic Modeling of Batch Hydrogen Production Process by Mixed Anaerobic Cultures. Bioresour. Technol. 2006, 97, 1302–1307. [Google Scholar] [CrossRef] [PubMed]
  25. Membere, E.; Sallis, P. Effect of Temperature on Kinetics of Biogas Production from Macroalgae. Bioresour. Technol. 2018, 263, 410–417. [Google Scholar] [CrossRef]
  26. Ramos, R.E.; Márquez, M.C. Volatile Fatty Acids from Household Food Waste: Production and Kinetics. ChemEngineering 2024, 8, 84. [Google Scholar] [CrossRef]
  27. Infantes, D.; Gonzáles del Campo, A.; Villaseñor, J.; Fernández, F.J. Kinetic Model and Study of the Influence of PH, Temperature and Undissociated Acids on Acidogenic Fermentation. Biochem. Eng. J. 2012, 66, 66–72. [Google Scholar] [CrossRef]
  28. Trisakti, B.; Turmuzi, M.; Taslim, T.; Irvan, I. Determination of Kinetic Models in Acidogenesis Process of Palm Oil Mill Effluent. Ecol. Eng. Environ. Technol. 2024, 25, 118–125. [Google Scholar] [CrossRef]
  29. Undiandeye, J.; Kiman, S.; Abubakar, A.M.; Dahunsi, S.O. Medium Chain Carboxylate Production from Cassava Wastes Pretreated by Ensiling. Biofuels Bioprod. Biorefin. 2023, 17, 933–943. [Google Scholar] [CrossRef]
  30. Mañunga, T. Acople Entre Un Reactor Anaerobio de Medio Suspendido y Un Reactor Anaerobio de Crecimiento Adherido Para La Producción de Hidrógeno y Metano a Partir de Agua Residual Del Proceso de Extracción de Almidón de Yuca. Ph.D. Thesis, Universidad del Valle, Cali, Colombia, 2019. [Google Scholar]
  31. Sanchez-Ledesma, L.M.; Rodríguez-Victoria, J.A.; Ramírez-Malule, H. Effect of Fermentation Time, PH, and Their Interaction on the Production of Volatile Fatty Acids from Cassava Wastewater. Water 2024, 16, 1514. [Google Scholar] [CrossRef]
  32. Sanchez-Ledesma, L.M.; Rodríguez-Victoria, J.A.; Ramírez-Malule, H. Acidogenic Fermentation of Cassava Wastewater: Effect of the Substrate-to-Microorganism Ratio and Temperature on Volatile Fatty Acids Production. Water 2024, 16, 3344. [Google Scholar] [CrossRef]
  33. Bolaji, I.O.; Dionisi, D. Acidogenic Fermentation of Vegetable and Salad Waste for Chemicals Production: Effect of PH Buffer and Retention Time. J. Environ. Chem. Eng. 2017, 5, 5933–5943. [Google Scholar] [CrossRef]
  34. APHA; AWWA; WEF. Standard Methods for the Examination of Water and Wastewater; American Public Health Association: Washington, DC, USA, 2005. [Google Scholar]
  35. Dubois, M.; Gilles, K.; Hamilton, J.K.; Rebers, P.A.; Smith, F. A Colorimetric Method for the Determination of Sugars. Anal. Chem. 1956, 28, 350–356. [Google Scholar] [CrossRef]
  36. DiLallo, R.; Albertson, O. Volatile Acids by Direct Titration. Water Pollut. Control. Fed. 1961, 33, 356–365. [Google Scholar]
  37. Karne, H.; Bendre, A.; Singh, A. Mathematical Modelling of a Pilot Scale Biogas Plant. Mater. Today Proc. 2023. [Google Scholar] [CrossRef]
  38. Pererva, Y.; Miller, C.D.; Sims, R.C. Existing Empirical Kinetic Models in Biochemical Methane Potential (BMP) Testing, Their Selection and Numerical Solution. Water 2020, 12, 1831. [Google Scholar] [CrossRef]
  39. Cheah, Y.K.; Vidal-Antich, C.; Dosta, J.; Mata-Álvarez, J. Volatile Fatty Acid Production from Mesophilic Acidogenic Fermentation of Organic Fraction of Municipal Solid Waste and Food Waste under Acidic and Alkaline PH. Environ. Sci. Pollut. Res. 2019, 26, 35509–35522. [Google Scholar] [CrossRef] [PubMed]
  40. Niz, M.Y.K.; Formagini, E.L.; Boncz, M.À.; Paulo, P.L. Acidogenic Fermentation of Cassava Wastewater for Volatile Fatty Acids Production. Int. J. Environ. Waste Manag. 2020, 25, 245–261. [Google Scholar] [CrossRef]
  41. Simonetti, S.; Saptoro, A.; Martín, C.F.; Dionisi, D. Product Concentration, Yield and Productivity in Anaerobic Digestion to Produce Short Chain Organic Acids: A Critical Analysis of Literature Data. Processes 2020, 8, 1538. [Google Scholar] [CrossRef]
  42. Liu, H.; Xie, L.; Chen, Y.G.; Zhou, Q. VFAs Production Potential of Brewery Industry Wastewater and Starch Wastewater. Adv. Mat. Res. 2013, 777, 225–231. [Google Scholar] [CrossRef]
  43. Lucas, S.D.M.; Peixoto, G.; Mockaitis, G.; Zaiat, M.; Gomes, S.D. Energy Recovery from Agro-Industrial Wastewaters through Biohydrogen Production: Kinetic Evaluation and Technological Feasibility. Renew. Energy 2015, 75, 496–504. [Google Scholar] [CrossRef]
  44. Wang, L.; Hao, J.; Wang, C.; Li, Y.; Yang, Q. Carbohydrate-to-Protein Ratio Regulates Hydrolysis and Acidogenesis Processes during Volatile Fatty Acids Production. Bioresour. Technol. 2022, 355, 127266. [Google Scholar] [CrossRef]
  45. Amorim, N.C. dos S. Produção de Ácido Capróico Associado á Produção de Hidrogênio Utilizando a Manipueira. Ph.D. Thesis, Universidade Federal de Pernambuco, Recife, Brazil, 2018. [Google Scholar]
  46. Sarkar, O.; Rova, U.; Christakopoulos, P.; Matsakas, L. Ethanol Addition Promotes Elongation of Short-Chain Fatty Acids to Medium-Chain Fatty Acids Using Brewery Spent Grains as Substrate. J. Environ. Chem. Eng. 2021, 9, 105990. [Google Scholar] [CrossRef]
  47. Mu, Y.; Yu, H.Q.; Wang, G. A Kinetic Approach to Anaerobic Hydrogen-Producing Process. Water Res. 2007, 41, 1152–1160. [Google Scholar] [CrossRef] [PubMed]
  48. Fang, F.; Ni, B.J.; Yu, H.Q. Estimating the Kinetic Parameters of Activated Sludge Storage Using Weighted Non-Linear Least-Squares and Accelerating Genetic Algorithm. Water Res. 2009, 43, 2595–2604. [Google Scholar] [CrossRef] [PubMed]
  49. Bai, J.; Liu, H.; Yin, B.; Ma, H. Modeling of Enhanced VFAs Production from Waste Activated Sludge by Modified ADM1 with Improved Particle Swarm Optimization for Parameters Estimation. Biochem. Eng. J. 2015, 103, 22–31. [Google Scholar] [CrossRef]
  50. Labatut, R.A.; Angenent, L.T.; Scott, N.R. Biochemical Methane Potential and Biodegradability of Complex Organic Substrates. Bioresour. Technol. 2011, 102, 2255–2264. [Google Scholar] [CrossRef]
Figure 1. Final VFA concentration and yield by AF of CWW.
Water 17 00991 g001
Figure 2. Productivity of VFAs from CWW.
Water 17 00991 g002
Figure 3. Distribution of VFA produced in AF of CWW.
Water 17 00991 g003
Figure 4. Concentration of soluble organic matter, as measured experimentally and predicted by kinetic models.
Water 17 00991 g004
Figure 5. Comparison of experimentally measured VFA production in AF of CWW with values predicted by best-fit models.
Water 17 00991 g005
Table 1. The kinetic models selected to describe the consumption of soluble organic matter during the AF of CWW.
Kinetic ModelKinetic Model EquationDescription of Variables
First-order S t = S 0 e x p K B t St: concentration of soluble organic matter over time (gCOD/L)
S0: initial soluble organic matter concentration (gCOD/L)
KB: soluble substrate degradation rate constant (d−1)
t: fermentation time (d)
Sr: residual soluble organic matter concentration (gCOD/L)
X0: initial biomass concentration (gVSS/L)
KL: Logistic model constant (L/gCOD·d)
µmax: maximum microbial growth rate (d−1)
Ks: saturation constant/Monod constant (gCOD/L)
X: final biomass concentration (gVSS/L)
Rmax: maximum substrate conversion rate (gCOD/L·d)
Smax: maximum substrate conversion (gCOD/L)
λ: lag phase time (d)
First-order with residual S t = S r + S 0 S r e x p K B t
Logistic S t = S 0 + X 0 1 + X 0 S 0 e x p K L S 0 + X 0 t
K L = µ m a x K s
K B = K L X 0
Monod with growth S t = e x p S 0 + X 0 + K s l n X X 0 S 0 + X 0 µ m a x t + K s l n S 0 K s
Logarithmic S t = S 0 + X 0 1 e x p R m a x t
Modified Gompertz S t = S 0 S m a x e x p e x p R m a x e S m a x λ t + 1
Table 2. The kinetic models selected for describing VFA production during the AF of CWW.
Kinetic ModelKinetic Model EquationDescription of Variables
First-order V F A t = V F A f 1 e x p K V F A t VFAt: VFA concentration over time (gCOD/L)
VFAf: final concentration of VFAs (gCOD/L)
KVFA: first-order VFA production rate constant (d−1)
t: fermentation time (d)
K”VFA: second-order VFA production rate constant (L/gCOD·d)
n: shape constant
λ: lag phase time (d)
µm: maximum VFA productivity (gCOD/L·d)
e: Euler number
v: constant of the Richards model
m: constant of the BPK model
t0: time when VFA production rate is maximum (d)
Second-order V F A t = K V F A V F A f 2 t 1 + K V F A V F A f t
Fitzhugh V F A t = V F A f 1 e x p K V F A t n
Cone V F A t = V F A f 1 + K V F A t n
Monomolecular V F A t = V F A f 1 e x p K V F A t λ
Modified Gompertz V F A t = V F A f e x p e x p µ m e V F A f λ t + 1
Logistic V F A t = V F A f 1 + e x p 4 µ m λ t V F A f + 2
Transference V F A t = V F A f 1 e x p µ m t λ V F A f
Richards V F A t = V F A f 1 + v . e x p 1 + v . e x p µ m V F A f 1 + v 1 + 1 v λ t 1 v
BPK V F A t = V F A f 1 e x p m 1 t t 0 1 m
μ m = V F A f e x p m 1 m e . m . t 0
K V F A = e x p m 1 m e . m . t 0
Table 3. Physicochemical characterization of CWW used as substrate in experimental setup.
ParameterUnitsValue
pH---4.21
TCODmg/L4975.00
SCODmg/L4470.00
Total VFAsmgHAc/L1187.58
Carbohydratesmg/L1906.00
Total alkalinitymgCaCO3/L0
Bicarbonate alkalinitymgCaCO3/L0
Total aciditymgCaCO3/L759.54
TSmg/L4705.00
VSmg/L3450.00
Ammonia nitrogenmgNH4+/L 66.25
OrthophosphatesmgPO43−/L 1.55
Table 4. Concentration of total and volatile solids in inoculum utilized in experimental setup.
ParameterUnitsValue
TSg/L54.11
VSg/L38.98
VS/TS---0.72
Table 5. The kinetic parameters estimated for the conversion of soluble organic matter in the AF of CWW.
Kinetic ModelParameters and Fitting CriteriaValue
First-order K B (d−1)0.068
R 2 0.724
R M S E 0.276
A I C −31.152
First-order with residual K B (d−1)0.267
R 2 0.847
R M S E 0.204
A I C −38.915
Logistic K L (L/gCOD·d)0.011
K B (d−1)0.060
R 2 0.681
R M S E 0.296
A I C −29.281
Monod with Growth K s (gCOD/L)2.805
X (gVSS/L)5.423
µ m a x (d−1)0.019
R 2 0.753
R M S E 0.260
A I C −26.322
Logarithmic R m a x (gCOD/L·d)0.025
R 2 0.509
R M S E 0.367
A I C −23.683
Modified Gompertz S m a x (gCOD/L)1.412
R m a x (gCOD/L·d)0.396
λ (d)0.929
R 2 0.885
R M S E 0.177
A I C −36.291
Table 6. Kinetic parameters estimated by modeling of VFA production in AF of CWW.
Kinetic ModelParameters and Fitting CriteriaValue
First-order K V F A (d−1)0.297
R 2 0.925
R M S E 0.137
A I C −49.315
Second-order K V F A (L/g·d)0.402
R 2 0.836
R M S E 0.202
A I C −39.229
Fitzhugh K V F A (d−1)0.240
n1.239
R 2 0.925
R M S E 0.137
A I C −47.479
Cone K V F A (d−1)0.432
n1.713
R 2 0.892
R M S E 0.164
A I C −41.826
Monomolecular K V F A (d−1)0.297
λ (d)0
R 2 0.925
R M S E 0.137
A I C −46.479
Modified Gompertz µ m (g/L·d)0.284
λ (d)0
R 2 0.922
R M S E 0.140
A I C −45.966
Logistic µ m (g/L·d)0.263
λ (d)0
R 2 0.920
R M S E 0.141
A I C −45.648
Transference µ m (g/L·d)0.474
λ (d)0
R 2 0.925
R M S E 0.137
A I C −46.479
Richards µ m (g/L·d)0.028
λ (d)0
v0.039
R 2 0.922
R M S E 0.140
A I C −42.489
BPKm0.924
t 0 (d)0.319
µ m (g/L·d)0.382
K V F A (d−1)0.239
R 2 0.926
R M S E 0.136
A I C −46.718
Disclaimer/Publisher’s Note: The statements, opinions and data contained in all publications are solely those of the individual author(s) and contributor(s) and not of MDPI and/or the editor(s). MDPI and/or the editor(s) disclaim responsibility for any injury to people or property resulting from any ideas, methods, instructions or products referred to in the content.

