Article

Comparative Assessment of Chemical and Isotopic Composition of Geothermal Fluids in the Eastern Part of the Büyük Menderes Graben (Western Türkiye)

1
Department of Geological Engineering, Pamukkale University, Denizli 20160, Türkiye
2
Department of Geological Engineering, Ankara University, Ankara 06100, Türkiye
3
Kocaer Enerji A.Ş., Aliağa, Izmir 35880, Türkiye
*
Author to whom correspondence should be addressed.
Water 2025, 17(7), 961; https://doi.org/10.3390/w17070961
Submission received: 25 January 2025 / Revised: 18 March 2025 / Accepted: 18 March 2025 / Published: 25 March 2025

Abstract

:
In this study, we comparatively discuss chemical and isotopic characteristics of thermal waters from several geothermal fields within the eastern part of the Büyük Menderes graben, Western Türkiye. The studied thermal waters with a wide range of temperature (33 to 242 °C) and pH value (6.10 to 9.38) show water types varying from Ca-Mg-HCO3-SO4 to Na-HCO3-SO4. The chemical composition of waters is controlled by several processes, which include temperature, circulation depth, extent of water–rock interaction, dissolution/precipitation, mixing, cation exchange and microbial activity. All thermal waters are of meteoric origin and generally have deep circulation. δ13C data indicate that marine limestone and mantle-derived CO2 are the major sources of carbon in thermal waters and δ34S values imply that the sulfate is originated from the Neogene gypsums. At discharge temperatures, all thermal waters are saturated with various carbonate, silica and clay minerals, which is supported by the XRD analysis of scaling materials. The REY composition of the scaling samples showed that the limestone is the source rock for the rare earth elements. Thermal waters with a positive 18O shift of 2.7 to 4.6‰ have reservoir temperatures of 170–245 °C, whilst other waters with a shift of <1‰ have reservoir temperatures in the range of 79 to 166 °C. Regarding the distribution of temperature, electricity production seems to be more suitable in the western part of the region, although relatively low-temperature areas in the east also look promising.

1. Introduction

The investigation of renewable energy sources has become a major research issue due to environmental considerations and the instability of fossil fuel prices. In this context, geothermal resources in regions of intense tectonomagmatic activity have attracted significant attention to producing geothermal energy [1,2]. Geothermal fields occur across the world in a variety of geological settings and each geothermal system may have distinct characteristics which are reflected in the chemistry of thermal fluids and their potential applications [3]. The tectonic setting of Türkiye is represented by protracted seismic activity as manifested by a number of devastating earthquakes [4,5,6,7]. The seismic unrest in Anatolia is closely related to the collision between the Eurasian and the Arabian Plates [8]. This continental deformation has given rise to the formation of several major tectonic structures such as the North and East Anatolian fault zones and the Aegean horst–graben system [9]. As a part of the Alpine–Himalayan orogenic belt, Türkiye has experienced a complex tectonomagmatism since the Neogene, which has caused extensive geothermal activity as manifested by quite a number of geothermal areas across the country [10,11,12]. Mineral Research and Exploration Institute of Turkey (MTA) opened a total of 671 wells with a depth of 472,000 m from which 5000 MWt of heat energy has been produced [13]. The total geothermal electricity installation capacity in Türkiye is around 1691 MWe [14,15].
For the last three decades, Turkey has struggled to increase the rate of renewable energy sources in electricity production [16]. Especially since 2007, private companies have made significant progress with the acceleration of investments in this sector. However, despite Turkey being among the top five countries in the world in electricity production from geothermal energy and direct use, the country has not yet reached the desired level and only 1.54% of total energy consumption (2.75% of renewable energy sources) is met by the geothermal energy [14].
Western Anatolia comprises 78% of Turkey’s geothermal potential [8]. E–W tending graben systems in Western Anatolia are the result of the transitioning of compressional tectonics to the extensional regime during the Late Cenozoic time [7,17,18]. The NW–SE extending Denizli Graben (Denizli Basin) lying in the eastern termination of the Büyük Menderes Graben hosts several thermal waters with temperatures in the range of 29 to 242 °C [11,19]. Chemical and isotope compositions of thermal fluids in the Pamukkale, Karahayıt, Gölemezli, Yenicekent, Tekkehamam and Kızıldere geothermal fields in the Denizli Basin were the subject of intense research over the last decade [20,21,22,23,24,25,26]. In these studies, the evolution and reservoir temperatures of thermal waters were examined using various geochemical models. The Pamukkale area, only 16 km from the center of Denizli city, is home to world-famous travertines and a historical pool, so-called Cleopatra pool, the last Hellenistic queen of ancient Egypt. The increasing demand for hot waters that are utilized for spa centers and greenhouse applications has allowed the discovery of new geothermal fields and the drilling of additional wells.
In the present study, we sampled waters of one thermal spring and nine thermal wells in the Denizli Basin. Among these, waters of two high-temperature wells (97 and 98 °C) in the Tosunlar field, newly drilled wells in Karahayıt (KH-4) and Yenicekent (YK-5), were sampled for the first time. The aim of this study is to examine isotopic and geochemical features, and processes affecting the chemistry and mineral equilibrium of the thermal fluids in the Denizli Basin. The isotopic analyses include oxygen, hydrogen, sulfur and carbon (13C/12C and 14C) contents. Mineral compositions and REE concentrations of crust (scaling) samples are evaluated comparatively with water counterparts. Comparison of our chemical and stable isotope data with the Tekkehamam and Kızıldere geothermal fields, located at the western end of the Denizli basin, and with the geochemistry data compiled from previous studies will bring about a better understanding of the water–rock interaction process that controlled the geochemistry of thermal waters in the basin. We believe that this work, which used a multiple fluid–mineral equilibria approach with a variety of geochemical and isotopic data, will be very beneficial for further studies.

2. Geological and Hydrogeological Setting
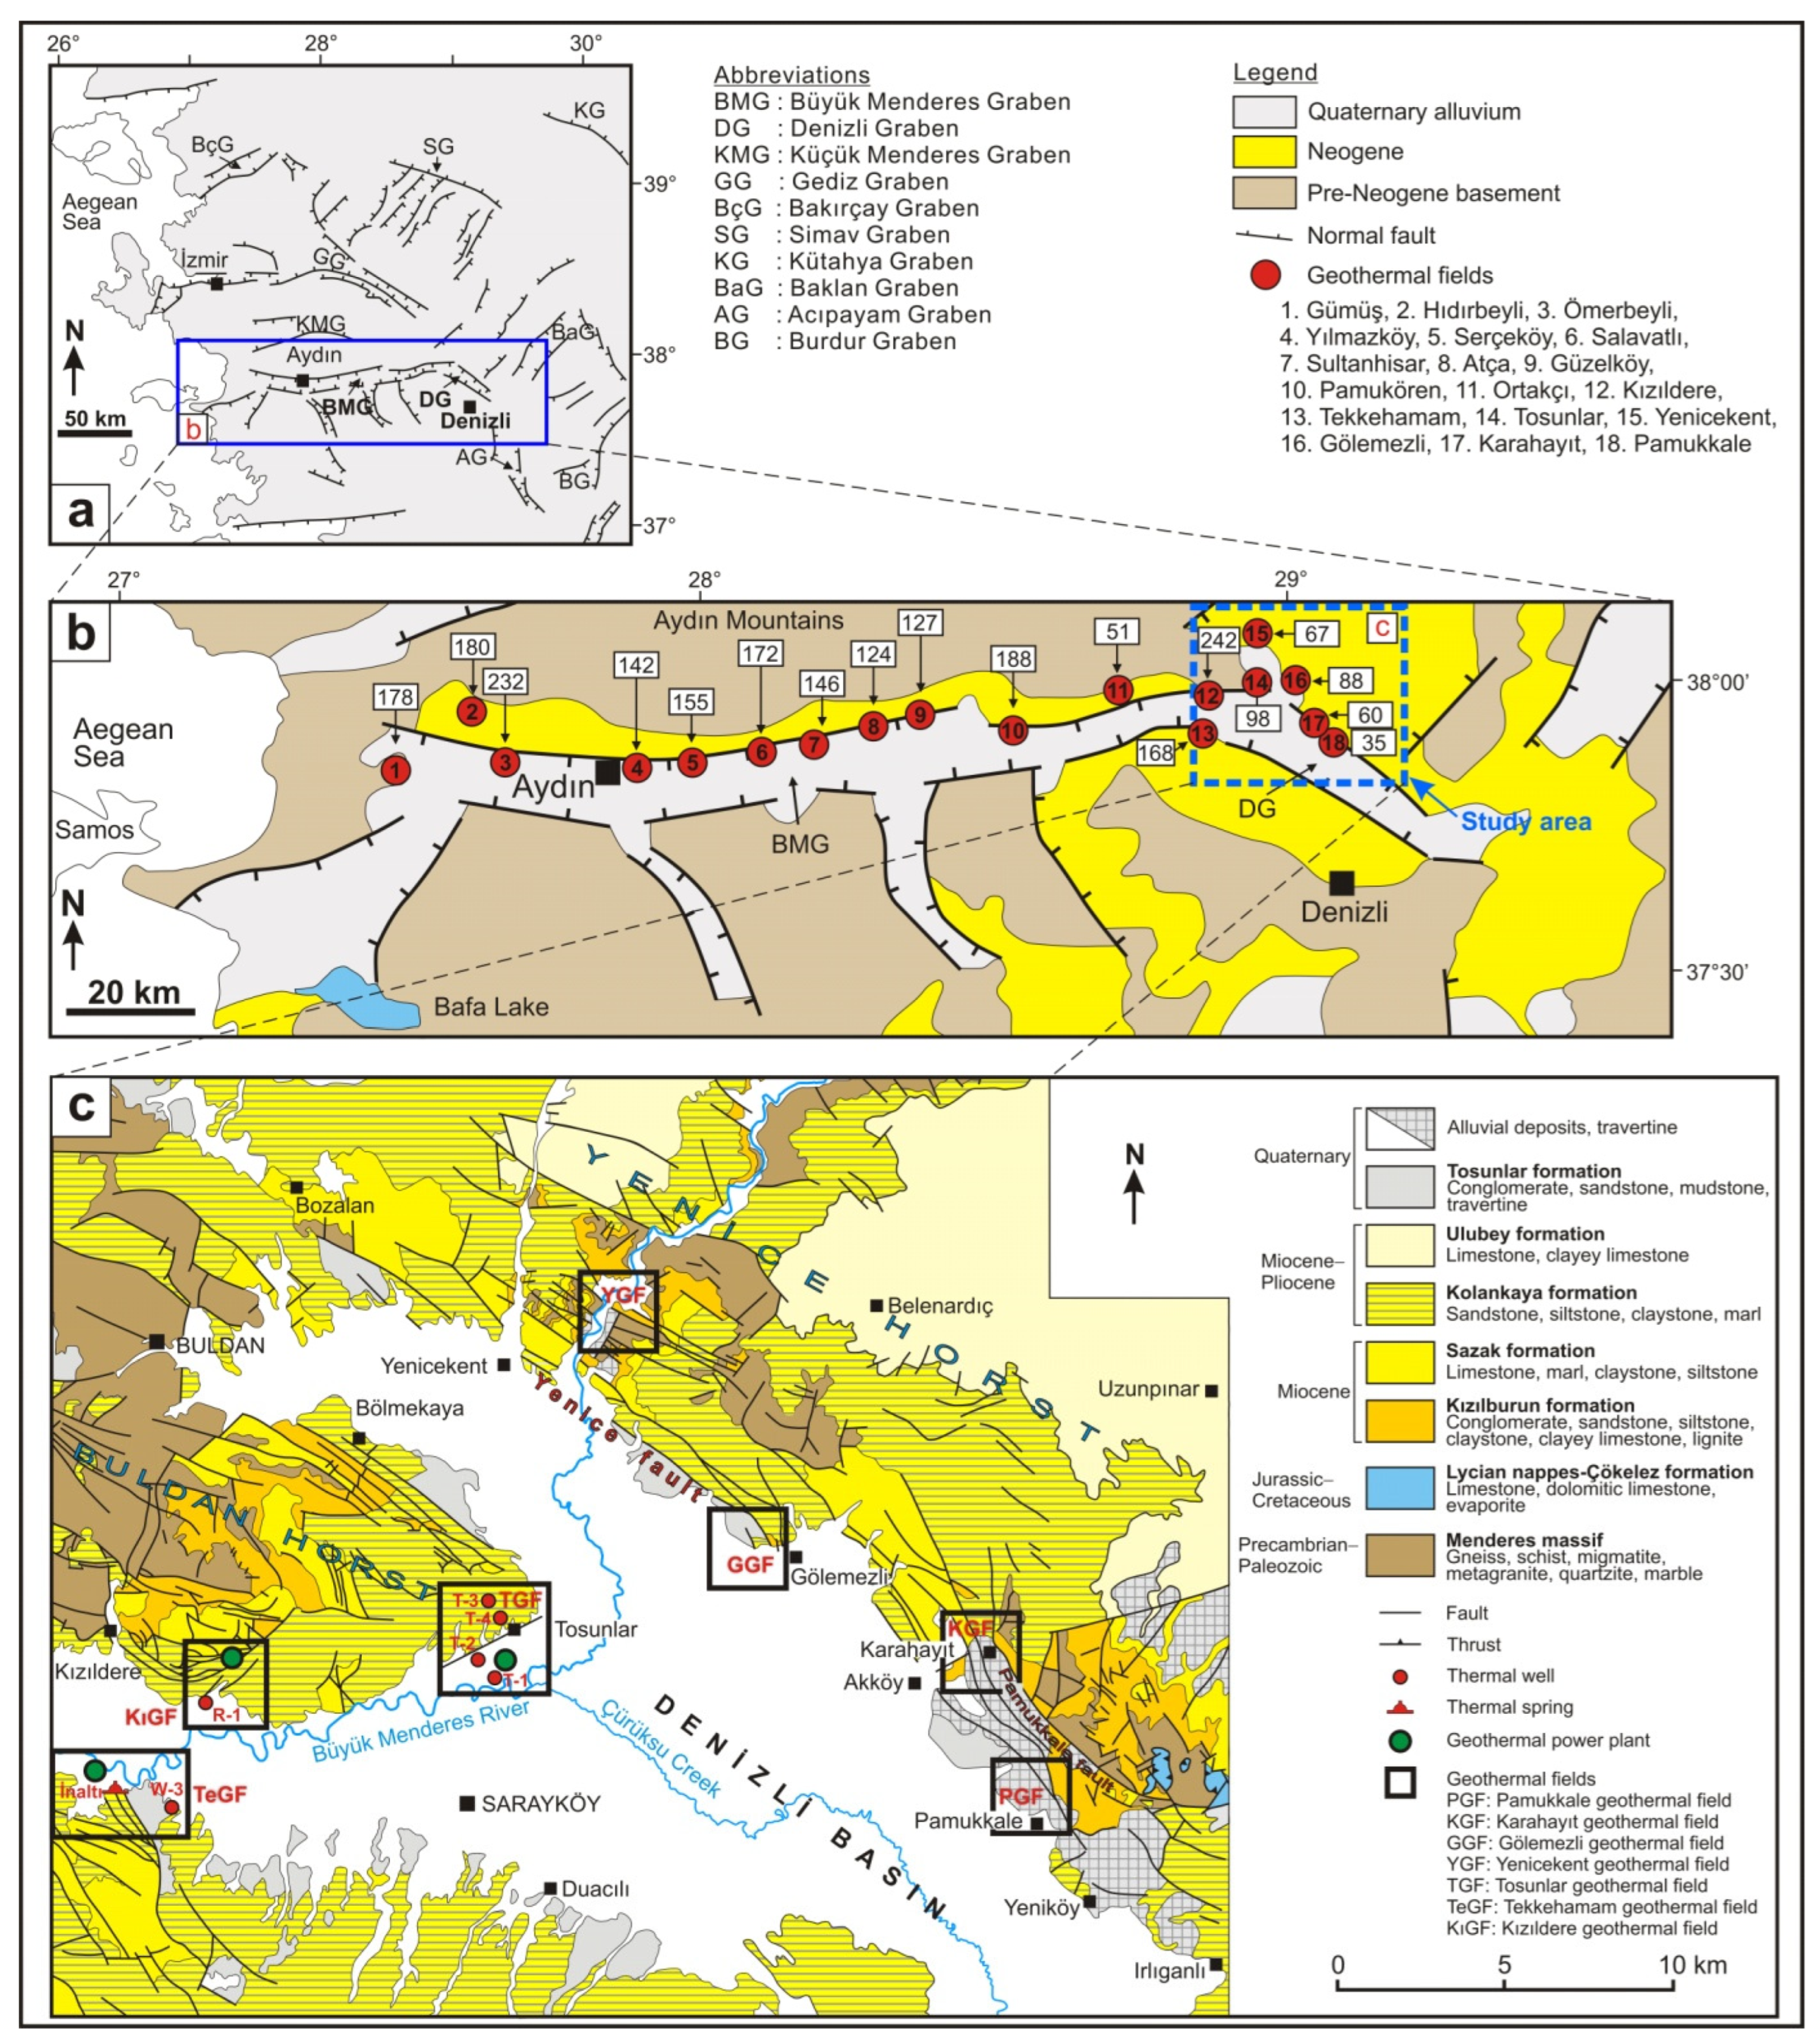
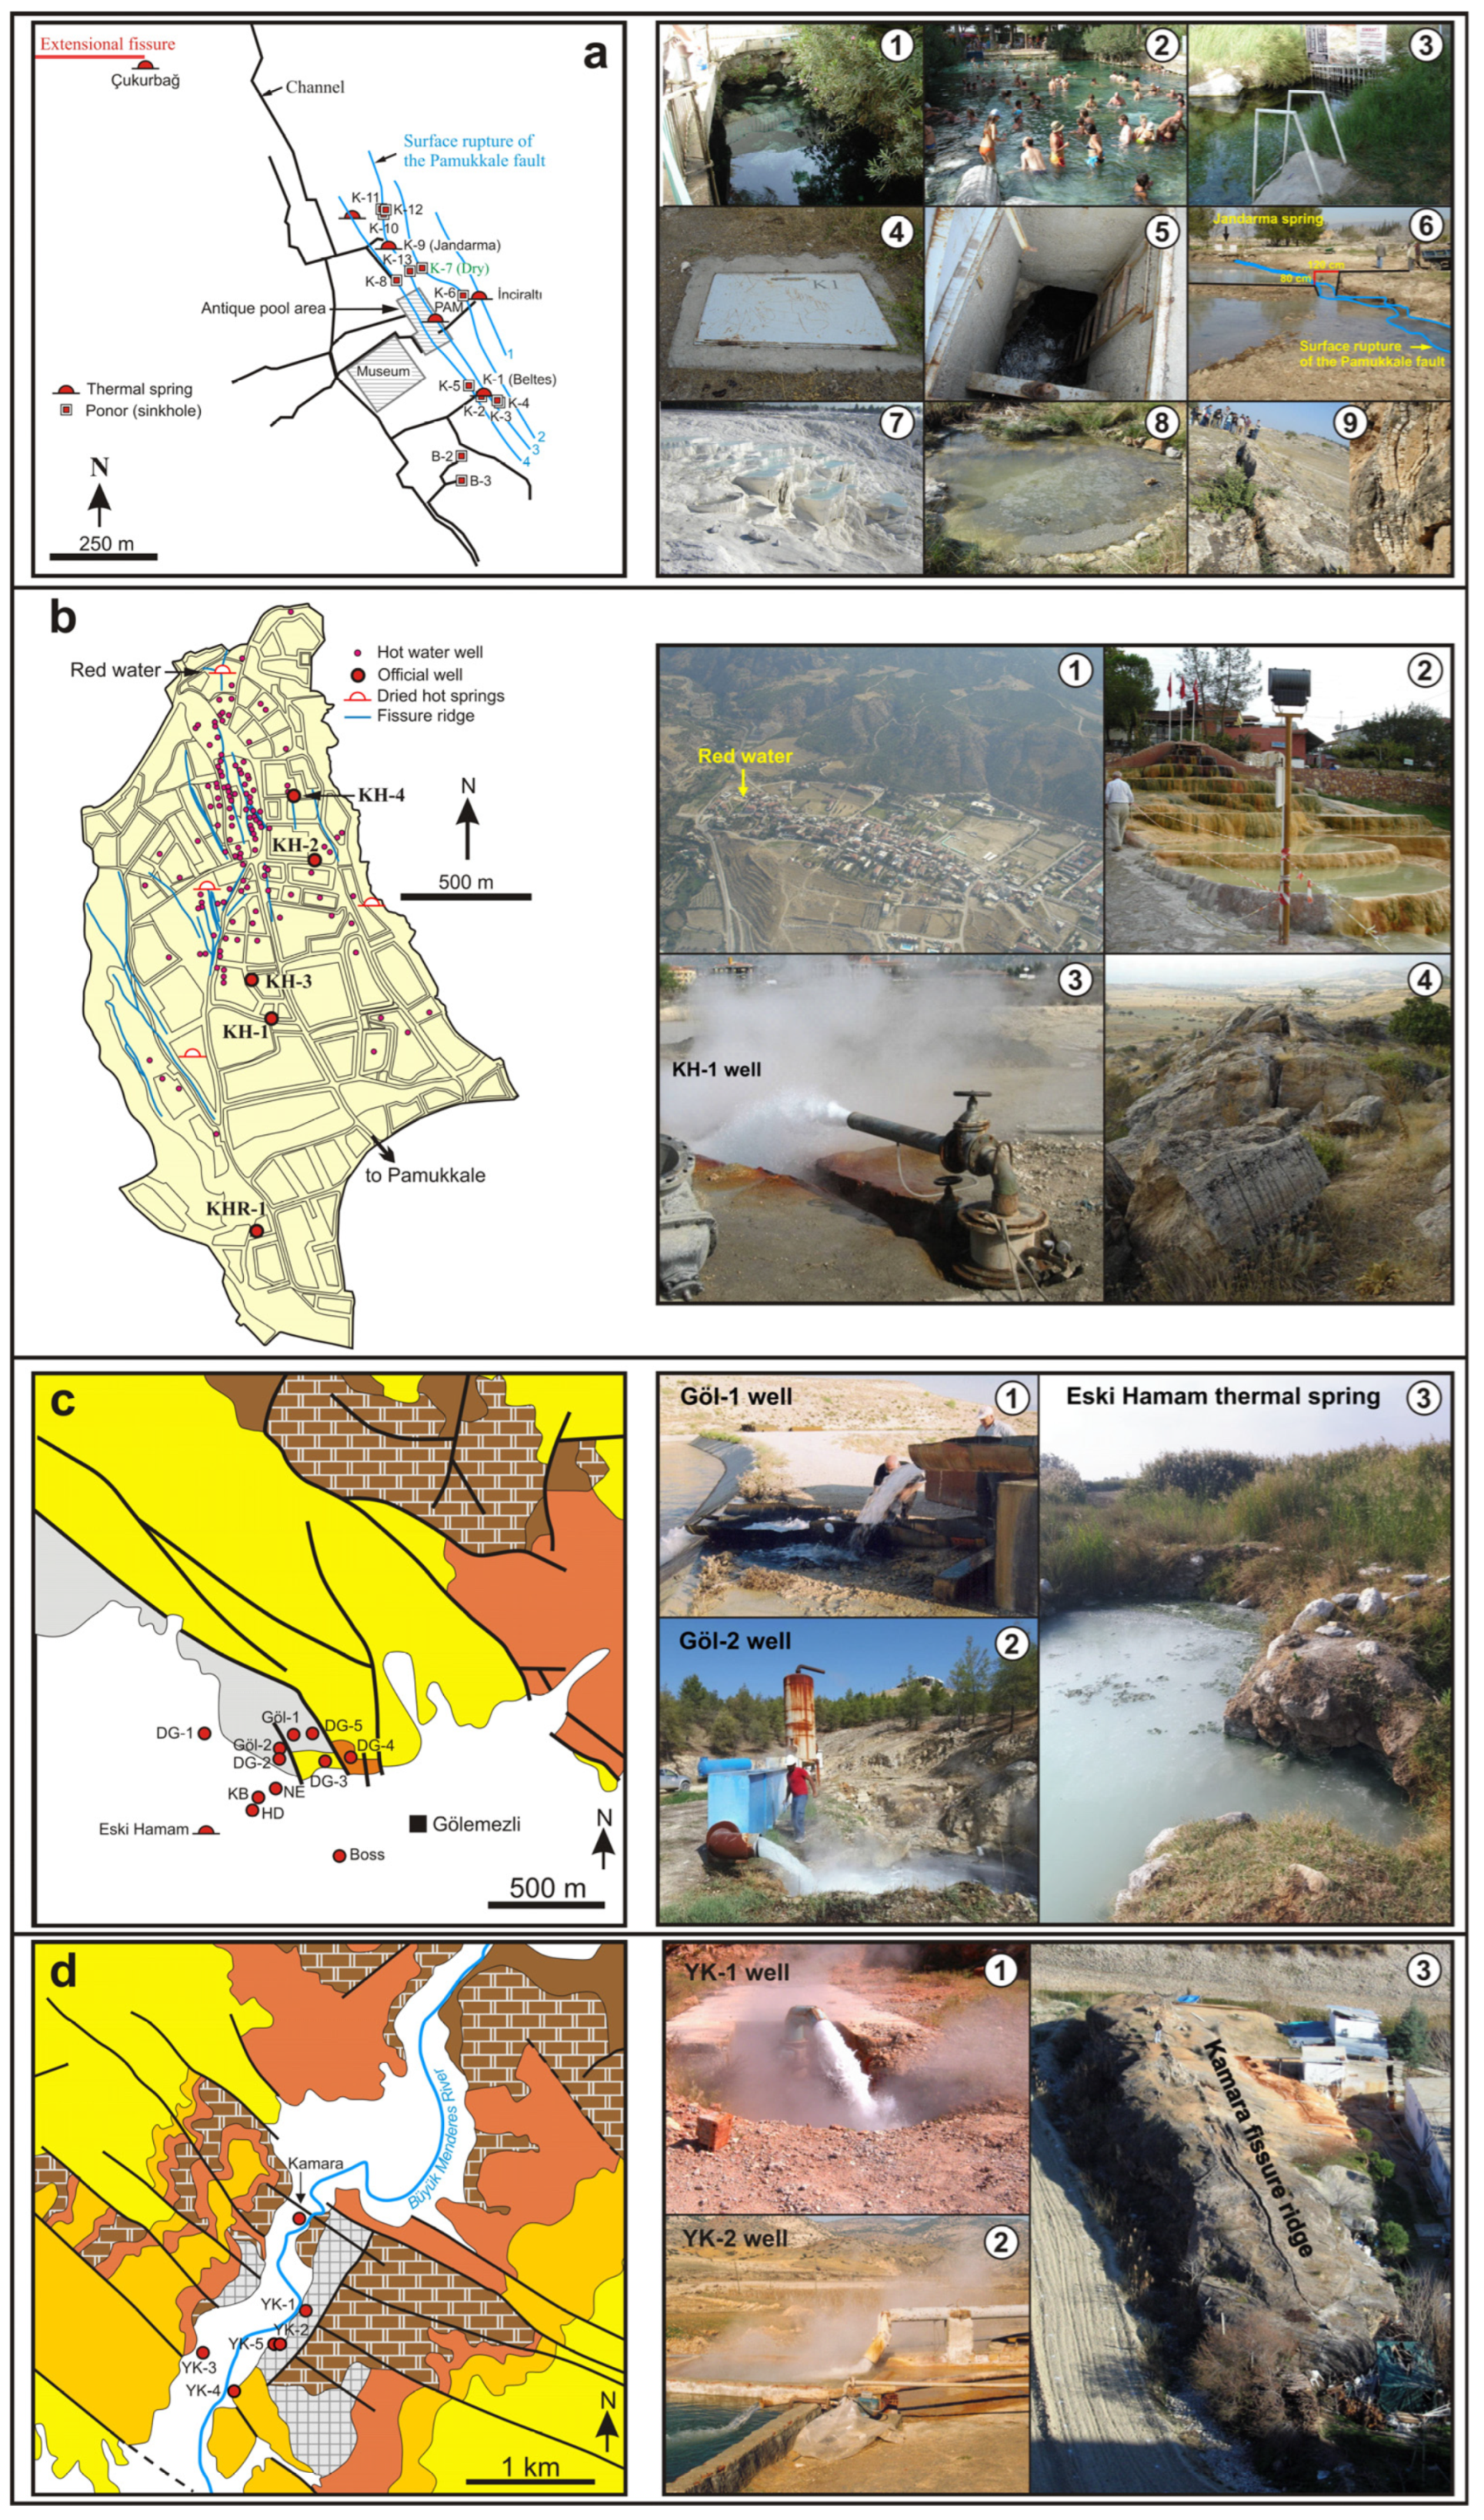
The compressional regime, which started with the collision of the Eurasian and Arabian plates in the Miocene, gave rise to the westward movement of the Anatolian plate. It was changed to an extensional regime by the Late Miocene, resulting in the formation of horst–graben systems in Western Anatolia [8,9,27,28,29,30,31] (Figure 1a,b). The Denizli Basin with a length of 62 km and width of 7–28 km is located at the intersection of the E–W trending Büyük Menderes graben and the NW–SE trending Gediz graben [32,33,34,35] (Figure 1c).
The Menderes massif metamorphics are the basement rocks in the study area (Figure 1c). The lower part of the massif consists of alternating bands of Precambrian–Cambrian augen gneiss, quartzite, micaschist and amphibolite. These units are exposed in the western part of the area between Buldan and Kızıldere. They are overlain by the Devonian–Carboniferous schists. The uppermost part of the massif is composed of phyllite, quartzite and marble of the Permian–Carboniferous age. The Menderes massif is covered with a tectonic contact by the Çökelez formation, which is made up of Jurassic–Cretaceous limestone, dolomitic limestone and evaporitic sediments of the Lycian nappes. Neogene units that unconformably overlie the Massive and Çökelez formation consist of four different formations; from bottom to top, (1) conglomerate, sandstone, siltstone and lignite-bearing clayey limestone of the Miocene Kızılburun formation, (2) lacustrine limestone, marl, claystone, siltstone and evaporite sediments (e.g., gypsum) of the Miocene Sazak formation, (3) Miocene–Pliocene Kolankaya formation represented by the alternation of sandstone, siltstone, claystone and marl, and (4) Pliocene Ulubey formation consisting of lacustrine limestones intercalated with claystone and marl [36]. These Neogene units are covered with an angular unconformity by the Quaternary Tosunlar formation that is composed of loosely cemented conglomerate, sandstone, siltstone and mudstone [36]. Travertine and alluvium are the youngest units that set above these formations. Travertines are divided into two groups: fossil and modern travertines. The white travertines precipitated from the Pamukkale thermal spring waters and the yellowish red travertines in the Karahayıt and Yenice areas that precipitated from the thermal well waters represent the modern travertines. The NW-trending Akköy fissure ridge with a length of 1400 m, height of 40 m and width of up to 800 m is the most important fossil travertine [37]. The ages of travertines in the Pamukkale, Karahayıt and Akköy areas are at least 400,000 years [4,38,39] whilst those in Gölemezli attain ages exceeding 600,000 years [40].
Intense seismic activity and rapid extension in the region (30–40 mm/year; [9]) has caused devastating earthquakes around the ancient city of Hierapolis and Denizli [41,42,43,44]. Crustal thinning due to extension has resulted in a high geothermal gradient. Based on the reservoir temperatures calculated by the silica geothermometers, heat flux values of thermal springs in the Denizli region were found 193 mW/m2 for Tekkehamam, 170 mW/m2 for Kızıldere, 76 mW/m2 for Pamukkale and 68 mW/m2 for the Yenicekent geothermal fields [45]. In a recent study by Bilim et al. [46], Curie point depth for Denizli was estimated at 10–11 km and the heat flux and the geothermal gradient were reported as 135–160 mW/m2 and 55–65 °C/km, respectively. Gradient wells with depths of 80–150 m drilled in the Kızıldere and Tekkehamam geothermal fields yielded gradients from 0.1 to 1.0 °C/m [47,48]. The geothermal gradient in the Karakova uplift 7 km SSW of Pamukkale was measured at 0.14 °C/m [49]. These high gradient values decrease rapidly from a depth of 150 to 200 m (e.g., Avşar and Altuntaş [24]). It can be concluded that the geothermal gradient in the region is at least 2–4 times higher than the world average (~33 °C/km).
Figure 1. (a) Main horst–graben structures in Western Türkiye (modified from Bozkurt [50]), (b) locations of major geothermal fields in the Büyük Menderes Graben (modified from Karakuş and Şimşek [19], Akkuş et al. [51], Şimşek [52]), (c) geological map of the study area (modified and adapted from Alçiçek et al. [23], Koçyiğit [35], Sun [53], Konak and Şenel [54]).
Water 17 00961 g001
Geothermal fields in the Denizli basin host more than one reservoir rock. The intensely fractured schist, quartzite and marble of the Menderes massif represent the deeper reservoir. In the Pamukkale area, highly fractured limestone and dolomitic limestones of the Çökelez formation that are naturally prone to dissolution are also considered reservoir rocks. The Miocene Kızılburun formation above the massif acts as cap rock and limestones of the overlying Sazak formation with a limited lateral continuity form a shallow reservoir. The impermeable lithologies of the younger formations are considered the cap rocks of the shallow reservoir (Figure 2).
The conceptual hydrogeological model of the studied areas (except for the Tosunlar area) has been discussed in detail in previous studies [20,21,22,23,24,61,62]. These models briefly include the seeping of rainwater into the ground, being heated by a high geothermal gradient, and ascending to the surface along the fault/fracture systems. Thermal waters emerge as thermal springs at temperatures of 25–57 °C in Yenicekent (especially in the Büyük Menderes River bed), Pamukkale and Gölemezli areas. However, the temperature of springs in Tekkehamam is as high as 98 °C. The geological and tectonic structure of the Tosunlar field is principally similar to other fields and represented by the same hydrogeological model.
In the north of Pamukkale, cold water springs generally discharge from the permeable units of the Ulubey and Kolankaya formations at flow rates ranging from 0.01 to 11 L/s. Wells drilled in the same units produce cold groundwater at a high flow rate. There are also low-discharge springs manifested from the fractured and altered sections of the gneisses around the Buldan area (Figure 1c).

3. Site Description

3.1. General

The studied geothermal fields are located in the western part of the Denizli Basin, at 38° latitude and 29° longitude (Figure 1b,c). The lithology logs of the geothermal wells opened in the Karahayıt, Gölemezli, Yenicekent, Tosunlar, Tekkehamam and Kızıldere fields are shown in Figure 2. The change in the thickness of units and reservoir depths in the Karahayıt and Gölemezli wells is probably due to faulting. In the study area, the high elevations are generally comprised of the horsts where the Menderes massif metamorphics are exposed, which attain 1400 m around Buldan. Sampled thermal waters and well elevations are 364–369 m in Pamukkale, 330 m in Karahayıt, 160–200 m in Gölemezli, 165 m in Yenicekent and 145 m in Tosunlar. Büyük Menderes River and its tributary Çürüksu Stream have an average flow rate of 44.3 and 9.36 m3/s, respectively [63]. According to meteorological data between 1991 and 2020, the average annual air temperature in the region is 16.9 °C. The hottest month is July (28.3 °C) and the coldest month is January (6.2 °C). Total annual precipitation is 573.8 mm, the rainiest month is January with 85.7 mm, and the driest month is August with 12.1 mm. For this region, potential evapotranspiration is calculated as 930 mm and actual evapotranspiration is 399 mm.

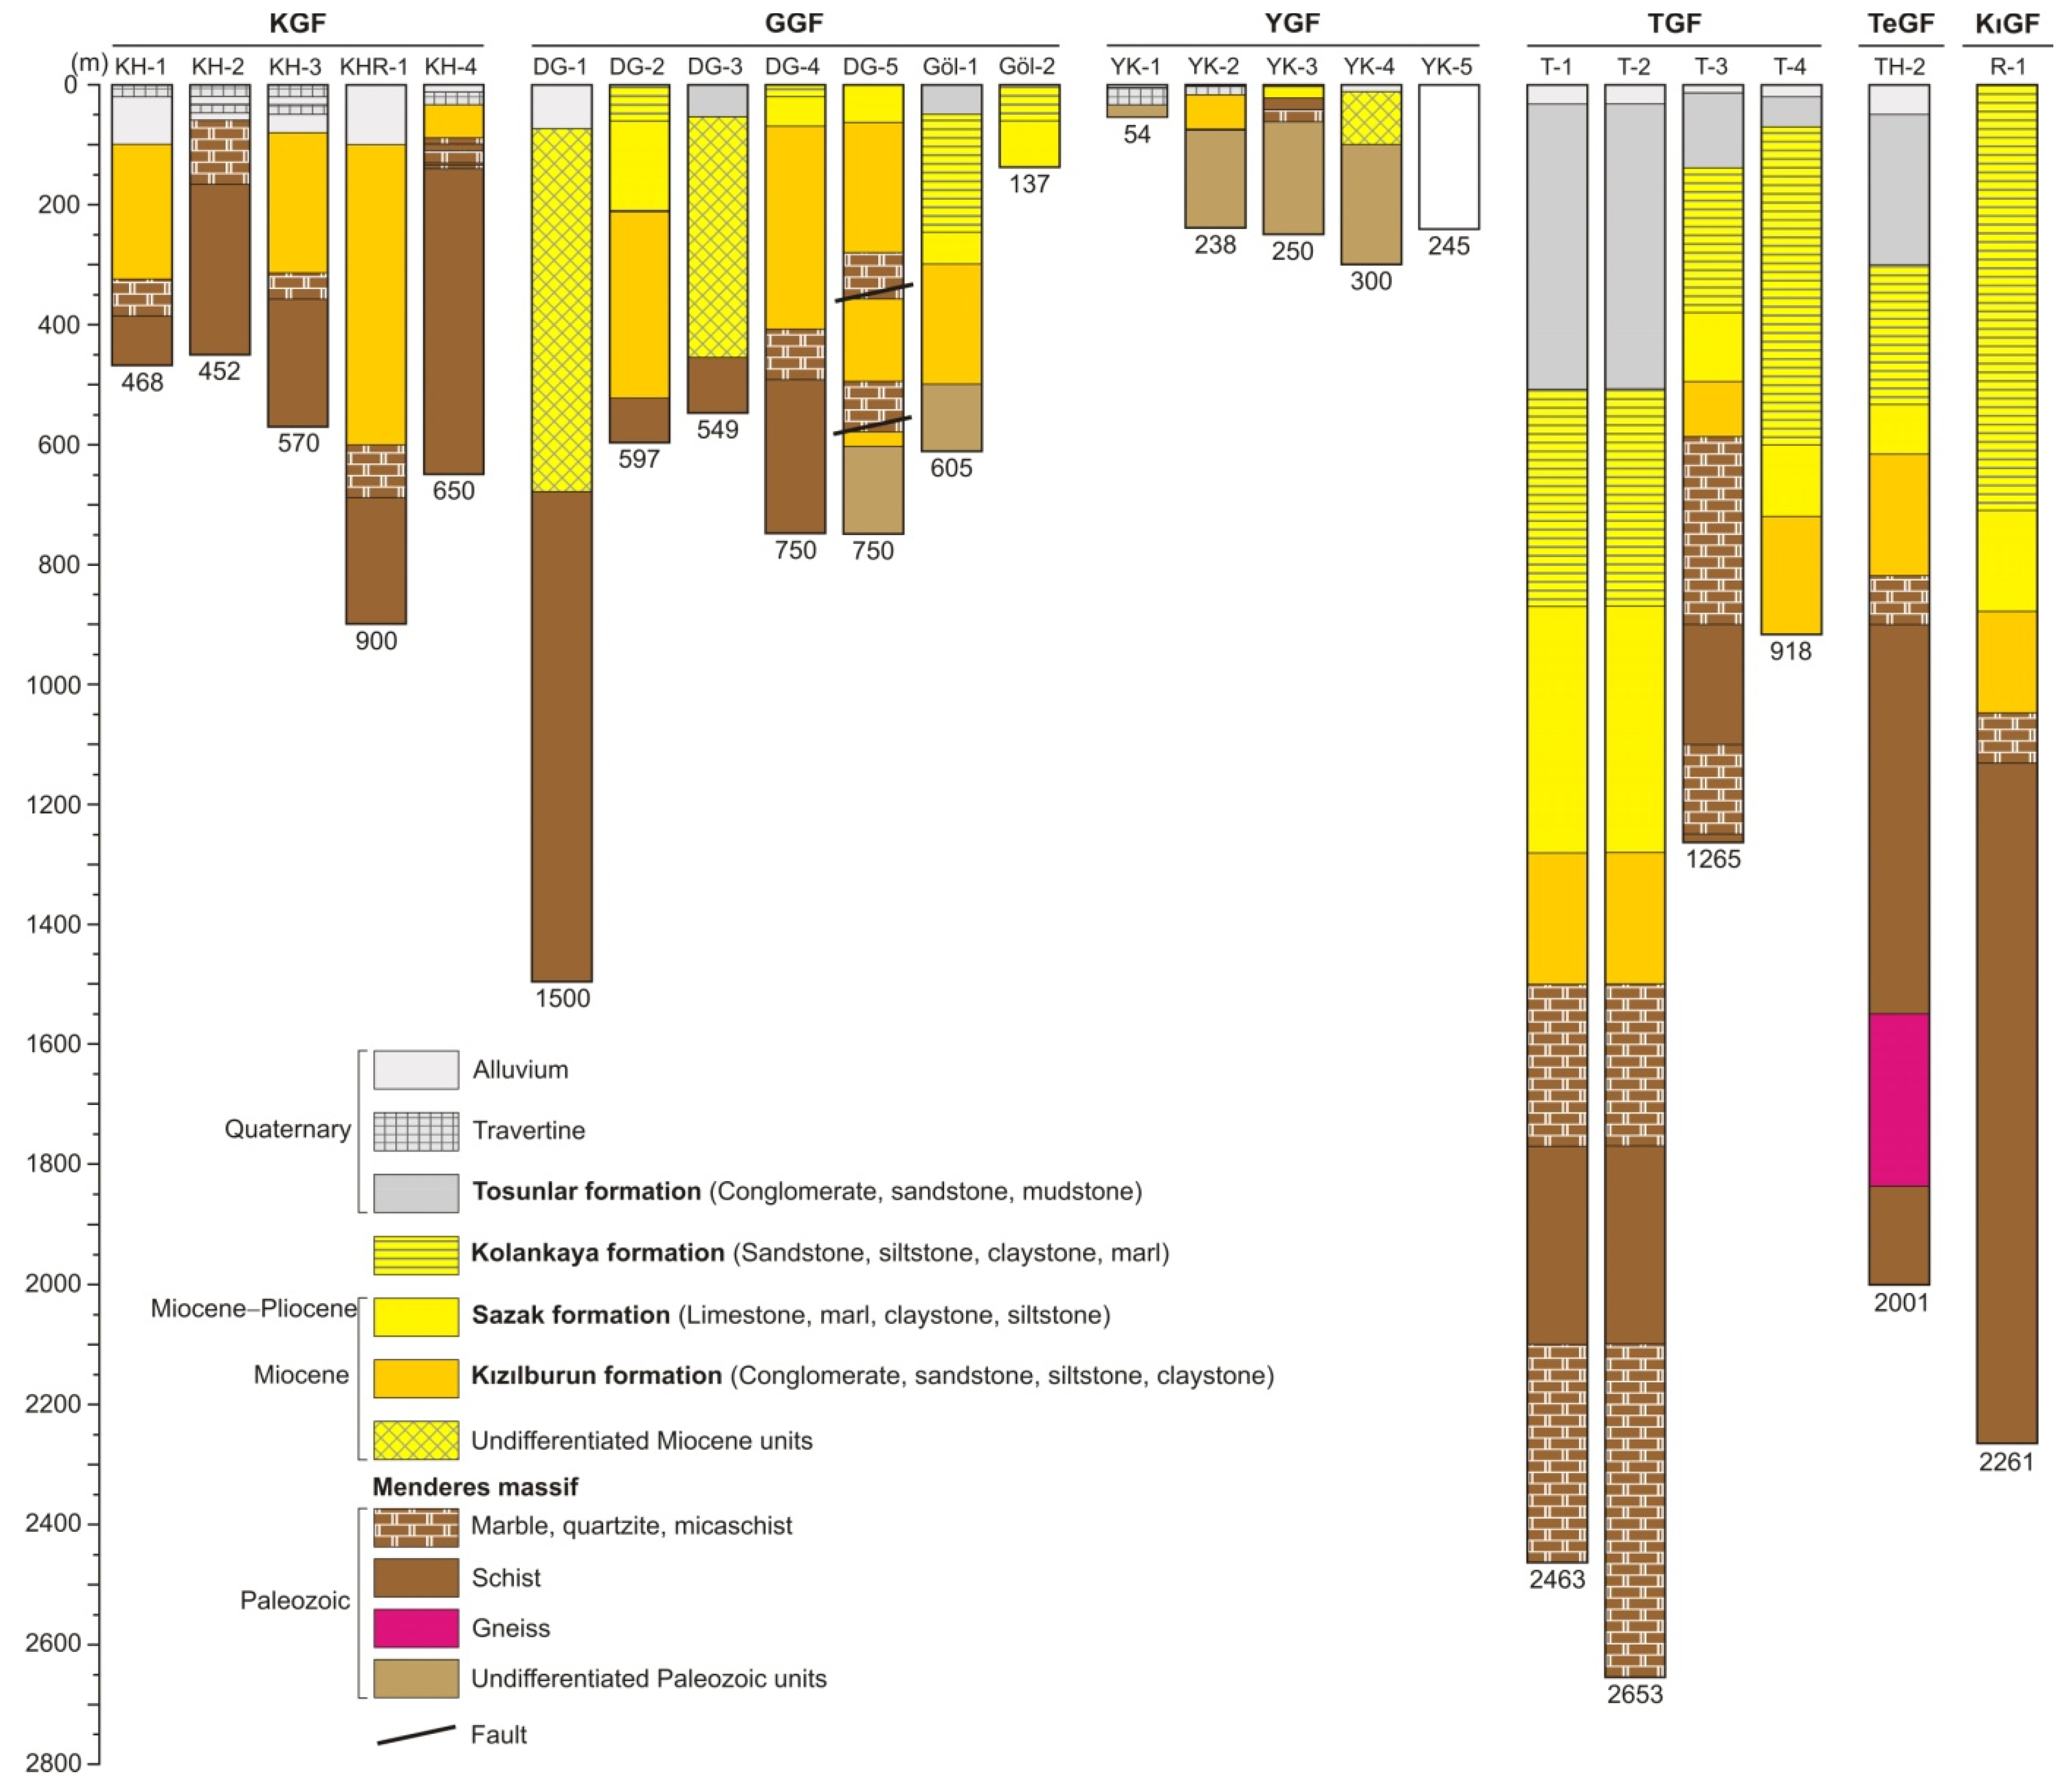
3.2. Geothermal Fields

In the Pamukkale geothermal field (PGF), there are 13 thermal water ponors and four main thermal springs; PAM (also known as Ancient Pool and Özel İdare), Jandarma, Beltes and İnciraltı (Figure 3 and Figure 4a). Pamukkale thermal waters are manifested along the surface ruptures of the Pamukkale Fault (NW–SE trending). Tracer and pumping tests carried out to determine the hydraulic relationship, flow direction and interactions between the main outlet points of thermal waters indicated the presence of two main flow systems in the area. There was a water loss of approximately 40 L/s along the waterway under the surface from the outlet to the natural channels carrying water to the travertine area [64]. Although the total flow rates of Pamukkale thermal springs fluctuated between approximately 150 and 400 L/s in the last 30 years, they tended to decrease especially in the last 10 years. Results of previous studies have revealed that the chemical compositions of Pamukkale thermal springs do not change significantly over time [23,25,62,65]. Temperatures of Pamukkale thermal waters and Çukurbağ spring (elevation 285 m) are about 35 and 56 °C (Figure 3 and Figure 4(a7)). Pamukkale thermal spring waters are used for bathing, travertine precipitation and agricultural irrigation after flow on the travertines. In this study, we sampled the spring PAM, which is discharging from the ancient pool.
The Karahayıt geothermal field (KGF) is a thermal tourism center located 21 km N of Denizli city. The first thermal well in Karahayıt was drilled in 1981, and the number of thermal drillings increased rapidly in the following years due to increasing tourism activity. As of 2006, there were more than 200 hot water wells in an area of about 1 km2. The excessive thermal water exploitation from these wells caused the drying of all thermal springs (including the “Red water” spring, famous for the red travertines it precipitated) and some shallow wells. In order to make sustainable use of the Karahayıt geothermal fluid, thermal waters with temperatures ranging from 58.0 to 61.5 °C and flow rates between 12 and 58 L/s were produced from four geothermal wells (KH-1, KH-2, KH-3 and KH-4) opened by the Denizli Governorship in 2007 (Table 1, Figure 4b).
The Gölemezli geothermal field (GGF) is located 25 km NW of the city center of Denizli. In 1993, there were an old spa facility and four thermal springs with temperatures varying from 34 to 58.3 °C [65]. In the area, seven geothermal wells with temperatures up to 88 °C (DG-coded drillings in Table 1 and Figure 4c) were drilled by government agencies. Today, in addition to the official wells, this area hosts a thermal spring (Figure 4(c3)), and ten private thermal boreholes, only one of which is active. For this study, the waters of Göl-1 and Göl-2 wells were sampled.
The Yenicekent geothermal field (YGF) is located 32 km NW of the Denizli city. This field is home to Çizmeli (42 °C) and Kamara (55 °C) springs [66]. The Kamara thermal spring that was manifested through a fissure ridge was dried up in 1998 because of a thermal well (Kamara well) drilled near the spring which produced water with a temperature of 55.1 °C (Figure 4d). In the following years, another five wells (YK-1 to YK-5) opened in the YGF by governmental organizations yielded promising results (Table 1, Figure 4d). For the present study, we sampled water from the well YK-5.
The Tosunlar geothermal field (TGF) is located 25 km NW of the city center of Denizli (Figure 1c). Two deep wells (T-3 and T-4) drilled by private companies in 2007 and 2008 are currently used as reinjection wells. Another two wells (T-1 and T-2) opened in 2013 produced thermal water with a temperature of about 100 °C. The high temperature and CO2 gas content of the thermal fluids enabled integrated use (Table 1). In this study, water samples were collected from T-1, T-2 and T-3 wells.
The Tekkehamam geothermal field (TeGF) is located 29 km west of Denizli city, at the eastern end of the Büyük Menderes graben (Figure 1c). TH-1 (615 m, 116 °C) in 1968 and TH-2 (2001 m, 168 °C) in 1997 are the first wells opened in this field, which is home to several thermal springs with temperatures varying between 29 and 98 °C [51]. In the following years, several other wells drilled by the public and private companies produced fluids with temperatures up to 170 °C.
Table 1. Information on some thermal wells in the study area and types of their use.
Geothermal FieldWell NoDateDepth (m)T (°C)Q (L/s)Utilization
KarahayıtKH-1 a200746861.015Thermal bath and spa, hotel and pension heating.
KH-2 a200745261.040
KH-3 a200757061.080
KHR-1 b201190054.027
KH-4 c201965054.530
GölemezliDG-1 d2001150088.015Greenhouse heating (192,000 m2) and bathing.
DG-2 d200259773.0140
DG-3 e200254966.0110
DG-4 e200375070.045
DG-5 e200375062.030
Göl-1 e200860565.0120
Göl-2 e201113768.0136
YenicekentKamara f199814655.1-Kamara well water is used for thermal bath.Greenhouse heating (55,000 m2).
YK-1 g20025457.020
YK-2 g200223867.0140
YK-3 g200225036.04
YK-4 g201330053.034
YK-5 h201524561.035
TosunlarT-1 i20132463132.0144Electricity production (3.8 MWe), CO2 production andgreenhouse heating (197,000 m2).
T-2 i20132653148.839
T-3 i20071265106.691
T-4 i200891885.473
TekkehamamTH-2 d19972001168.012Electricity production (106 MWe), thermal bath and spa, greenhouse heating.
KızıldereR-1 d19982261240.681Electricity production (260 MWe), CO2 production, thermal bath, district heating, greenhouse heating.
Note: The temperature and flow rates in the Karahayıt, Gölemezli and Yenicekent fields are obtained from well tests that were carried out just after the drilling. The wells, which were artesian type at the time of their drilling, are currently operated with pumping. The temperatures of the Tosunlar, Tekkehamam and Kızıldere fields are bottom-hole temperatures. a Gökgöz et al. [55], b Alçiçek et al. [22], c Kocairi [56], d Akkuş et al. [51], e Gökgöz [67], f Bülbül [66], g Akdemir et al. [68], h Çelik [59], i Subay [60].
The Kızıldere geothermal field (KıGF), the first discovered high enthalpy field in Türkiye, is located at the eastern end of the Büyük Menderes graben, 30 km northwest of Denizli city (Figure 1c). Geothermal studies in Kızıldere started with the collaboration between the MTA and the United Nations Development Program (UNDP) and the first thermal well was opened in 1968. The deep geothermal wells drilled between 1968 and 1986 produced geothermal fluid with temperatures of 198 to 212 °C [69]. R-1 reinjection well which was drilled in 1998 to a depth of 2261 m produced fluid of 242 °C, and since then it has been used as a production well [70]. Many production and reinjection wells have been opened in this field since 2008. The installed power of the plants increased from 17.4 MW in 1984 to 260 MW [26].

4. Materials and Methods

Physiochemical parameters of waters (e.g., pH, temperature, and electrical conductivity-EC) were measured at sampling points with a Hach Lange HQ40D multi-parameter meter (Hach Company, Loveland, CO, USA). Before the measurements, the device was calibrated using standard solutions. The batch for the anion analysis was filtered and collected into 250-milliliter high-density polyethylene (HDPE) containers. Another batch for cation and trace element analyses was sampled into 100-milliliter HDPE bottles and suprapure HNO3 was added to prevent precipitation. The sample taken for SiO2 analysis was diluted with pure water.
Waters for oxygen–hydrogen isotope and tritium analyses were sampled into 50-milliliter and 500-milliliter HDPE bottles. For carbon isotope analysis, waters were collected by filtering into brown glass containers and transported within a cold chain. Waters taken for δ34S and δ18O (sulfate) analyses were filtered and acidified. Before the analyses, barium sulfate was precipitated by adding barium chloride dihydrate (BaCl2.2H2O).
Anion (Cl, SO42−, HCO3 and F), cation (Na+, K+, Ca2+, Mg2+ and Li+) and tritium analyses of samples were carried out at the Water Chemistry Laboratory of the Hacettepe University. Cation and anion concentrations were measured using a Thermo Scientific Dionex Ion Chromatography device (Waltham, MA, USA). An ICS 1000 and LC 25 were used for analyzing anions and cations, respectively. HCO3 was determined by titration method using methyl orange as indicator solution and 0.01 N H2SO4 as titrant solution. Charge-balance error of waters is in the range of −3.2 to 4.6%. Tritium was measured with the liquid scintillation (Perkin Elmer Quantulus, Waltham, MA, USA) method. Al, B, Ba and Sr elements were analyzed by ICP-MS technique at Bureau Veritas Mineral Laboratories (Canada) with the laboratory’s method detection limits ranging from <0.01 to <5 ppb. SiO2 was analyzed with the spectrophotometric method (HACH DR/4000, Ames, IA, USA) at the Geochemistry Laboratory of the Pamukkale University.
δ18O and δD analyses were conducted at the SIRFER Laboratory of the University of Utah using a Picarro cavity ring-down spectrometer (Picarro, Santa Clara, CA, USA) with an analytical precision of 0.1‰ Vienna Standard Mean Ocean Water (VSMOW) for δ18O and 0.2‰ VSMOW for δD. The sulfur (δ34S) (VCDT) and oxygen (δ18O) isotope analyses of sulfate and carbon (δ13C) isotope analysis of dissolved inorganic carbon (DIC) were determined at the Environmental Isotope Laboratory of the University of Waterloo, Canada. For δ34S analysis, sample material was thermally converted to gas through an elemental analyzer coupled with a continuous flow isotope ratio mass spectrometer (CFIRMS). For δ18O measurement, barium sulfate was converted to CO gas through high temperature (1450 °C) pyrolysis combustion using an elemental analyzer coupled to an Isoprime (GV Instruments, Manchester, UK) CFIRMS. The analytical precision for both analyses is 0.3‰ (2σ).
For δ13C and 14C (DIC) measurements, the inorganic carbonate batch is converted to carbon dioxide which is captured and reduced to graphite in Pyrex glass tubes. Graphitized samples are analyzed at the National Electrostatics Corporation model 1.5SDH-1 Pelletron Accelerator (DirectAMS, Bothell, WA, USA). The δ13C-DIC result obtained is within the specification of ±0.2‰. Measurements of the radiocarbon concentration have a precision and accuracy of 0.3% pmC.
Rare earth element analyses of scale samples were conducted at the Bureau Veritas Mineral Laboratories (Canada) by ICP-MS technique. XRD analysis of scale samples was conducted with Shimadzu (Kyoto, Japan) XRD-6000 model X-ray diffractometer (Ni filtered, CuKα radiation) at the Technology Application Research Center of the Afyon Kocatepe University.

5. Results and Discussion

The physicochemical and isotope compositions of thermal water samples collected from PGF, KGF, GGF, YGF and TGF are given in Table 2 and Table 3, respectively. These tables also show the analysis results of some thermal and cold waters in the Tekkehamam and Kızıldere areas that were reported in previous studies.

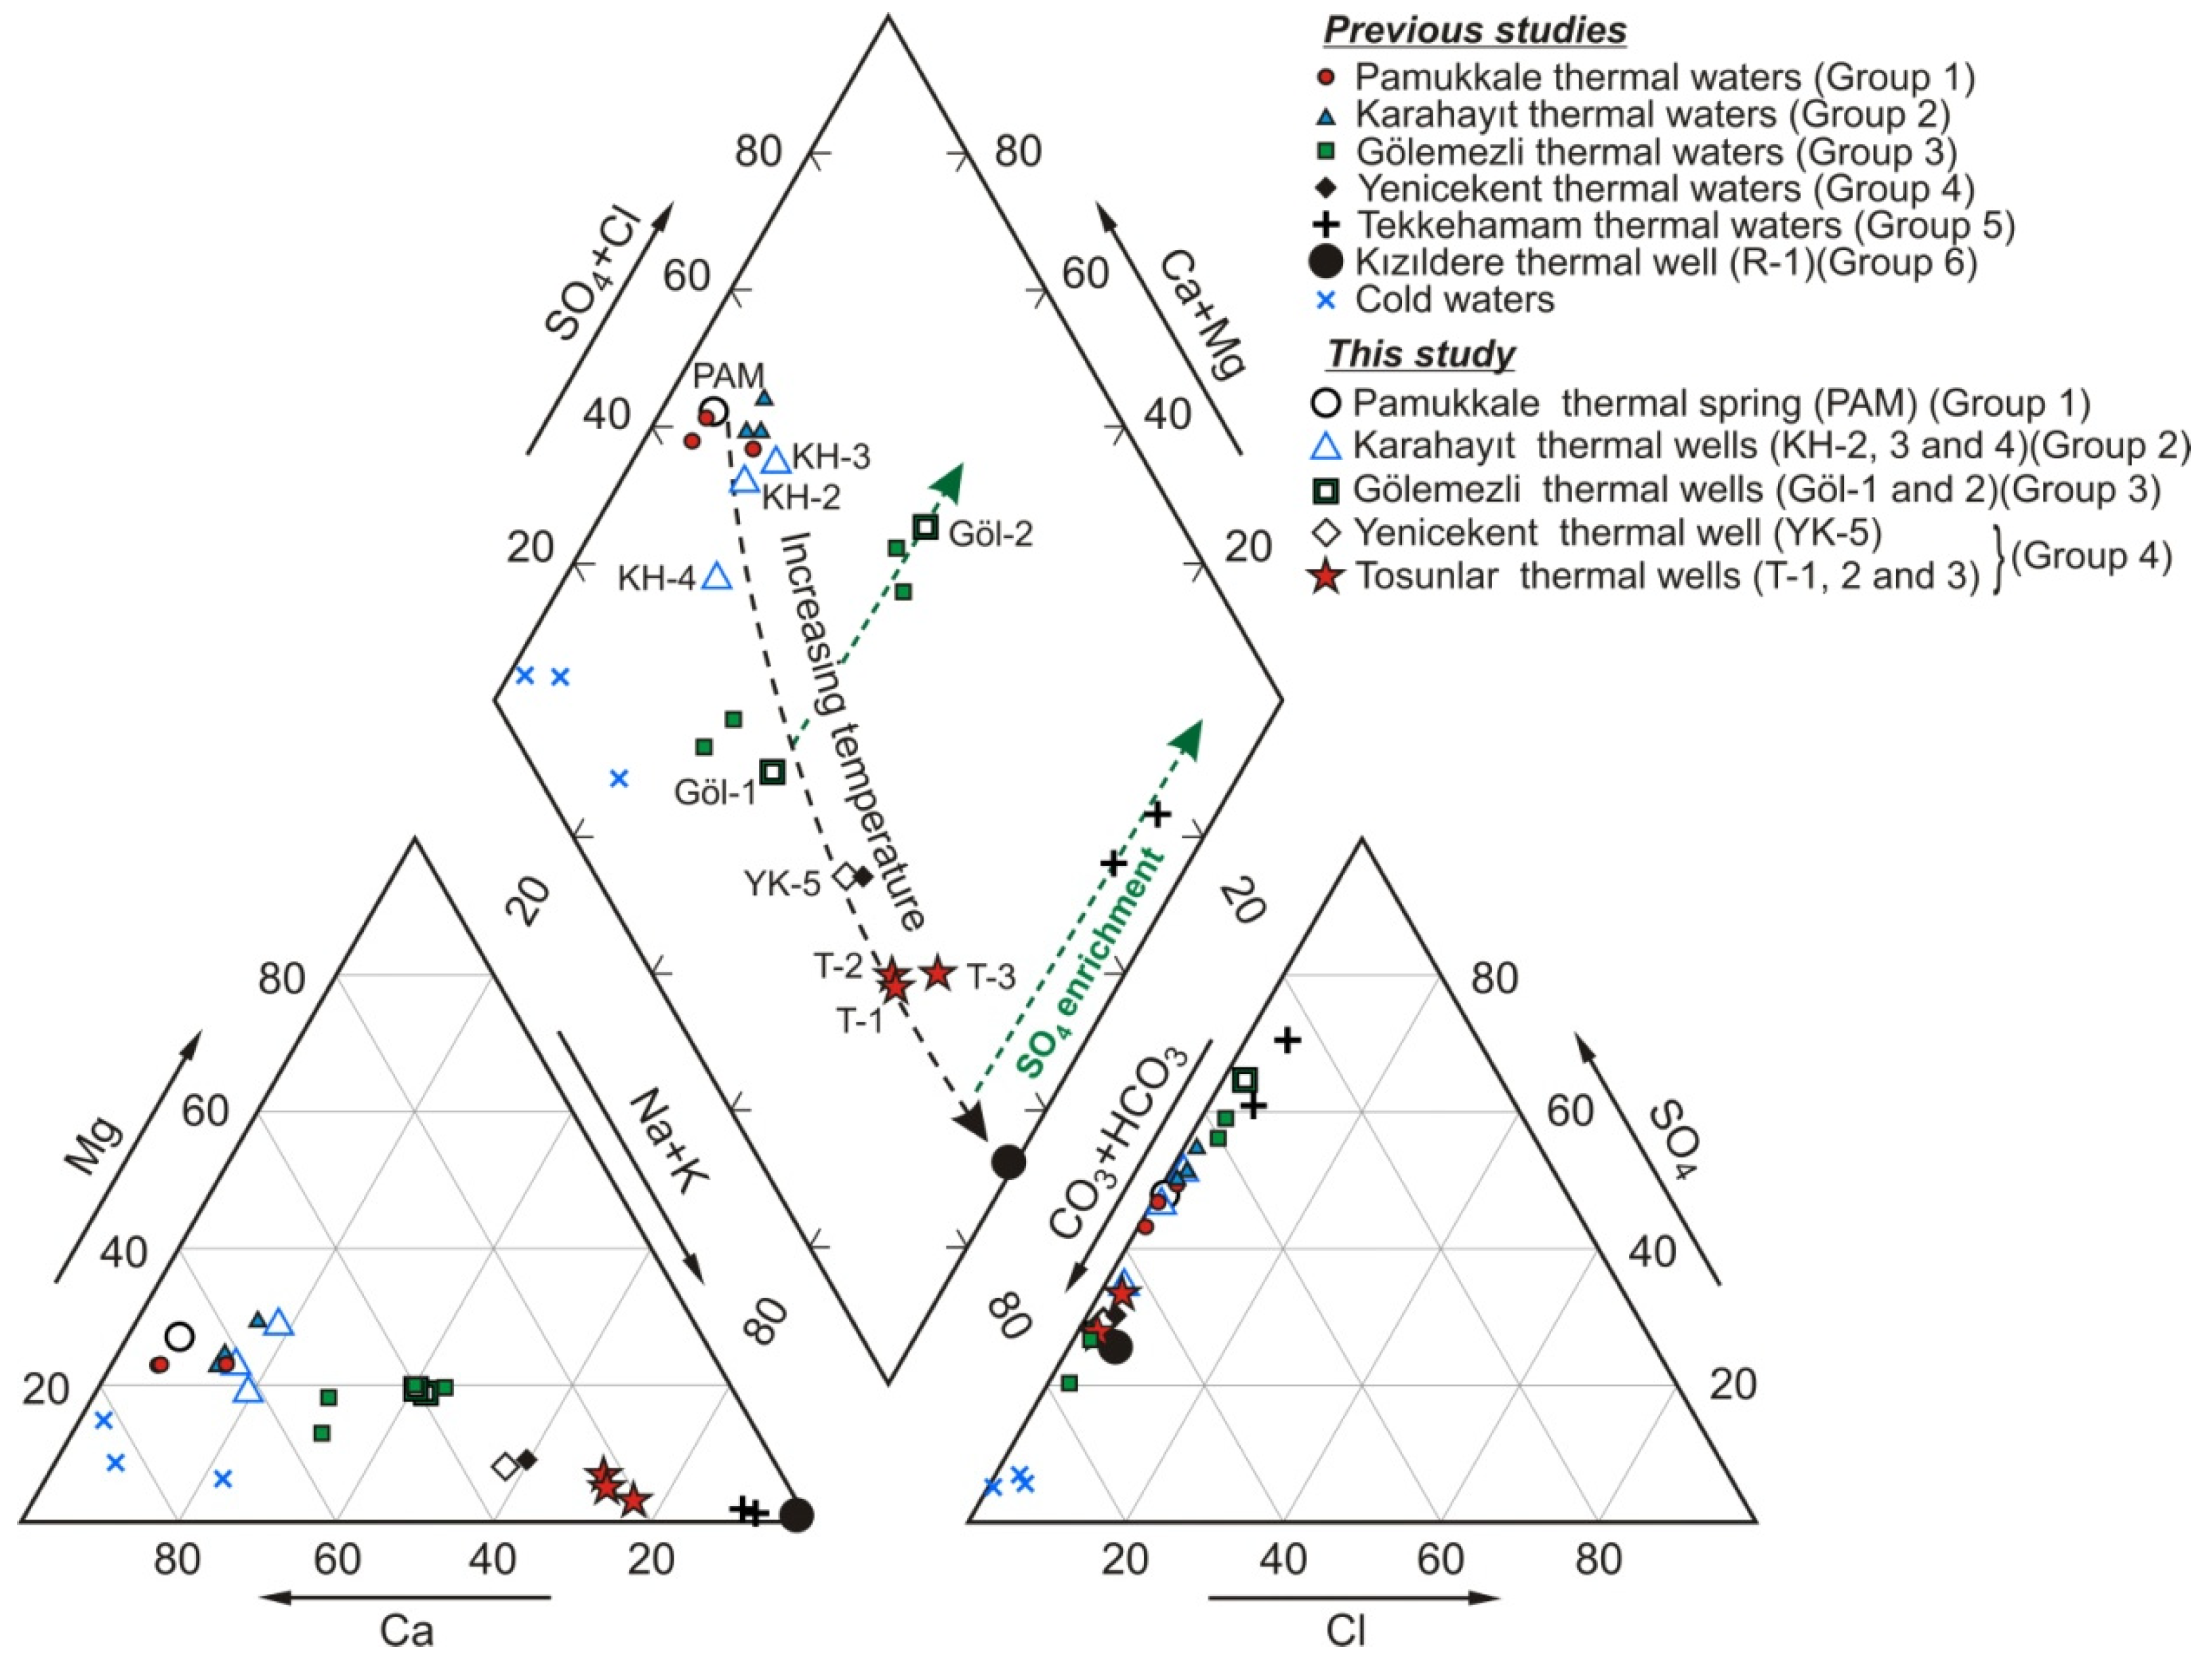
5.1. Physicochemical Characteristics

The studied thermal waters can be divided into six types according to their physicochemical properties (Figure 5 and Figure 6):
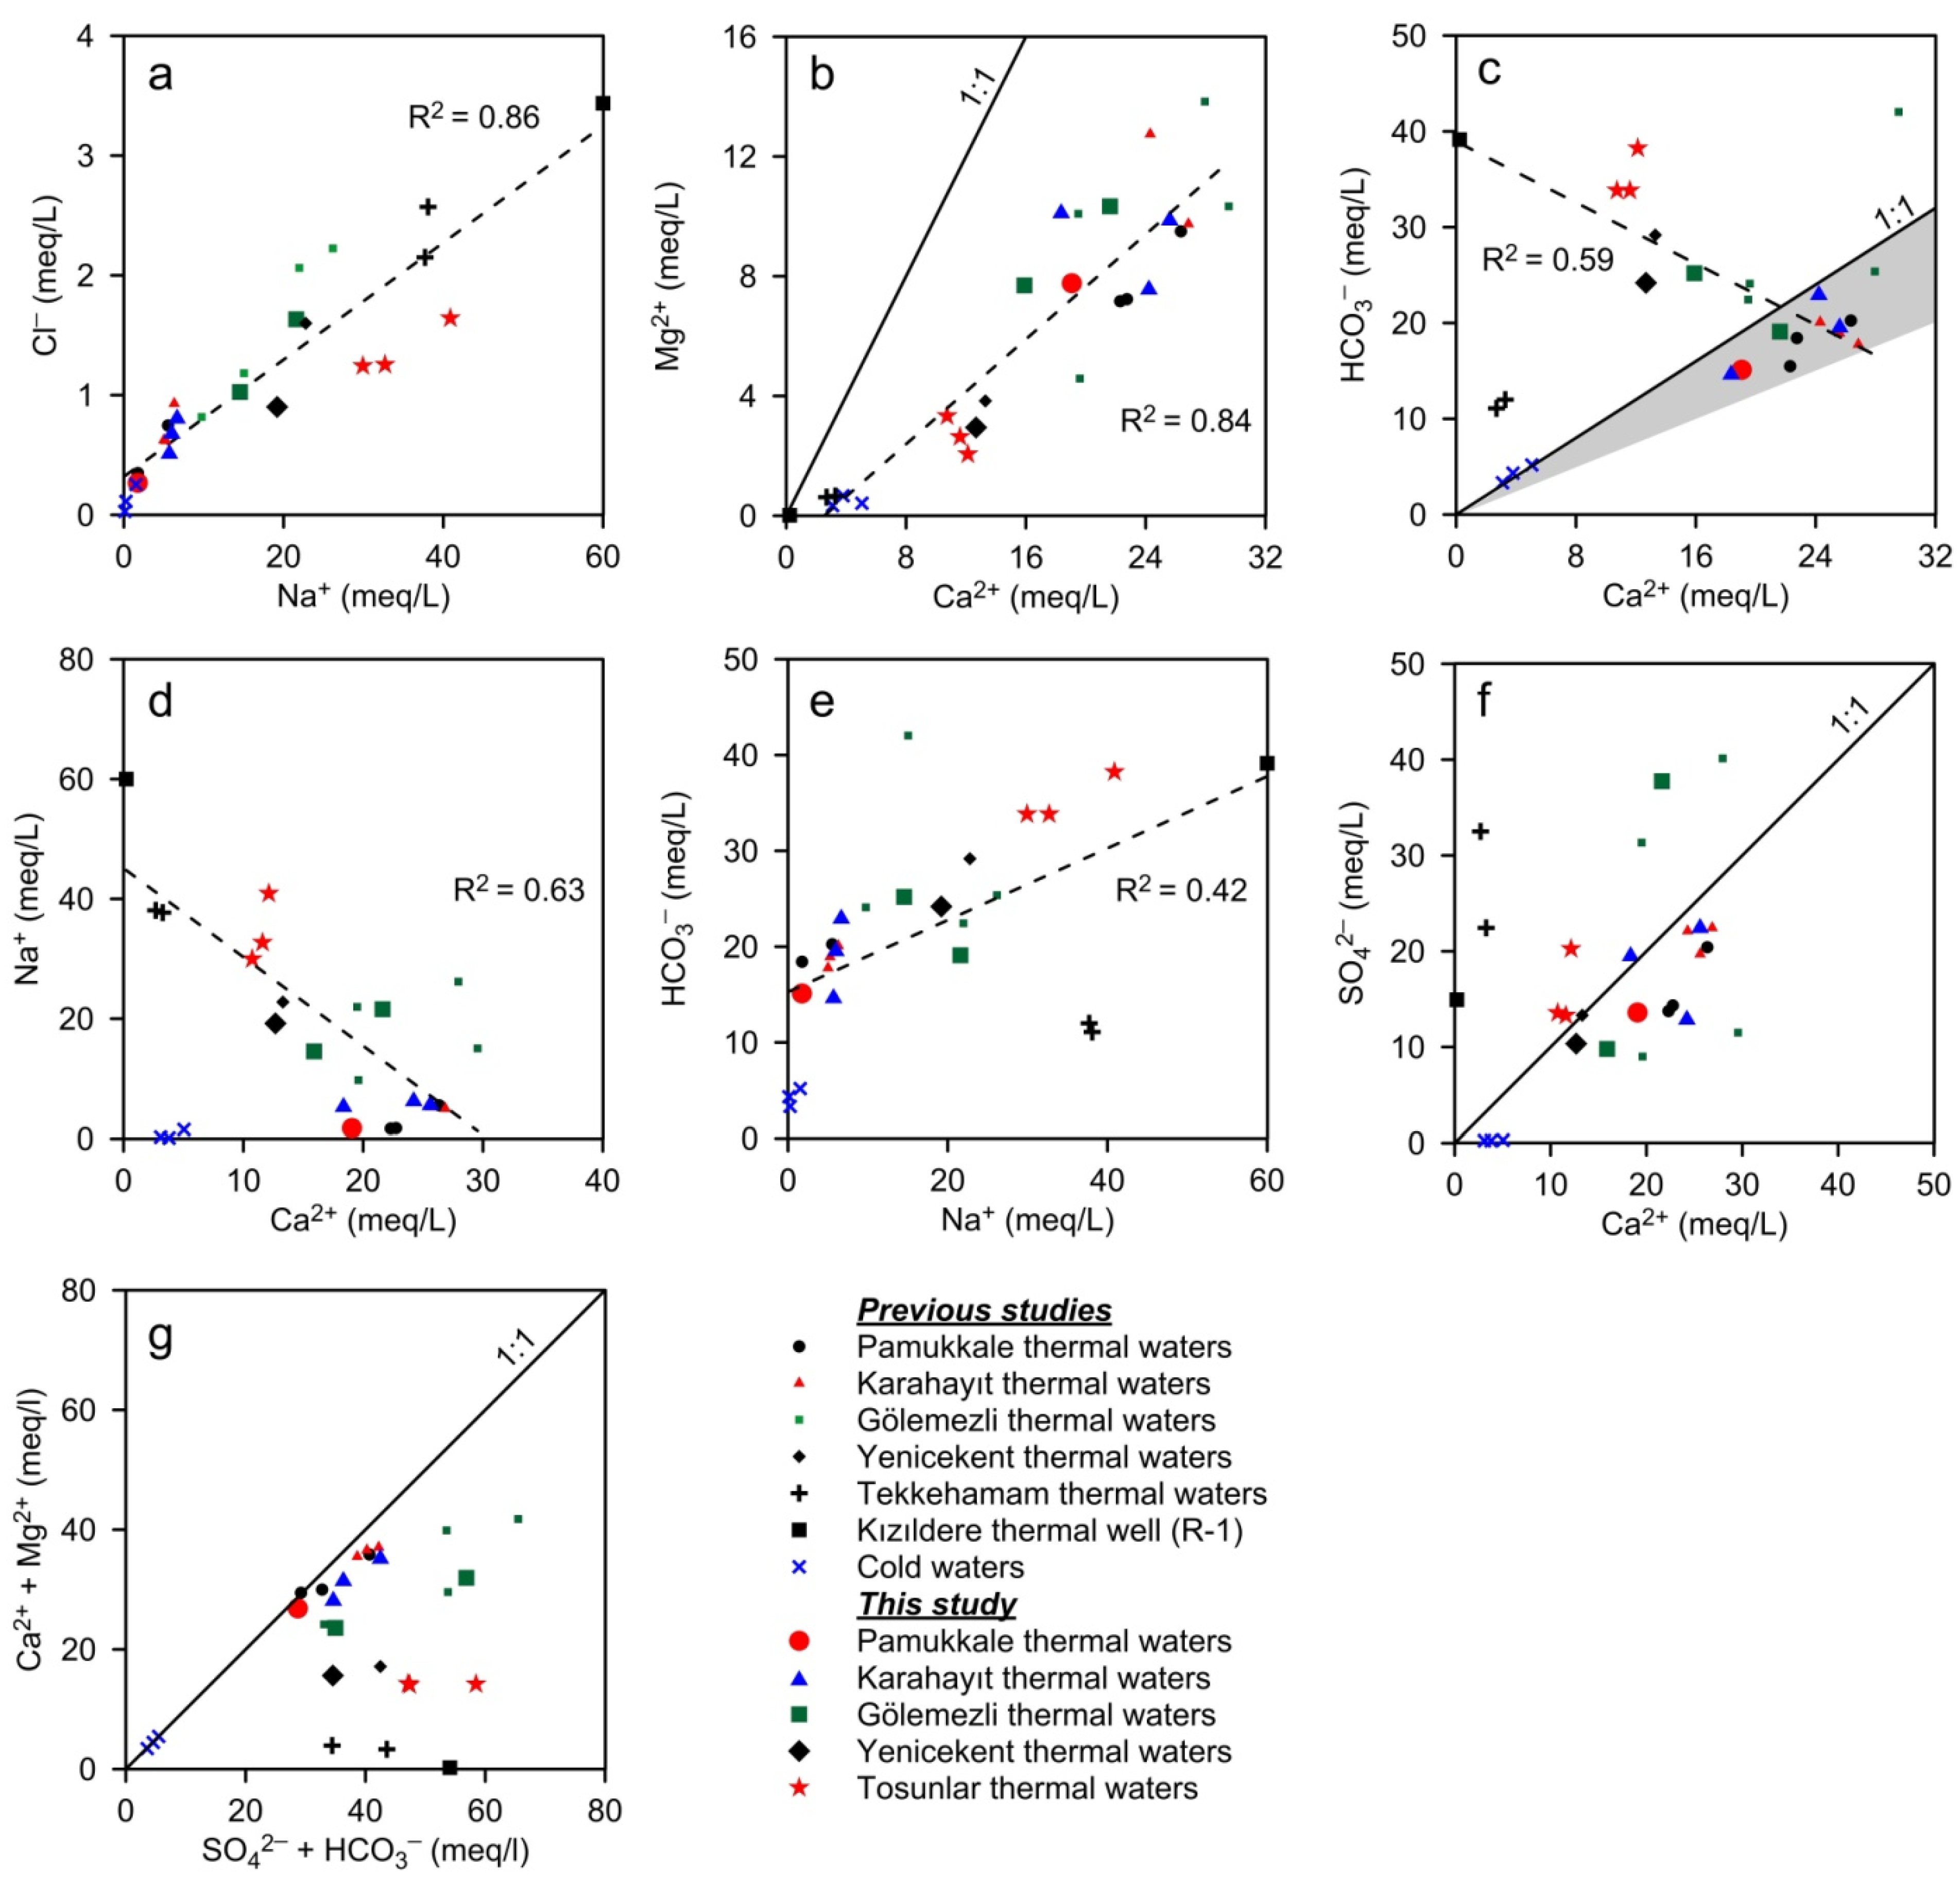
  • Ca-Mg-HCO3-SO4 type thermal waters: This type of thermal spring water is unique to PGF. These waters, which precipitate the white travertine, are distinguished from thermal waters in other areas by their low temperature and low electrical conductivity and slightly acidic nature. Measurements made between 2002 and 2018 showed that the temperatures of these springs and other thermal springs in the area (Figure 4a) varied between 31.5 and 35.1 °C [23]. The thermal springs and private well waters in the plain have slightly lower temperatures falling in the range of 20 to 32 °C. The EC and pH values of PGF thermal waters vary within a narrow range between 2300 and 2390 µS/cm, and 6.10 and 6.37, respectively (Table 2). The dominant cation is Ca2+ (381–455 mg/L, 19.1–22.8 meq/L) and the dominant anion is HCO3 (932–1124 mg/L, 15.1–18.4 meq/L) (Figure 5 and Figure 6). This type of water has the lowest Na+, K+, Cl, F, Li+, B and SiO2 contents among other types of thermal waters (Table 2).
  • Ca-Mg-SO4-HCO3 type thermal waters: KGF thermal well waters characterize this type. The temperatures of this group of waters are between 47.0 and 60.7 °C, EC values are from 2500 to 3080 µS/cm and pH varies from 6.25 to 7.70. The dominant cation and dominant anion are Ca2+ and SO42− although SO42− concentrations are generally slightly higher than HCO3 (in meq/L). The EC is similar to PGF thermal waters; however, Mg2+, Na+, K+, Cl, Li+, B and SiO2 values are higher (Table 2, Figure 6). KH-4, one of the thermal wells in the KGF field, is of Ca-SO4-HCO3 type and distinguished by higher Na+, HCO3 and less Mg2+ and SO42− contents (Table 2).
  • Ca-Na-HCO3-SO4 and Ca-Na-SO4-HCO3 type thermal waters: This type of thermal spring water is unique to GGF. Most of the thermal springs in GGF have dried up after the intense drilling, and the temperature of one active spring (Eski Hamam) was measured as 48 °C (Figure 4(c3)). Göl-1 and DG-3 well waters are of Ca-Na-HCO3-SO4 type. The temperatures of these thermal well waters are between 53.3 and 63.0 °C, EC is from 2930 to 3780 μS/cm and pH is in the range from 6.69 to 7.32. Ca-Na-SO4-HCO3 type Göl-2 and DG-1 thermal well waters have higher temperatures (62.0–69.0 °C; 88 °C at bottom-hole in DG-1 [51]) and EC (4030–4730 μS/cm). Na+, Cl and SO42−, F, Li+, B and SiO2 values are higher and HCO3 contents are lower than Ca-Na-SO4-HCO3 type waters (Table 2, Figure 5 and Figure 6).
  • Na-Ca-HCO3-SO4 type thermal waters: YGF and TGF thermal well waters are included in this group. The bottom-hole temperatures of the TGF waters, sampled for the first time in this study, vary between 88 and 149 °C [73] and the discharge temperatures are from 84 to 98 °C. YGF waters (YK-1 and YK-5) have lower temperature (~50–60 °C) and EC than TGF (T-1, T-2 and T-3) waters and lower B and SiO2 values except Ca2+ and Mg2+ (Table 2).
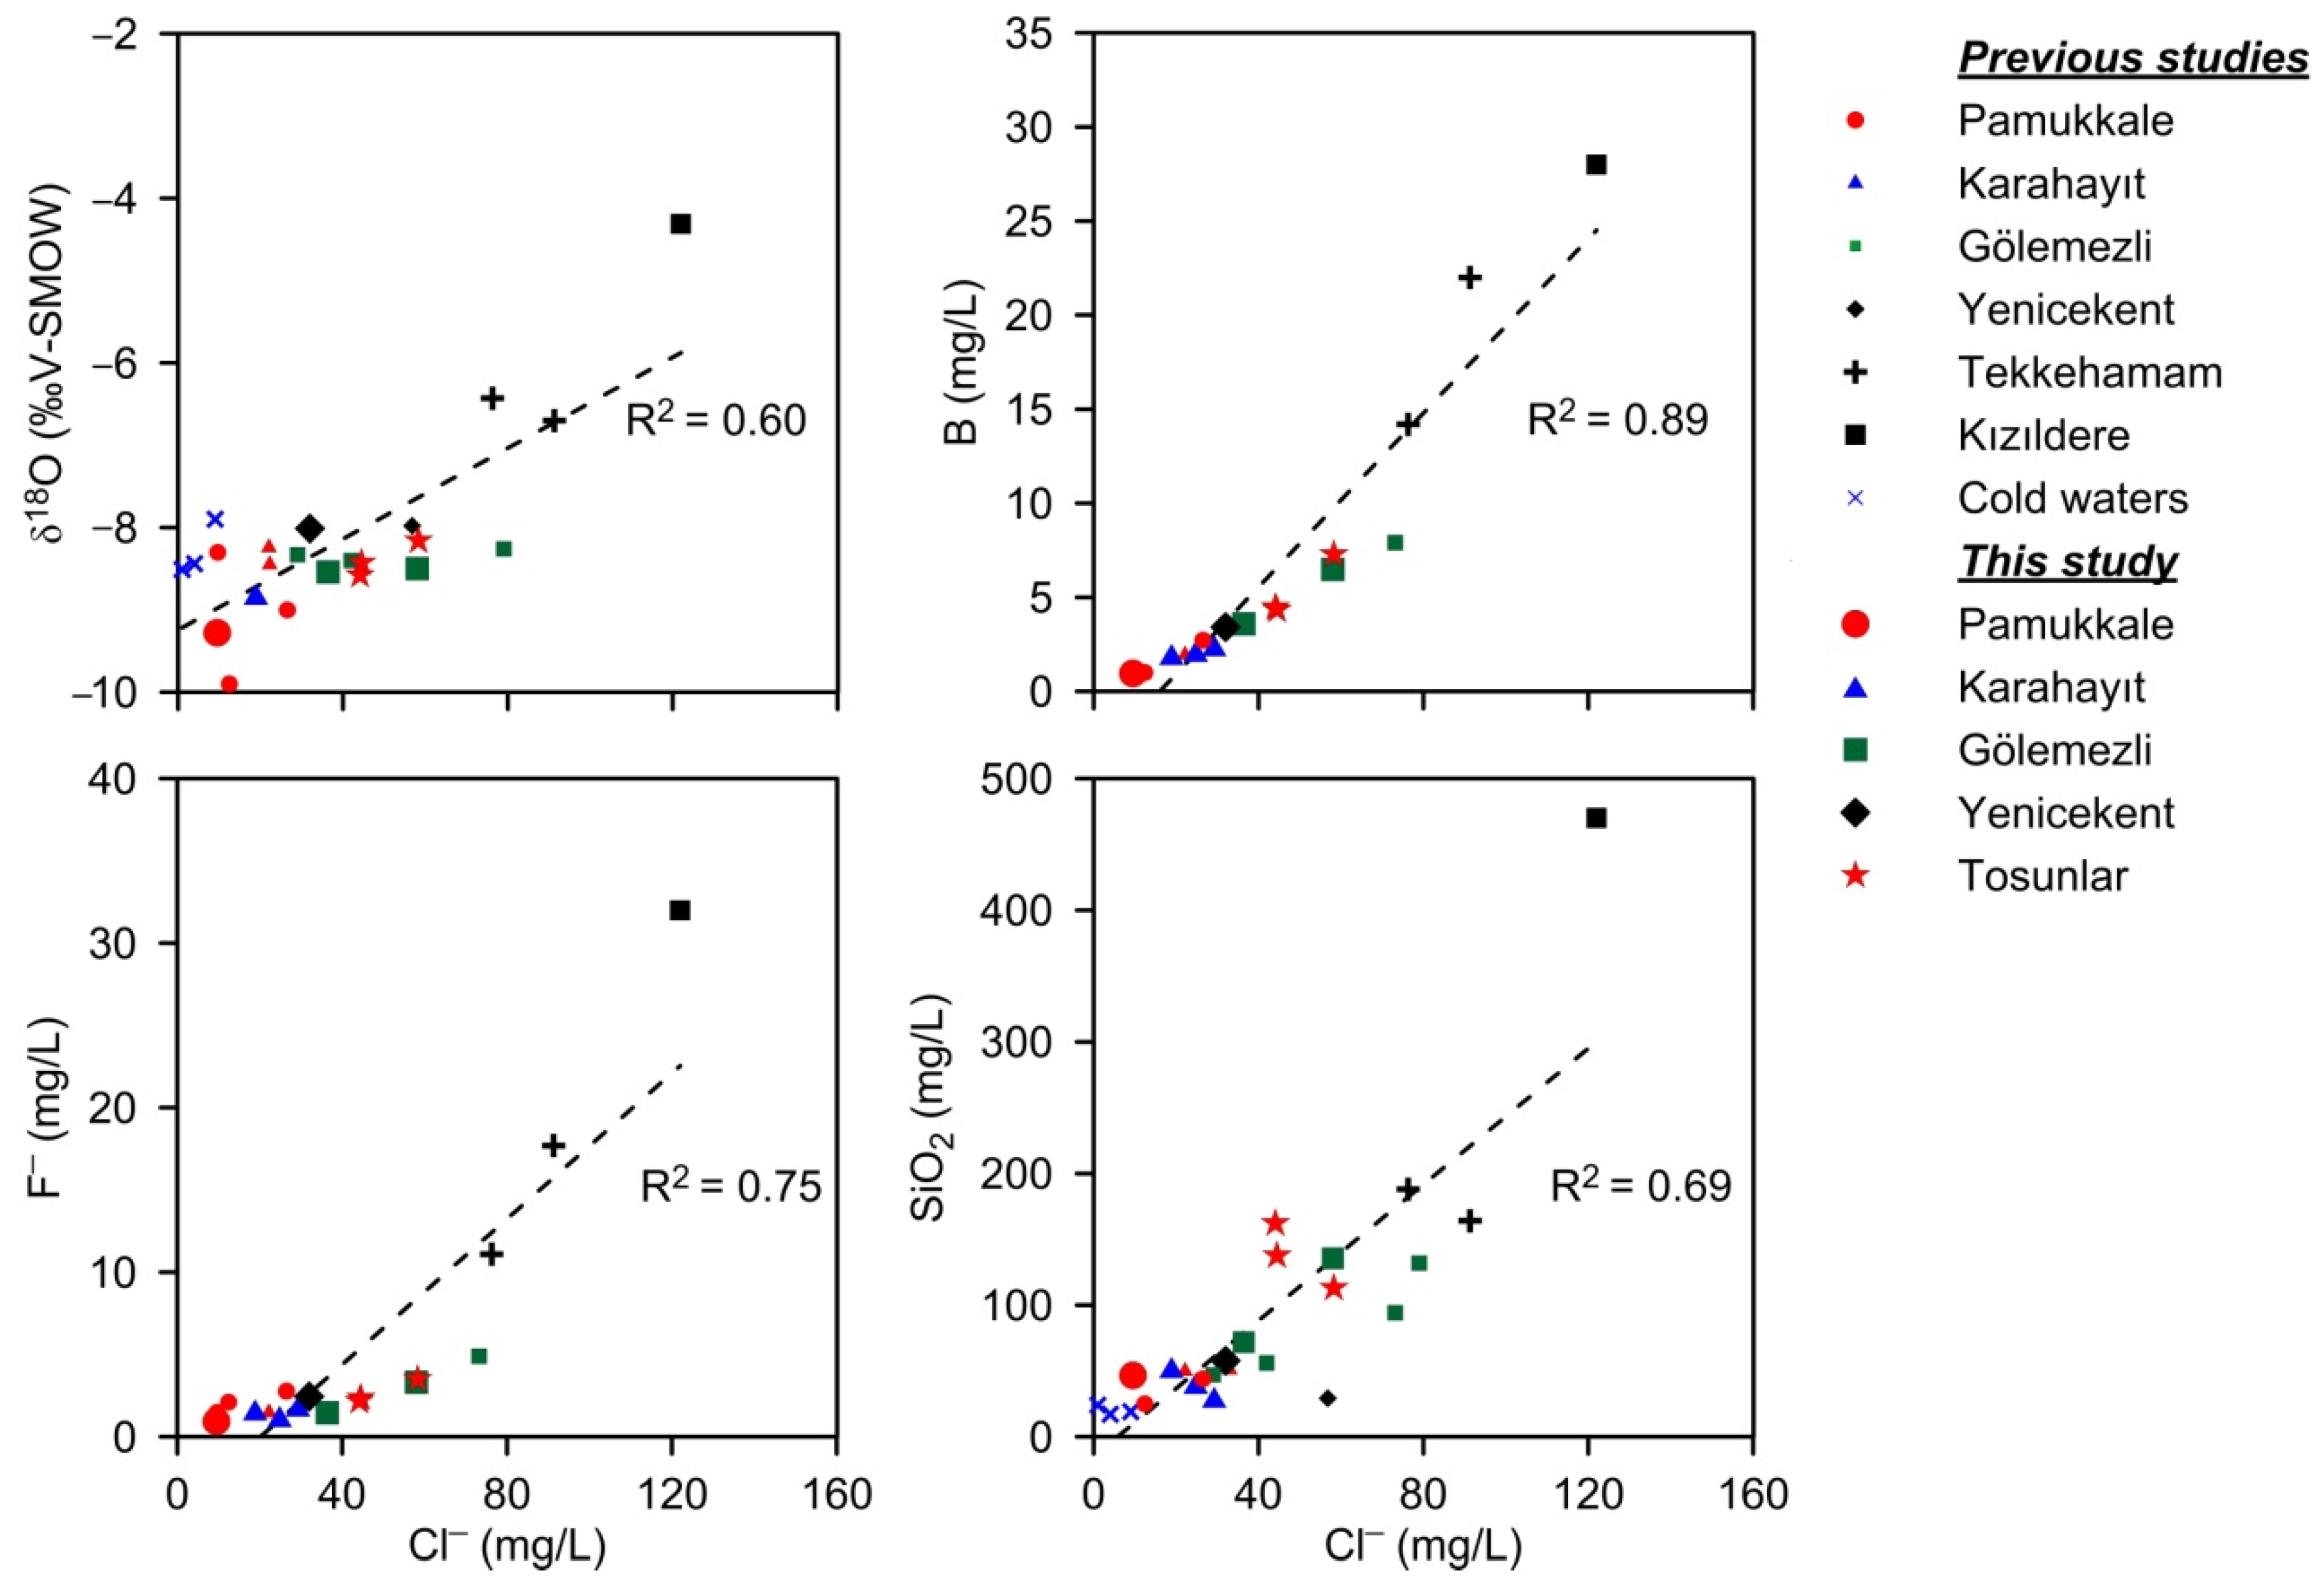
  • Na-SO4-HCO3 type thermal waters: Thermal springs and well waters in TeGF fall into this group. The temperatures of these thermal waters are reported between 23.4 and 168 °C [24,71,74]. Deep wells opened by private companies produced thermal waters with temperatures of about 170 °C. In these waters (in meq/L), 85% of the cations consist of Na+ (up to 876 mg/L), and 60–70% of the anions are comprised of SO42− (up to 1560 mg/L). These thermal waters have the lowest HCO3 contents among other group waters. Except for the KıGF samples, Cl, F, Li+, B and SiO2 values are significantly higher than other group waters (Table 2).
  • Na-HCO3-SO4 type thermal waters: The KıGF thermal waters constitute this group, which are characterized by high temperature (137–245 °C) and EC values (3010–5520 μS/cm) and generally alkaline (pH: 6.3–8.7) thermal fluids. In this group, waters with temperature above 200 °C (24 thermal wells) have the lowest Ca2+ (<10.3 mg/L) and Mg2+ (<1.79 mg/L), and the highest Na+ (1035–1538 mg/L), K+ (83–347 mg/L), alkalinity (1806–2990 mg/L), Cl (93.2−254 mg/L), F (8–33 mg/L), Li+ (2.6–5.7 mg/L), B (11.1–31.0 mg/L) and SiO2 (239–697 mg/L) contents [26]. The physicochemical properties of R-1 thermal well water (Table 2) best represent the KıGF waters.
Figure 5. Piper diagram of the waters.
Water 17 00961 g005
Figure 6. Semi-logarithmic Schoeller diagram of the thermal waters.
Water 17 00961 g006
Cold spring waters are generally of Ca-HCO3 type (Figure 5). They are slightly alkaline (pH:7.62–8.03) and have low EC values (380–460 μS/cm) (Table 2).

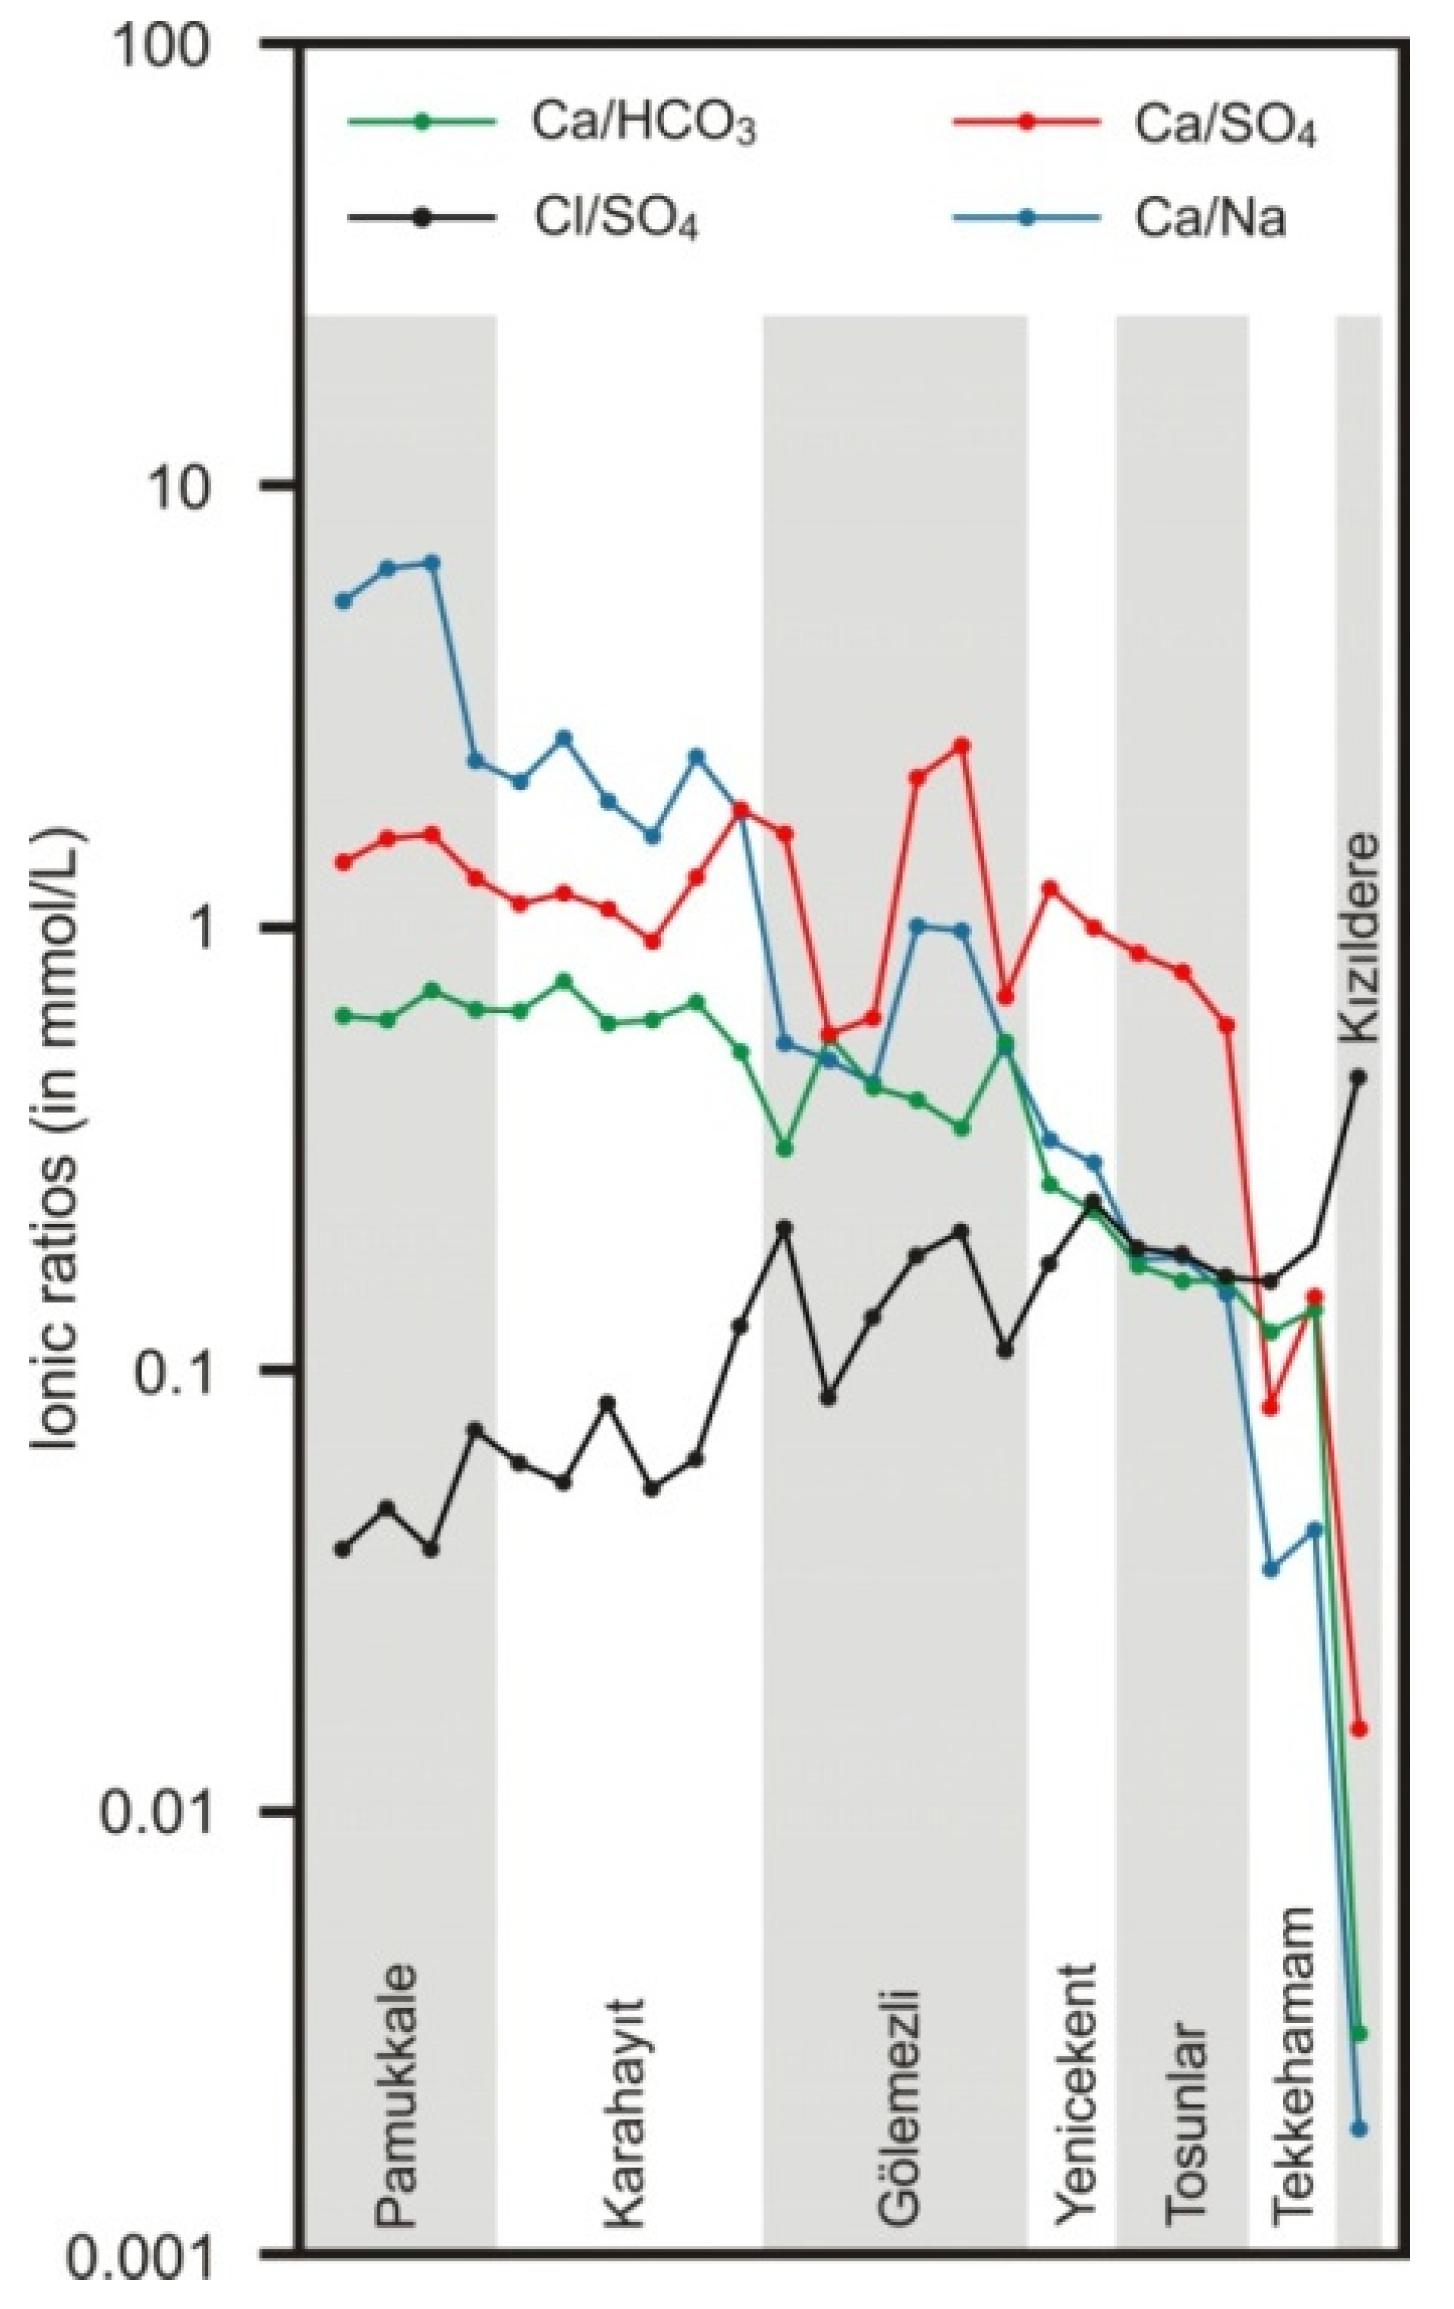
5.1.1. Factors Affecting the Chemical Composition of Waters

If the Na+/Cl- ratio in water is around one, the source of sodium in the water is halite dissolution; if it is greater than one, sodium is typically derived from silicate weathering [75]. In the Na–Cl graph (Figure 7a), there is a positive relationship between sodium and chloride contents of the studied waters (R2 = 0.86). The Na+/Cl- ratio increases with the dissolution of sodium-containing silicate minerals, especially through weathering and cation exchange [76]. The Na/Cl ratios of thermal and cold waters vary between 8.2 and 17.6. In addition, the base exchange index (BEI = [Cl − (Na+ + K+)]/Cl, in meq/L, [77]) values are from −1.6 to −27.6. BEI values are generally negative in waters interacted with metamorphic rocks since the extent of contribution of alkali ions is much more than chloride that is released by the weathering of silicates [78]. The deep (Paleozoic and Mesozoic) reservoir rocks of the geothermal fields in the study area are composed of marble, schist, dolomitic limestone and limestones, which is supported by the negative BEI values of the waters.
Limestone, dolomitic limestone and evaporites of the Çökelez formation, limestones and gypsums of the Neogene units, and marble and schists of the Menderes massive are the major sources of Ca2+, Mg2+ and SO42− ions in the thermal waters. The Neogene units roughly comprise 11 to 97% calcite, 3 to 37% dolomite and 0.5 to 39% gypsum [36]. In addition, marble and schists of the Menderes massive host some amount of dolomite [74]. Cretaceous ophiolitic mélange, consisting of serpentinized harzburgite, is another source particularly for Mg2+. Ca2+, Mg2+ and SO42− ions, originating from the following dissolution reactions for limestone/marble (1), dolomite (2), gypsum (3) and serpentinite (4):
CaCO3 + H2O + CO2 → Ca2+ + 2HCO3
CaMg(CO3)2 + 2H2O + 2CO2 → Ca2+ + Mg2+ + 4HCO3
CaSO4.2H2O + H2O → Ca2+ + SO42− + 3H2O
Mg3Si2O5(OH)4 + 6CO2 + 5H2O → 3Mg2+ + 6HCO3 + 2H4SiO4
In the Ca2+ versus Mg2+ diagram (Figure 7b), there is a strong positive correlation between Ca2+ and Mg2+ contents of waters (R2 = 0.84) and all samples lie to the right of the 1:1 line. The Ca2+/Mg2+ ratio of waters is greater than one indicating that calcite rather than dolomite is the primary carbonate mineral that dissolves [79]. For the studied thermal waters, this ratio varies between 1.8 (KH-3 well) and 13.8 (R-1 well), showing a calcite-rich carbonate source rock (e.g., marble and limestones). The dissolution of plagioclase in the metamorphic rocks of the Menderes Massif and gypsum in the Çökelez and Sazak formations also significantly contributes to the Ca2+ concentration in waters. The dissolution of dolomitic limestones and serpentinites is likely to be the main source of Mg2+.
In the Ca2+ versus HCO3 diagram (Figure 7c), thermal waters can be divided into two groups. The first is comprised of PGF, KGF and some GGF thermal waters (Göl-1 and Göl-2) with Ca2+/HCO3 ratio higher than one plotted in the grey area below the 1:1 line. The second group includes KıGF, TGF, YGF and some GGF thermal waters with Ca2+/HCO3 ratio lower than one plotted on and around the regression line. The Ca2+ and HCO3 of the first group of waters indicate derivation from carbonate rock dissolution. Gypsum dissolution is another mechanism that might increase the Ca2+ content of these thermal waters. In the second group of waters, there is a negative correlation between Ca2+ and HCO3 contents. In the thermal well waters of KıGF (R-1 well), TeGF, TGF, YGF and GGF, Ca2+ constitutes 0.35%, ~7%, ~21%, 34% and 40% of the total cations, respectively, while calcium content attains up to 60% in Pamukkale and Karahayıt waters. With increasing temperatures from PGF to KıGF, concentrations of Na+ (R2 = 0.75), Cl (R2 = 0.67), F (R2 = 0.80), B (R2 = 0.73), Li+ (R2 = 0.66) and SiO2 (R2 = 0.93) increase whereas a decrease is recorded in Ca2+ (R2 = 0.48) content. The high Na+ and low Ca2+ concentrations especially in KıGF and TGF thermal waters might be attributed to (a) a decrease in CaCO3 solubility with increasing temperature, (b) calcite and aragonite precipitation as a result of boiling (CO2 escape) during the rise of thermal waters to the surface, (c) increasing feldspar (NaAlSi3O8) dissolution with increasing temperature and (d) cation exchange between Na+ and Ca2+ (Figure 7d). Therefore, thermal waters in these fields have evolved into the Na–HCO3 type (Figure 7e).
GGF (DG–1 and Göl–2) and TeGF thermal waters have high SO42− and relatively low Ca2+ concentrations (especially in Tekkehamam thermal waters) (Table 2, Figure 5, Figure 6 and Figure 7f). According to Alçiçek [36], vein-type gypsums were crystallized within dissolution pores of the limestones of the Sazak formation that interact with sulfur-rich hydrothermal solutions. The quite high sulfate concentrations in Gölemezli and Tekkehamam thermal waters can be attributed to one of the reasons listed below:
  • Gypsum dissolution within Neogene formations (particularly Sazak formation). In the Gölemezli and Tekkehamam fields, the Neogene cover above the Menderes massif is quite thick. For example, in the MDO-1 well drilled at Tekkehamam to a depth of 2401 m, the cover thickness is 1950 m (Sazak formation progresses between 814 and 1143 m) [74].
  • Dissolution of sulfide minerals. Geothermal wells drilled in the region indicated that Menderes massif (especially schist) contains pyrite [51,73]. However, the amount of sulfate originating from sulfite oxidation in the thermal waters is considered insignificant.
  • Oxidation of H2S (or SO2). The gas component of thermal fluids in the Kızıldere field is composed of 0.008 to 0.052% H2S [26]. H2S possibly occurs in the Tekkehamam and Gölemezli fields. Oxidation of H2S results in the addition of large amounts of sulfate to the water in these fields. The elevated sulfate concentrations in the Tekkehamam springs could also have resulted from further oxidation of H2S or SO2 by the oxygen-rich groundwaters which might precipitate native sulfur [19].
Tekkehamam and Gölemezli thermal waters have an intense odor of H2S, which is less likely to originate from the mantle. More likely, this gas may be formed by bacterial reduction of sulfate at shallow depths. During the drilling of the KB-5 well in the Tekkehamam field, a significant amount of petroleum-like material (PLM) along with 120 °C thermal water gushed to the surface from the clay and marl units of the Kolankaya formation at depths of 120–132 m [80]. Results of analyses showed that PLM from this well is indeed petroleum, and that the source rock is composed of Tertiary carbonate, clay and bacterial organic matter accumulated under terrestrial + anoxic conditions. A similar case is also recognized in the wells of the Gölemezli field (in the DG-1 and Göl-2 localities). When evaporitic gypsum comes into contact with organic matter-rich sediments or hydrocarbon-rich fluids, it allows the development of microbial communities dominated by sulfate-reducing bacteria, which dissolve gypsum at temperatures below 80 °C and promote carbonate and sulfur precipitation [81]. We believe that this mechanism plays a major role in the formation of native sulfur deposits in the Tekkehamam area. Native sulfur is observed at many points that precipitate from H2S that rises through fractures to higher elevations than the thermal spring manifestation site.
Finally, the Ca2+ + Mg2+ versus HCO3 + SO42− diagram shows that chemical compositions of PGF, KGF and GGF thermal waters might be best explained by the dissolution of carbonate, silicate and evaporite, while silicate weathering is the dominant factor defining the chemistry of waters in other areas (Figure 7g).
A linear relationship between δ18O and chloride content may be good evidence for a possible mixing between the thermal waters and warmer or colder groundwater [82]. In addition, the existence of a linear relationship between chloride and sodium, boron, fluoride and silica concentrations of waters also supports the mixing event. Considering the cold waters and R-1 thermal well water (in the KıGF field) as the two end members (Figure 7a and Figure 8), a strong positive correlation occurs between Cl and δ18O, Na+, B, F and SiO2 with R2 values ranging from 0.60 to 0.89. Although the B and F concentrations of cold waters are unknown (Table 2), the average concentrations of these ions were reported as 0.06 mg/L for B and 0.27 mg/L for F [22], which are significantly lower than the thermal waters. In conclusion, Figure 7 and Figure 8 show that there is an increasing cold groundwater contribution to the thermal waters from TeGF to TGF, GGF, YGF, KGF and PGF.
In the studied geothermal fields, the Cl/SO42− ratios increase whereas Ca2+/HCO3, Ca2+/SO42−and Ca2+/Na+ ratios decrease from PGF to KıGF (Figure 9). Considering the aforementioned assessments, the temperatures of thermal waters and their residence time (the extent of interaction with reservoir rocks) increase from PGF to KIGF, and the mixing ratios of cold groundwater decrease. Especially, the degree of silicate weathering increases from YGF to KıGF. The highest variations in these ionic ratios are observed in GGF thermal waters since the depths of thermal wells vary greatly (137 to 1500 m) and they receive water from different reservoirs (Figure 2).
Periodical analyses carried out in the Pamukkale, Karahayıt and Gölemezli thermal waters in the periods of 1991–1993 [65], 1993–1996 [62], 1995 [83] and 2023–2024 [84] indicated that their physicochemical compositions did not significantly change in time. Although there were substantial fluctuations in the chloride and nitrate levels of Pamukkale thermal waters due to anthropogenic pollution in the white travertine area (before 2000), the anomalous chloride concentrations disappeared with the demolition of hotels.
In the TeGF field, sometimes the thermal spring outlets become sealed due to CaCO3 precipitation and the thermal water resurfaces from another nearby point forming a new spring. The decrease in thermal water pressure, the drying up of existing thermal springs or the emergence of new springs due to earthquakes are common to TeGF. It has been determined that variations in the temperature, electric potential and acoustic emission parameters of the thermal waters in this area are related to seismic activity [85]. For example, after the 12 April 2019 earthquake (Mw = 5.1) [86] with the epicenter very close to the İnaltı thermal spring, the flow rate of natural mud pools increased and their temperature rose to a value that would not allow people to enter. Another earthquake (Mw = 4.2) with an epicenter around the Pamukkale thermal spring area occurred on 28 September 2016. Unfortunately, there is no record documenting the possible changes in water chemistry before, during and after these earthquakes.

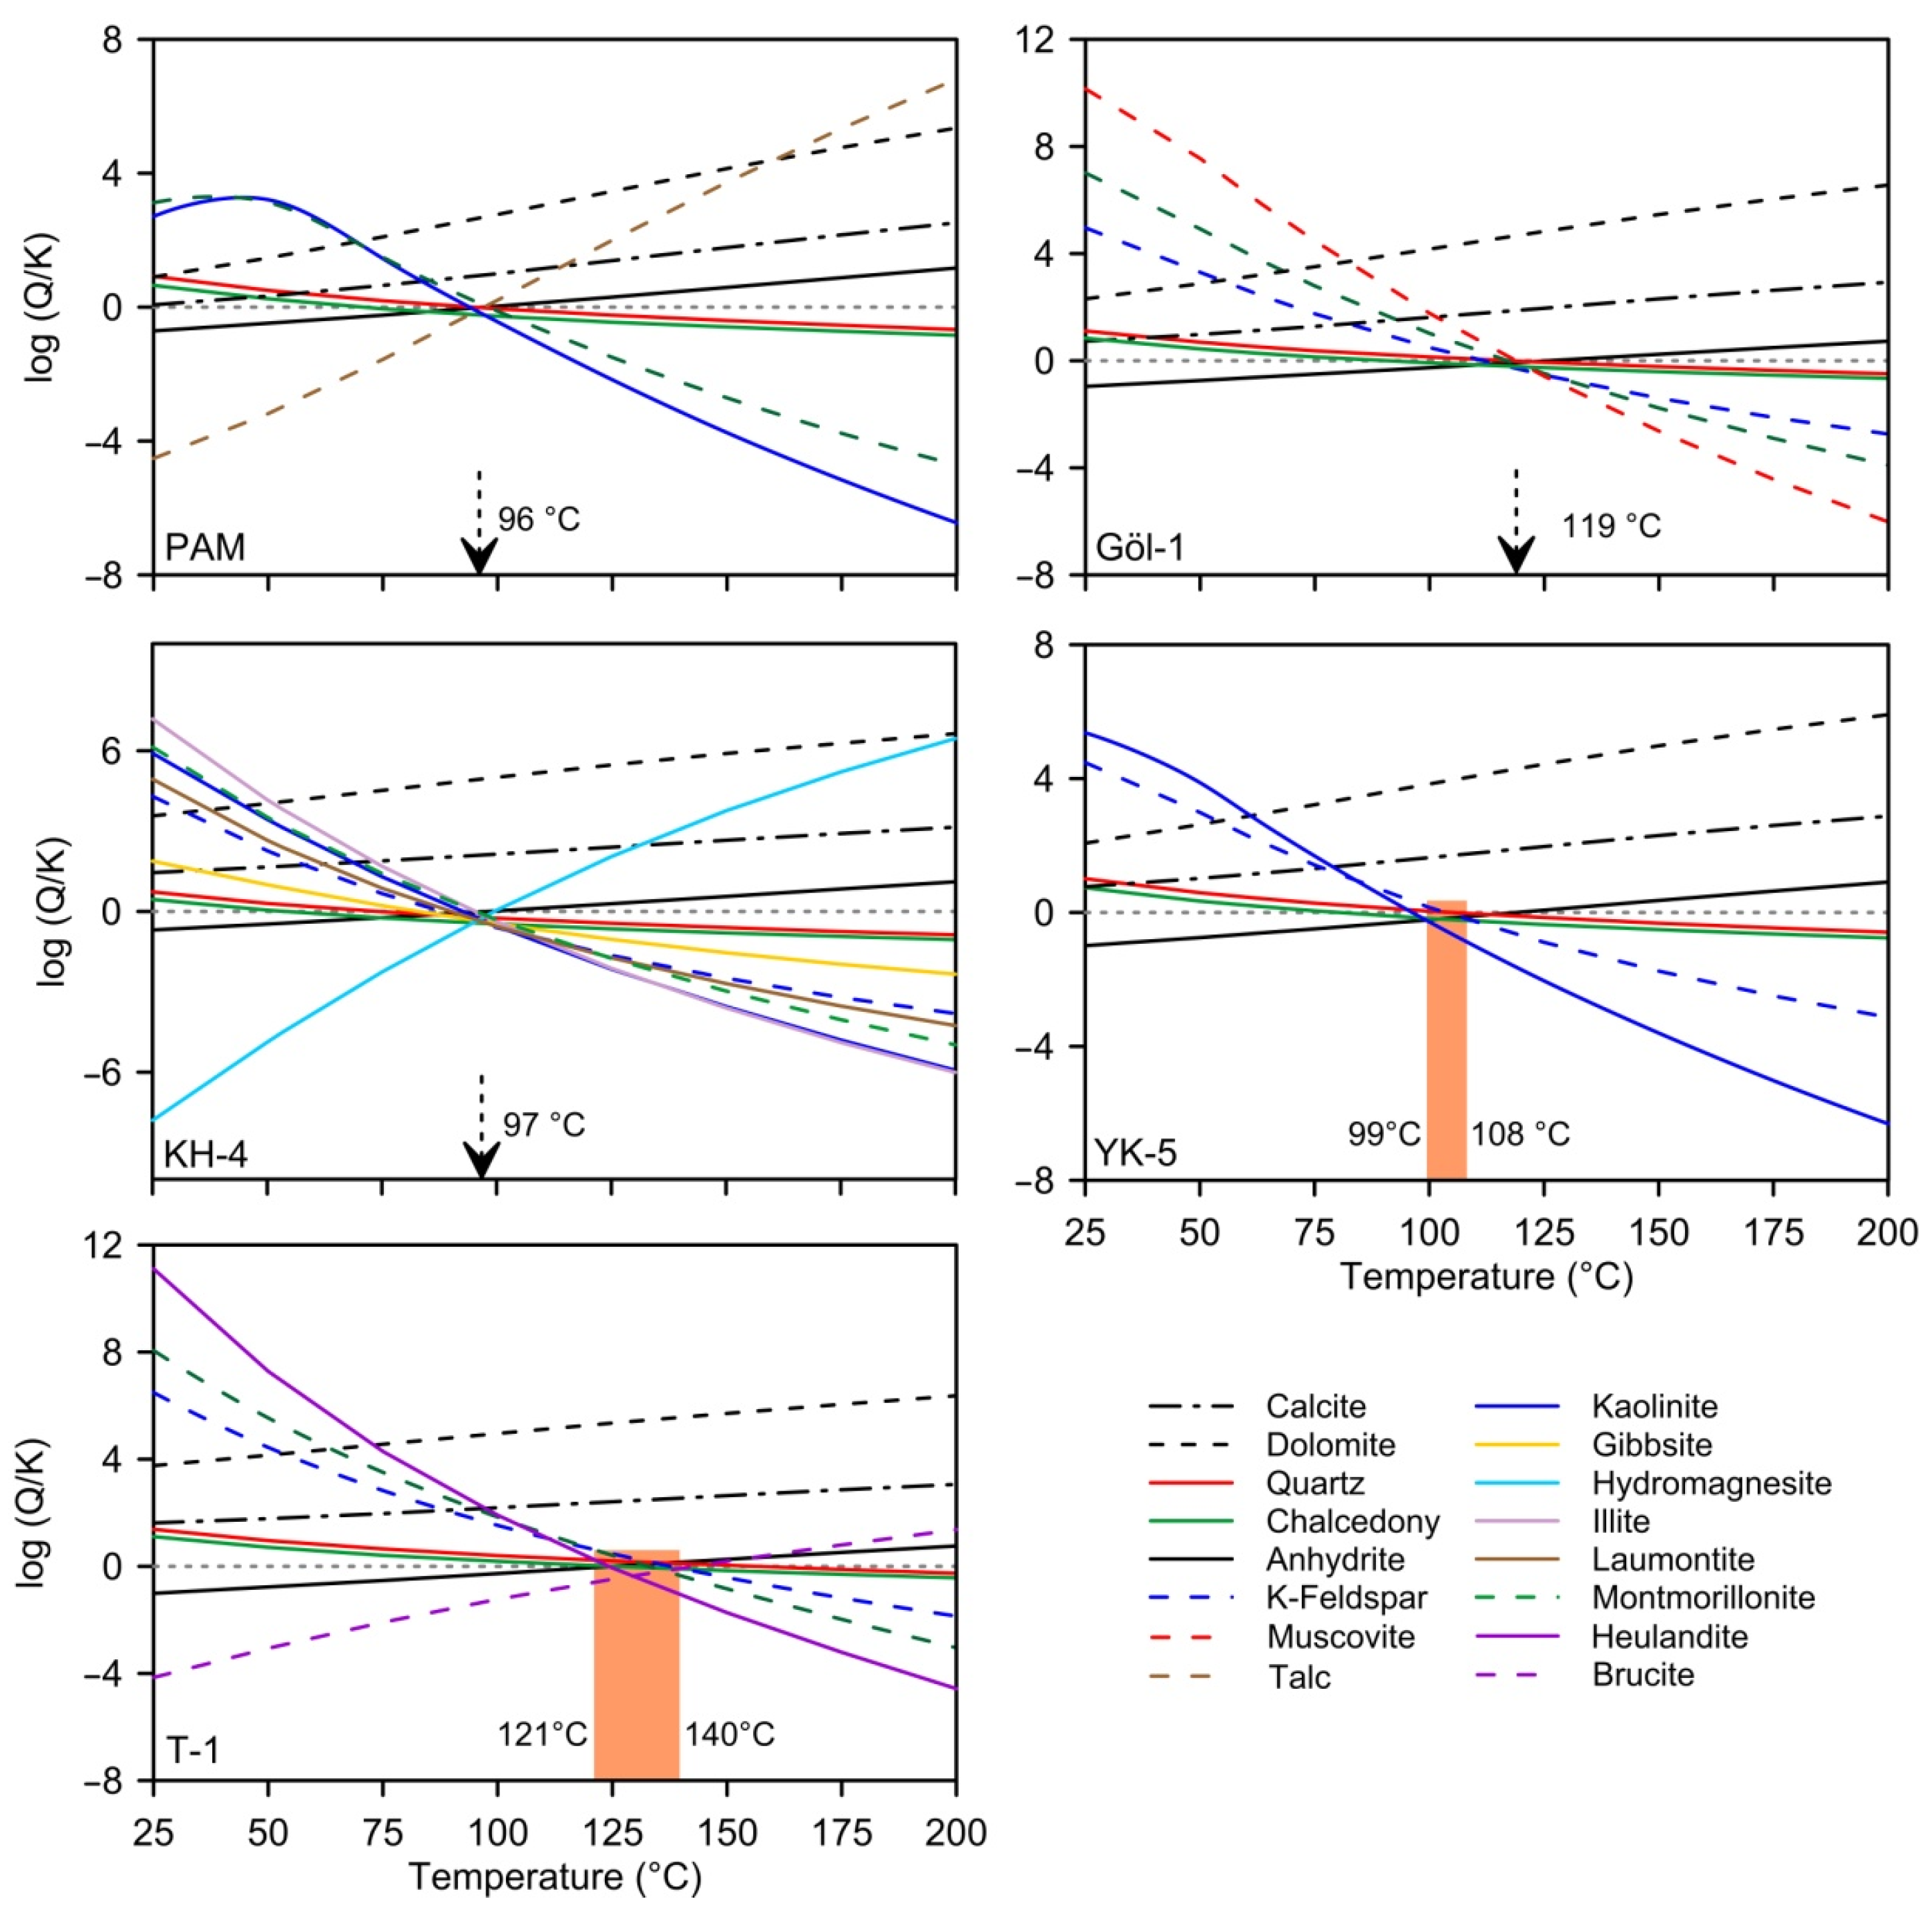
5.1.2. Mineral Saturation

The saturation states of studied thermal waters with respect to various minerals were calculated at discharge temperatures with the use of the PhreeqC program (version 3) [87]. Accordingly, all thermal waters are saturated with calcite, aragonite, dolomite, illite, K-feldspar, montmorillonite, muscovite and quartz, and undersaturated with fluorite and gypsum minerals. With the exception of Tosunlar thermal waters, all other samples are oversaturated with respect to gibbsite and kaolinite. Albite is undersaturated in waters PAM, KH-2 and KH-3 but it equilibrates with all other waters. Excluding the Göl-2 sample, all other waters are undersaturated with anhydrite. Thermal waters are at near saturation with respect to chalcedony.
In XRD analyses, calcite and aragonite were detected in the scaling samples from the T-1, Göl-1 and DG-3 wells. In the scaling material of the Göl-2 well, quartz and calcite, as well as gypsum, were recorded, considering that this well was drilled at a shallower depth (141 m) compared to Göl-1 (604 m) and was discharged from the evaporite-bearing units (e.g., gypsum and anhydrite). In YK-5 and KH-2 wells, only calcite and dolomite were detected as the scaling. In the Kızıldere field, calcite, aragonite, dolomite, strontianite and amorphous silica are the major scaling minerals [88,89,90]. In all studied fields, the scaling problem possibly creates a significant problem during energy production which might be solved by inhibitor injection.

5.2. Isotope Composition

5.2.1. Oxygen–Hydrogen Isotopes

For thermal waters, δ18O values vary from −9.28 (PAM) to −8.01‰ (YK-5) and δD values range from −60.82 (T-2) to −55.17‰ VSMOW (YK-5) (Table 3). In previous studies, δ18O and δD were, respectively, reported −10.0 to −8.84‰ and −61.0 to −57.0‰ (n = 18) [23,25,71,72,91,92,93] for PGF, −9.14 to −8.07‰ and −59.5 to −51.8‰ (n = 14) [22,25,52,71,72,83,91,92] for KGF, −8.54 to −8.13‰ and −61.09 to −56.2‰ (n = 11) [21,91,92] for GGF and −8.80 to −7.50‰ and −59.7 to −50.2‰ VSMOW (n = 18) [20,66,71,91,92,94,95] for YGF. These values are consistent with the oxygen and hydrogen isotope compositions of studied waters. δ18O and δD of TeGF and KıGF thermal waters are significantly higher than those of other fields, ranging from −7.40 to −4.10‰ and −57.60 to −51.30‰ for TeGF [52,71] and −8.50 to −4.30‰ and −61.81 to −34.10‰ for KıGF [26,52,71,94], respectively. No significant change was observed in the δ18O and δD values of the Pamukkale and Karahayıt thermal waters during the monitoring carried out in 1994–1995 [62]. However, stable isotope values of some thermal samples collected in the TeGF field during dry and rainy periods showed negligible seasonal differences [24]. Oxygen and hydrogen isotope values of cold waters are between −8.80 and −7.24‰ and from −56.0 to −50.01‰ (n = 14) [21,71,83], respectively.
In the δ18O–δD graphic (Figure 10a), cold waters and most low-temperature waters (<70 °C) plot between the local meteoric water line (LMWL) [96] and global meteoric water line (GMWL) [97]. One sample from the PGF thermal waters plots close to the Mediterranean meteoric water line (MMWL) [98]. It is concluded that studied cold and thermal waters have a meteoric origin. There is no significant 18O shift (between 0.4 and 1‰) for the PGF and KGF thermal waters. For samples GGF, YGF and TGF, δ18O deviation from LMWL is around 1.2–1.5‰. The highest deviations are seen in waters TeGF (2.7 to 3.3‰) and KıGF (3.2 to 4.6‰) (Figure 10a).
Table 3. Results of isotope analyses for the studied waters.
SiteSample IDδ18OδDd-ExcessTδ13C δ34S(SO4) δ18O(SO4)14CAge *Age
(VSMOW)(VSMOW)(VSMOW)(TU)(VPDB)(VCDT)(VSMOW)(pmC)(YBP)(YBP)
This study
PamukkalePAM−9.28−59.7514.492.165.6816.8213.94nanana
KarahayıtKH-3−8.81−57.6912.792.135.4517.1113.731.10435,95436,202
KH-4−8.57−55.6312.93nanananananana
GölemezliGöl-1−8.54−57.6210.700.547.6516.4312.640.61740,61340,878
Göl-2−8.50−60.567.440.023.7920.0415.710.67639,90940,143
YenicekentYK-5−8.01−55.178.910.056.3214.1010.650.93037,40837,662
TosunlarT-1−8.43−59.358.090.712.5516.4611.335.87922,53822,764
T-2−8.58−60.827.82nanananana na
T-3−8.16−59.575.710.542.2016.5910.641.57833,10733,328
RainwaterRWnanana5.64nananananana
Previous studies
PamukkalePAM a−9.90−58.7020.503.50na14.3016.74nanana
Beltes b−8.30−58.907.50nanananananana
Çukurbağ b−9.00−58.7013.30nanananananana
KarahayıtKH-2 c−8.45−56.4911.11na9.76nanananana
KH-3 d−8.24−53.0012.93nanananananana
GölemezliDG-3 e−8.33−57.419.230.406.98nanananana
Göl-1 e−8.40−57.809.400.236.18nanananana
Göl-2 e−8.26−60.465.620.215.11nanananana
YenicekentYK-1 f−7.98−56.257.59na6.80nanananana
Tekkehamamİnaltı a, g−6.70−57.50−3.900.100.9011.1018.692.130-34,898
W-3 h−6.43−53.32−1.880.00nananananana
KızıldereR-1 i−4.10−51.30−18.500.331.26nana2.270 31,034
Cold watersCS-1 c−8.44−54.7012.82na−10.38nanananana
CS-2 c−8.51−54.1913.892.73−9.71nanananana
CS-3 c−7.90−54.139.07na−8.16nanananana
Note: a Yıldırım and Güner [71], b Kele et al. [25], c Alçiçek et al. [22], d Özkul et al. [72], e Alçiçek et al. [21], f Alçiçek et al. [20], g Güner and Yıldırım [99], h Avşar and Altuntaş [24], i Şimşek [52]. * Uncorrected radiocarbon ages; na: not analyzed.
18O exchange between mineral and water depends on several parameters which include temperature, reservoir mineralogy, mineral dissolution–precipitation processes, mixing, mineral alteration, circulation rate and water/rock ratio [100]. The reservoir rocks in the study area are comprised of Cenozoic/Mesozoic limestone, Paleozoic marble, schist, and quartzite. For this reason, 18O exchange in the reservoir occurs by the reactions between thermal waters and calcite, quartz (or chalcedony) and feldspar minerals [100]:
CaCO218O + H2O ↔ CaCO3 + H218O
SiO18O + H2O ↔ SiO2 + H218O
CaAl2Si2O718O + H2O ↔ CaAl2Si2O8 + H218O
Steam separation from thermal fluids in the TeGF and KıGF fields might result in 18O enrichment of residual waters. The degree of isotope exchange rate is increased with increasing temperature and therefore 18O shift in thermal waters reflects the establishment of mineral–water equilibrium at reservoir temperatures [100]. This is more pronounced for the Kızıldere waters which have the highest bottom-hole temperatures. The oxygen isotope composition of Kızıldere waters (samples labeled KD and R-1 in Figure 10a) display a positive deviation up to 4‰ from the global meteoric water line indicating an intense water–rock interaction with carbonate and silicate rocks by the reactions shown in Equations (5)–(7).
Using the δD–elevation relation of cold water springs on the Yenice horst, Yıldırım and Güner [71] estimated the average recharge elevations of PGF, KGF, GGF and YGF thermal waters in the range of 1070 to 1370 m which correspond to area comprised by permeable lithologies such as limestones of Sazak formation and sandstones of Kolankaya formation. Results of the same study showed that TeGF and KıGF thermal waters are manifested through the gneiss and schists at elevations of 1300 to 1900 m. In a recent study by Alçiçek et al. [22,23], based on the δ18O–altitude relation, the recharge elevation of PGF and KGF waters is reported as 850–900 m. The reaction between high-temperature waters and oxygen-bearing minerals within the reservoir may cause δ18O enrichment in the thermal water. For this reason, in the estimation of recharge elevation, δD–altitude relation is expected to yield much more realistic results. We made an attempt here to determine the recharge elevations of sampled waters using δD values of cold spring waters that issue at different elevations of studied fields (Figure 10b). There is a strong positive correlation between δD contents of waters and elevations (R2 = 0.99) and the elevation effect is found –4‰/100 m. As shown in Figure 10b, thermal waters sampled in this study have recharge elevations of 1030–1175 m, which agree with values proposed by Yıldırım and Güner [71].
Figure 10. (a) δ18O vs. δD diagram for the thermal and cold waters of the Denizli basin. Stable isotope data from previous studies are also included for comparison. In addition to studies cited in Table 3, the Tekkehamam data of Karakuş and Şimşek [19] and Kızıldere data of Şimşek [52] and Yaman and Özgür [101] were also used. (b) Recharge elevations estimated for the sampled waters. Data for Gürpınar, Sakızcılar and Sepet springs are from Önhon et al. [102] and Pınarbaşı spring data are from Yıldırım and Güner [71]. Shaded area represents the estimated range of recharge elevation.
Water 17 00961 g010

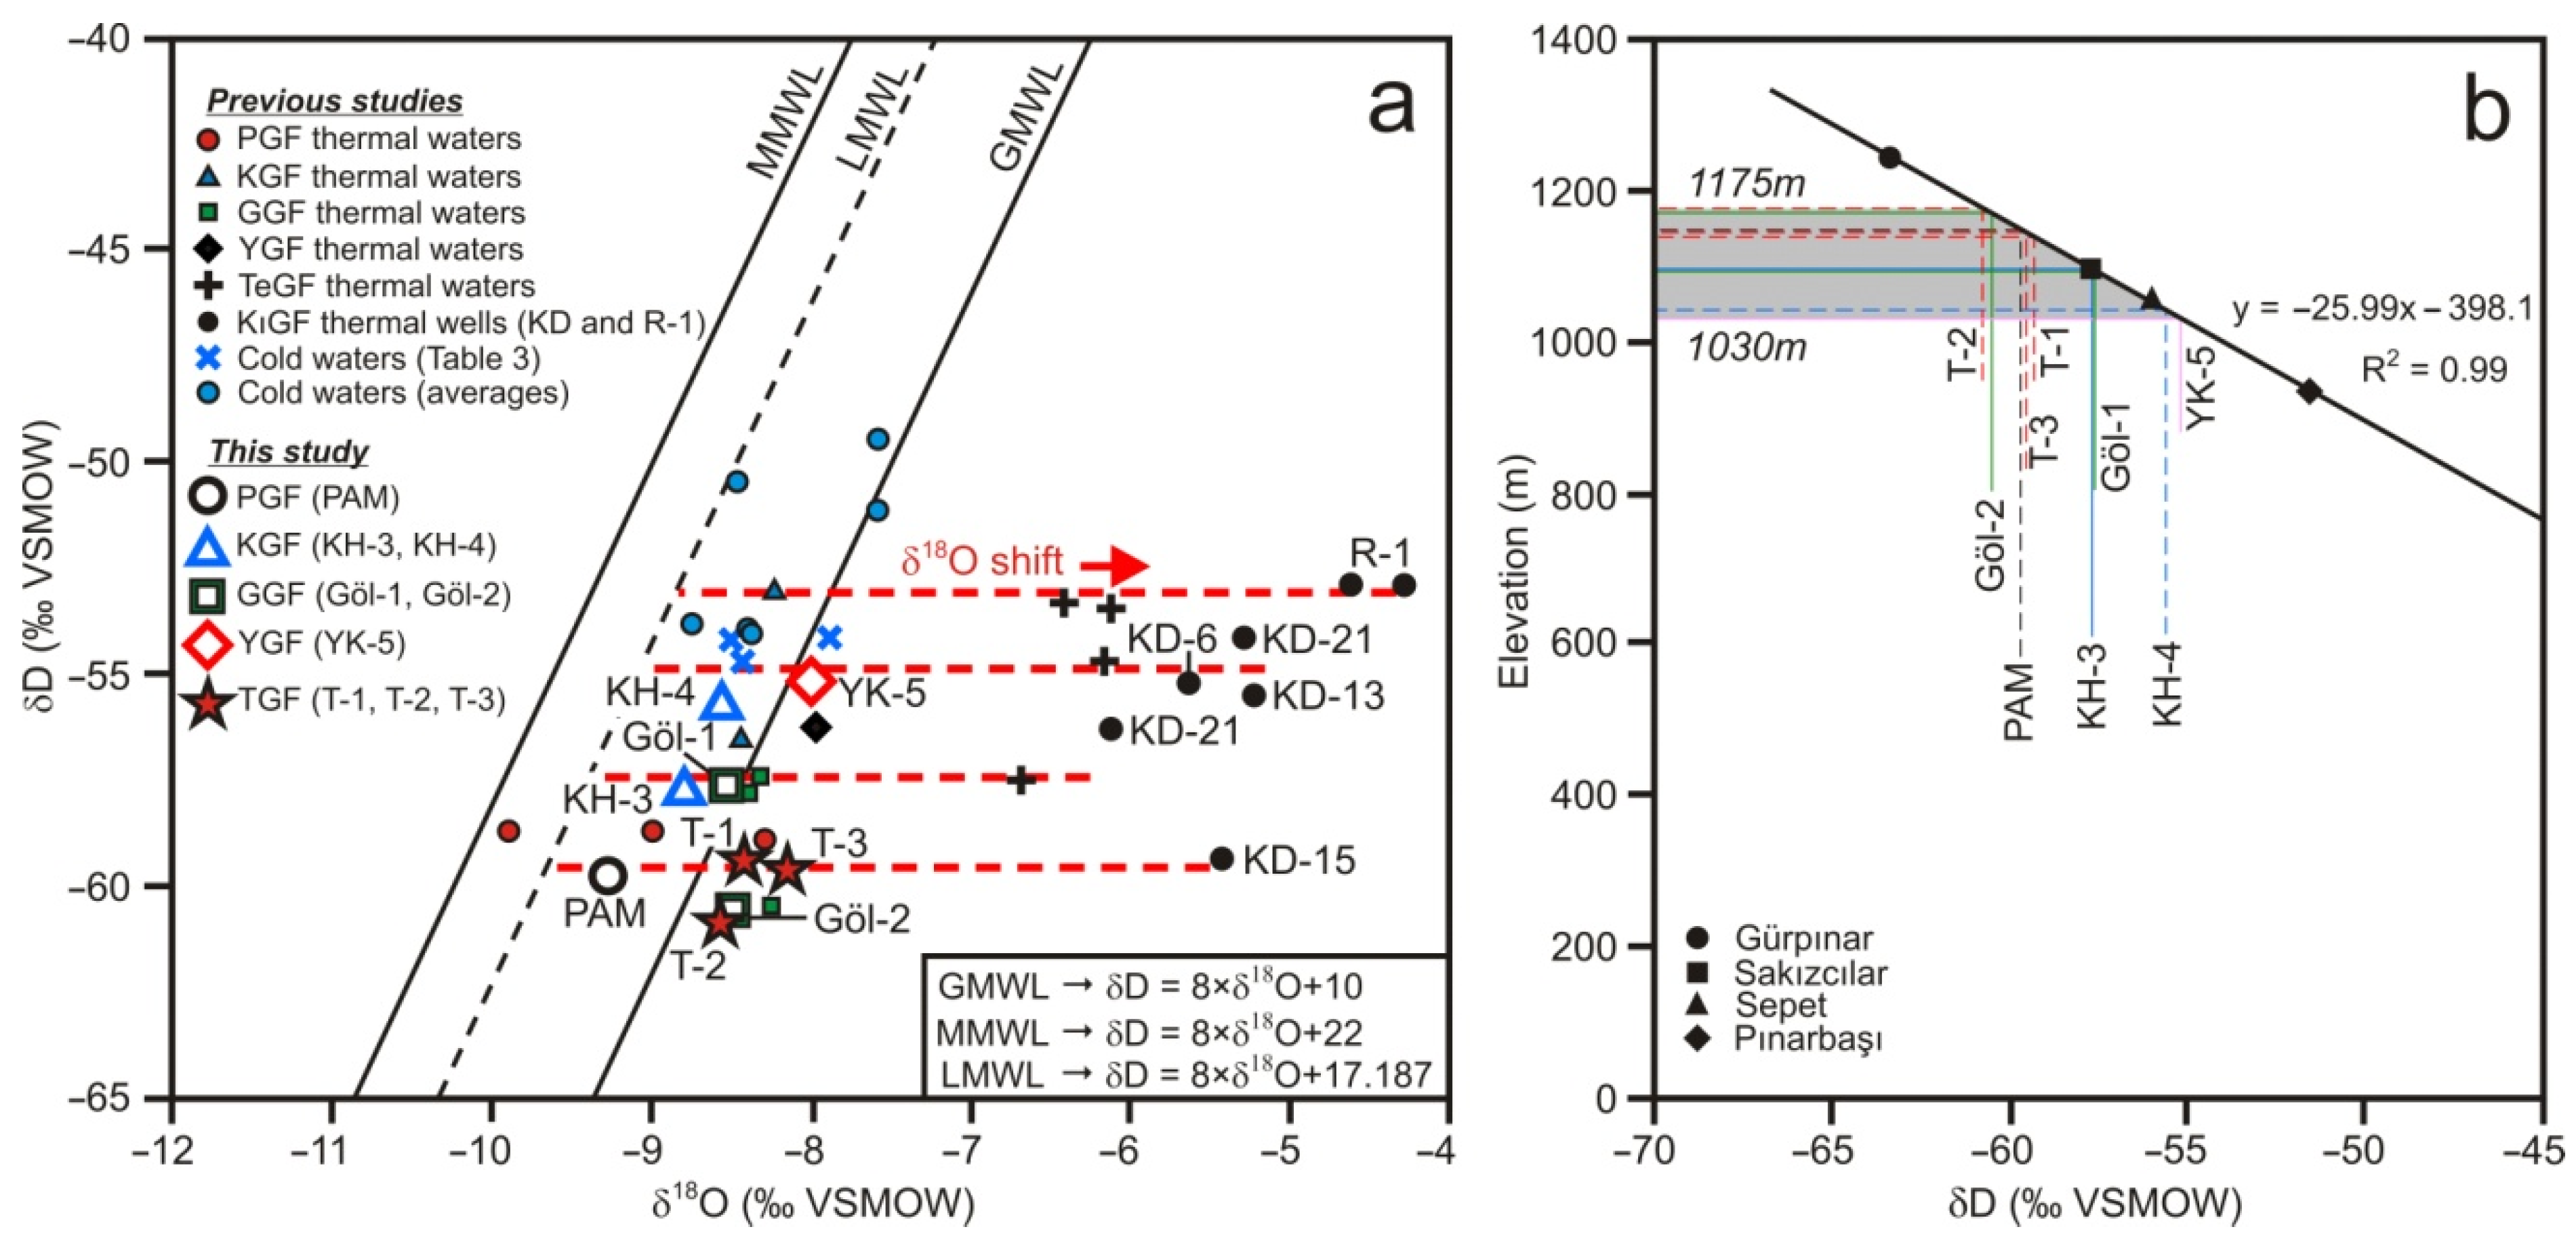
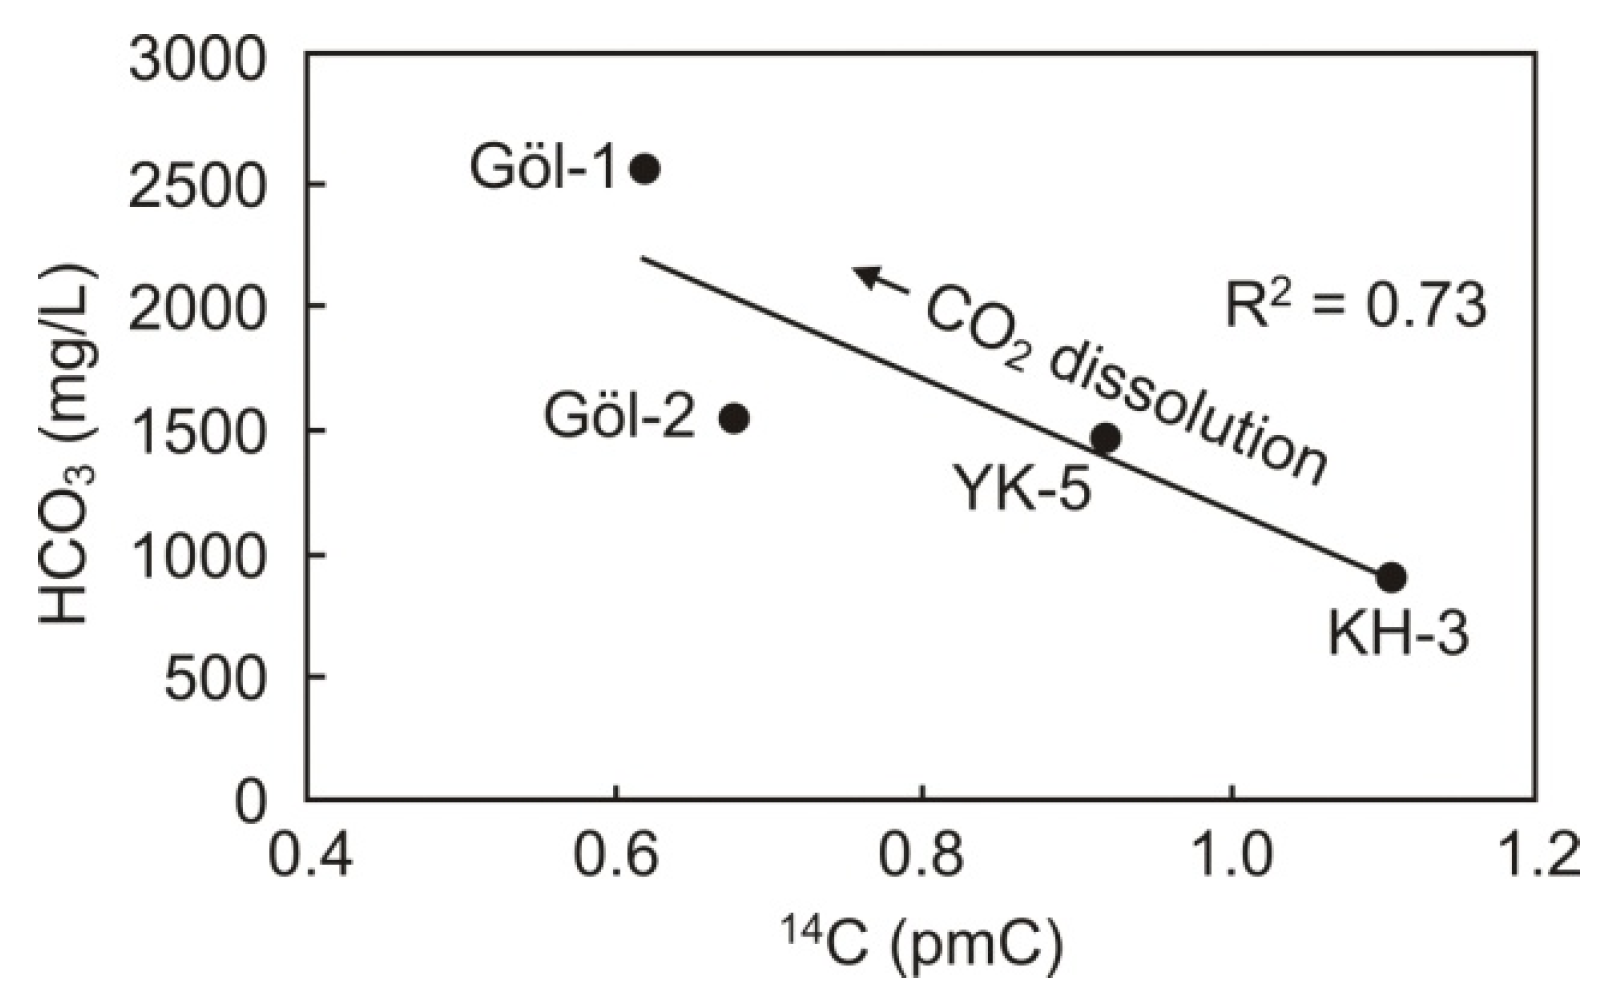
5.2.2. Water Circulation

Tritium contents were measured for both thermal and local rainwater. Tritium ranges from 0.02 (Göl-2) to 2.16 TU (PAM) in thermal waters (Table 3). Tritium in local rainwater was measured at 5.64 TU. At the Yeşiloba station 50 km NE of the study area, the 3H content of 1988 precipitation was recorded in the range between 4 and 22 TU [102]. Tritium values in previous studies were reported at 0.10 to 4.50 TU for PGF thermal waters and <1.20 TU for waters in other fields [21,22,23,24,52,71,83,92,95]. These values are consistent with our tritium data. 3H content in cold waters is quite high varying from 0.39 to 17.4 TU (mean 12) [22,71,83].
Except for the Pamukkale thermal spring and Karahayıt KH-3 well, 3H values of thermal waters are close to zero indicating a deep circulation. In other words, these fluids are sub-modern waters recharged by precipitation of pre-1952 (<0.8 TU; [100]). In this study, tritium values of PAM and KH-3 thermal waters are very close (2.16 and 2.13 TU). In previous studies, 3H values of PGF and KGF waters were reported 0.10–4.50 TU [23,52,71,93] and 0.00–1.20 TU [22,52,71,91], respectively. It is likely that PGF thermal waters and, depending on the sampling period, KH-3 thermal water reflect the mixture of sub-modern and modern precipitation (0.8 > TU > ~4; [100]). The limited number of cold water samples indicate sub-modern recharge whilst the majority imply recharge by recent precipitation (5–15 TU, <5–10 years; [100]). Because chloride behaves in a conservative manner, it may yield qualitative information on the circulation time of waters. Comparison of tritium and chloride contents of studied waters yields that waters with low Cl concentrations (<20 mg/L) are correlated with high tritium values (>2 TU) whereas waters with high Cl concentrations have low tritium contents (<0.8 TU) (Table 2 and Table 3).
14C values measured in selected thermal waters are 0.617 (Göl-1) to 5.879 pmC (T-1) (Table 3). In previous studies, pmC values were reported at 2.13 [99] and 0.44 [24] for TeGF thermal waters and 94.13 for the cold water (T = 7.7 °C, EC = 118 μS/cm) [24]. The pmC in four thermal wells in KıGF was measured between 0.21 and 2.27 [99]. Cold spring at the recharge area of KıGF (T = 9.9 °C, EC = 118 μS/cm) has a pmC of 116 [99]. The pmC values of waters sampled in this study are slightly higher than thermal fluids in TGF and KıGF fields. The apparent 14C age of these samples was computed using the method outlined below.
The Radiocarbon dating technique is based on the measurement of carbon lost by decay of parent radionuclide (14C). Application of this method prerequisites two major assumptions: (1) the initial activity of parent radionuclide is known which remained constant in the past and (2) the system is closed to the loss and gain of parent radionuclide except for radioactive decay. When these conditions are ensured, the age of water can be computed from the decay equation:
α t = α 0 × e λ t
  • α 0 : Initial activity of parent radionuclide
  • α t : Activity of parent radionuclide at time t (measured value)
  • λ: Decay constant (for 14C:5730 years).
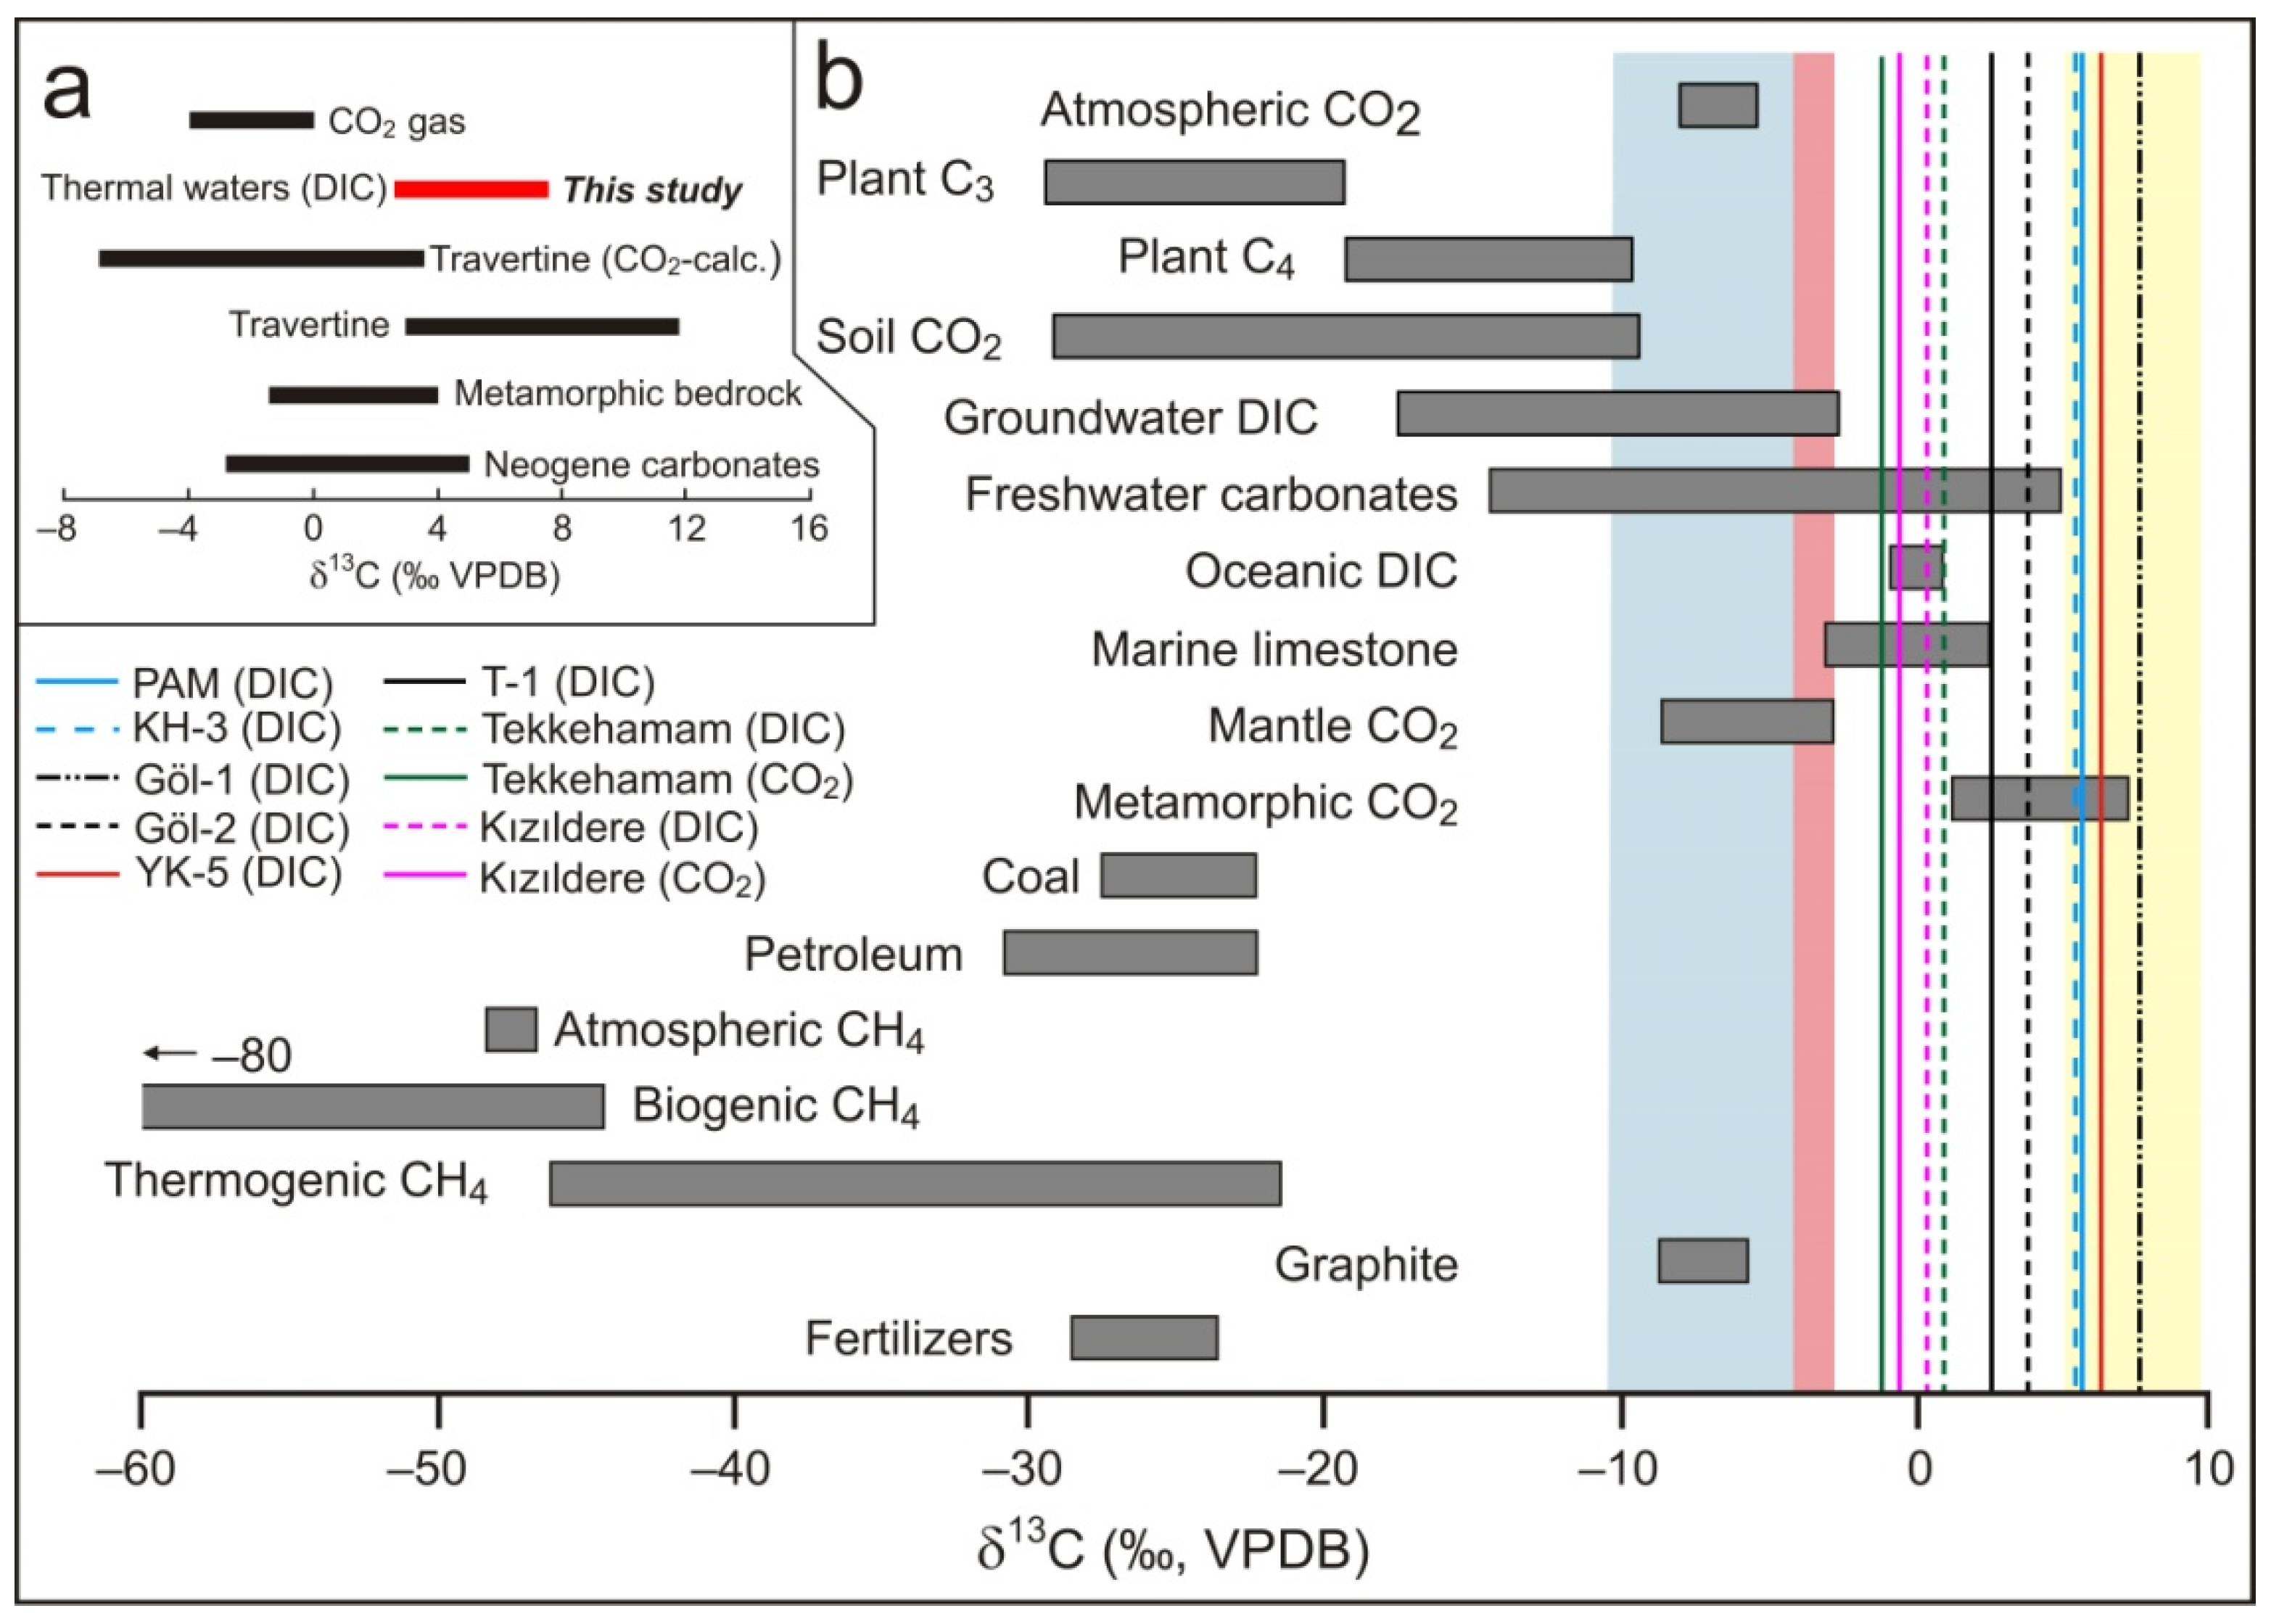
If it is solved from the following equation:
t = 8267 × ln α t · C 14 α 0 · C 14
In order to compute 14C ages from the above equation, initial 14C activity ( α 0 ) is required to be known. Assuming that initial 14C activity is 100 pmC [100], uncorrected 14C ages of samples are found 35,954 for KH-3; 40,613 for Göl-1; 39,909 for Göl-2; 37,408 for YK-5; 22,538 and for T-1 and 33,107 YBP for T-3 (Table 3).
Because 14C fractionates during organic and inorganic phase transformations, 14C activities measured should be normalized to a common δ13C value of −25‰ [100].
Correction factor = (δ13CSample − (−25))‰
Using the correction factor estimated for each sample, the corrected 14C activities for samples KH-3, Göl-1, Göl-2, YK-5, T-1 and T-3 are found 1.104, 0.617, 0.676, 0.93, 5.879 and 1.578 pmC, which compute the corrected radiocarbon ages of 36,202; 40,878; 40,143; 37,662; 22,764 and 33,328 YBP, respectively. In previous studies, the age of waters in the Kızıldere field is reported 31,034 for well R-1 and 22,500–27,500 YBP for the waters of other wells [99]. Waters in the Tekkehamam field are found in the range of 34,898 [99] to >43,500 YBP [24] which agrees with our radiocarbon ages measured in Kızıldere and Tekkehamam geothermal fields.
Güner and Yıldırım [99] measured tritium values up to 1.20 TU in the Karahayıt field (PAM Hotel well, 56 °C). In spite of the absence of systematic data, there is no doubt that KGF thermal waters contain tritium. It is interesting that KH-3 thermal water in this field with pmC of 1.104 (radiocarbon age of 36,202 YBP) contains tritium (2.13 TU) (Table 3). A similar case is also reported for CO2-rich Melgaço mineral water in the north of Portugal (3H: 2.2 TU, pmC: 2.33 ± 0.07; [103]). Although the tritium content of the PAM thermal spring (2.16 TU) is consistent with modern waters, using the NETPATH XL 1.5 software Güner and Yıldırım [104] estimated the 14C age of Pamukkale springs to be 12,388 years. 14C dating study conducted on cold groundwaters in the Denizli basin yielded 5945, 4091 and 9631 YBP for three samples with zero tritium content [101]. As a conclusion, the 14C ages of PGF and KGF thermal waters are not correlated with their tritium contents. As mentioned in Section 5.2.3, CO2 (free of 14C) originating from deep sources (upper mantle) or expelling from the metamorphism of carbonate rocks might dilute the studied waters masking the original pmC values. For this reason, 14C ages of waters should be evaluated with caution.
Except for two samples (T-1 and T-3) from the Tosunlar field, HCO3 and 14C contents of the remaining Denizli waters are negatively correlated (Figure 11). The diagram indicates that waters with relatively older ages have experienced prolonged water–rock interaction (e.g., Yıldırım et al. [105], Wei et al. [106]). Indeed, samples Göl-1 and Göl-2 with the lowest 14C values (0.617 and 0.676 pmC, respectively) have the highest EC HCO3 values among the studied waters (Table 2 and Table 3). Not only HCO3 but also sulfate concentrations of these samples (particularly for Göl-2) are markedly high, indicating that these waters have interacted with carbonate rocks and evaporite units as well.

5.2.3. δ13C

δ13C values measured on dissolved inorganic carbon (DIC) for thermal waters yielded 2.55 (T-3) to 7.65‰ VPDB (Göl-1) (Table 3). Carbon isotope compositions of thermal waters in the Denizli basin were reported in several studies. For example, according to Alçiçek et al. [20,21,22,23], δ13C values of PGF, KGF, GGF and YGF thermal waters are 7 to 10‰ VPDB (Figure 12a). Carbon isotope compositions in Tekkehamam and Kızıldere waters are much lower, ranging from −1.5 to 6.5‰ [24,99] and 0.32 to 1.26‰ VPDB [99] for the respective fields.
Carbon isotope composition of CO213CCO2) is reported in the range of −2.5 to −4‰ in Pamukkale, Karahayıt and Yenice thermal fluids [91,107], −1.49 to 0.17‰ in Kızıldere [26,91,108], and −0.95 to 1.30‰ in Tekkehamam [107,109], which are about 4‰ lower (12C-rich) than DIC in studied thermal waters.
In previous studies, δ13C values of Pamukkale, Çukurbağ, Karahayıt, Gölemezli, Akköy and Yenicekent travertines are reported between +2.9 and +11.7‰ [38,39,40,110]. According to Kele et al. [25], such positive values are due to CO2 released by thermometamorphic processes related to magmatic activity. δ13CCO2 can be estimated from δ13C of studied travertines using the experimental calibration by Panichi and Tongiorgi [111] [δ13CCO2 = 1.2 × δ13CTrav. − 10.5]; results yielded δ13CCO2 values varying from −7 to +3.54%. In a recent study by Rizzo et al. [112], the carbon isotope composition of Çukurbağ fissure ridge travertines in PGF was reported as 5.02‰ < δ13C < 7.22‰, which corresponds to δ13CCO2 values of −4.5 to −1.8‰. It is concluded that δ13C values of studied thermal waters and travertines and δ13CCO2 values estimated by the equation of Panichi and Tongiorgi [111] are consistent with δ13CCO2 of Pamukkale, Karahayıt and Yenice thermal waters.
δ13C values of marbles in the Denizli region and marbles of the Menderes massif are −1.44 to 3.52‰ (average 2.05‰; [113]) and 0.21 to 3.94‰ (average 2.92‰; [114]), respectively. Metamorphic rocks of the basement (+0.7 to +2.9‰, [25]; +0.20 to +2.98‰, [115]) and carbonate rocks of the Neogene sequence (−2.80 to 5.04‰; [36]) yielded similar values for δ13C; δ13C is −3 to +3‰ for marine limestones, −40 to −20‰ for organic sediments and −9 to −4‰ (mean −6.5‰) for the mantle [100,116,117]. Our assessment implies that the CO2 composition of thermal waters might be explained by several mechanisms which include the decomposition of carbonates within the metamorphic reservoir at a temperature of at least 350 °C [91], dissolution of Neogene carbonate rocks, CO2 escape during ascend of thermal waters and release of mantle CO2 (Figure 12a). The fact that δ13C values of travertines are higher than δ13CDIC of thermal waters is attributed to the enrichment of heavy carbon isotope (13C) in the residual water by surface evaporation of thermal fluid and the escape of CO2 gas to the atmosphere. The distribution of δ13C of DIC and CO2 in studied thermal and cold waters is shown in Figure 12b. The diagram indicates that δ13C (DIC) of PGF, KGF, GGF, YGF and TGF thermal waters are consistent with marine limestone and metamorphic CO2. δ13CCO2 values, however, show mantle origin for PGF, KGF and YGF and marine limestone for the samples TeGF and KıGF. δ13C of cold waters in the basin is much lower, ranging from −10.5 to −4‰, probably contributed by an organic source [23].

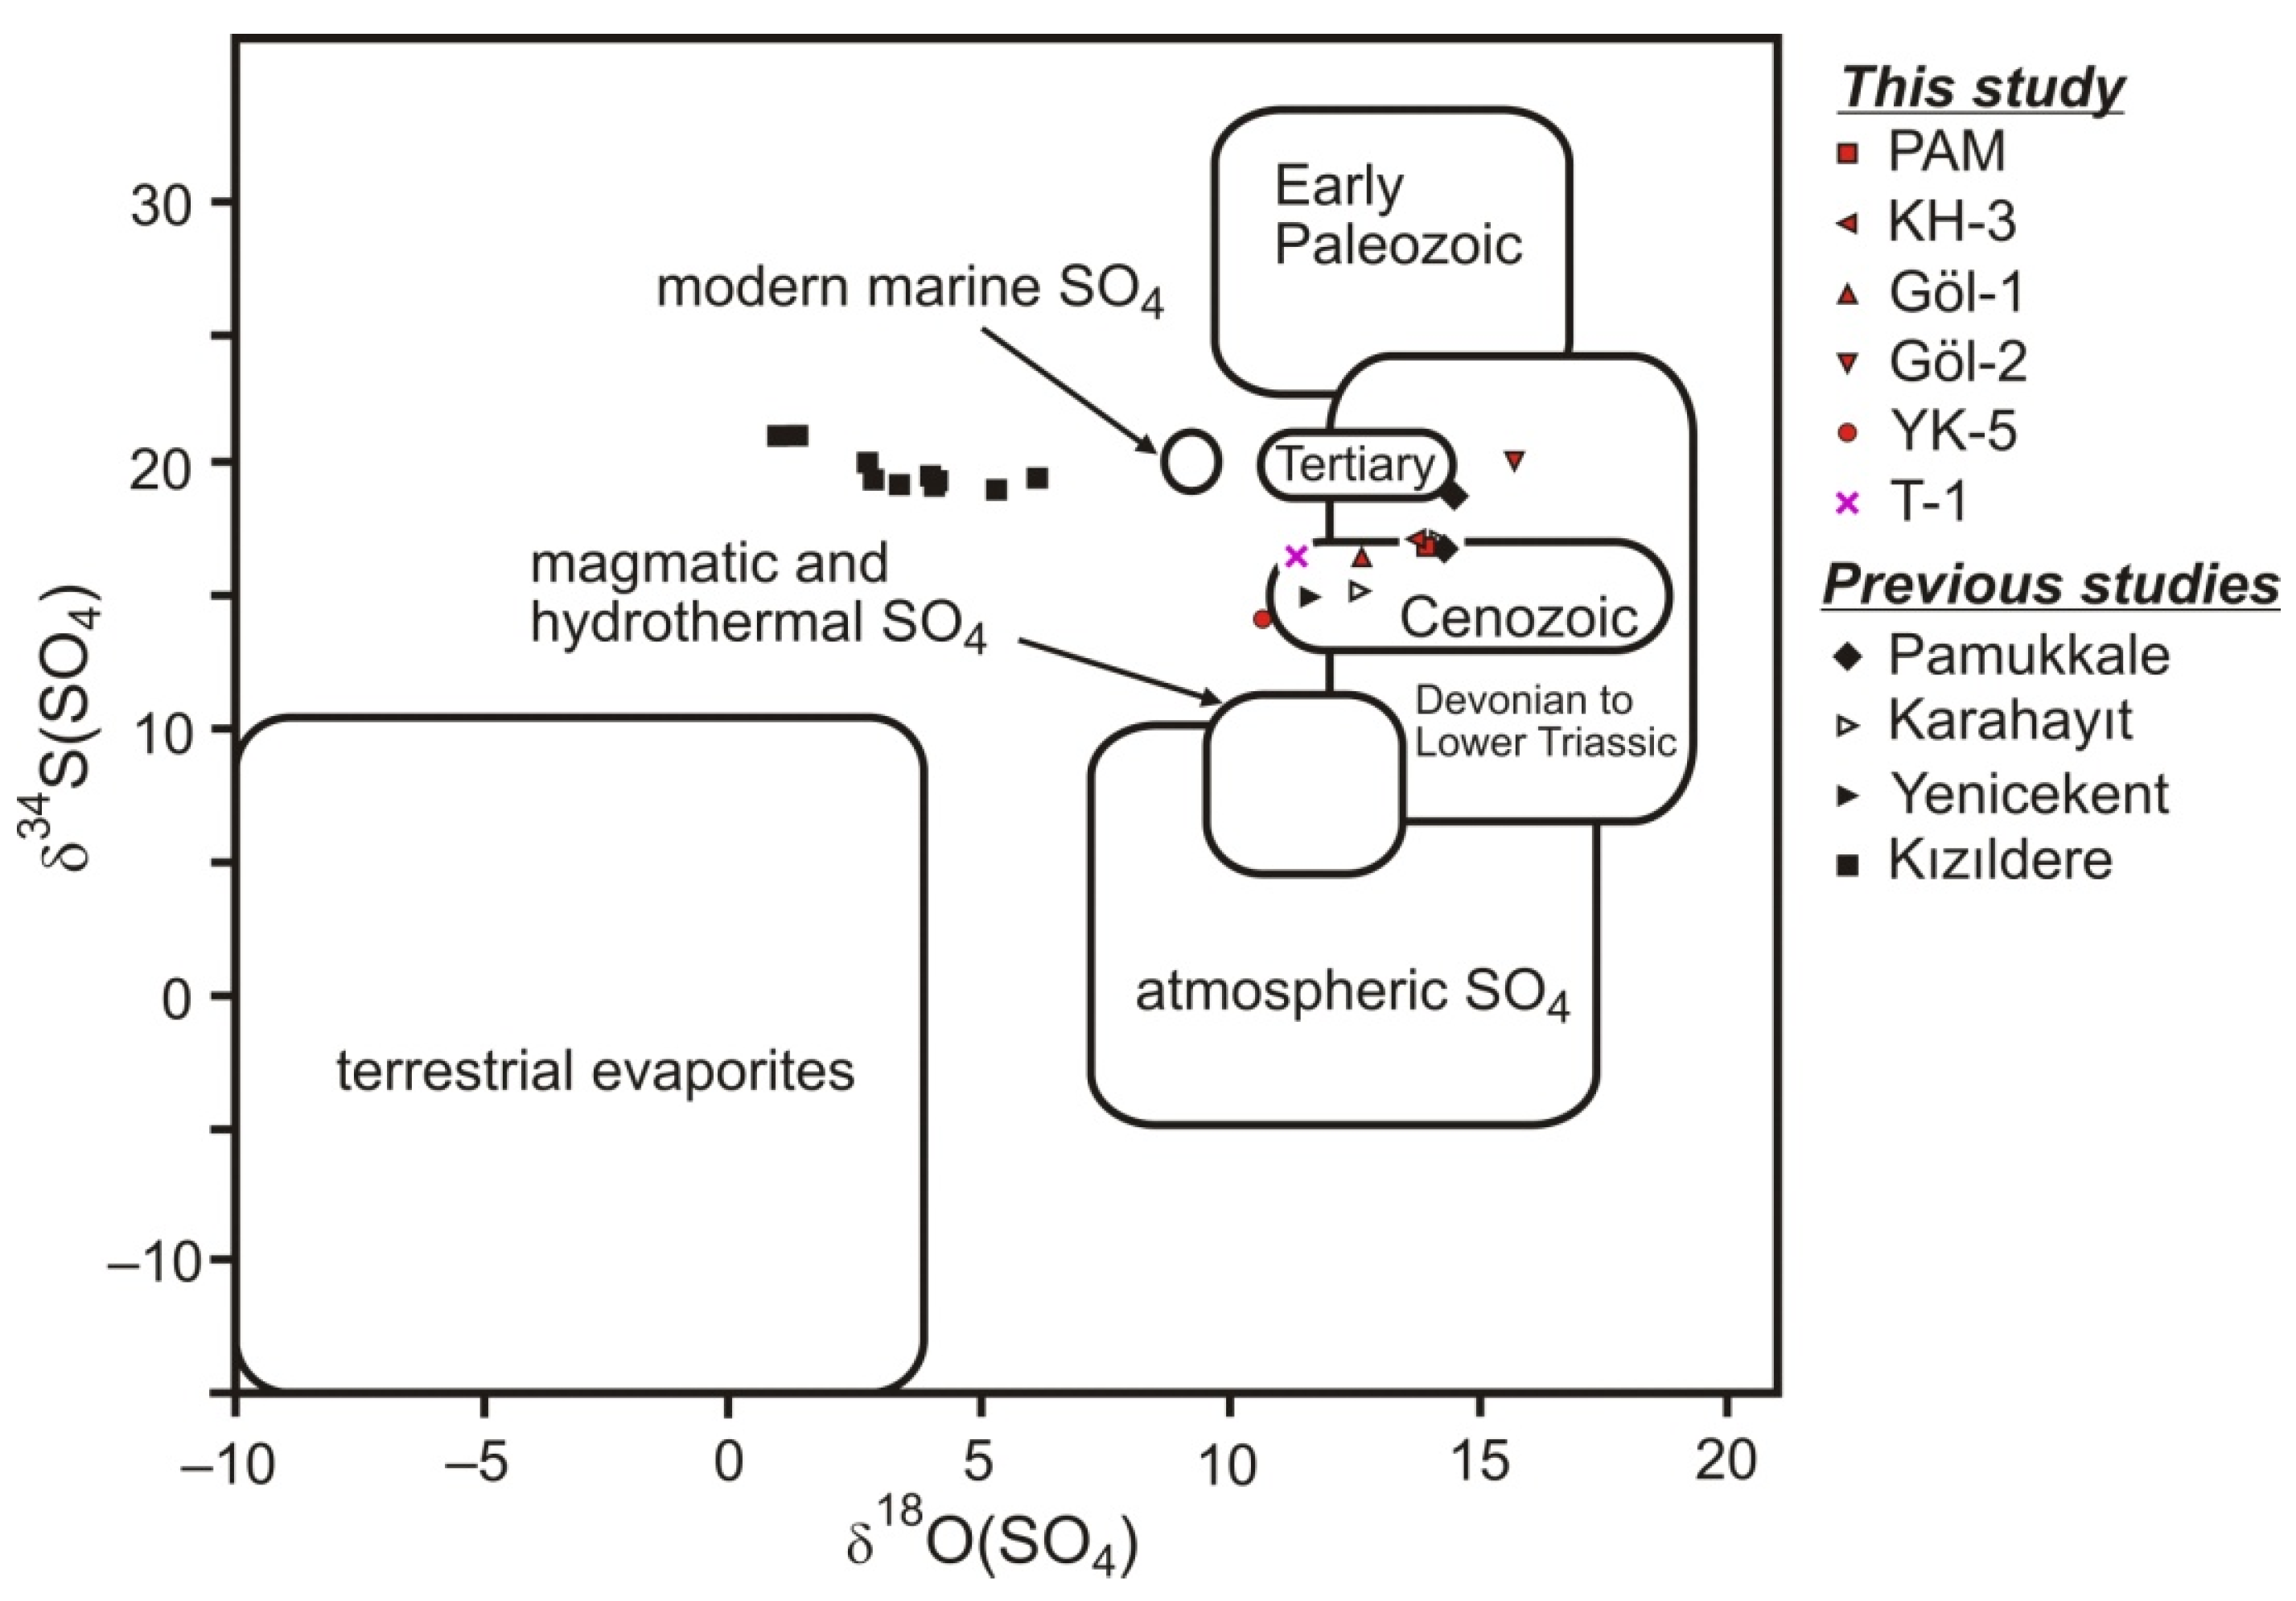
5.2.4. Sulfur and Oxygen Isotopes on Sulfate

δ34S values of sulfate in the studied thermal waters are in the range of 14.1 to 20.04‰ VCDT and δ18O‰ are from 10.65 to 15.71‰ VSMOW (Table 3). Yıldırım and Güner [71] reported δ34S and δ18O in TeGF thermal waters as 16.72 to 18.69‰ VCDT and 13.5 to 11.1‰ VSMOW, respectively. Sulfur and oxygen isotope systematics of waters of the KıGF field are 18.96 to 20.00‰ VCDT and 0.90 to 6.12‰ VSMOW [26,71,94].
δ34S and δ18O of gypsum deposits from the Sazak formation exposing 4 km SW of Tosunlar field are reported 10.65–10.92‰ (average 10.82‰) and 10.9–15.5‰ (average 13.12‰) for lenticular gypsum and 3.09–14.3‰ (average 8.69‰) and 7.6–17.6‰ (average 13.53‰) for the vein type gypsums [36], respectively. Yeşilyurt evaporites 10 km SW of Sarayköy yielded the following δ34S–δ18O values: 21.84–26.45‰ (average 25.03‰) and 12.4–16.2‰ (average 14.75‰) for selenites, 9.93–13.73‰ (average 12.24‰) and 10.9–11.1‰ (average 10.96‰) for gypsumarenites and 24.7–26.28‰ (average 25.77‰) and 13.5–18.2‰ (average 15.7‰) for the vein type gypsums [36].
In the δ34S(SO4) versus δ18O(SO4) diagram, studied waters and data from previous works were plotted. In this graphic, δ34S (SO4) values vary in a narrow range from 14 to 20‰ and δ18O (SO4) values fall in a wide range from 1 to 16‰. Kızıldere samples with δ18O about 10‰ lower than other waters plot between the marine and terrestrial evaporite fields. During the dissolution of gypsum by meteoric waters, sulfate is likely to equilibrate with H2O, which can explain the relatively low δ18O values of the Kızıldere thermal waters. On the contrary, waters sampled from the Pamukkale, Karahayıt, Gölemezli, Yenicekent and Tosunlar fields fall in the area of Cenozoic evaporites (Figure 13).

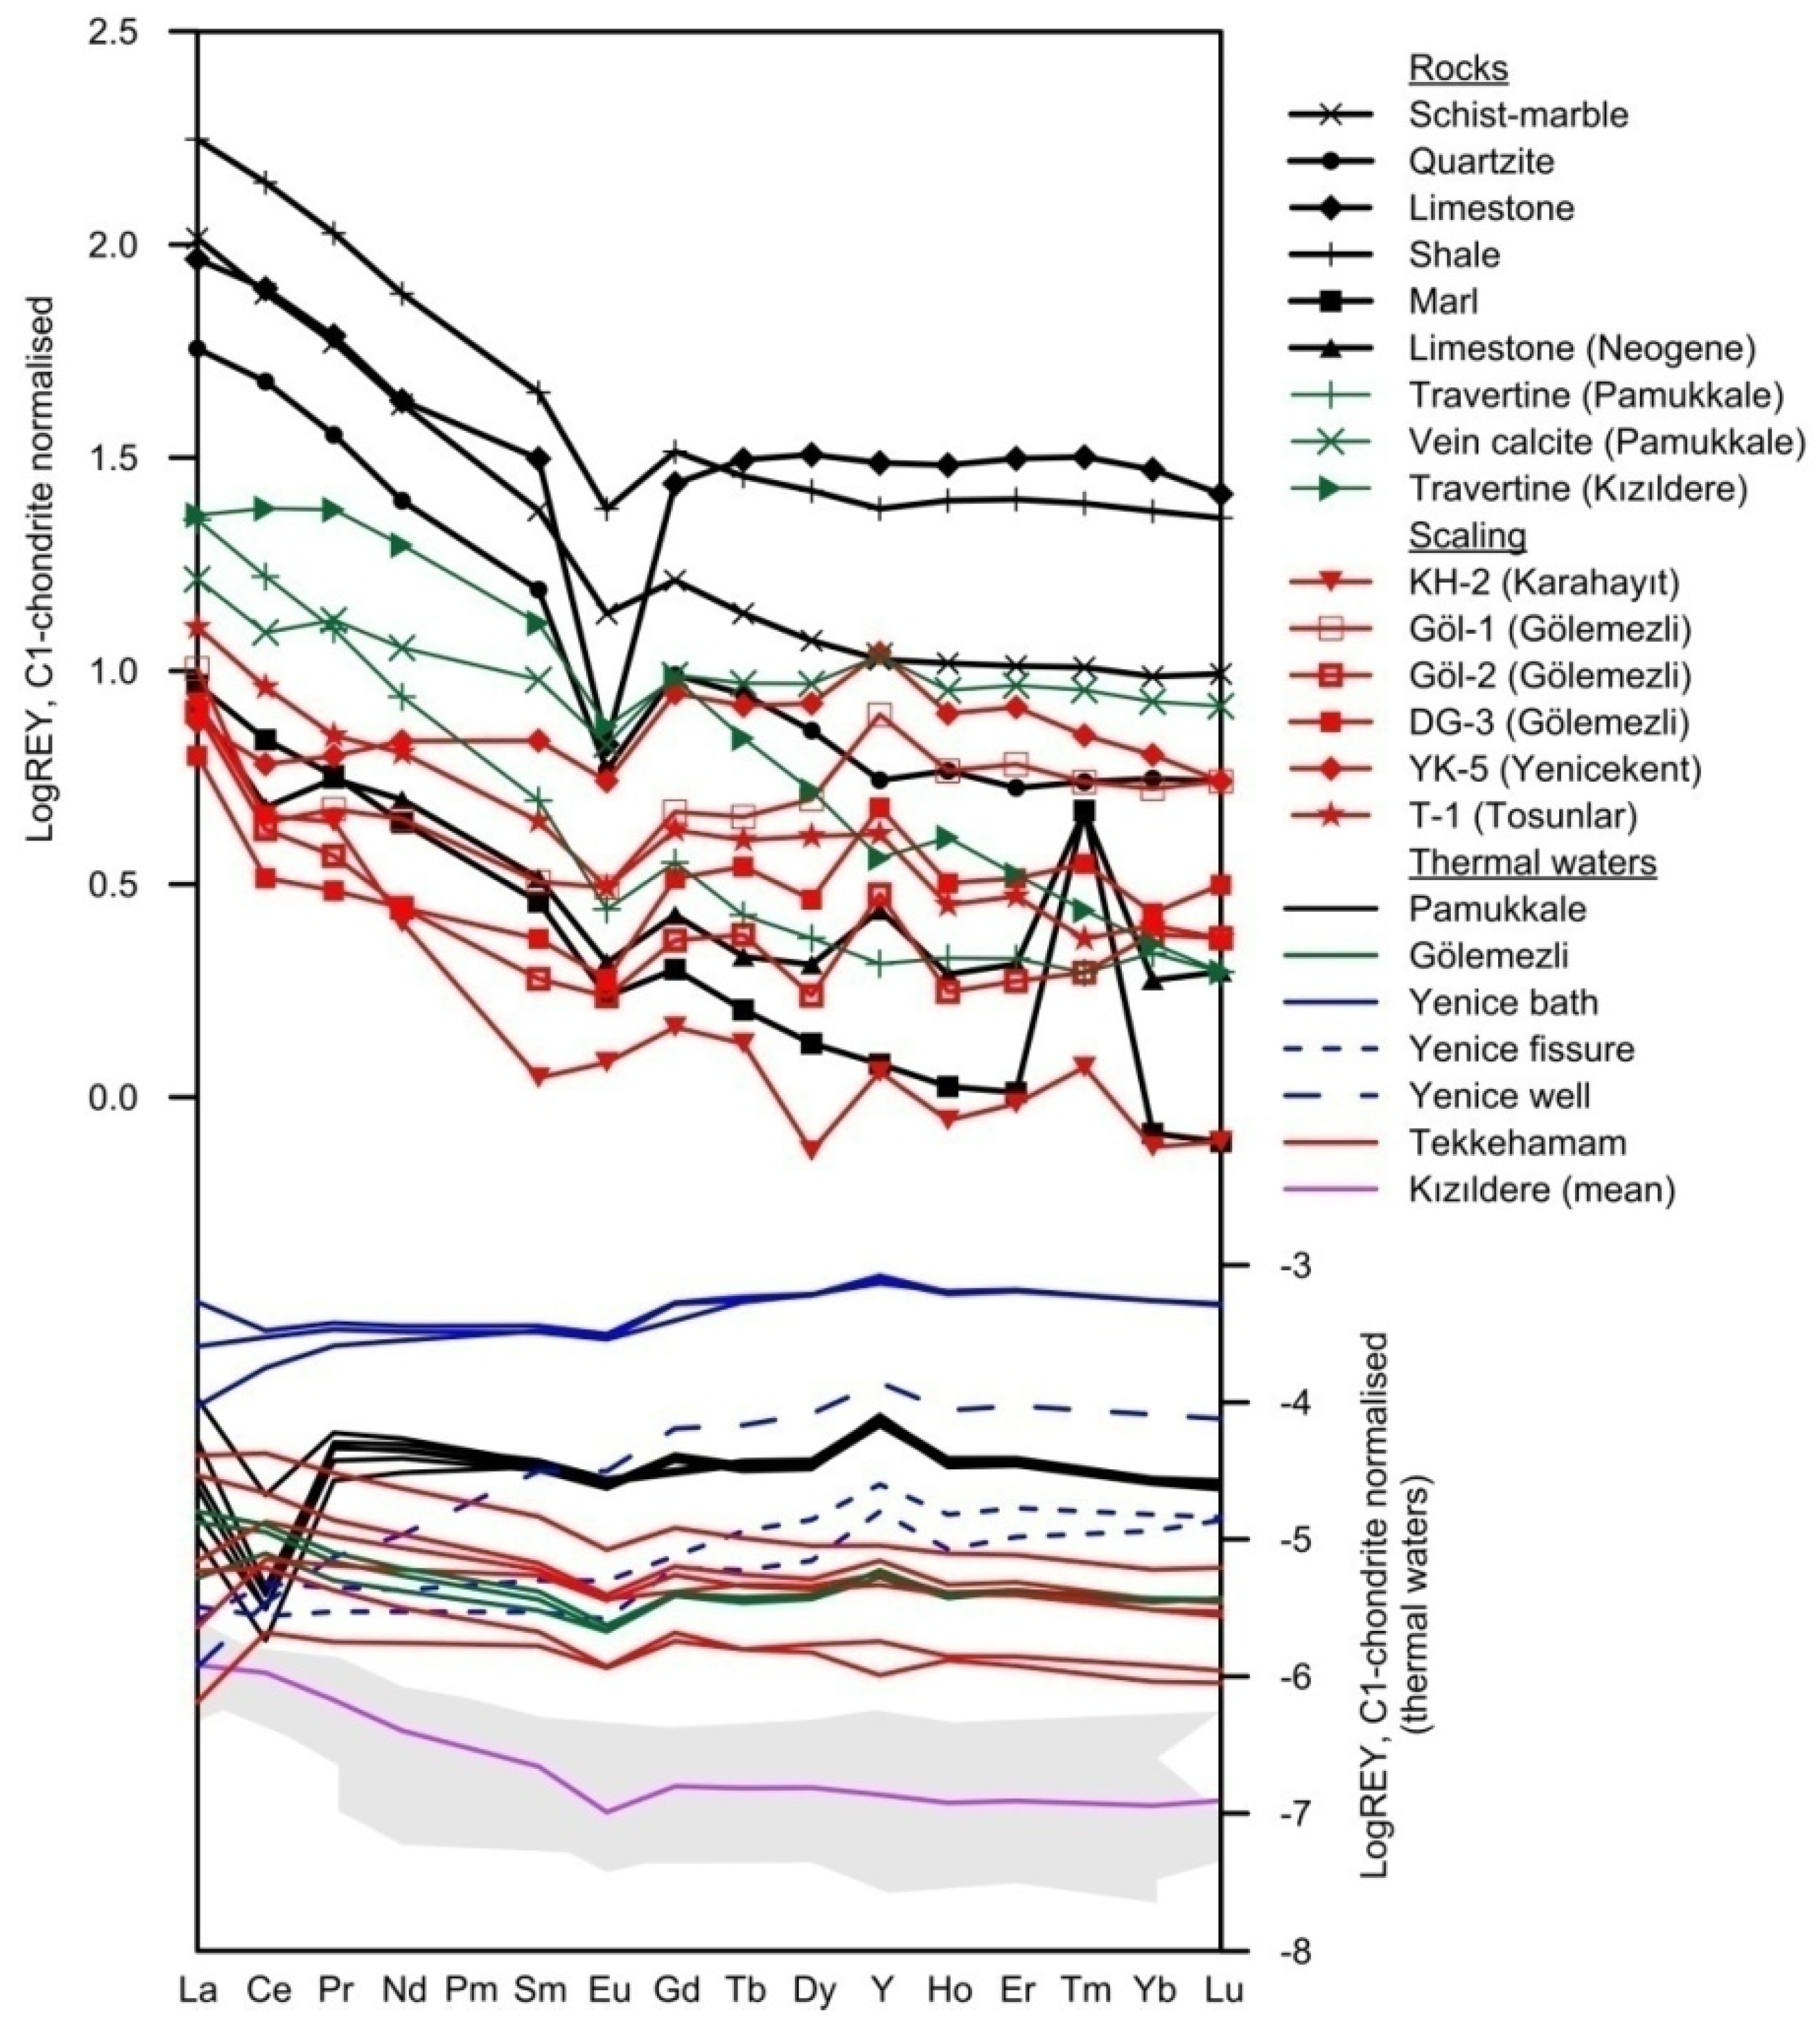
5.3. Rare Earth Element Fractionation
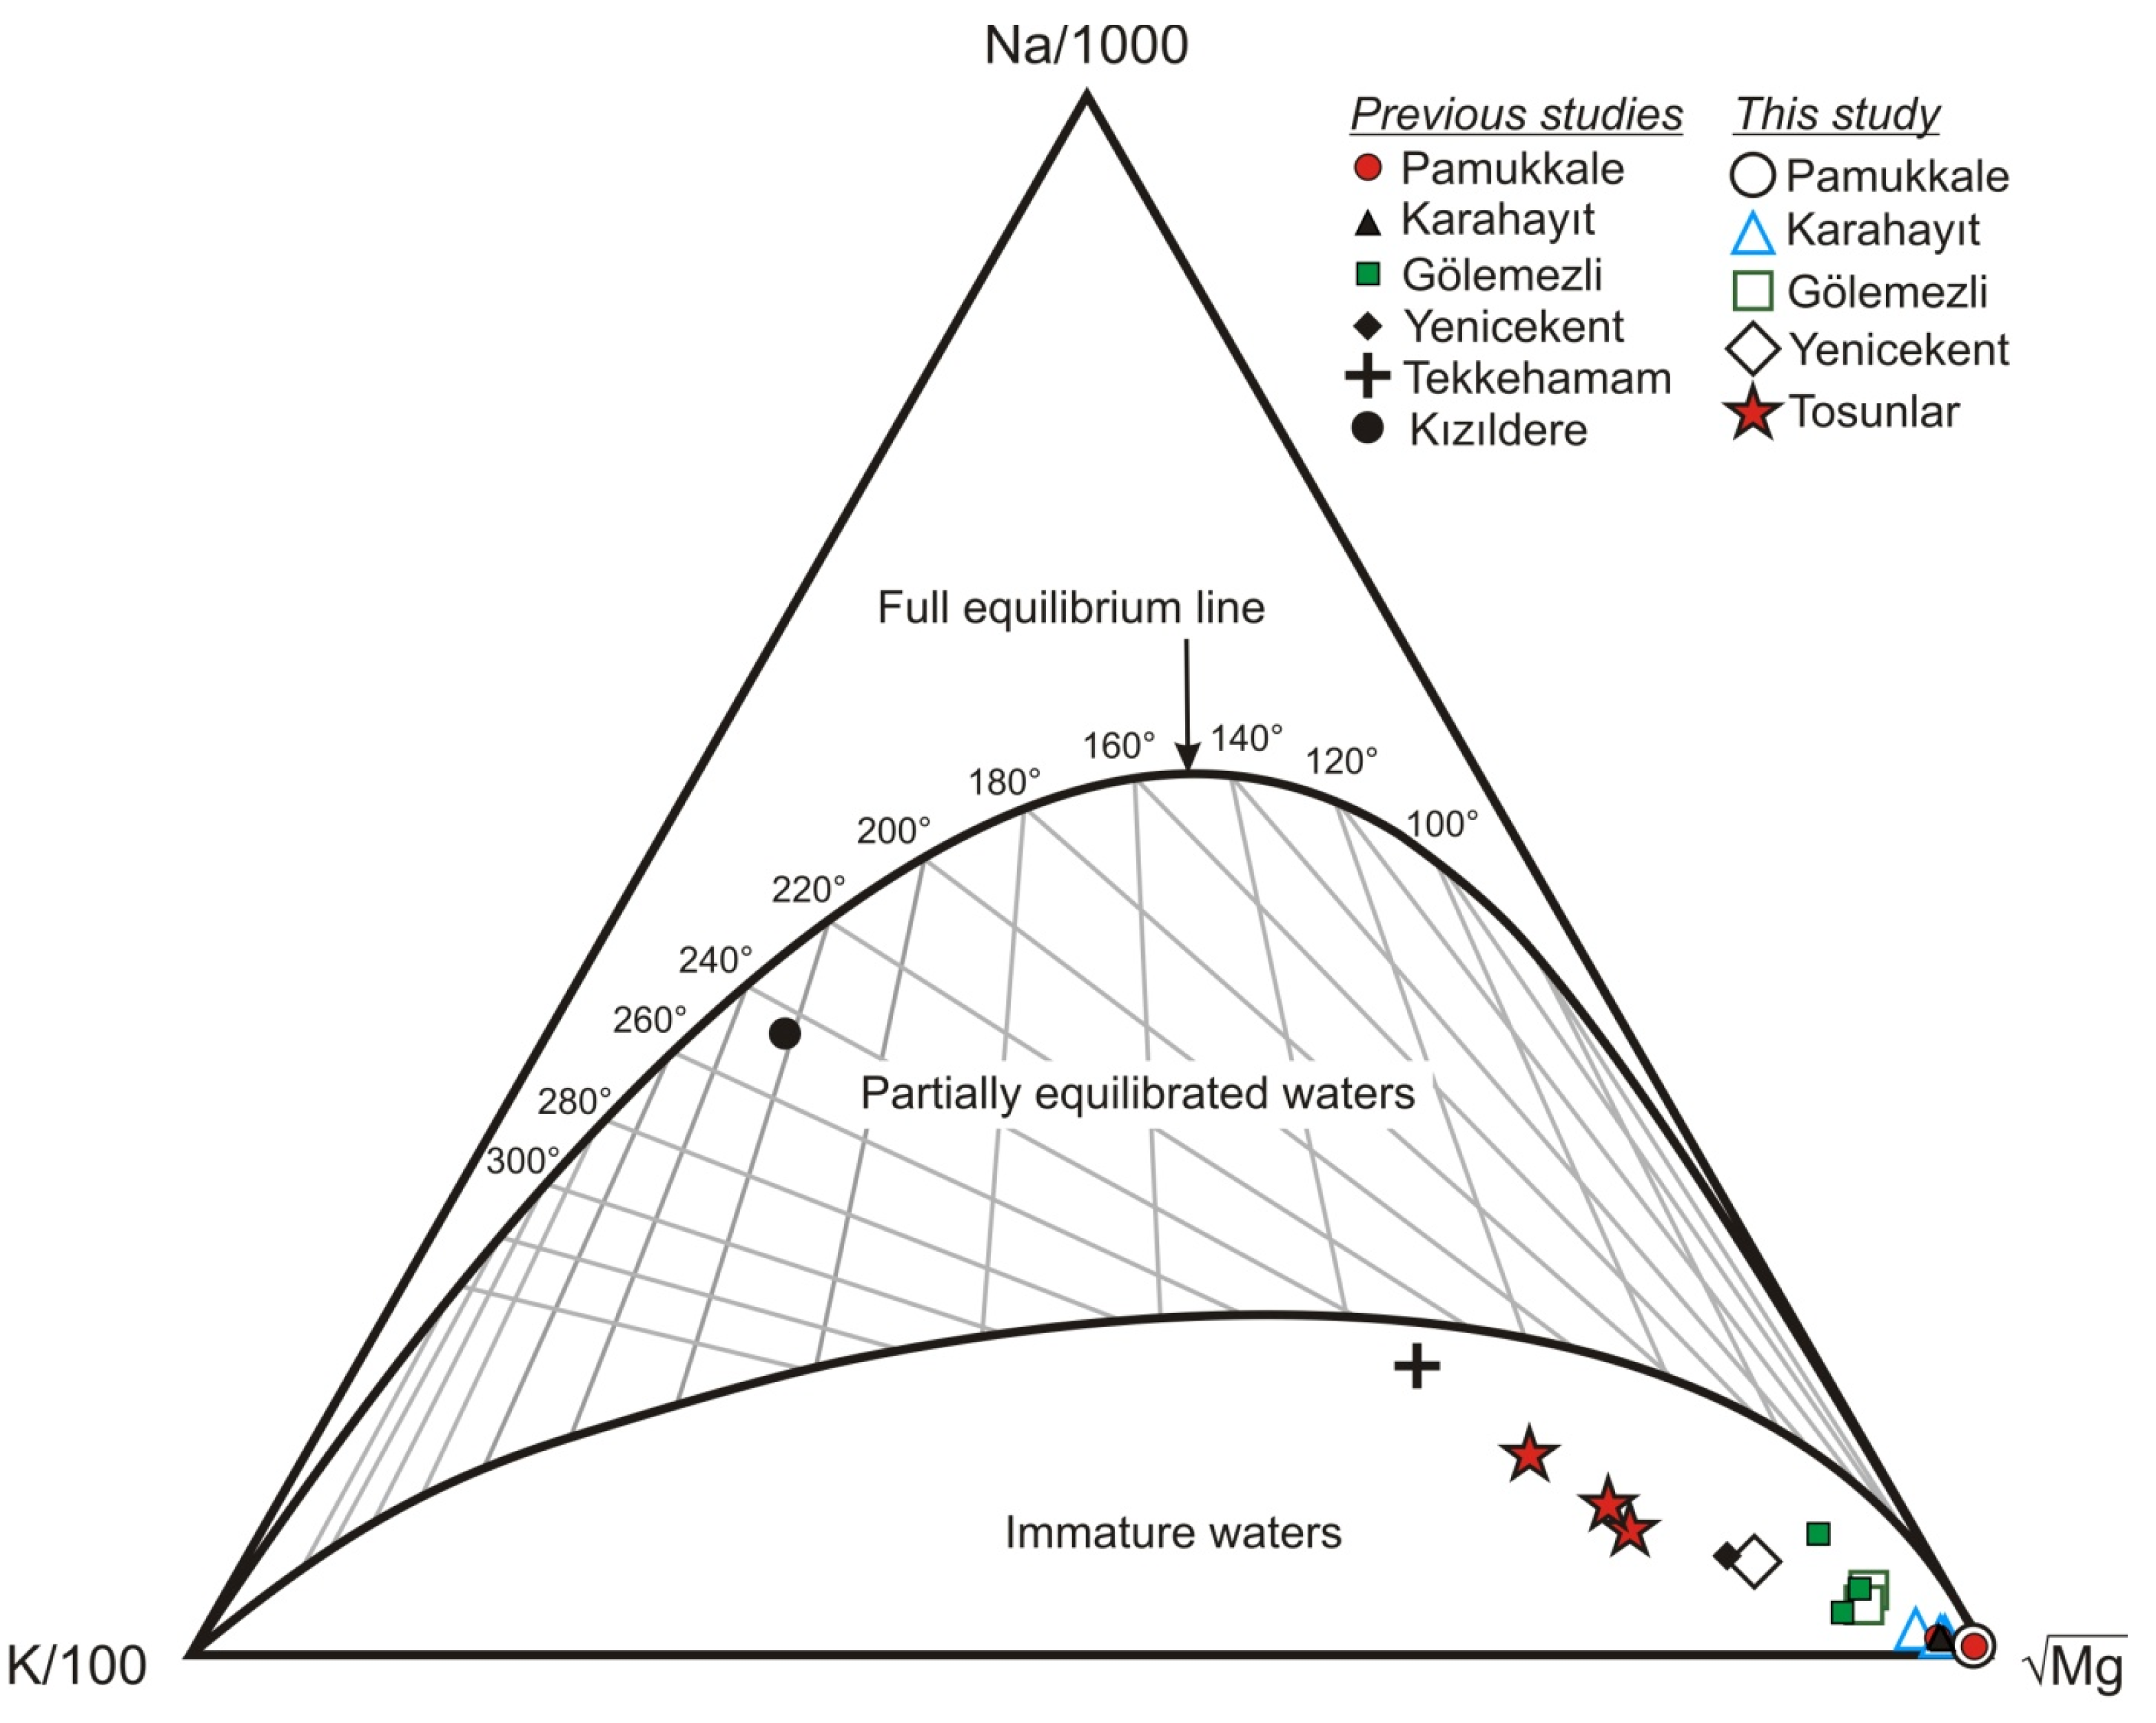
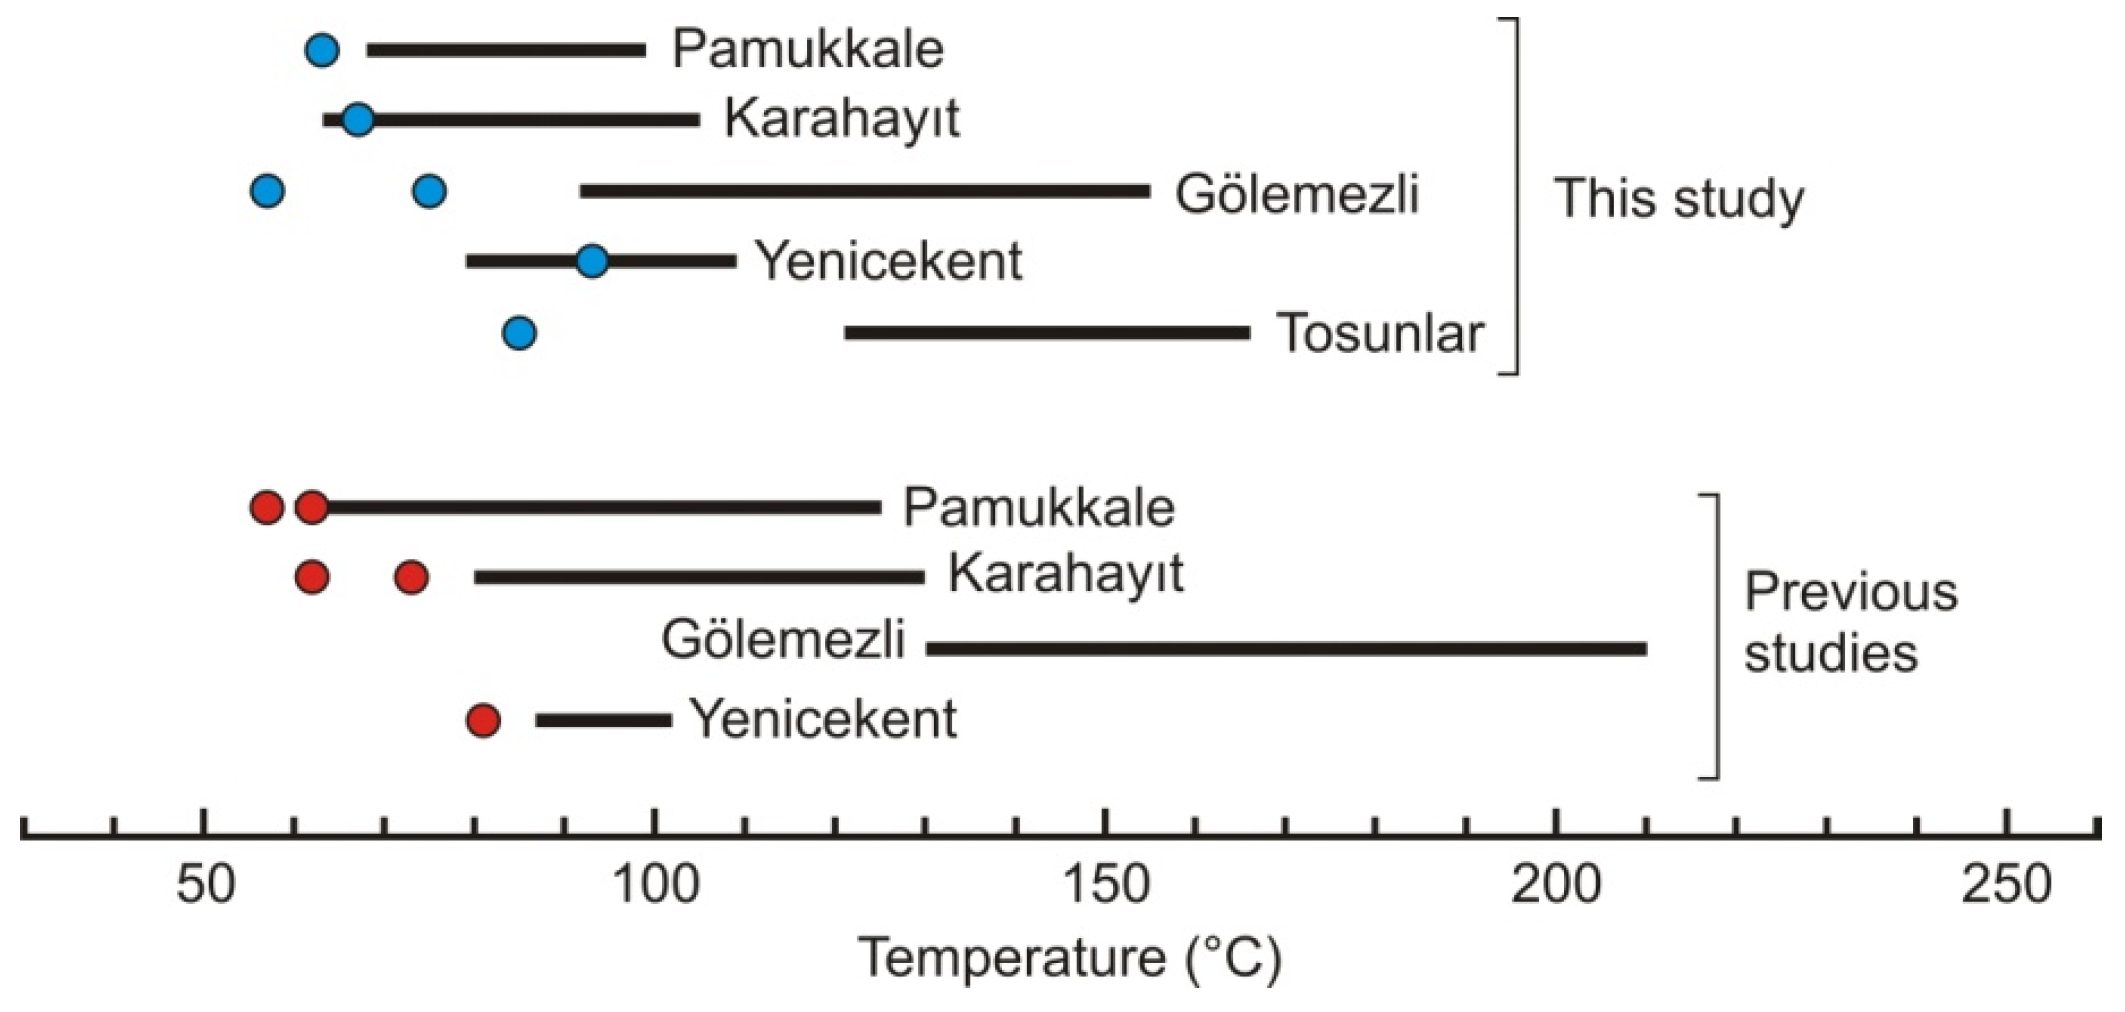
In this section, we compared REE + Y compositions of scale samples collected from the study areas with REY contents of thermal waters and various rocks exposed in the Denizli basin [118] (Table 4, Figure 14). In the comparison, REY concentrations of samples are normalized with chondrite values of McDonough and Sun [119].
The rare earth elements (REEs), which represent the so-called lanthanides, show similar geochemical behavior through the geological processes and, with the exception of cerium (Ce) and europium (Eu), usually occur in the trivalent form [120]. Cerium can exist as Ce3+ like the majority of lanthanides, or as Ce4+ in oxidizing conditions. Eu3+ (with an ionic radius of 1.07 Å) occurs together with other REE3+, either on crystallographic sites dominated by REE or replaces for cations such as Ca2+ (with an ionic radius of 1.12 Å). On the other hand, Eu2+ has a larger ionic radius (1.25 Å, similar to Sr2+, 1.26 Å) and, therefore, Eu2+ and Eu3+ have different affinities for a specific crystallographic site [120]. Considering the order of atomic number, REEs are divided into three subgroups: LREE (light REE), HREE (heavy REE) and MREE (middle REE).
REY compositions of rock samples are nearly 1 to 2 orders of magnitude higher than the chondrite values (Figure 14). Neogene marl and Neogene limestone trends with a distinct positive thulium anomaly are lower than other lithologies. REY concentrations of quartzite, Mesozoic limestone, shale and schist-marble steeply descend from La to Sm and then continue with a sharp negative Eu anomaly and show a flat-like trend across the HREEs. REE + Y contents of travertine samples from the Pamukkale and Kızıldere fields are 1-fold lower than rock samples although their REY patterns are almost similar (Figure 14).
Thermal waters with REY contents 5 to 9 orders of magnitude lower than the rock samples show varying source rock lithologies. Positive Y anomaly (not pronounced for the Kızıldere samples) and negative Eu and Ce (only for Pamukkale samples) anomalies are the common features of the Denizli thermal waters (Figure 14). For example, Kızıldere and Gölemezli waters with negative Eu pattern are in agreement with shale and limestone. Such REY patterns depend on local infiltration of meteoric water and are greatly controlled by the degree of water–rock interaction [118].
Scales sampled in this study from the Kızıldere, Gölemezli, Yenice and Tosunlar fields are represented by negative Eu and positive Y anomalies and their REY compositions are quite consistent with the Neogene limestone. Scale YK-5 (ΣREY: 18.1 ppm) from the Yenicekent field and scale KH-2 (ΣREY: 7.6 ppm) from the Karahayıt field have the highest and lowest REE contents, respectively. REY concentrations of scales sharply descend from La to Sm and then flow a horizontal pattern with a saw-like shape including a negative Eu anomaly and positive Y anomaly. Eu anomaly is probably inherited from plagioclase removal from the source rock whilst yttrium anomaly possibly implies the replacement of calcium by this element (e.g., Rankama and Sahama [121]).
Although REEs are more compatible in calcite (partition coefficient of log DREE = 4.4 [122]) than in silicate minerals (log DREE = 0.9–1.6 [123]), REE concentrations of scale samples are noticeably low (Figure 14). Available REE data may imply a rapid rise of CO2-rich waters without sufficient interaction with the host rocks [105]. The retardation of water–rock interaction by CO2-dominated fluids or retention of REE by the clays [124,125] may well explain the low rare earth element concentrations of thermal waters.

5.4. Geothermometry

Silica, cation and isotope geothermometers applied to the studied waters and estimated reservoir temperatures are shown in Table 5. The lowest reservoir temperatures are calculated by the chalcedony geothermometer. For samples PGF, KGF, GGF and YGF, which have a maximum discharge temperature of 69 °C, the chalcedony geothermometer yielded reservoir temperatures varying from 48 to 130 °C. TGF waters with relatively higher discharge temperatures have chalcedony temperatures falling in the range between 118 and 143 °C. The quartz geothermometers with temperatures about 30 °C higher than the chalcedony geothermometer gave reservoir temperatures of 139 to 166 °C for the Tosunlar field and 79 to 155 °C for the other fields.
The use of ratios, rather than absolute abundance of cations, makes the Na-K geothermometer less sensitive to the secondary processes (e.g., mixing and boiling) in the reservoir. Therefore, Na-K geothermometer might produce inaccurate results when applied to low-temperature waters because at low temperatures Na/K ratio of waters is controlled by leaching rather than chemical equilibrium [10]. In fact, most of the anomalously high reservoir temperatures in Table 5 (201–292 °C) were obtained by the Na-K geothermometers for the waters with low discharge temperatures. Temperatures estimated by the Mg-Li geothermometer are generally lower than the measured values. For the Tosunlar thermal well waters, Na–Li geothermometer yielded temperatures of 136–173 °C that are close to bottom-hole temperatures (107–149 °C) and the same geothermometer gave higher reservoir temperatures (145–213 °C) for the other fields. Temperatures estimated by the K-Mg geothermometer are lower than the measured in PAM and KH-3 thermal waters but slightly higher for other water samples. Na-K-Ca temperatures are lower than the measured in PGF and GGF waters and are close to bottom-hole temperatures of samples from the Tosunlar field.
The Na-K-Mg diagram proposed by Giggenbach [134] is very useful for estimating the reservoir temperatures of thermal waters and evaluating the equilibrium state of waters with respect to certain silicate minerals they interact. This diagram also allows a quick assessment of reservoir temperatures and tests the applicability of cation geothermometers (Figure 15). In this diagram, R-1 well water from the Kızıldere field plots very close to the full equilibrium line and the bottom-hole temperature (242 °C) is almost the same as Na-K temperature. The remaining waters from other fields fall in the immature waters field extending along a line from very immature PGF waters to the partially equilibrated Tekkehamam waters. According to Giggenbach [134], for waters plotting in the immature waters field cation geothermometers should be assessed cautiously. With the exception of Kızıldere R-1 well water, studied waters do not attain equilibrium and reflect mixing with cold groundwater, therefore results of cation geothermometers are regarded as uncertain. For such (immature) waters, temperatures calculated by the quartz geothermometers are much more realistic. The average quartz temperature estimated with SiO2 contents of Tekkehamam thermal waters (İnaltı and W-3, Table 2) is 170 °C, which is consistent with the bottom-hole temperature of Tekkehamam TH-2 well (168 °C; Table 1). The average of quartz and Na-K temperatures estimated for Kızıldere R-1 well water (243 °C) is consistent with temperatures of geothermal fluids in this field. It is concluded that temperatures estimated for PGF, KGF and YGF (79–109 °C), GGF (118–155 °C) and Tosunlar field (144–166 °C) may be accepted as reservoir temperatures.
Reservoir temperatures of studied geothermal fields were evaluated with saturation states of waters with respect to several minerals that were estimated by the PhreeqC program at temperatures of 25 to 200 °C [87]. When a mineral group is close to the equilibrium line (SI = 0) at a certain temperature, it is assumed that the water is in equilibrium with these minerals and the temperature reflects the reservoir temperature [135]. From the mineral equilibrium diagrams given in Figure 16, the reservoir temperatures determined for PAM, KH-4 and Göl-1 are 96, 97 and 119 °C, respectively, from 99 to 108 °C for sample YK-5 and from 121 to 140 °C for sample T-1.
We used a 18O(SO4-H2O) isotope geothermometer as another alternative to estimate the reservoir temperatures of thermal waters. Calculations were first made for KıGF, which is home to deep geothermal wells. 18O(SO4) and 18O(H2O) values of thermal waters in KıGF are 2.7, 1.3, 0.9‰ and −5.52, −5.12, −5.91‰, respectively [26]. For the waters of the same field, Yıldırım and Güner [71] reported 18O(SO4) values between 2.83 and 5.29‰ and 18O(H2O) values from −6.6 to −5.1‰. Using these values and the equation proposed by Lloyd [133] reservoir temperatures for KıGF were estimated in the range of 175 to 244 °C which are quite consistent with both quartz and Na-K temperatures and discharge temperatures of thermal waters. However, for the low-temperature waters, 18O(SO4-H2O) temperatures computed from the available data (this study and Yıldırım and Güner [71]) are not realistic (Table 5, Figure 17) which might be attributed to the fact that equilibrium is not established between sulfate and water because of bacterial sulfate reduction and/or slow exchange of 18O between sulfate and water [136,137,138].
Chemical and 18O isotope geothermometers applied to the studied waters yielded a wide range of reservoir temperatures. Discharge and borehole temperatures of waters from deep wells are generally consistent with Na-K and SiO2 reservoir temperatures for the Kızıldere field and SiO2 reservoir temperature for the Tekkehamam and Tosunlar fields. The depth of wells in Karahayıt (452 to 650 m) and Gölemezli (except for DG-1 137 to 750 m, DG-1 well was shut down because of inefficiency) is relatively low. The shallowest wells with depth of 54–300 m are in the Yenicekent field where the reservoir is overlain by a thin Neogene cover. Deep wells were not drilled since the waters in the Karahayıt and Yenicekent fields were intended to be used for thermal spas and greenhouse heating, respectively. Because the Pamukkale thermal spring site is a conservation area, geothermal drilling is not allowed. It is highly probable that deep wells opened in the PGF, KGF, YGF and GGF fields might yield water temperatures much higher than the current discharge temperatures.

5.5. Fluid Characterization

In previous studies, fossil fluid temperature in the Pamukkale geothermal field was studied in detail using different techniques [112]. Homogenization temperatures of the inclusions trapped in the Pamukkale travertines were measured in the range of 132 to 145 °C (with an average of 140 °C). Salinities of inclusions are found between 0.4 and 7.0 wt% NaCl equivalent indicating the existence of moderately saline solutions. The oxygen isotope composition of thermal waters (δ18O) that precipitated the Pamukkale travertines was estimated using the oxygen isotope fractionation between water and calcite (Δ18Ocalcite-water). Results of calculations that were carried out at a discharge temperature of 56 °C yielded −8.3 to −3.2‰ (VSMOW) indicating a meteoric origin [112]. δ18O values of paleofluids in the Pamukkale geothermal field are consistent with modern waters that fall in the range of −9.28 to −5.59‰ VSMOW.
Helium isotope variation (3He/4He) can be used as a tracer to investigate the origin of crustal or mantle-derived volatiles in different tectonic and volcanic environments. Helium has two isotopes; 4He is produced by the decay of radioactive elements (e.g., U and Th), while 3He is mostly of primordial origin and therefore was trapped within the earth during the accretion [139]. Due to the significant difference in isotopic composition between the mantle and crustal helium, helium isotope studies in natural waters and minerals provide valuable information on the extent of mantle-derived contributions to crustal fluids and the rate of mantle degassing through the crust.
The 3He/4He ratios measured in fluid inclusions of Pamukkale travertines yielded 0.5–1.3 Ra [112] which are notably higher than values characteristic of crustal lithologies (average Ra = 0.05 [139]. Helium isotope composition is much higher up to 3.68 Ra in Pamukkale thermal fluids [140], 0.95 to 1.67 Ra in Kızıldere thermal water [108,141] and 2.36 to 2.86 Ra in Tekkehamam waters [141]. These findings indicate a significant He contribution from the mantle (8 Ra). Assuming a simple binary mixing between the mantle and crustal helium components, the proportion of mantle-derived helium in Pamukkale, Kızıldere and Tekkehamam thermal waters is found to range from 12 to 46%.
In a recent study by Süer et al. [109], isotopic compositions of various gases (CO2, CH4, and N2) from the Kızıldere and Tekkehamam geothermal fields were investigated. The stable isotopic composition of carbon (δ13C)CO2 varied in a narrow range from −0.95 to +1.3‰ indicating that most part of the carbon (CO2) derives from limestone sources. δ13C and δ2H of methane from these fields showed distinct values ranging from −34.4 to −20.8‰ and −143.3 to −126.7‰, respectively. CO2-CH4 isotope geothermometry estimations yielded temperatures significantly higher than the bottom–hole temperatures recorded in Kızıldere and Tekkehamam. Finally, the N2/36Ar ratios of the majority of samples indicate the presence of a non-atmospheric nitrogen component, which is likely to be a mixture of sedimentary and mantle nitrogen [109].
Chromatographic determination of gas compositions of samples collected from the Denizli region yielded that CO2 is the primary gas phase followed by N2 and O2. The volume of CO2 is 69–86% in Pamukkale, 66–90% in Karahayıt and 98% in Gölemezli fields [142]. High nitrogen abundance (up to 24%) in these fluids accompanied by O2 with a content of 3 to 8% is attributed to mixing with shallow waters.
Synthesis of our findings with the published water chemistry and gas isotope data reveals that Pamukkale, Tekkehamam and Kızıldere geothermal fluids interact with carbonate-type lithologies at a wide range of temperatures from about 35 to 242 °C. Regarding the volatiles in these fluids, some portion of helium and nitrogen is derived from the mantle whilst methane and carbon dioxide originate entirely from crustal sources.

5.6. Limitations of the Study

This study chiefly depends on data collected at a particular point in time potentially excluding seasonal or long-term variations in thermal water chemistry. For this reason, future studies should incorporate temporal data on the chemical and isotopic compositions of the examined water sources across different seasons to assess the temporal variability. The main limitation of the study is the small number of water samples (n = 10), which limits the use of further methodological approaches. The disadvantage of our limited data was partially overcome by the use of water and scale chemistry data available in the literature.
It is important to note that here anthropogenic factors could be of great importance to the sustainability and environmental impact of geothermal sources. For this, physicochemical parameters and ionic concentrations including trace elements could be monthly monitored to ensure observation of natural or anthropogenic variations in these parameters. Special attention should be given to practicing proper management to discharge waters from spas or greenhouses, as they are not considered trade waste.
Pamukkale thermal waters are used in agricultural irrigation after the bleaching process, and Karahayıt thermal waters are purified after use in thermal baths. All the wastewater in other fields and the power plant waters that cannot be reinjected are discharged into the receiving environment (usually the Büyük Menderes River). This might negatively affect the ecological balance in the receiving environment due to temperature differences and boron, arsenic and heavy metal input. On the other hand, during the reinjection of thermal waters in TeGF, in some locations water at boiling temperature is temporarily manifested at the surface, probably due to the use of unsuitable well equipment or the low depth of reinjection wells that only reach the Neogene units. This may affect the physicochemical properties of existing thermal springs. However, such an impact is not in question since the İnaltı thermal spring was sampled (analysis is given in Table 2) at the time there were no geothermal power plants in this area [71]. Reinjection wells that could contaminate the existing freshwater aquifers might be considered another problem. Due to financial reasons, the lack of periodic or seasonal monitoring of the chemical and isotopic composition of wastewater and receiving water bodies prevented a more comprehensive assessment.

6. Conclusions

Studied geothermal fields have more than one reservoir. For all the fields, limestones of the Neogene Sazak formation comprise the shallow (first) reservoir whilst schist, marble and quartzite of the Paleozoic Menderes massif represent the deep (second) reservoir. Apart from these, limestones and dolomitic limestones of the Mesozoic Çökelez formation in PGF form the medium reservoir between the shallow and deep reservoirs, while gneiss and quartzites comprise the deepest reservoir in the Kızıldere field. Cover rocks are represented by the impermeable units of the Neogene formations. The high geothermal gradient resulting from neotectonic activity is the heat source of geothermal systems. All thermal waters are of meteoric origin and tritium values of PGF and KGF waters reflect the mixture of sub-modern and modern precipitation, while the tritium contents of thermal waters in other fields reveal the pre−1952 recharge. Using the altitude versus δD relationship, recharge elevations for PGF, KGF, GGF, YGF and TGF thermal waters are estimated in the range of 1030 to 1175 m.
Different temperatures, the extent of the water–rock interaction process, dissolution-precipitation, mixing, cation exchange and microbial processes in geothermal fields have resulted in different hydrochemical types of thermal waters. Dissolution of carbonate rocks (e.g., limestones and marble) exerts a great control on the formation of Pamukkale and Karahayıt thermal waters with the composition of Ca-Mg-HCO3. The waters of Gölemezli, Yenicekent and Tosunlar geothermal fields are of Ca-Na-HCO3 type and probably interacted with claystone and marl units. On the other hand, high sulfate content in Tekkehamam geothermal fluids is attributed to derivation from organic matter-rich sediments or bacterial reduction of sulfate. Finally, the Na-HCO3 composition of the Kızıldere field implies interaction with silicate-type reservoir rocks. Temperature, circulation depth, residence time of water and the degree of silicate weathering increase from PGF to KıGF but the mixing ratio of cold groundwater decreases. The noticeable shift in the δ18O values of the thermal waters from TeGF and KıGF is explained by water–rock interaction at high temperatures.
δ13C data indicate that Mesozoic and Neogene limestones, high-temperature decomposition of carbonates within the metamorphic reservoir and mantle-derived CO2 are the major sources of carbon in the studied thermal waters and δ34S values showed that the sulfate is originated from the Neogene gypsum.
Scale samples collected from the Kızıldere, Gölemezli, Yenice and Tosunlar fields are represented by negative Eu and positive Y anomalies and their REY trends show that Neogene limestone is the major source rock.
Silica and mineral equilibrium geothermometers and Na-K-Mg diagram applied to geothermal fields other than TeGF and KıGF gave realistic reservoir temperatures in the range of 79 to 166 °C, with the highest belonging to the TGF field.
In order to determine the natural or anthropogenic effects on the physical and chemical composition of thermal waters in the study areas and to make an assessment of the protection of the receiving environment and fresh groundwater aquifers, temperature, electrical conductivity, pH, ion, element and isotope analyses should be carried out at selected sampling points at monthly intervals (at least 12 months). For Pamukkale, which is on the World Heritage List, this monitoring work should be indefinite.

Author Contributions

A.G.: Conceptualization, methodology, formal analysis, investigation, writing—original draft preparation, visualization. H.M.: Validation, formal analysis, investigation, writing—review and editing. E.S.: Investigation, visualization. All authors have read and agreed to the published version of the manuscript.

Funding

This study was financially supported by the Scientific Research Coordination Unit of Pamukkale University (grant number 2016FEBE048).

Data Availability Statement

The data presented in this study are available on request from the corresponding author.

Acknowledgments

The Denizli Metropolitan Municipality and Akça Energy Autoproducer Group are acknowledged for allowing us to sample thermal wells and spring waters. The authors are grateful for helpful comments and constructive reviews by Archisman Dutta and two anonymous reviewers, which improved our manuscript.

Conflicts of Interest

Author Erdem Subay was employed by the company Kocaer Enerji A.Ş. The remaining authors declare that the research was conducted in the absence of any commercial or financial relationships that could be construed as a potential conflict of interest.

References

  1. Barbier, E. Geothermal energy technology and current status: An overview. Renew. Sustain. Energy Rev. 2002, 6, 3–65. [Google Scholar] [CrossRef]
  2. Soltani, M.; Kashkooli, F.M.; Dehghani-Sanij, A.R.; Nokhosteen, A.; Ahmadi-Joughi, A.; Gharali, K.; Mahbaz, S.B.; Dusseault, M.B. A comprehensive review of geothermal energy evolution and development. Int. J. Green Energy 2019, 16, 971–1009. [Google Scholar] [CrossRef]
  3. Nicholson, K. Geothermal Fluids, Chemistry and Exploration Techniques, 1st ed.; Springer: Berlin/Heidelberg, Germany, 1993; ISBN 978-3-642-77846-9. [Google Scholar]
  4. Altunel, E. Morphological features, ages and neotectonic significance of Pamukkale travertines. Bull. Miner. Res. Explor. 1996, 118, 47–64. (In Turkish) [Google Scholar]
  5. Utku, M. Etkinlik ve yığınsal etkinlik dönemlerine göre Denizli depremlerinin analizi. Maden Tetk. Ve Aram. Derg. 2009, 138, 9–34. [Google Scholar]
  6. Kaypak, B.; Gökkaya, G. 3-D imaging of the upper crust beneath the Denizli geothermal region by local earthquake tomography, western Turkey. J. Volcanol. Geoth. Res. 2012, 211–212, 47–60. [Google Scholar] [CrossRef]
  7. Yılmaz, Y. Some thoughts on the morphotectonic development of the Denizli region. Bull. Miner. Res. Explor. 2022, 169, 1–15. [Google Scholar] [CrossRef]
  8. Şengör, A.M.C.; Yılmaz, Y. Tethyan evolution of Turkey—A plate tectonic approach. Tectonophysics 1981, 75, 181–241. [Google Scholar] [CrossRef]
  9. Bozkurt, E. Neotectonics of Turkey—A synthesis. Geodin. Acta 2001, 14, 3–30. [Google Scholar] [CrossRef]
  10. Mutlu, H.; Güleç, N. Hydrogeochemical outline of thermal waters and geothermometry applications in Anatolia (Turkey). J. Volcanol. Geotherm. Res. 1998, 85, 495–515. [Google Scholar] [CrossRef]
  11. Şimşek, Ş. Geothermal model of Denizli, Sarayköy-Buldan area. Geothermics 1985, 14, 393–417. [Google Scholar] [CrossRef]
  12. Aydın, H.; Karakuş, H.; Mutlu, H. Hydrogeochemistry of geothermal waters in eastern Turkey: Geochemical and isotopic constraints on water-rock interaction. J. Volcanol. Geotherm. Res. 2020, 390, 106708. [Google Scholar] [CrossRef]
  13. MTA Genel Müdürlüğü. Türkiye Jeotermal Enerji Potansiyeli ve Arama Çalışmaları. Available online: https://www.mta.gov.tr/v3.0/arastirmalar/jeotermal-enerji-arastirmalari (accessed on 8 March 2025).
  14. Enerji Piyasası Düzenleme Kurulu, 2023 Yılı Elektrik Piyasası Gelişim Raporu. Available online: https://www.epdk.gov.tr/Detay/Icerik/4-14475/2023-yili-sektor-raporlari-yayinlanmistir (accessed on 8 March 2025).
  15. Lund, J.W.; Toth, A.N. Direct utilization of geothermal energy 2020 worldwide review. Geothermics 2021, 90, 101915. [Google Scholar]
  16. Hepbaşlı, A.; Özgener, L. Development of geothermal energy utilization in Turkey: A review. Renew. Sustain. Energy Rev. 2004, 8, 433–460. [Google Scholar]
  17. Seyitoğlu, G.; Scott, B. Late Cenozoic crustal extension and basin formation in west Turkey. Geol. Mag. 1991, 128, 155–166. [Google Scholar] [CrossRef]
  18. Gürer, Ö.F. A new look at the origin of N-S trending young basins of western Anatolia. Bull. Miner. Res. Explor. 2023, 170, 117–146. [Google Scholar] [CrossRef]
  19. Karakuş, H.; Şimşek, Ş. Tracing deep thermal water circulation systems in the E–W trending Büyük Menderes Graben, western Turkey. J. Volcanol. Geoth. Res. 2013, 252, 38–52. [Google Scholar] [CrossRef]
  20. Alçiçek, H.; Bülbül, A.; Alçiçek, M.C. Hydrogeochemistry of the thermal waters from the Yenice Geothermal Field (Denizli Basin, Southwestern Anatolia, Turkey). J. Volcanol. Geoth. Res. 2016, 309, 118–138. [Google Scholar] [CrossRef]
  21. Alçiçek, H.; Bülbül, A.; Brogi, A.; Liotta, D.; Ruggieri, G.; Capezzuoli, E.; Meccheri, M.; Yavuzer, İ.; Alçiçek, M.C. Origin, evolution and geothermometry of the thermal waters in the Gölemezli Geothermal Field, Denizli Basin (SW Anatolia, Turkey). J. Volcanol. Geoth. Res. 2018, 349, 1–30. [Google Scholar] [CrossRef]
  22. Alçiçek, H.; Bülbül, A.; Yavuzer, İ.; Alçiçek, M.C. Hydrogeochemical and isotopic assessment and geothermometry applications in relation to the Karahayıt Geothermal Field (Denizli Basin, SW Anatolia, Turkey). Hydrogeol. J. 2019, 27, 1791–1816. [Google Scholar] [CrossRef]
  23. Alçiçek, H.; Bülbül, A.; Yavuzer, İ.; Alçiçek, M.C. Origin and evolution of the thermal waters from the Pamukkale Geothermal Field (Denizli Basin, SW Anatolia, Turkey): Insights from hydrogeochemistry and geothermometry. J. Volcanol. Geoth. Res. 2019, 372, 48–70. [Google Scholar] [CrossRef]
  24. Avşar, Ö.; Altuntaş, G. Hydrogeochemical evaluation of Umut geothermal field (SW Turkey). Environ. Earth Sci. 2017, 76, 582. [Google Scholar] [CrossRef]
  25. Kele, S.; Özkul, M.; Gökgöz, A.; Fórizs, I.; Baykara, M.O.; Alçiçek, M.C.; Németh, T. Stable isotope geochemical and facies study of Pamukkale travertines: New evidences of low-temperature non-equilibrium calcite-water fractionation. Sediment. Geol. 2011, 238, 191–212. [Google Scholar] [CrossRef]
  26. Tut Haklıdır, F.S.; Şengün, R.; Aydın, H. Characterization and comparison of geothermal fluids geochemistry within the Kızıldere Geothermal Field in Turkey: New findings with power capacity expanding studies. Geothermics 2021, 94, 102110. [Google Scholar] [CrossRef]
  27. Dewey, J.F.; Şengör, A.M.C. Aegean and surrounding regions: Complex multiplate and continuum tectonics in a convergent zone. Geol. Soc. Am. Bull. 1979, 90, 84–92. [Google Scholar] [CrossRef]
  28. Yılmaz, Y.; Genç, S.C.; Gürer, O.F.; Bozcu, M.; Yılmaz, K.; Karacık, Z.; Altunkaynak, S.; Elmas, A. When did the western Anatolian grabens begin to develop? In Tectonics and Magmatism in Turkey and the Surrounding Area; Bozkurt, E., Winchester, J.A., Piper, J.D.A., Eds.; Geological Society of London: London, UK, 2000; Volume 173, pp. 353–384. ISBN 978-186-239-064-5. [Google Scholar]
  29. Hetzel, R.; Ring, U.; Akal, C.; Troesch, M. Miocene NNE directed extensional unroofing an the Menderes Massif, Southwestern Turkey. J. Geol. Soc. Lond. 1995, 152, 639–654. [Google Scholar] [CrossRef]
  30. Koçyiğit, A.; Yusufoğlu, H.; Bozkurt, E. Evidence from the Gediz Graben for episodic two-stage extension in Western Turkey. J. Geol. Soc. 1999, 156, 605–616. [Google Scholar] [CrossRef]
  31. Seyitoğlu, G.; Tekeli, O.; Çemen, İ.; Şen, Ş.; Işık, V. The role of the flexural rotation/rolling hinge model in the tectonic evolution of the Alasehir graben, western Turkey. Geol. Mag. 2002, 139, 15–26. [Google Scholar] [CrossRef]
  32. Westaway, R. Neogene evolution of the Denizli region of Western Turkey. J. Struct. Geol. 1993, 15, 37–53. [Google Scholar] [CrossRef]
  33. Altunel, E.; Karacabak, V. Determination of horizontal extension from fissure ridge travertines: A case study from the Denizli Basin, southwestern Turkey. Geodin. Acta 2005, 18, 333–342. [Google Scholar] [CrossRef]
  34. Alçiçek, H.; Varol, B.; Özkul, M. Sedimentary facies, depositional environments and palaeogeographic evolution of the Neogene Denizli Basin of SW Anatolia, Turkey. Sediment. Geol. 2007, 202, 596–637. [Google Scholar] [CrossRef]
  35. Koçyiğit, A. The Denizli graben-horst system and the eastern limit of western Anatolian continental extension: Basin-fill, structure, deformational mode, throw amount and episodic evolutionary history, SW Turkey. Geodin. Acta 2005, 18, 167–208. [Google Scholar] [CrossRef]
  36. Alçiçek, H. Sedimentological Investigations of Neogene Deposits of the Denizli Basin (Sarayköy-Buldan Area, SW Turkey). Ph.D. Thesis, Ankara University, Ankara, Türkiye, 2007. [Google Scholar]
  37. Altunel, E. Active Tectonics and the Evolution of Quaternary Travertines at Pamukkale, Western Turkey. Ph.D. Thesis, University of Bristol, Bristol, UK, 1994. [Google Scholar]
  38. Uysal, I.T.; Feng, Y.; Zhao, J.; Altunel, E.; Weatherley, D.; Karabacak, V.; Cengiz, O.; Golding, S.D.; Lawrence, M.G.; Collerson, K.D. U-series dating and geochemical tracing of late Quaternary travertine in co-seismic fissures. Earth Planet Sci. Lett. 2007, 257, 450–462. [Google Scholar] [CrossRef]
  39. De Filippis, L.; Faccenna, C.; Billi, A.; Anzalone, E.; Brilli, M.; Özkul, M.; Soligo, M.; Tuccimei, P.; Villa, M. Growth of fissure ridge travertines from geothermal springs of Denizli Basin, western Turkey. Geol. Soc. Am. Bull. 2012, 124, 1629–1645. [Google Scholar] [CrossRef]
  40. Özkul, M.; Kele, S.; Gökgöz, A.; Shen, C.C.; Jones, B.; Baykara, M.O.; Fόrizs, I.; Németh, T.; Chang, Y.; Alçiçek, M.C. Comparison of the Quaternary travertine sites in the Denizli Extensional Basin based on their depositional and geochemical data. Sediment. Geol. 2013, 294, 179–204. [Google Scholar] [CrossRef]
  41. Altunel, E.; Barka, A. Evaluation of archaeoseismic damages at Hierapolis. Geol. Bull. Turk. 1996, 39, 65–74. (In Turkish) [Google Scholar]
  42. Hancock, P.L.; Chalmers, R.M.L.; Altunel, E.; Çakır, Z.; Becher-Hancock, A. Creation and destruction of travertine monumental stone by earthquake faulting at Hierapolis, Turkey. In The Archaeology of Geological Catastrophes; McGuire, W.G., Griffiths, D.R., Hancock, P.L., Stewart, I.S., Eds.; The Geological Society of London: London, UK, 2000; pp. 1–14. ISBN 978-186-239-062-1. [Google Scholar]
  43. Piccardi, L. The AD 60 Denizli Basin earthquake and the apparition of Archangel Michael at Colossae (Aegean Turkey). J. Geol. Soc. Lond. 2007, 273, 95–105. [Google Scholar] [CrossRef]
  44. Kumsar, H.; Aydan, Ö.; Şimşek, C.; D’Andria, F. Historical earthquakes that damaged Hierapolis and Laodikeia antique cities and their implications for earthquake potential of Denizli basin in western Turkey. Bull. Eng. Geol. Environ. 2016, 75, 519–536. [Google Scholar] [CrossRef]
  45. İlkışık, O.M. Regional heat flow in western Anatolia using silica temperature estimates from thermal springs. Tectonophysics 1995, 244, 175–184. [Google Scholar] [CrossRef]
  46. Bilim, F.; Akay, T.; Aydemir, A.; Koşaroğlu, S. Curie point depth, heat-flow and radiogenic heat production deduced from the spectral analysis of the aeromagnetic data for geothermal investigation on the Menderes Massif and the Aegean Region, western Turkey. Geothermics 2016, 60, 44–57. [Google Scholar] [CrossRef]
  47. Şimşek, Z. Tekkehamam Jeotermal Alanı Gradyent Sondajları Değerlendirilmesi; Report No. 6236; General Directorate of Mineral Research and Exploration of Turkey (MTA): Ankara, Türkiye, 1978.
  48. Demirörer, M. Denizli-Sarayköy Jeotermik Enerji Aramalari Kizildere-Tekkehamam ve Karakova Jeotermal Gradyent Etüdleri Rapor-I; Report No. 4141; General Directorate of Mineral Research and Exploration of Turkey (MTA): Ankara, Türkiye, 1986.
  49. Ürgün, S. Denizli Kızıldere Jeotermal Alanındaki Çalışmaların Kompilasyonu; Report No: 5919; General Directorate of Mineral Research and Exploration of Turkey (MTA): Ankara, Türkiye, 1976.
  50. Bozkurt, E. Timing of extension on the Büyük Menderes Graben, Western Turkey, and its tectonic implications. In Tectonics and Magmatism in Turkey and the Surrounding Area; Bozkurt, E., Winchester, J.A., Piper, J.D.A., Eds.; Geological Society of London: London, UK, 2000; Volume 173, pp. 385–403. ISBN 978-186-239-064-5. [Google Scholar]
  51. Akkuş, İ.; Akıllı, H.; Ceyhan, S.; Dilemre, A.; Tekin, Z. Geothermal Inventory of Turkey; General Directorate of Mineral Research and Exploration of Turkey (AB Ofset): Ankara, Türkiye, 2005; No. 201; ISBN 975-8964-36-4.
  52. Şimşek, Ş. Hydrogeological and isotopic survey of geothermal fields in the Buyuk Menderes graben, Turkey. Geothermics 2003, 32, 669–678. [Google Scholar] [CrossRef]
  53. Sun, S. Denizli-Uşak Arasının Jeolojisi ve Linyit Olanakları; Report No. 9985; General Directorate of Mineral Research and Exploration of Turkey (MTA): Ankara, Türkiye, 1990.
  54. Konak, N.; Şenel, M. Geological Map of Turkey in 1/500.000 Scale: Denizli Sheet; Publication of Mineral Research and Exploration Directorate of Turkey (MTA): Ankara, Türkiye, 2002.
  55. Gökgöz, A.; Yılmazlı, İ.E.; Güngör, İ.; Yavuzer, İ. Hydrogeology and environmental study at the Karahayıt geothermal field (Western Turkey). In Proceedings of the World Geothermal Congress, Bali, Indonesia, 25–29 April 2010. [Google Scholar]
  56. Kocairi, C. Denizli Metropolitan Municipality Karahayıt KH-4 Geothermal Production Drilling Well Completion Report; Fensu Sondaj: Konya, Türkiye, 2019. [Google Scholar]
  57. Demirel, V.; Kahraman, S. Denizli Belediyesi Adına Yapılan Denizli-Gölemezli (DG-3, DG-4, DG-5) Kuyularına ait Kuyu Bitirme Raporu; Report No: 10660; General Directorate of Mineral Research and Exploration of Turkey (MTA): Ankara, Türkiye, 2003.
  58. Demirel, V.; Tamgaç, Ö.F. Denizli-Buldan-Yenicekent Jeolojik Etüdü ve Yenicekent (YK-1, YK-2 ve YK-3) Sondajları Kuyu bitirme Raporu; MTA Report; General Directorate of Mineral Research and Exploration of Turkey (MTA): Ankara, Türkiye, 2004.
  59. Çelik, H. Buldan-Yenicekent (Denizli) Resource Protection Area Study Report Regarding Operation License No. 30 (J-460); G.S.E. Enerji Sanayii ve Ticaret Limited.Şirketi: Ankara, Türkiye, 2017. [Google Scholar]
  60. Subay, E. Hydrogeological and Hydrogeochemical Investigation of Tosunlar Geothermal Field (Denizli). Master’s Thesis, Pamukkale University, Denizli, Türkiye, 2019. [Google Scholar]
  61. Şimşek, Ş. Denizli-Sarayköy-Buldan alanının jeolojisi ve jeotermal enerji olanakları. İ.Ü. Yer Bil. Fak. Yayın Organı 1984, 3, 145–162. [Google Scholar]
  62. UKAM. Pamukkale Koruma Amaçlı İmar Planında Öngörülen Travertenlerin Korunması ve Geliştirilmesi için Proje Hizmetleri; Hacettepe University International Research and Application Center for Karst Water Resources (UKAM): Ankara, Türkiye, 1994. [Google Scholar]
  63. ÇED ve Çevre İzinleri Şube Müdürlüğü. Denizli İli 2020 Yılı Çevre Durum Raporu; Çevre ve Şehircilik İl Müdürlüğü: Denizli, Türkiye, 2020. Available online: https://webdosya.csb.gov.tr/db/ced/icerikler/2020_den-zl-_-cdr-20211018151306.pdf (accessed on 8 March 2025).
  64. Şimşek, Ş.; Günay, G.; Elhatip, H.; Ekmekçi, M. Environmental protection of geothermal waters and travertines at Pamukkale, Turkey. Geothermics 2000, 29, 557–572. [Google Scholar] [CrossRef]
  65. Gökgöz, A. Hydrogeology of Pamukkale-Karahayıt-Gölemezli Hydrothermal Karst. Ph.D. Thesis, Süleyman Demirel University, Isparta, Türkiye, 1994. [Google Scholar]
  66. Bülbül, A. Hydrogeology of Kamara and Çizmeli (Yenice-Buldan) hot and mineral waters. Master’s Thesis, Pamukkale University, Denizli, Türkiye, 2000. [Google Scholar]
  67. Gökgöz, F. Pamukkale-Gölemezli (Denizli) Source Protection Area Study Report Regarding Geothermal Resource Operation License No. 34 (J-433/A); The Denizli Metropolitan Municipality: Denizli, Türkiye, 2020. [Google Scholar]
  68. Akdemir, M.; Hançer, M.; Karaş, M.; Kıroba, M.O. Geothermal Energy Possibilities of Buldan/Yenicekent (Denizli) Field and Surroundings with Geothermal Operation License No. 30 (J-460); Geology, Tectonic and Geophysical Survey Report; MSC Jeoteknik Sondajcılık Sanayı Ticaret Limited Şirketi: İzmir, Türkiye, 2020. [Google Scholar]
  69. Uysallı, H.; Keskin, B. Denizli–Sarayköy KD-I, KD-II, TH-I, KD-I/A, KD-III, IV, VI, IX, XII, XIII, XIV derin jeotermik sondajları bitirme raporu; Report No. 4491; General Directorate of Mineral Research and Exploration of Turkey (MTA): Ankara, Türkiye, 1971.
  70. Şimşek, Ş.; Yıldırım, N.; Gülgör, A. Developmental and environmental effects of the Kızıldere geothermal power project, Turkey. Geothermics 2005, 34, 239–256. [Google Scholar] [CrossRef]
  71. Yıldırım, N.; Güner, İ.N. Isotopic and hydrogeochemical properties of waters encountered in the geothermal area, eastern Menderes graben. In Proceedings of the Hidrojeolojide İzotop Tekniklerinin Kullanılması Sempozyumu, Adana, Türkiye, 21–25 October 2002; pp. 79–97. [Google Scholar]
  72. Özkul, M.; Kele, S.; Gökgöz, A.; Forisz, I.; Alçiçek, M.C.; Eros, A. Stable Isotopic Studies on Travertines for Paleoenvironmental and Paleoclimatic Reconstruction: A Comparative Study on the Genesis of Occurrences in Turkey and Hungary; Project (106Y207); TÜBİTAK-NKHT: Ankara, Türkiye, 2009.
  73. Güvendi, M. Sarayköy-Tosunlar (Denizli) Revised Resource Protection Area Study Report Regarding Operation License No. 23; Akça Enerji Arşivi: Denizli, Turkey, 2014; pp. 40–50. [Google Scholar]
  74. Karamanderesi, İ.H.; Ölçenoğlu, K. Geology of the Denizli Sarayköy (Gerali) Geothermal Field, Western Anatolia, Turkey. In Proceedings of the World Geothermal Congress, Antalya, Turkey, 24–29 April 2005. [Google Scholar]
  75. Meybeck, M. Global chemical weathering of surficial rocks estimated from river dissolved loads. Am. J. Sci. 1987, 287, 401–428. [Google Scholar] [CrossRef]
  76. Appelo, C.A.J.; Postma, D. Geochemistry, Groundwater and Pollution, 2nd ed.; CRC Press: London, UK, 2005; ISBN 978-041-536-428-7. [Google Scholar]
  77. Schoeller, H. Les échanges de bases dans les eaux souterraines; trois exemples es Tunisie. Bull. Soc. Geol. Fr. 1934, 4, 389–420. [Google Scholar]
  78. Şahinci, A. Doğal Suların Jeokimyası; Reform Matbaası: İzmir, Türkiye, 1991. (In Turkish) [Google Scholar]
  79. Mayo, A.L.; Loucks, M.D. Solute and isotopic geochemistry and ground water flow in the central Wasatch Range. Utah. J. Hydrol. 1995, 172, 31–59. [Google Scholar] [CrossRef]
  80. Gürgey, K.; Simoneit, B.R.T.; Batı, Z.; Karamanderesi, İ.H.; Varol, B. Origin of petroliferous bitumen from the Büyük Menderes–Gediz geothermal graben system, Denizli-Sarayköy, western Turkey. Appl. Geochem. 2007, 22, 1393–1415. [Google Scholar] [CrossRef]
  81. Baudrand, M.; Aloisi, G.; Martineau, F.; Fourel, F.; Lecuyer, C.; Pancost, R.; Blanc-Valleron, M.M.; Rouchy, J.M.; Aref, M.A.M.; Grossi, V. Microbial diagenesis of gypsum. In Proceedings of the Goldschmidt Conference, Knoxville, TN, USA, 13–18 June 2010. [Google Scholar]
  82. Arnórsson, S. The use of mixing models and chemical geothermometers for estimating underground temperature in geothermal systems. J. Volcanol. Geoth. Res. 1985, 23, 299–335. [Google Scholar] [CrossRef]
  83. Dilsiz, C. Conceptual hydrodynamic model of the Pamukkale hydrothermal field, southwestern Turkey, based on hydrochemical and isotopic data. Hydrogeol. J. 2006, 14, 562–572. [Google Scholar] [CrossRef]
  84. İnan, A.B. The seasonal investigation of the chemical and isotopic composition of the Pamukkale thermal spring (Denizli). Master’s Thesis, Pamukkale University, Denizli, Türkiye, 2024. [Google Scholar]
  85. Kumsar, H.; Aydan, Ö.; Tano, H.; Ulusay, R.; Çelik, S.B.; Kaya, M.; Karaman, M. An On-Line Monitoring System of Multi-Parameter Changes of Geothermal Systems Related to Earthquake Activity in Western Anatolia in Turkey. In Proceedings of the World Geothermal Congress, Bali, Indonesia, 25–29 April 2010. [Google Scholar]
  86. Boğaziçi Üniversitesi Kandilli Rasathanesi BDTİM Deprem Sorgulama Sistemi. Available online: http://koeri.boun.edu.tr/sismo/zeqdb/ (accessed on 16 March 2025).
  87. Parkhurst, D.L.; Appelo, C.A.J. User’s Guide to PHREEQC (Version 2)—A Computer Program for Speciation, Batch-Reaction, One-Dimensional Transport, and Inverse Geochemical Calculations; Water-Resources Investigations Report, 99–4259; US Geological Survey: Reston, VA, USA, 1999.
  88. Şamilgil, E.; Arda, O. Laboratory Analyses Result of Scale Sample in Kızıldere; Report No. 9527; General Directorate of Mineral Research and Exploration of Turkey (MTA): Ankara, Türkiye, 1977.
  89. Giese, L.B.; Pekdeğer, A.; Dahms, E. Thermal fluids and scalings in the geothermal power plant of Kızıldere, Turkey. In Proceedings of the 9th International Symposium on Water-Rock Interaction, Taupo, New Zealand, 30 March–3 April 1998; pp. 625–628. [Google Scholar]
  90. Tarcan, G.; Özen, T.; Gemici, Ü.; Çolak, M.; Karamanderesi, İ.H. Geochemical assessment of mineral scaling in Kızıldere geothermal field, Turkey. Environ. Earth Sci. 2016, 75, 1317. [Google Scholar] [CrossRef]
  91. Filiz, Ş. Investigation of the important geothermal areas by using C, H, O isotopes. In Proceedings of the Seminar on Utilization of Geothermal Energy for Electric Power Production and Space Heating, UN Economic Commission for Europe, EP/SEM.9/R.3, Florence, Italy, 14–17 May 1984. [Google Scholar]
  92. Yaman, D. Origin of high boron contents of the geothermal waters of the Menderes Massif continental rift zones. Ph.D. Thesis, Süleyman Demirel University, Isparta, Türkiye, 2005. [Google Scholar]
  93. Uzun, E. Formation, history and preservation of travertines in Pamukkale (Denizli). Master’s Thesis, Süleyman Demirel University, Isparta, Türkiye, 2017. [Google Scholar]
  94. Özgür, N. Geochemical signature of the Kızıldere geothermal field, Western Anatolia, Turkey. Int. Geol. Rev. 2002, 44, 153–163. [Google Scholar] [CrossRef]
  95. Khorshtd, T. Hydrogeochemical and hydrogeological investigation of the Yenicekent Gölemezli geothermal field. Master’s Thesis, Dokuz Eylül University, İzmir, Türkiye, 2013. [Google Scholar]
  96. Dilaver, A.T.; Aydın, B.; Özyurt, N.N.; Bayarı, C.S. Isotope Contents of Türkiye Precipitation (2012–2016); General Directorate of State Hydraulic Works (DSI): Ankara, Türkiye, 2018. Available online: https://www.mgm.gov.tr/FILES/arastirma/izotopyagis/izotopYagisDegerlendirme.pdf (accessed on 8 March 2025).
  97. Craig, H. Isotopic variations in meteoric waters. Science 1961, 133, 1702–1703. [Google Scholar] [CrossRef] [PubMed]
  98. Gat, J.R.; Carmi, I. Evolution of the isotopic composition of atmospheric waters in the Mediterranean Sea area. J. Geophys. Res. 1970, 75, 3039–3048. [Google Scholar] [CrossRef]
  99. Güner, İ.N.; Yıldırım, N. Hydrochemical modelling and determination of 14C ages of geothermal waters in Kızıldere and Tekkehamam fields (Sarayköy-Denizli). In Proceedings of the II. Ulusal Hidrolojide İzotop Teknikleri Sempozyumu, İzmir, Türkiye, 26–30 September 2005; pp. 297–308. (In Turkish). [Google Scholar]
  100. Clark, I.D.; Fritz, P. Environmental Isotopes in Hydrogeology, 1st ed.; CRC Press: Boca Raton, FL, USA, 1997; ISBN 978-156-670-249-2. [Google Scholar]
  101. Yaman, D.; Özgür, N. Hydrogeological, hydrogeochemical and isotopic properties of geothermal fields of Kızıldere and its vicinity. In Proceedings of the II. Ulusal Hidrolojide İzotop Teknikleri Sempozyumu, İzmir, Türkiye, 26–30 September 2005; pp. 1–10. (In Turkish). [Google Scholar]
  102. Önhon, E.; Ertan, I.; Güler, S.; Nazik, M.; Kaplan, A. Research on the Origin of the Karst Waters in Yukarı Çürüksu Plain Using Isotope Techniques; Final Report; General Directorate of State Hydraulic Works (DSI): Ankara, Türkiye, 1989.
  103. Carreira, P.M.; Marques, J.M.; Carvalho, M.R.; Nunes, D.; Antunes da Silva, M. Carbon isotopes and geochemical processes in CO2-rich cold mineral water, N-Portugal. Environ. Earth Sci. 2014, 71, 2941–2953. [Google Scholar] [CrossRef]
  104. Güner, İ.N.; Yıldırım, N. Important points to consider in the sampling and calculation methods of the geothermal 14C age studies, case study: Pamukkale thermal springs. In Proceedings of the 75 Geological Congress of Turkey, Ankara, Türkiye, 10–14 April 2023; p. 313. [Google Scholar]
  105. Yıldırım, G.; Mutlu, H.; Karabacak, V.; Uysal, I.T.; Dirik, K.; Temel, A.; Yüce, G.; Zhao, J.X. Temporal changes in geochemical-isotopic systematics of the late Pleistocene Akkaya travertines (Turkey)—Implications for fluid flow circulation and seismicity. Geochemistry 2020, 80, 125630. [Google Scholar] [CrossRef]
  106. Wei, Z.; Huang, S.; Xu, J.; Yuan, C.; Zhang, M.; Wang, C. Geochemical evolution of geothermal waters in the Pearl River Delta region, South China: Insights from water chemistry and isotope geochemistry. J. Hydrol. 2024, 51, 101670. [Google Scholar] [CrossRef]
  107. Ercan, T.; Matsuda, J.; Nagano, K.; Kita, I. Noble gas isotopic compositions in gas and water samples from Anatolia. In Proceedings of the International Symposium on the Geology of the Black Sea Region, Ankara, Turkey, 7–11 September 1992; General Directorate of Mineral Research and Exploration of Turkey (MTA) and Chamber of Geological Engineers: Ankara, Turkey, 1995; pp. 197–206. [Google Scholar]
  108. Mutlu, H.; Güleç, N.; Hilton, D.R. Helium-carbon relationships in geothermal fluids of western Anatolia, Turkey. Chem. Geol. 2008, 247, 305–321. [Google Scholar] [CrossRef]
  109. Süer, S.; Wiersberg, T.; Güleç, N.; Grassa, F. Stable Isotope Evaluation of Geothermal Gases from the Kızıldere and Tekke Hamam Geothermal Fields, Western Anatolia, Turkey. Geoscience 2022, 12, 452. [Google Scholar] [CrossRef]
  110. Brogi, A.; Alçiçek, M.C.; Yalçıner, C.C.; Capezzuoli, E.; Liotta, D.; Meccheri, M.; Rimondi, V.; Ruggieri, G.; Gandin, A.; Boschi, C.; et al. Hydrothermal fluids circulation and travertine deposition in an active tectonic setting: Insights from the Kamara geothermal area (western Anatolia, Turkey). Tectonophysics 2016, 680, 211–232. [Google Scholar] [CrossRef]
  111. Panichi, C.; Tongiorgi, E. Carbon isotopic composition of CO2 from springs, fumaroles, mofettes and travertines of central and southern Italy: A preliminary prospection method of geothermal areas. In Proceedings of the Second United Nations Symposium on the Development and Use of Geothermal Resources, San Francisco, CA, USA, 20–29 May 1975; U. S. Energy Research and Development Administration: Washington, DC, USA, 1976; pp. 815–825. [Google Scholar]
  112. Rizzo, A.L.; Uysal, T.; Mutlu, H.; Ünal-İmer, E.; Dirik, K.; Yüce, G.; Caracausi, A.; Italiano, F.; Misseri, M.; Temel, A.; et al. Geochemistry of Fluid Inclusions in Travertines from Western and Northern Turkey: Inferences on the Role of Active Faults in Fluids Circulation. Geochem. Geophy. Geosy. 2019, 20, 5473–5498. [Google Scholar] [CrossRef]
  113. Koralay, T.; Kılınçarslan, S. Minero-petrographic and isotopic characterization of two antique marble quarries in the Denizli region (western Anatolia, Turkey). Period. Mineral. 2015, 84, 263–288. [Google Scholar] [CrossRef]
  114. Zöldföldi, J. 5000 Years Marble History in Troia and the Troad. Petroarchaeological Study on the Provenance of White Marbles in West Anatolia. Ph.D. Thesis, Eberhard Karls Universität: Tübingen, Germany, 2011. [Google Scholar]
  115. Brilli, M.; Giustini, F.; Conte, A.M.; Mercadal, P.L.; Quarta, G.; Plumed, H.R.; Scardozzi, G.; Belardi, G. Petrography, geochemistry and cathodoluminescence of ancient white marble from quarries in the southern Phrygia and northern Caria regions of Turkey: Considerations on provenance discrimination. J. Archaeol. Sci. 2015, 4, 124–142. [Google Scholar] [CrossRef]
  116. Hoefs, J. Stable Isotope Geochemistry; Springer: Berlin, Germany, 1980; ISBN 978-038-709-917-0. [Google Scholar]
  117. Javoy, M.; Pineau, F.; Delorme, H. Carbon and nitrogen isotopes in the mantle. Chem. Geol. 1986, 57, 41–62. [Google Scholar] [CrossRef]
  118. Möller, P.; Dulski, P.; Savasçın, Y.; Conrad, M. Rare earth elements, yttrium and Pb isotope ratios in thermal spring and well waters of West Anatolia, Turkey: A hydrochemical study of their origin. Chem. Geol. 2004, 206, 97–118. [Google Scholar] [CrossRef]
  119. McDonough, W.F.; Sun, S.S. The composition of the Earth. Chem. Geol. 1995, 120, 223–253. [Google Scholar] [CrossRef]
  120. De Carlo, E.H.; Green, W.J. Rare earth elements in the water column of Lake Vanda, McMurdo Dry Valleys, Antarctica. Geochim. Cosmochim. Acta 2002, 66, 1323–1333. [Google Scholar] [CrossRef]
  121. Rankama, K.; Sahama, T.G. Geochemistry; University of Chicago Press: Chicago, IL, USA, 1950; ISBN 978-022-670-395-4. [Google Scholar]
  122. Tanaka, K.; Kawabe, I. REE abundance in ancient seawater inferred from marine limestone and experimental REE partition coefficients between calcite and aqueous solution. Geochem. J. 2006, 40, 425–435. [Google Scholar] [CrossRef]
  123. Rollinson, H.R. Using Geochemical Data: Evaluation, Presentation, Interpretation; Longman Scientific and Technical: London, UK, 1993. [Google Scholar]
  124. Möller, P.; Dulski, P.; Morteani, G. Partitioning of rare earth elements, yttrium, and some major elements among source rocks, liquid and steam of Larderello–Travale Geothermal Field, Tuscany (Central Italy). Geochim. Cosmochim. Acta 2003, 67, 171–183. [Google Scholar] [CrossRef]
  125. Möller, P. Rare earth elements and yttrium distribution in water-rock interactions: Field observations and experiments. In Water–Rock Interaction; Stober, I., Bucher, K., Eds.; Kluwer Academic Publishing: Dordrecht, The Netherlands, 2002; pp. 97–123. [Google Scholar]
  126. Fournier, R.O. Chemical geothermometers and mixing models for geothermal systems. Geothermics 1977, 5, 41–50. [Google Scholar] [CrossRef]
  127. Truesdell, A.H. Summary of Section III: Geochemical Techniques in Exploration; Lawrence Berkeley Labortory: Berkeley, CA, USA, 1976; pp. 54–80.
  128. Fournier, R.O. A revised equation for the Na-K geothermometer. Geotherm. Resour. Counc. Trans. 1979, 3, 221–224. [Google Scholar]
  129. Kharaka, Y.K.; Mariner, R.H. Chemical geothermometers and their application to formation waters from sedimentary basins. In Thermal History of Sedimentary Basins; Methods and Case Histories; Naeser, N.D., McCulloh, T.H., Eds.; Springer: New York, NY, USA, 1989; pp. 99–117. ISBN 978-038-796-702-8. [Google Scholar]
  130. Giggenbach, W.; Gonfiantini, R.; Jangi, B.L.; Truesdell, A.H. Isotopic and chemical composition of Parbati valley geothermal discharges, N.W. Himalaya, India. Geothermics 1983, 12, 199–222. [Google Scholar] [CrossRef]
  131. Fournier, R.O.; Truesdell, A.H. An empirical Na-K-Ca geothermometer for natural waters. Geochim. Cosmochim. Acta 1973, 37, 1255–1275. [Google Scholar] [CrossRef]
  132. Fournier, R.O.; Potter, R.W. Magnesium correction to Na-K-Ca geothermometer. Geochim. Cosmochim. Acta 1979, 43, 1543–1550. [Google Scholar] [CrossRef]
  133. Lloyd, R.M. Oxygen isotope behaviour in the sulfate-water system. J. Geophys. Res. 1968, 73, 6099–6110. [Google Scholar] [CrossRef]
  134. Giggenbach, W.F. Geothermal solute equilibria-derivation of Na-K-Mg-Ca geoindicators. Geochim. Cosmochim. Acta 1988, 52, 2749–2765. [Google Scholar] [CrossRef]
  135. Mutlu, H. Chemical geothermometry and fluid–mineral equilibria for the Ömer-Gecek thermal waters, Afyon area, Turkey. J. Volcanol. Geoth. Res. 1998, 80, 303–321. [Google Scholar] [CrossRef]
  136. Mizutani, Y.; Rafter, T.A. Oxygen isotopic composition of sulphates. Part 3. Oxygen isotopic fractionation in the bisulfate ion-water system. N. Z. J. Sci. 1969, 12, 54–59. [Google Scholar]
  137. Fritz, P.; Basharmal, G.M.; Drimmie, R.J.; Ibsen, J.; Qureshi, R.M. Oxygen isotope exchange between sulphate and water during bacterial reduction of sulphate. Chem. Geol. 1989, 79, 99–105. [Google Scholar] [CrossRef]
  138. Boschetti, T.; Cortecci, G.; Toscani, L.; Iacumin, P. Sulfur and oxygen isotope compositions of Upper Triassic sulfates from northern Apennines (Italy): Paleogeographic and hydrogeochemical implications. Geol. Acta 2011, 9, 129–147. [Google Scholar] [CrossRef]
  139. Farley, K.A.; Neroda, E. Noble gases in the Earth’s mantle. Annu. Rev. Earth Planet Sci. 1998, 26, 189–218. [Google Scholar] [CrossRef]
  140. Güleç, N.; Hilton, D.R.; Mutlu, H. Helium isotope variations in Turkey: Relationship to tectonics, volcanism and recent seismic activities. Chem. Geol. 2002, 187, 129–142. [Google Scholar] [CrossRef]
  141. Wiersberg, T.; Süer, S.; Güleç, N.; Erzinger, J.; Parlaktuna, M. Noble gas isotopes and the chemical composition of geothermal gases from the eastern part of the Büyük Menderes Graben (Turkey). J. Volcanol. Geotherm. Res. 2011, 208, 112–121. [Google Scholar] [CrossRef]
  142. Akan, S.B.; Şimşek, Ş. Study of the gas discharges in the Denizli–Pamukkale Geothermal area (SW-Turkey). In Proceedings of the International Conference on Water Problems in the Mediterranean Countries, Lefkoşa, Cyprus, 17–21 November 1997; pp. 207–215. [Google Scholar]
Figure 2. Lithology logs of some thermal wells in the geothermal fields of the study area (KHR-1, T-3 and T-4 are reinjection wells). KGF wells: Gökgöz et al. [55], Alçiçek et al. [23], Kocairi [56]; GGF wells: Akkuş et al. [51], Demirel and Kahraman [57], Alçiçek et al. [21]; YGF wells: Demirel and Tamgaç [58], Çelik [59], TGF wells: Subay [60]; TeGF and KıGF wells: Akkuş et al. [51]. Note: There are no lithology log data for the YK-5 well, but since it is very close to YK-2 well and thus a similar lithology log can be expected. TH-2 and R-1 are public wells selected from a large number of wells drilled by the public and private enterprises in the Tekkehamam and Kızıldere fields, respectively.
Water 17 00961 g002
Figure 3. Pamukkale white travertines and locations of thermal springs.
Water 17 00961 g003
Figure 4. Locations of thermal springs and wells in the Pamukkale, Karahayıt, Gölemezli and Yenicekent geothermal fields (geological symbols are same as Figure 1c). (a) Pamukkale field, 1. PAM thermal spring, 2. the antique pool, 3. Jandarma thermal spring, 4 and 5. K-1 ponor (sinkhole), 6. surface rupture of the Pamukkale fault in the Jandarma spring area, 7. white travertines deposited by Pamukkale thermal waters, 8. Çukurbağ thermal spring (mean 56 °C, mostly dry in the last 10 years), 9. fissure ridge near the Çukurbağ spring; (b) Karahayıt field (modified from Gökgöz et al. [55]), 1. aerial view of the Karahayıt field and location of red water, 2. colored travertines deposited by thermal waters from two wells (red water area), 3. KH-1 well, 4. one of fissure ridges in the field; (c) Gölemezli field, 1. Göl-1 well, 2. Göl-2 well, 3. Eski Hamam thermal spring (48 °C); (d) Yenicekent field, 1. YK-1 well, 2. YK-2 well, 3. Kamara fissure ridge (from Prof. Dr. Mehmet Özkul’s archive).
Water 17 00961 g004
Figure 7. Bivariate ion diagrams showing the origin of dissolved solids in the waters. (a) Na vs. Cl diagram, (b) Ca vs. Mg diagram, (c) Ca vs. HCO3, the regression line excludes cold waters, TeGF and Göl-1 thermal waters (grey shaded area represents waters derived from carbonate dissolution), (d) Ca vs. Na diagram, (e) Na vs. HCO3 diagram, (f) Ca vs. SO4 diagram and (g) Ca vs. SO4 + HCO3 diagram.
Water 17 00961 g007
Figure 8. Bivariate diagrams of Cl vs. δ18O, B, F and SiO2.
Water 17 00961 g008
Figure 9. The change of some ionic ratios in the thermal waters from the PGF to KıGF.
Water 17 00961 g009
Figure 11. HCO3 and 14C contents of the thermal waters.
Water 17 00961 g011
Figure 12. (a) Diagram showing the carbon isotope composition of studied waters together with travertines, metamorphic rocks, Neogene carbonates and CO2 gas sampled in the Denizli region, (b) diagram showing the carbon isotope composition (δ13C) of DIC and CO2 in thermal fluids of the Denizli basin. Also shown are the δ13C of various earth reservoirs [100]. Yellow shaded area: δ13C of DIC in Pamukkale, Karahayıt, Gölemezli and Yenice thermal waters from Alçiçek et al. [20,21,22,23]; blue shaded area: δ13C of cold waters [23]; pink shaded area: carbon isotope composition of CO213CCO2) in Pamukkale, Karahayıt and Yenice thermal fluids [91,107]. Data for Tekkehamam and Kızıldere (DIC) are from Güner and Yıldırım [99], Tekkehamam (CO2): Ercan et al. [107] and Kızıldere (CO2): Mutlu et al. [108].
Water 17 00961 g012
Figure 13. δ18O(SO4) vs. δ34S(SO4) diagram for the thermal waters. Pamukkale, Karahayıt and Yenicekent data from Yıldırım and Güner [71]; Kızıldere data from Özgür [94], Yıldırım and Güner [71] and Tut Haklıdır et al. [26].
Water 17 00961 g013
Figure 14. Diagram showing the REY contents of Denizli thermal waters, travertines, scale samples and various rocks exposed in the Denizli basin. Data on waters, rock samples and travertines are from Möller et al. [118]. Light-gray shaded field comprises Kızıldere waters. Data on scale samples belong to this study. Chondrite values from McDonough and Sun [119].
Water 17 00961 g014
Figure 15. Na-K-Mg diagram (Giggenbach [134]).
Water 17 00961 g015
Figure 16. Saturation diagram constructed for the thermal waters at temperature range of 25–200 °C. The black arrows and orange shaded area indicate the plausible reservoir temperatures.
Water 17 00961 g016
Figure 17. Comparison of results of chemical (except for Na-K geothermometer) and 18O(SO4-H2O) (filled circles) geothermometers. Data of Pamukkale: Alçiçek et al. [23]; Karahayıt: Alçiçek et al. [22]; Gölemezli: Alçiçek et al. [21] and Yenicekent: Alçiçek et al. [20]. Red (Yıldırım and Güner [71]) and blue circles (this study) are 18O(SO4-H2O) temperatures.
Water 17 00961 g017
Table 2. Physicochemical compositions of thermal and cold water samples from geothermal fields in the east of the Büyük Menderes graben.
Site Sample IDT °C EC pHCa2+Mg2+Na+K+ClSO42−HCO3FLi+AlBBaSrSiO2
This study
PGFPAM33.923906.1938193405.19.56539320.90.130.0040.960.0196.3246.6
KGFKH-256.030006.355121191382425108912081.20.270.0102.130.06210.6840.6
KH-360.730607.0136712213123199489081.60.330.0111.970.0539.4352.7
KH-453.431507.2848492153332963014141.90.310.0262.440.0845.9830
GGFGöl-163.337807.3231893335563647015371.50.320.0243.590.0797.1271.7
Göl-269.044706.854321244965658181211653.31.520.0126.480.03711.30136
YGFYK-561.531406.8425435442703249714762.50.660.0173.420.0565.1157.9
TGFT-197.038507.48232327521234563820632.40.590.0204.330.1047.50138
T-298.037707.77215406881324465120632.20.610.0124.460.1228.09162
T-384.148207.27243259401395897123323.51.540.0307.280.0697.16113
Previous studies
PGFPAM a,b35.023006.3745587405.91268811242.10.100.0431.000.0286.0925
Beltes b34.723406.1044686395.29.66609451.50.140.0461.040.0246.3747.8
Çukurbağ b56.130106.90527114128262798012352.80.320.0842.720.0617.6244
KGFKH-2 b59.527107.705371171152422107810851.50.320.0731.950.06010.7050
KH-2 c47.025006.25486153145293310621225nananananana51
KH-3 d58.230506.5251211912125229461155nanananananana
GGFDG-1 a62.040306.603901215055573150413694.91.50na7.90nana94.1
DG-3 e53.029306.703935522456294321470nananananana47
Göl-1 e58.537606.6959112434676425522564nananananana56
Göl-2 e65.047306.34559166602717919361548nananananana132
YGFYK-1 f51.530806.652664652494576391780nananananana46
TekGFİnaltı a96.041707.71547.48768491156067617.71.30na22.0nana164
W-3 g99.140809.38667.986710776107773211.13.891.01914.20.677na188
KıGFR-1 h,i,*242.055708.404.70.213801621227172388324.40na28.0nana470
Cold watersCS-1 c11.53907.6262461.2412203nananananana17
CS-2 c13.43807.6876830.5112264nananananana24
CS-3 c8.74608.031015353.4915316nananananana19
Note: a Yıldırım and Güner [71], b Kele et al. [25], c Alçiçek et al. [22], d Özkul et al. [72], e Alçiçek et al. [21], f Alçiçek et al. [20], g Avşar and Altuntaş [24], h Tut Haklıdır et al. [26], i Şimşek [52]. * Bottom-hole temperature; Chemical analysis results of R-1 reflect reservoir water chemistry because of correction by its steam fraction [26]. EC electrical conductivity (µS/cm), concentrations are in mg/L, na: not analyzed.
Table 4. REY contents of scale samples from some thermal wells in the study area (ppm).
FieldWellLaCePrNdSmEuGdTbDyHoErTmYbLuY
KGFKH-22.02.80.421.20.170.070.30.050.190.050.160.030.130.021.8
GGFGöl-12.42.70.452.10.490.180.960.171.270.331.000.140.900.1412.4
Göl-21.92.60.351.30.290.100.480.090.440.100.310.050.410.064.7
DG-31.52.00.291.30.360.110.670.130.740.180.540.090.460.087.5
YGFYK-51.83.70.603.21.050.321.820.312.130.451.360.181.080.1417.3
TGFT-13.05.60.673.00.680.180.870.151.040.160.490.060.430.066.5
Table 5. Chemical and isotope geothermometers applied to the sampled thermal waters (°C).
GeothermometerCalibrationPAMKH-2KH-3KH-4Göl-1Göl-2YK-5T-1T-2T-3
Tmeasured 33.956.060.753.463.369.061.597.098.084.1
SiO2 1–Chalcedony t ° C = 1032 4.69 logSiO 2 273.15 686275489113079131143118
SiO2 1—Quartz
No steam loss
t ° C = 1309 5.19 logSiO 2 273.15 999210479119155109156166144
SiO2 1—Quartz
Max. steam loss
at 100 °C
t ° C = 1522 5.75 logSiO 2 273.15 999410583118148109148157139
Na-K 2 t ° C = 855.6 0.8573 + log Na / K 273.15 215254246287251201244247270233
Na-K 3 t ° C = 1217 1.483 + log Na / K 273.15 239268262292266228260263280253
Mg-Li 4 t ° C = 2200 5.47 + log Mg / Li 273.15 27384143447469686695
Na-Li 4 t ° C = 1590 0.779 + log Na / Li 273.15 213183197185145210168136142173
K-Mg 5 t ° C = 4410 14.00 log K / Mg 273.15 30585568817799116115124
Na-K-Ca 6,7 t ° C = 1647 log Na / K + β log Ca / Na + 2.06 + 2.47 273.15 1661647355 *52 *107 *121 *104 *141 *
18O(SO4-H2O) 8 1000 ln α SO 4 H 2 O = 3.25 10 6 / T 2 5.6 63-67-75579385--
Note: 1 Fournier [126], 2 Truesdell [127], 3 Fournier [128], 4 Kharaka and Mariner [129], 5 Giggenbach et al. [130],6 Fournier and Truesdell [131], 7 Fournier and Potter [132], 8 Lloyd [133]; * Mg correction applied to Na-K-Ca temperatures.
Disclaimer/Publisher’s Note: The statements, opinions and data contained in all publications are solely those of the individual author(s) and contributor(s) and not of MDPI and/or the editor(s). MDPI and/or the editor(s) disclaim responsibility for any injury to people or property resulting from any ideas, methods, instructions or products referred to in the content.

