
Investigation of the Interaction of Water and Energy in Multipurpose Bio-Solar Green Roofs in Mediterranean Climatic Conditions

 ,
,  ,
,  ,
,  ,
,  and
and 
Abstract
1. Introduction
1.1. Water Consumption in Conventional and Bio-Solar Green Roofs
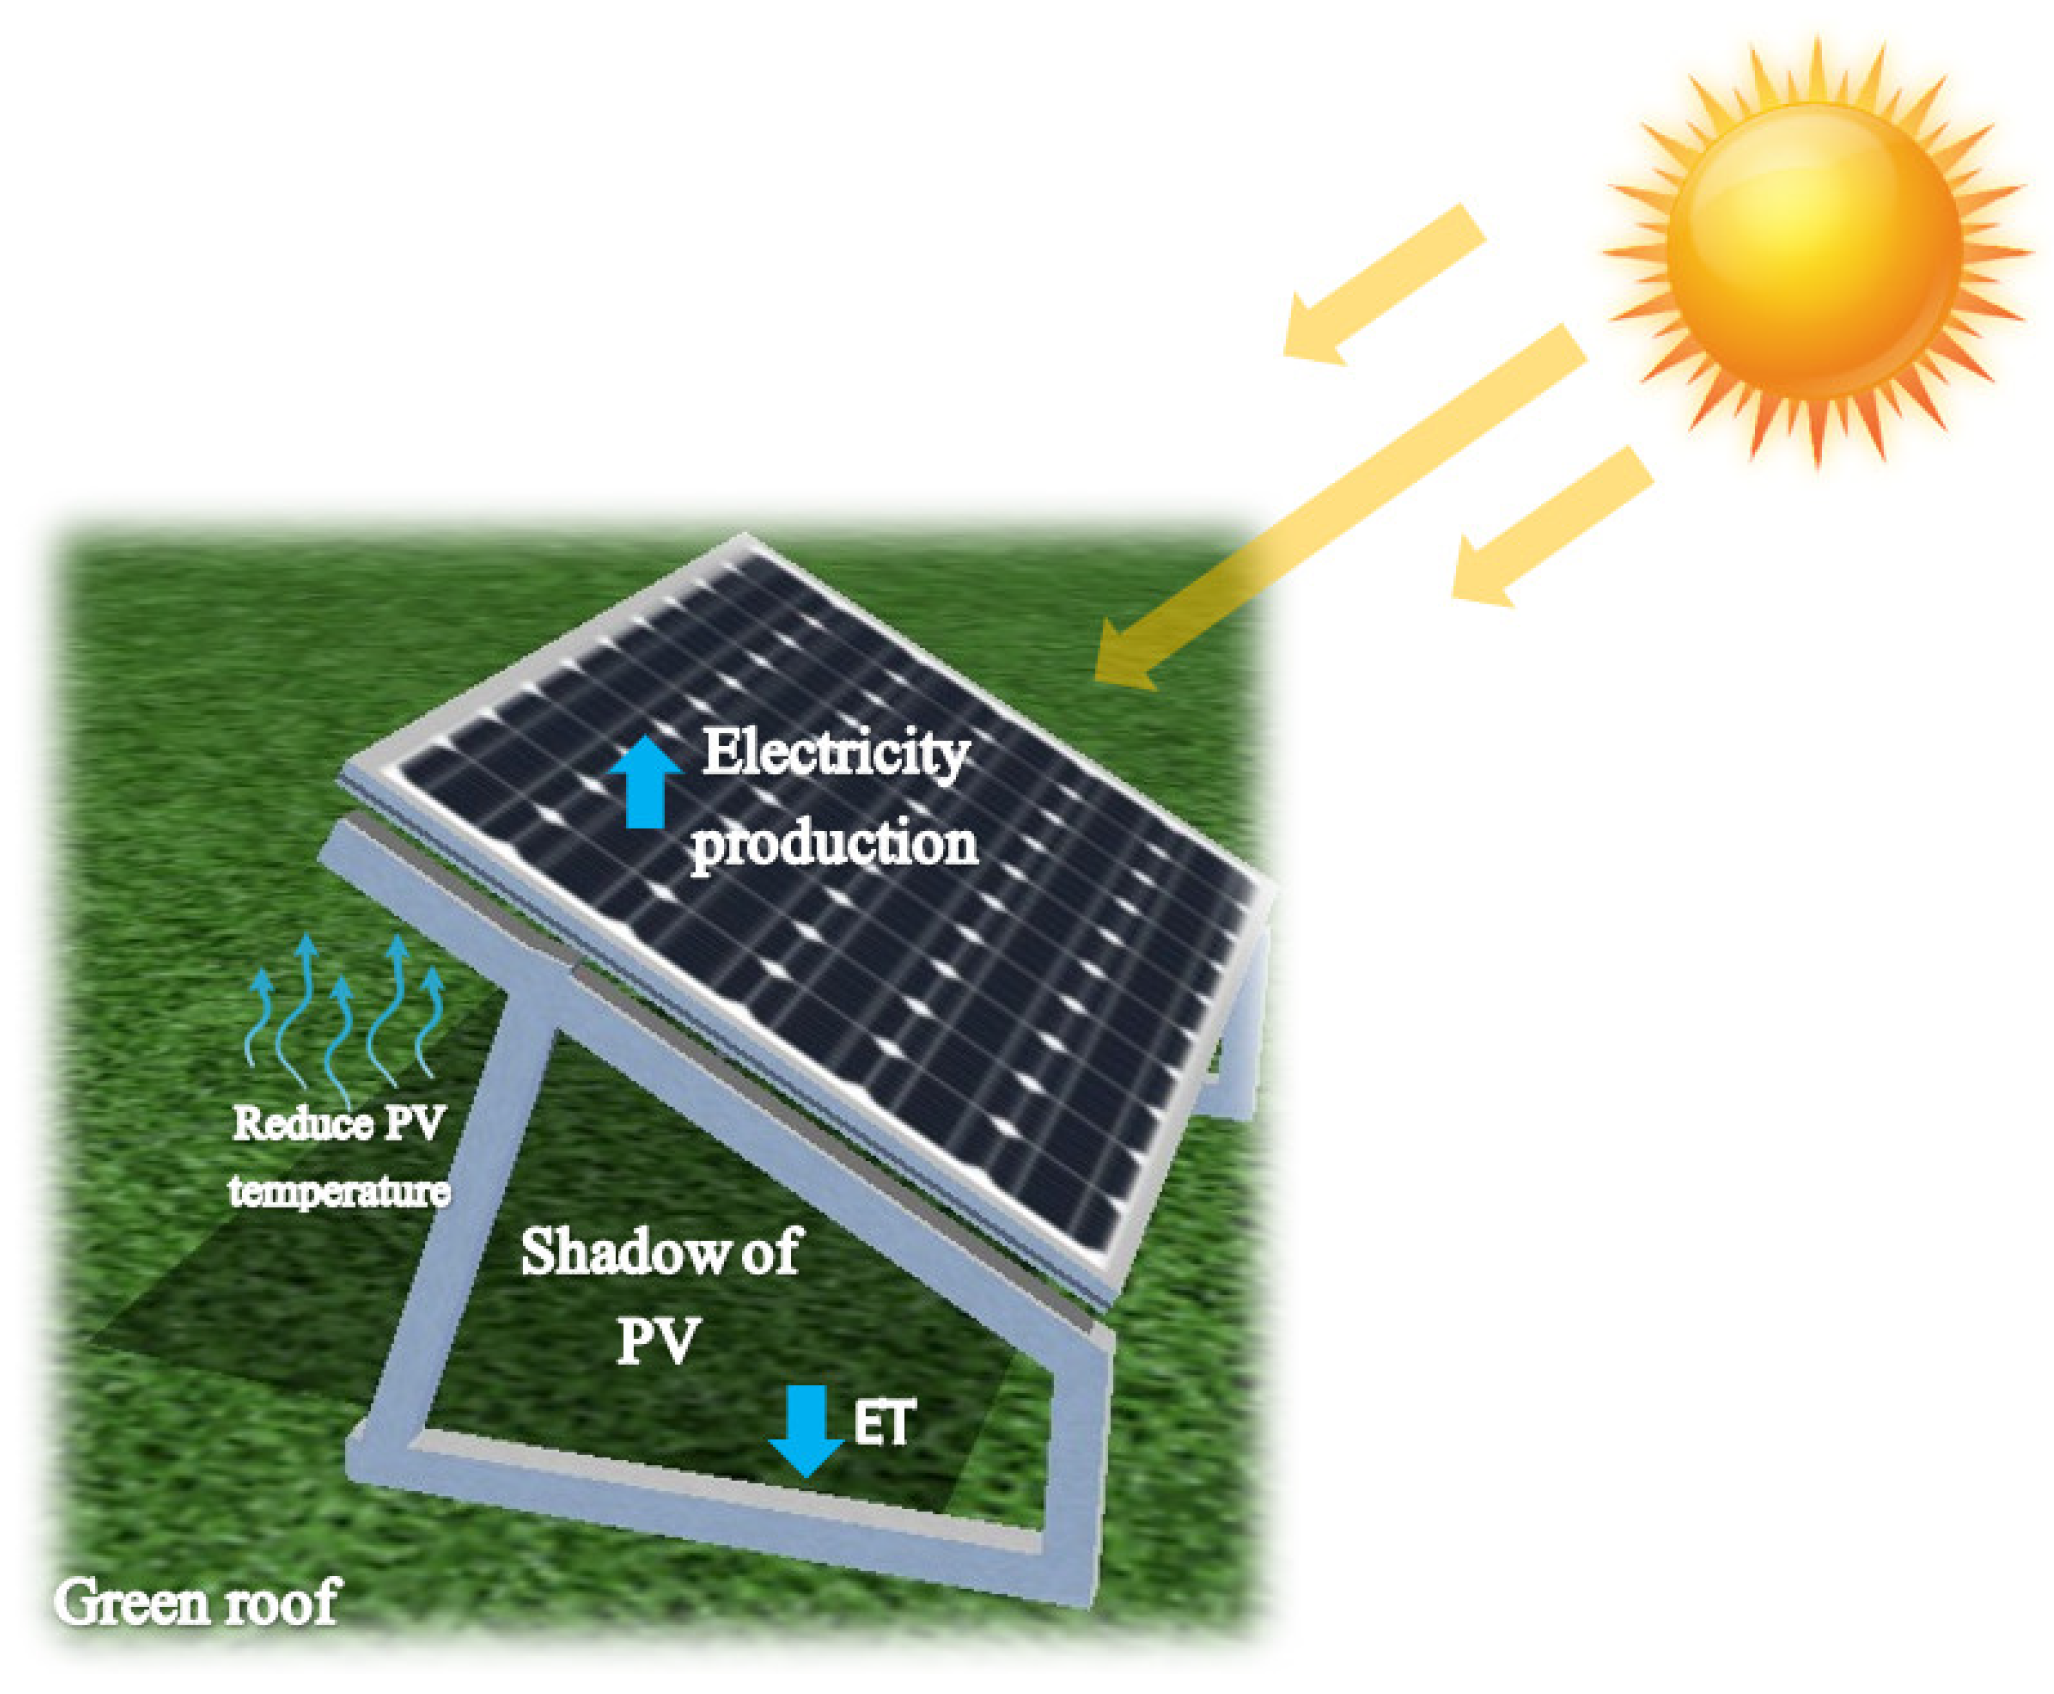
1.2. Efficiency of Solar Panels in Conventional and Bio-Solar Systems
- Active cooling techniques, including active air, water, nanofluids, and thermoelectric cooling, can enhance efficiency by around 3.0–36.0%;
- Passive cooling techniques such as passive air, water, phase-change material, radiative, and hybrid cooling can enhance efficiency by 1.6–19.0%.
2. Materials and Methods
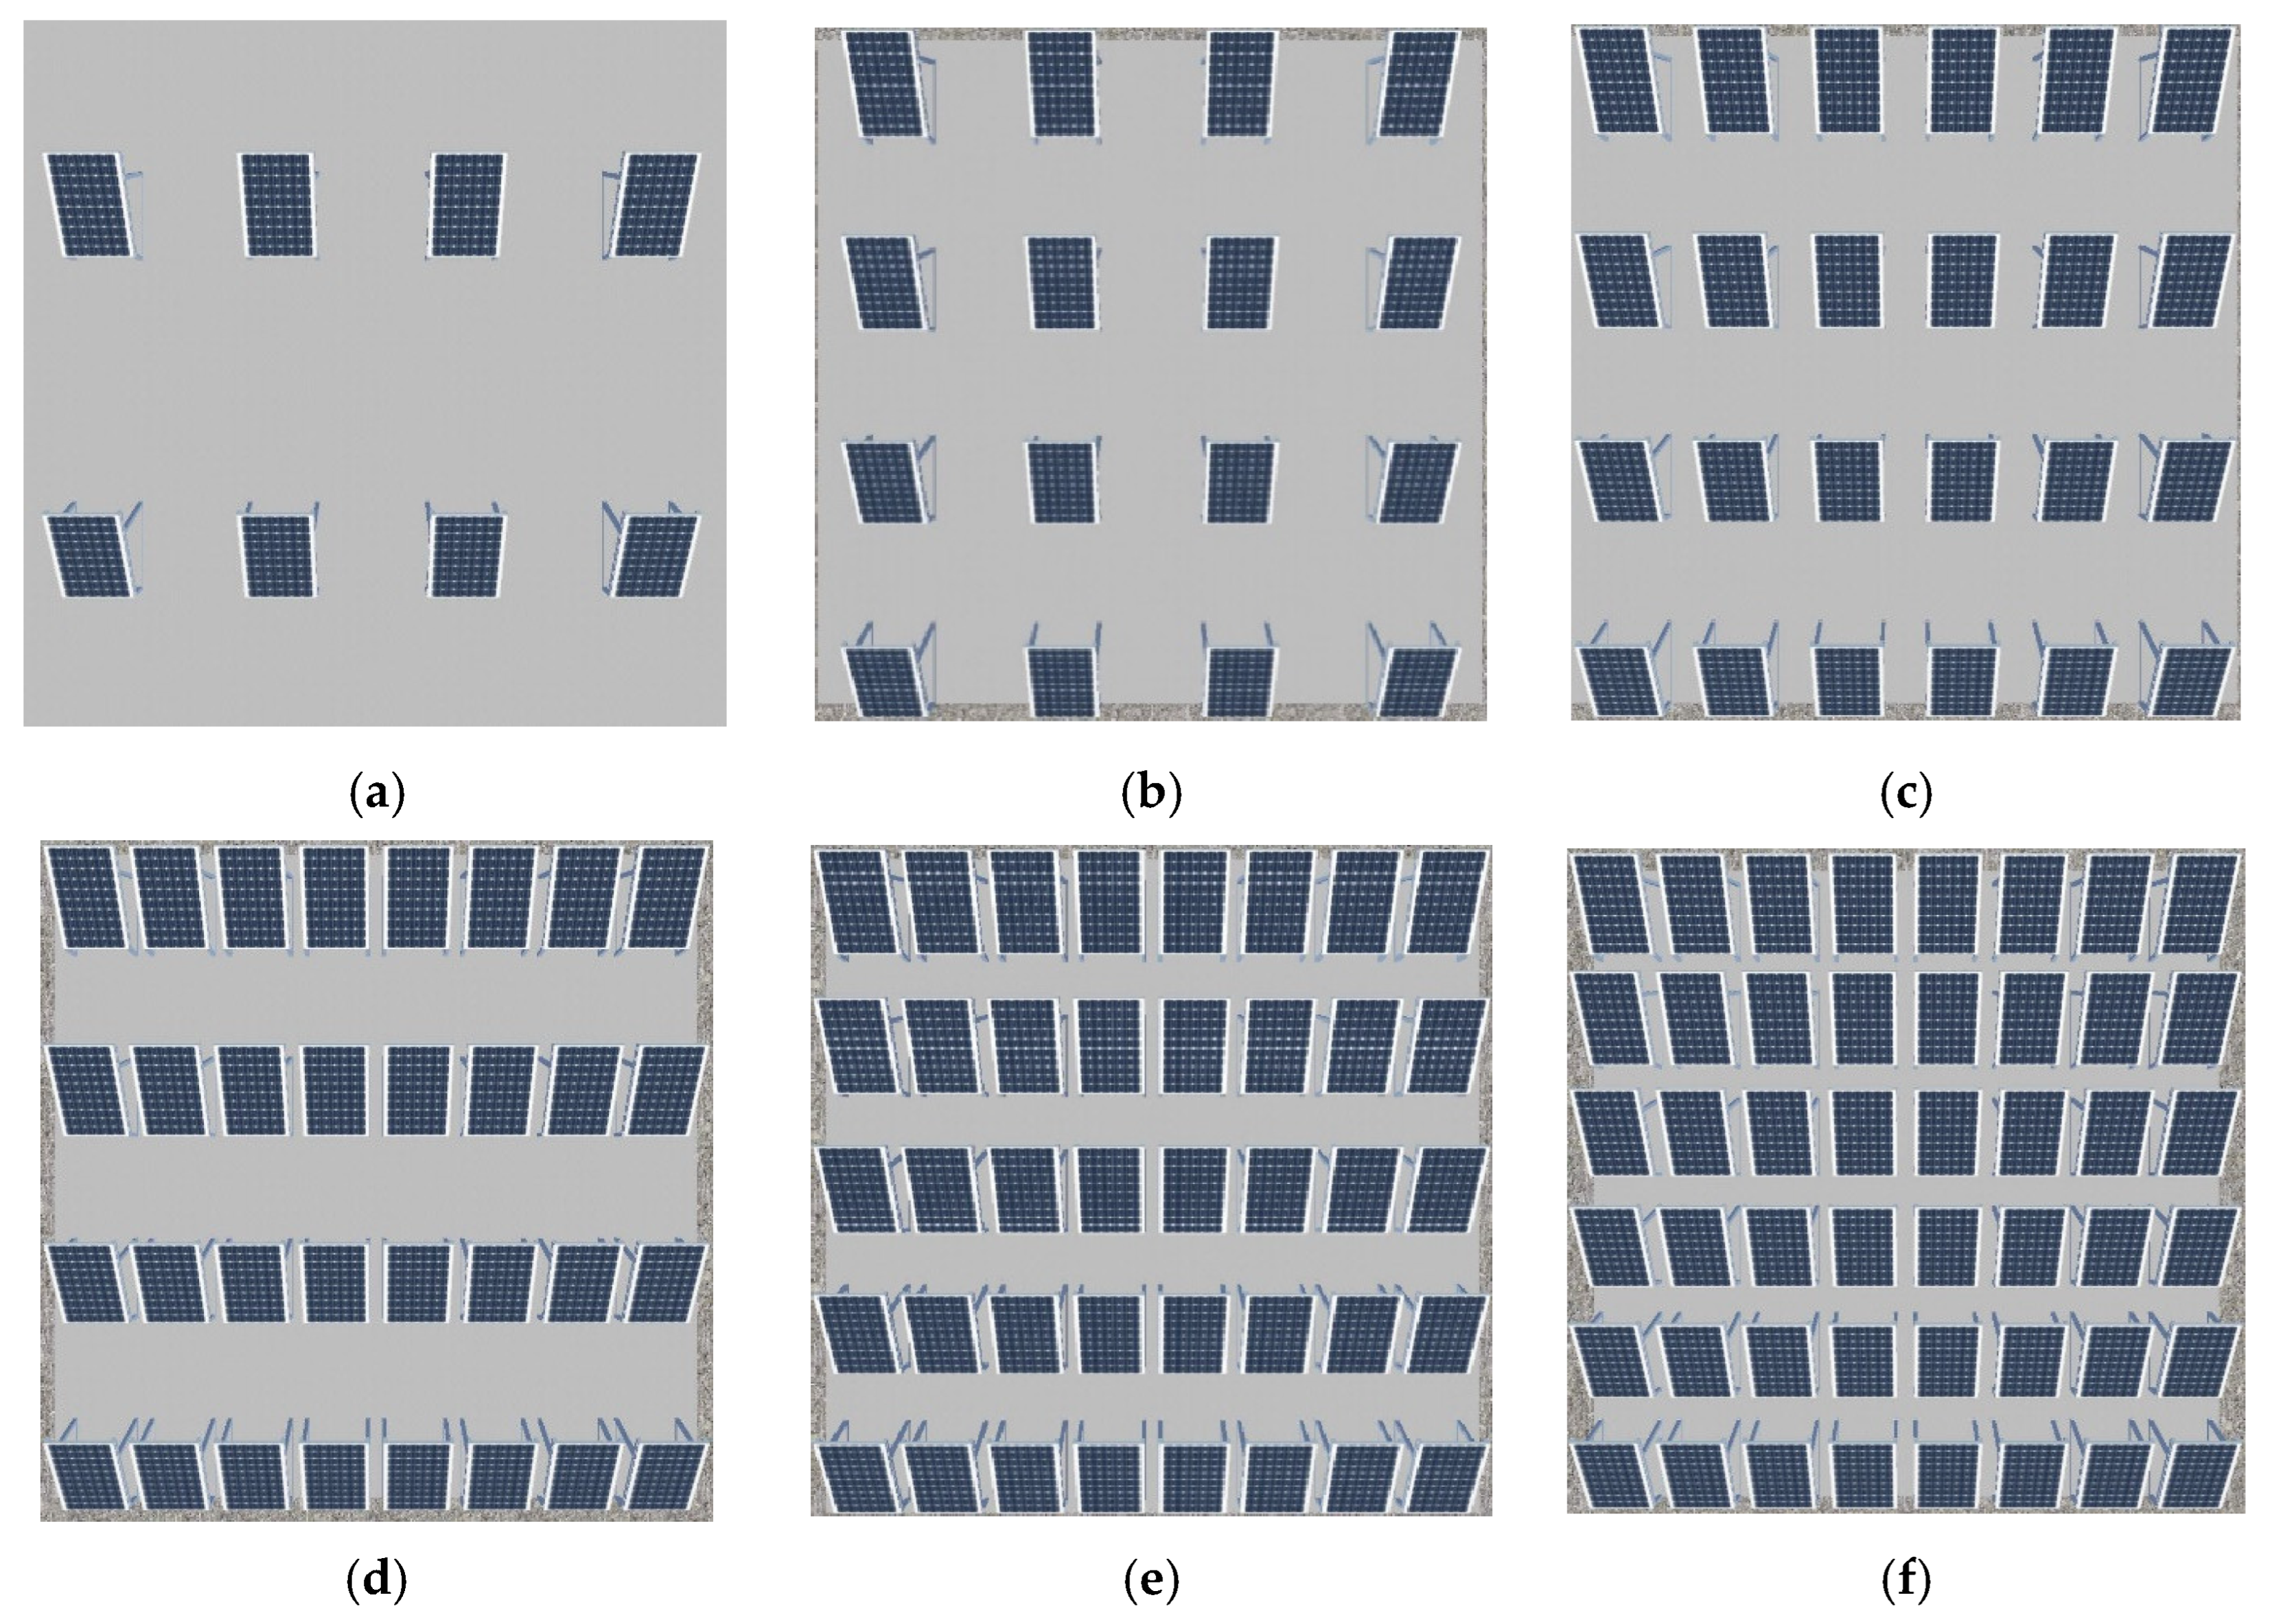
- Step 1 (case study parameters’ definition): Determine bio-solar green roof configurations, such as the coverage of the solar panels on the roof area, which in the current study, included 10%, 20%, 30%, 40%, 50%, and 60%. In addition, select the types of PV panels, which in our study, were the following four: polycrystalline, monocrystalline, PERC, and bifacial. Finally, select the roof type, as the reflection of solar radiation from roofs (albedo) toward solar panels depends on it; in the current study, we considered two types of roofs, and the corresponding albedos were 20% for conventional roofs and 60% for green roofs;
- Step 2 (PV power computation): Perform power output calculation for the selected (in step 1) types and percentages of solar panels on the conventional and green roofs in PVSOL 2024 R3/PVGIS 5.3 software. For this purpose, PVGIS can be applied to have the optimum inclination (tilt) of the PV panels in the case study location, which in this study, for the city of Cosenza, is equal to 33°. Moreover, since the radiation depends not only on the location of the case study but also on weather conditions (i.e., cloudy and rainy conditions), and to have an accurate calculation, MeteoNorm 8.2 software can be applied to provide the hourly climate data. In the last stage, PVSOL 2024 R3 software can be used (with the optimum inclination by PVGIS 5.3 and climate data by MeteoNorm 8.2) for separate calculation of the power output for four types of PV panels, six types of percentages, and two types of albedos, meaning 48 simulations. At the end of this stage, the power production by PV modules for all conditions can be determined;
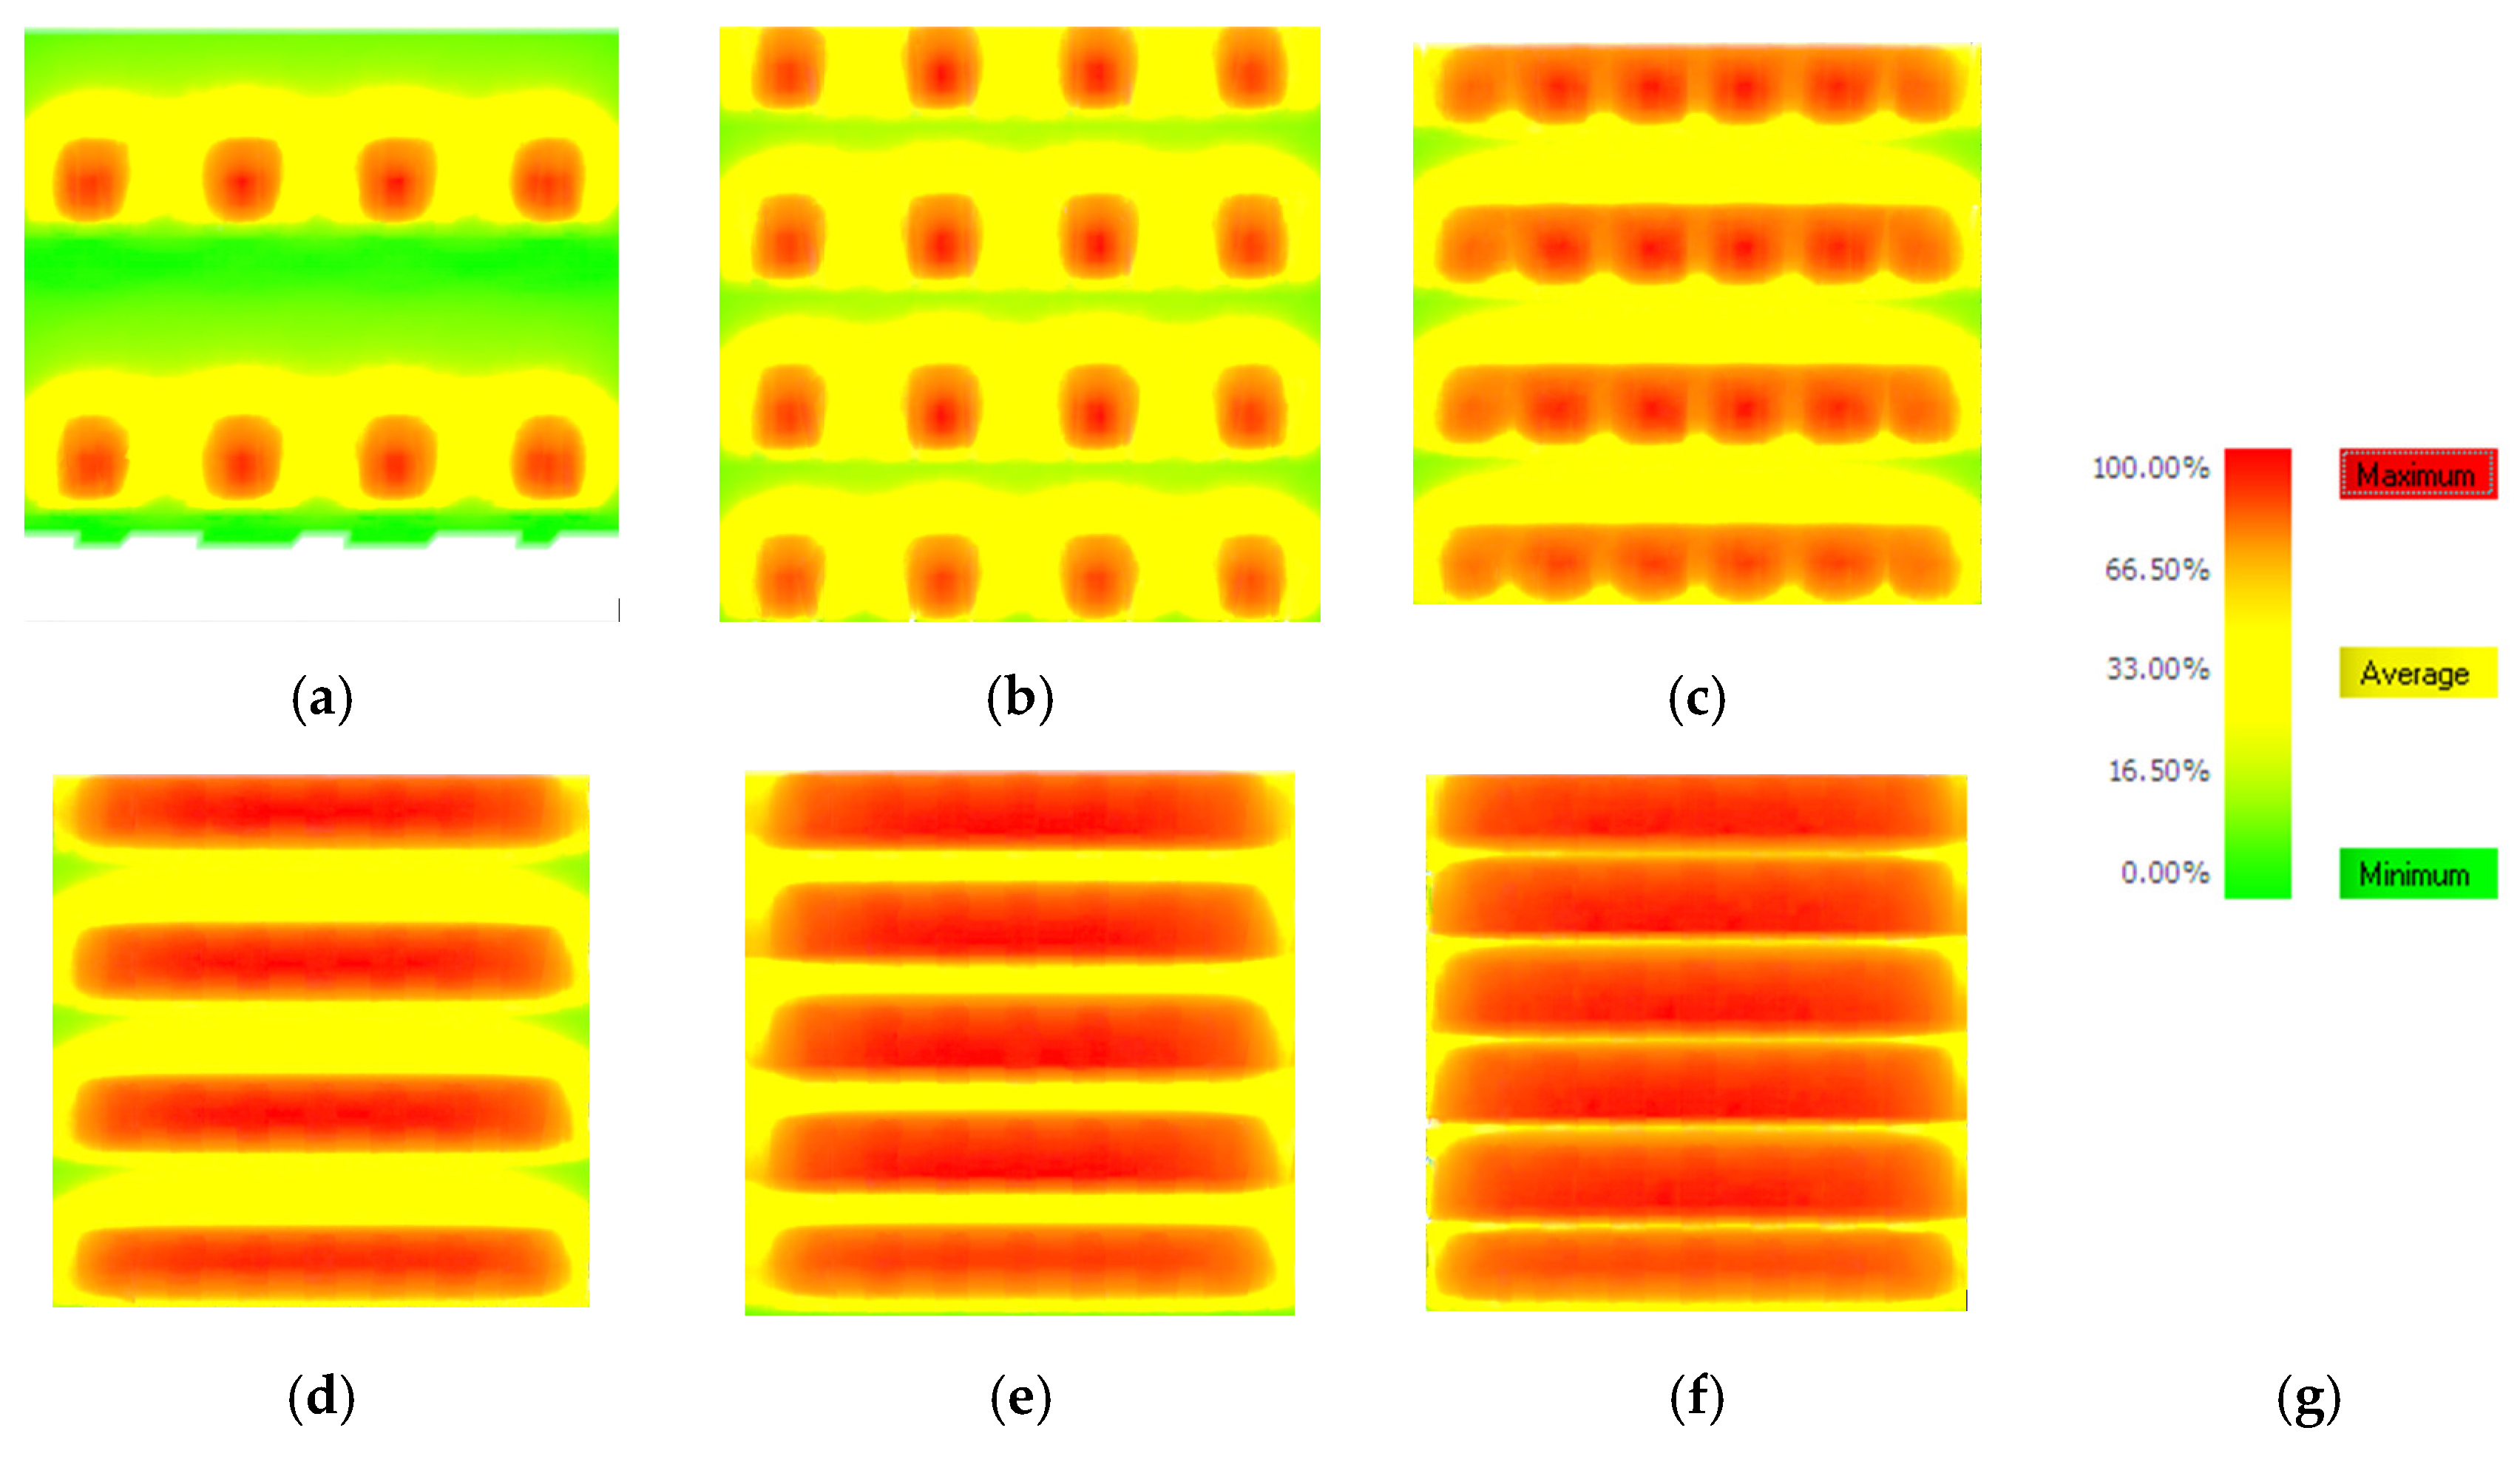
- Step 3 (shade frequency pattern of PV panels on the roof surface): Analyze the shadow frequency of PV panels on the roof, which is a geographic parameter and depends on the location (Cosenza in our case study), weather conditions (calculated in step 2 using MeteoNorm 8.2), the installation inclination of PV panels (determined in step 2 using PVGIS 5.3; in our case study, equal to 33°), and configuration of PV modules on the roof surface (10% to 60% in our study), which can be simulated by PVSOL 2024 R3. For this purpose, PVSOL 2024 R3 estimates the shape of the PV module shadow on the roof for all solar hours in a year and provides shade frequency images. The produced images can show the shade condition in four colors: white (meaning area with % shade), green (meaning near zero % shade), yellow (meaning 33% of the time is shade), and red (meaning 100% of the time is shade);
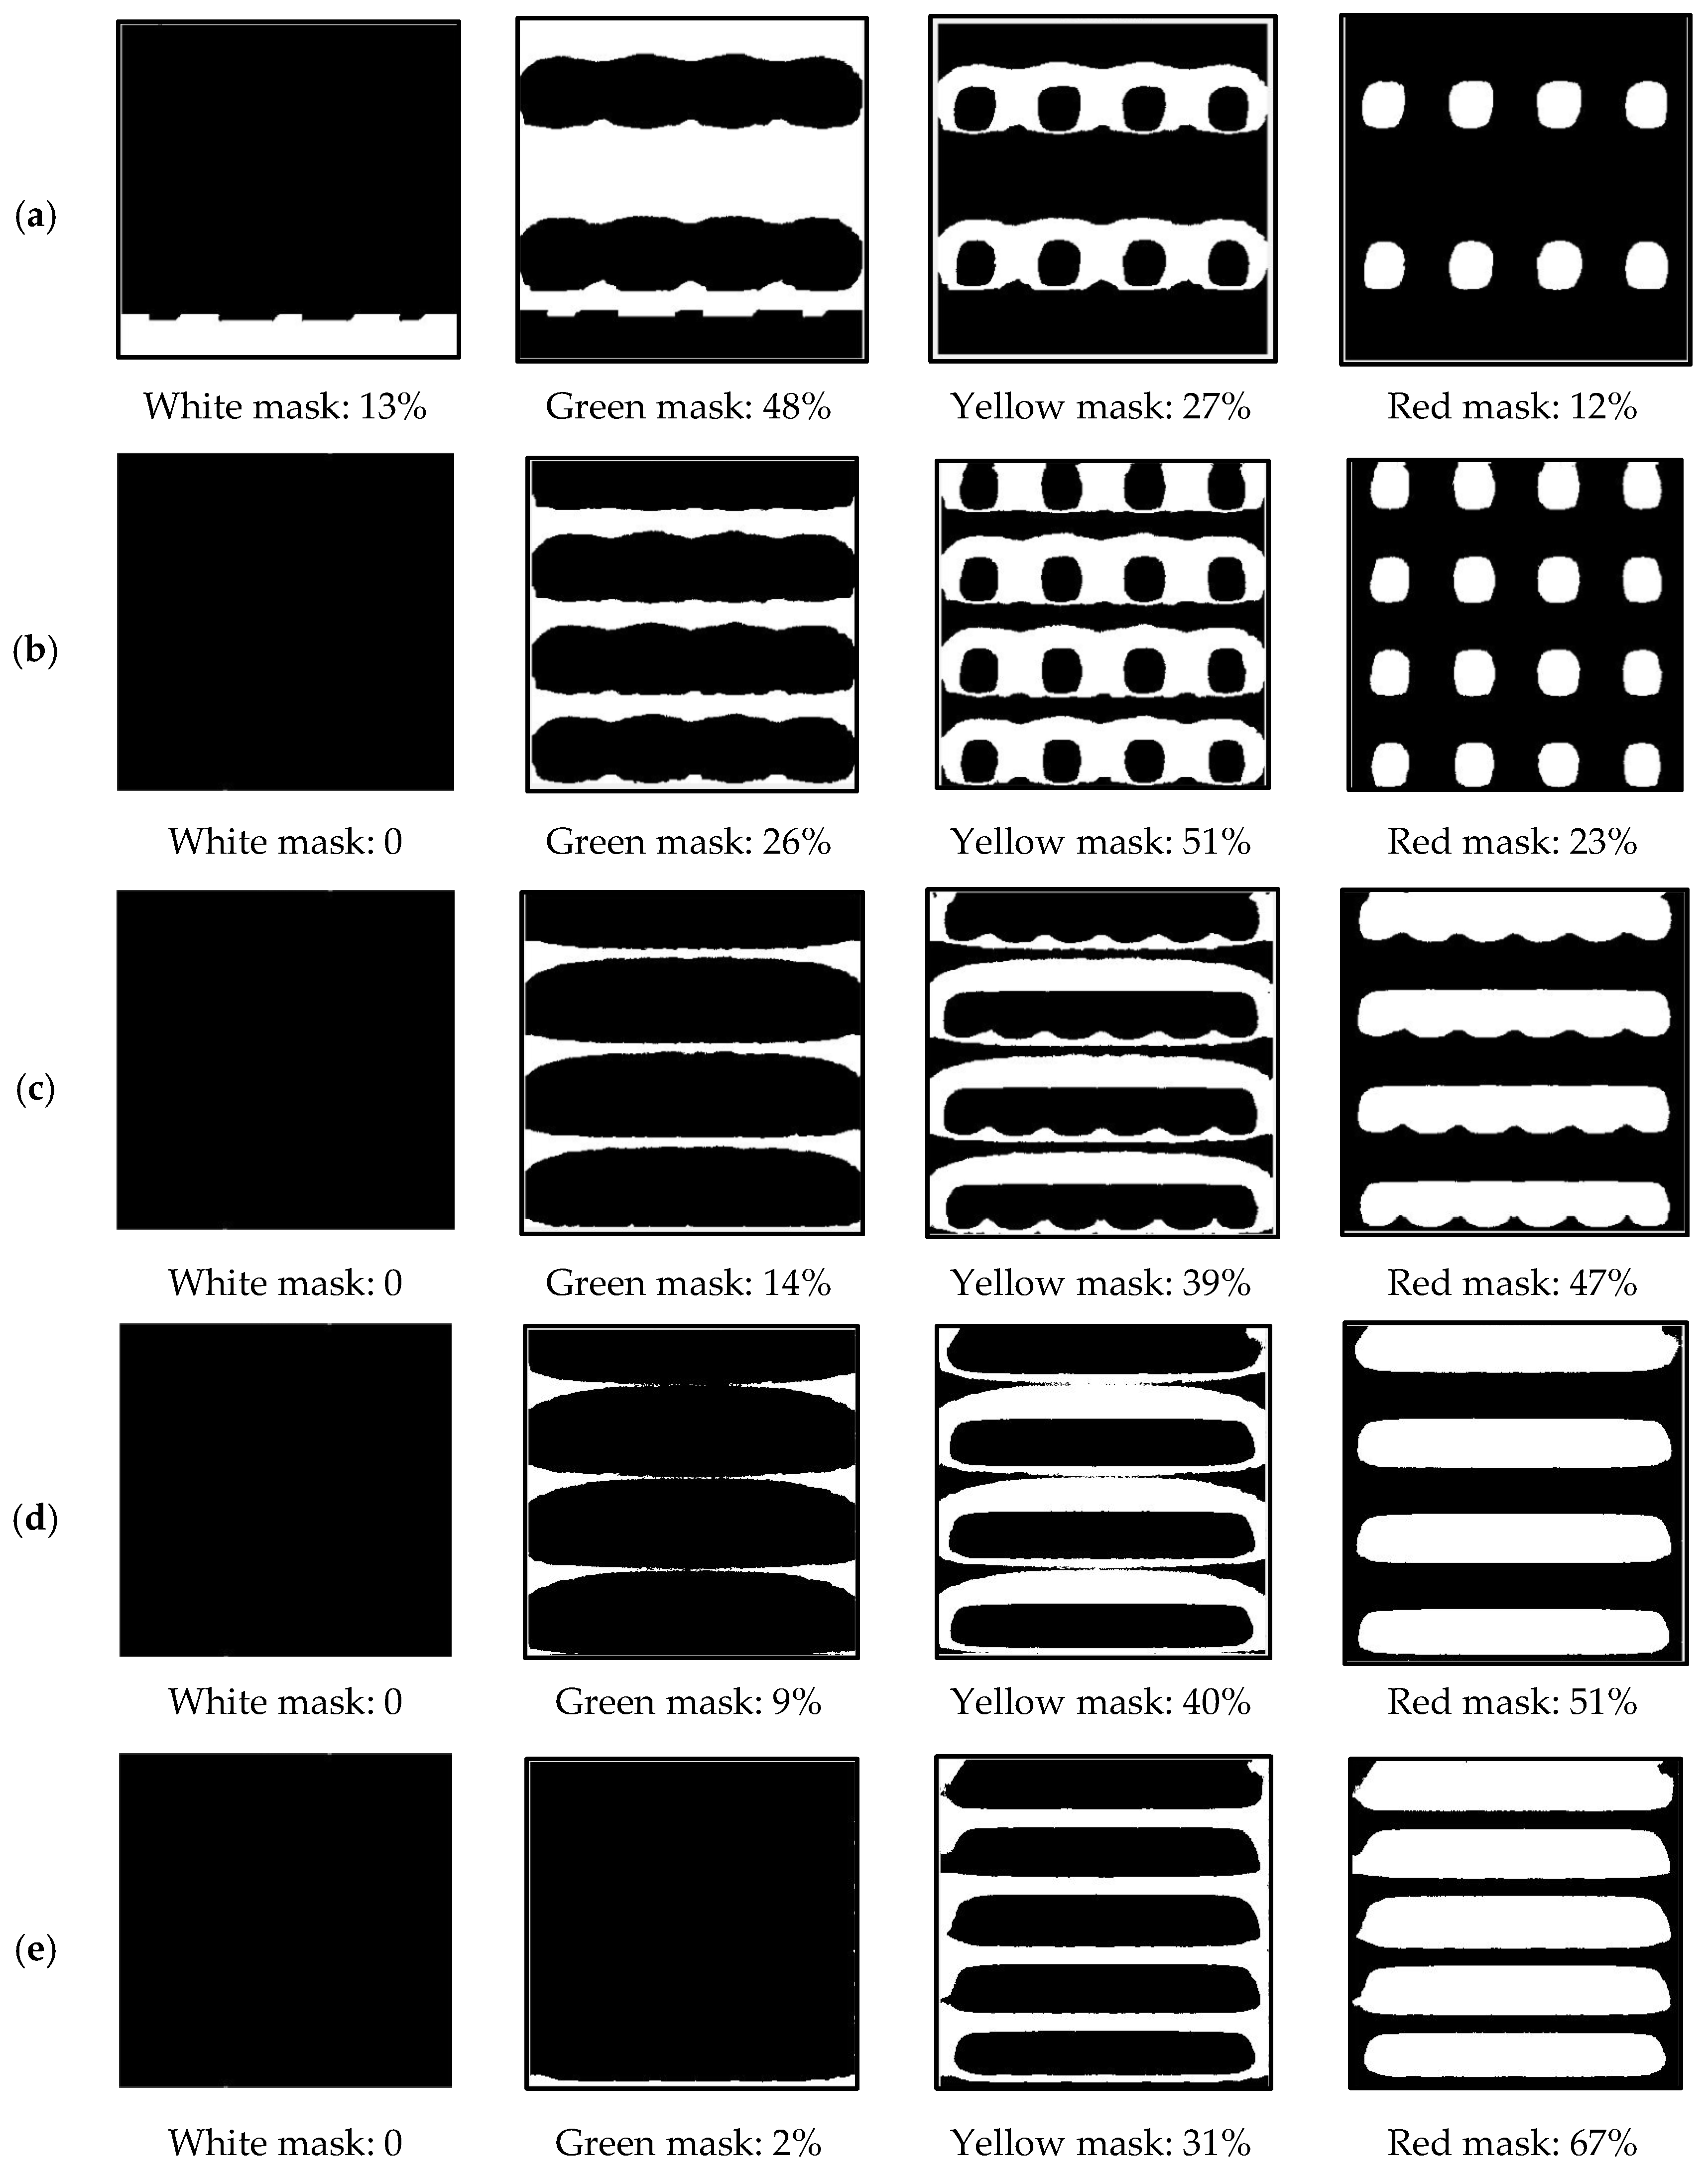
- Step 4 (percentages of shade by PV on the roof): Determine the amount (percentage) of zero shade area or full shade area, for which image processing of the provided images by PVSOL 2024 R3 is required. For this purpose, we developed a code in MATLAB R2024b (Appendix A), which can determine the percentages of four colors (white, green, yellow, and red) in an image by applying different color masks. In that regard, in this stage, the images of step 3 are analyzed using image processing, and the results provide the numerical quantity of the full shadow, 33%, as well as those for the near 0% shadow and 0% shadow due to the PV modules on a roof;
- Step 5: Prepare the database for the Vensim PLE 10.2.1 model:
- (a)
- Providing the PV power production amounts for different configurations: for four types, six patterns, and two types of roofs, as calculated in step 2 by PVSOL 2024 R3;
- (b)
- Providing the increase in the efficiency with a decrease in surface temperature due to the installation of PVs on green roofs based on data presented in Table 2;
- (c)
- Providing the maximum and minimum efficiency of each type of solar panel based on the data in Table 3. In this way, the PV power production will not be limited to the selected modules in PVSOL 2024 R3 (in our cases, four types of panels with specific efficiency);
- (d)
- Arranging the data about water consumption of conventional green roofs in different climates, which are available in Table 4, and in cases where data are not available, applying Equation (3);
- (e)
- Providing the data about the water consumption decline of green roofs due to shadow, which are available in Table 1;
- (f)
- Providing the amount (percentage) of shade on the roof in each pattern of PV modules, according to the results of step 4.
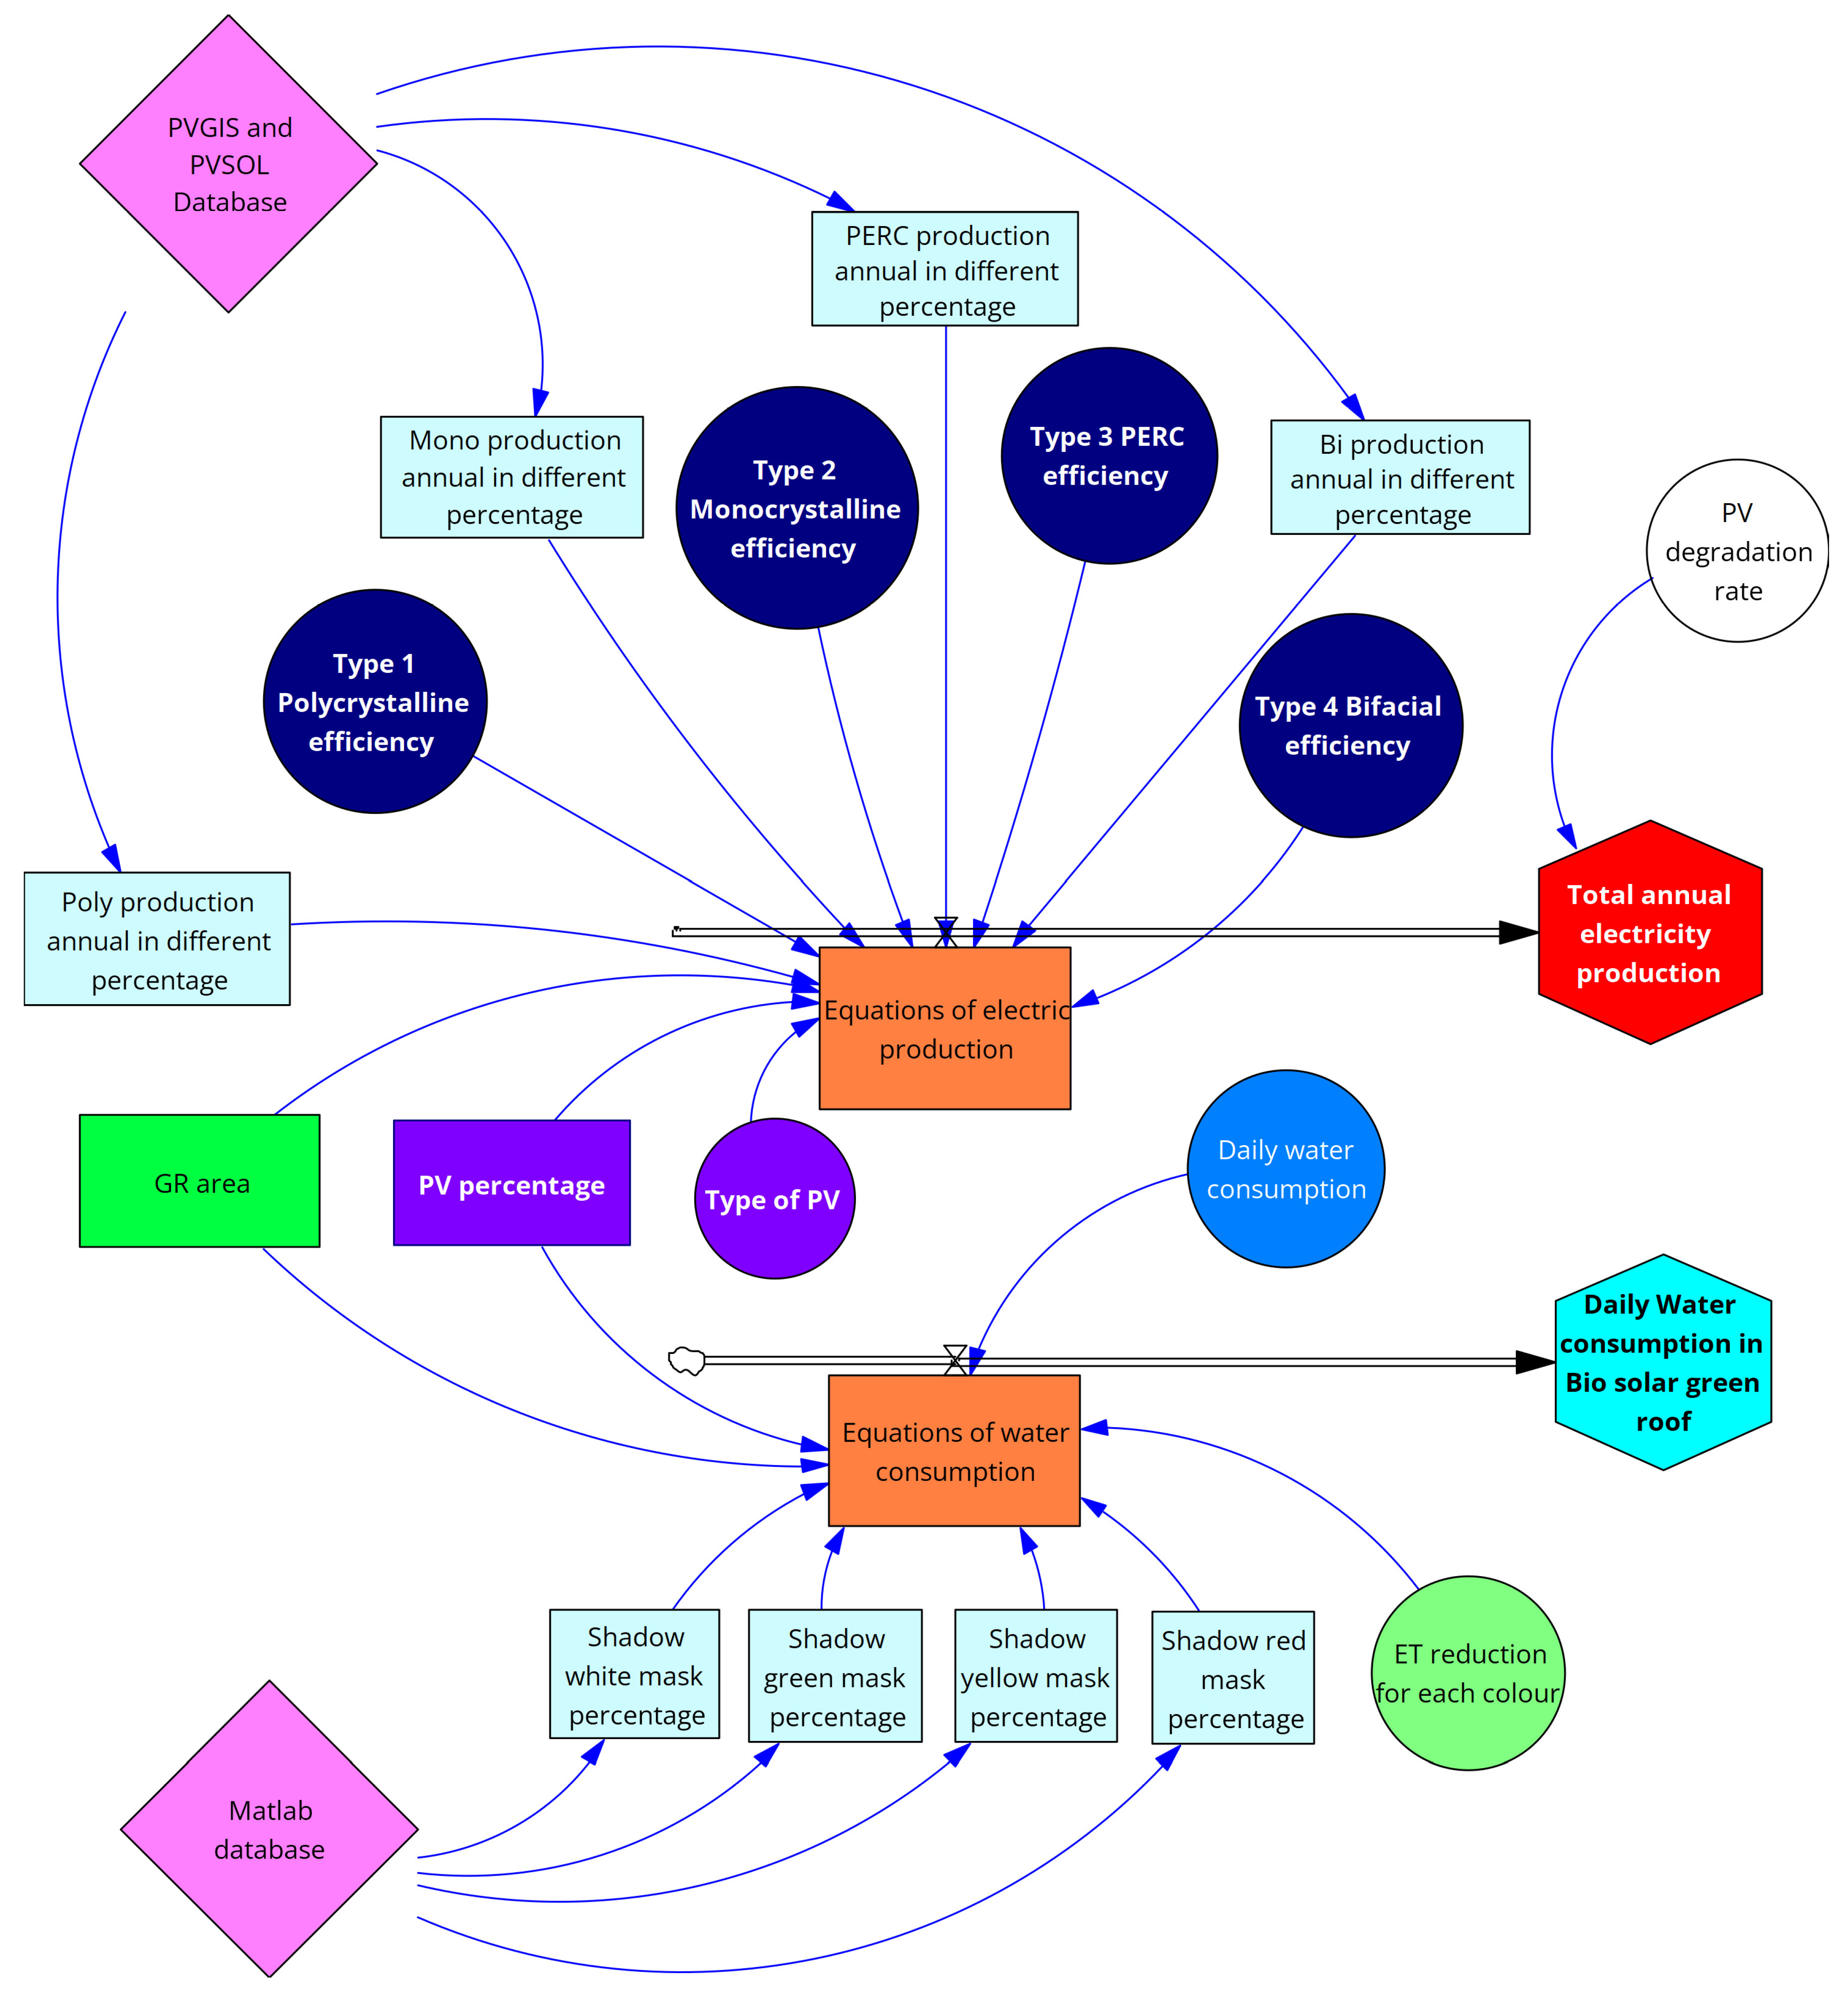
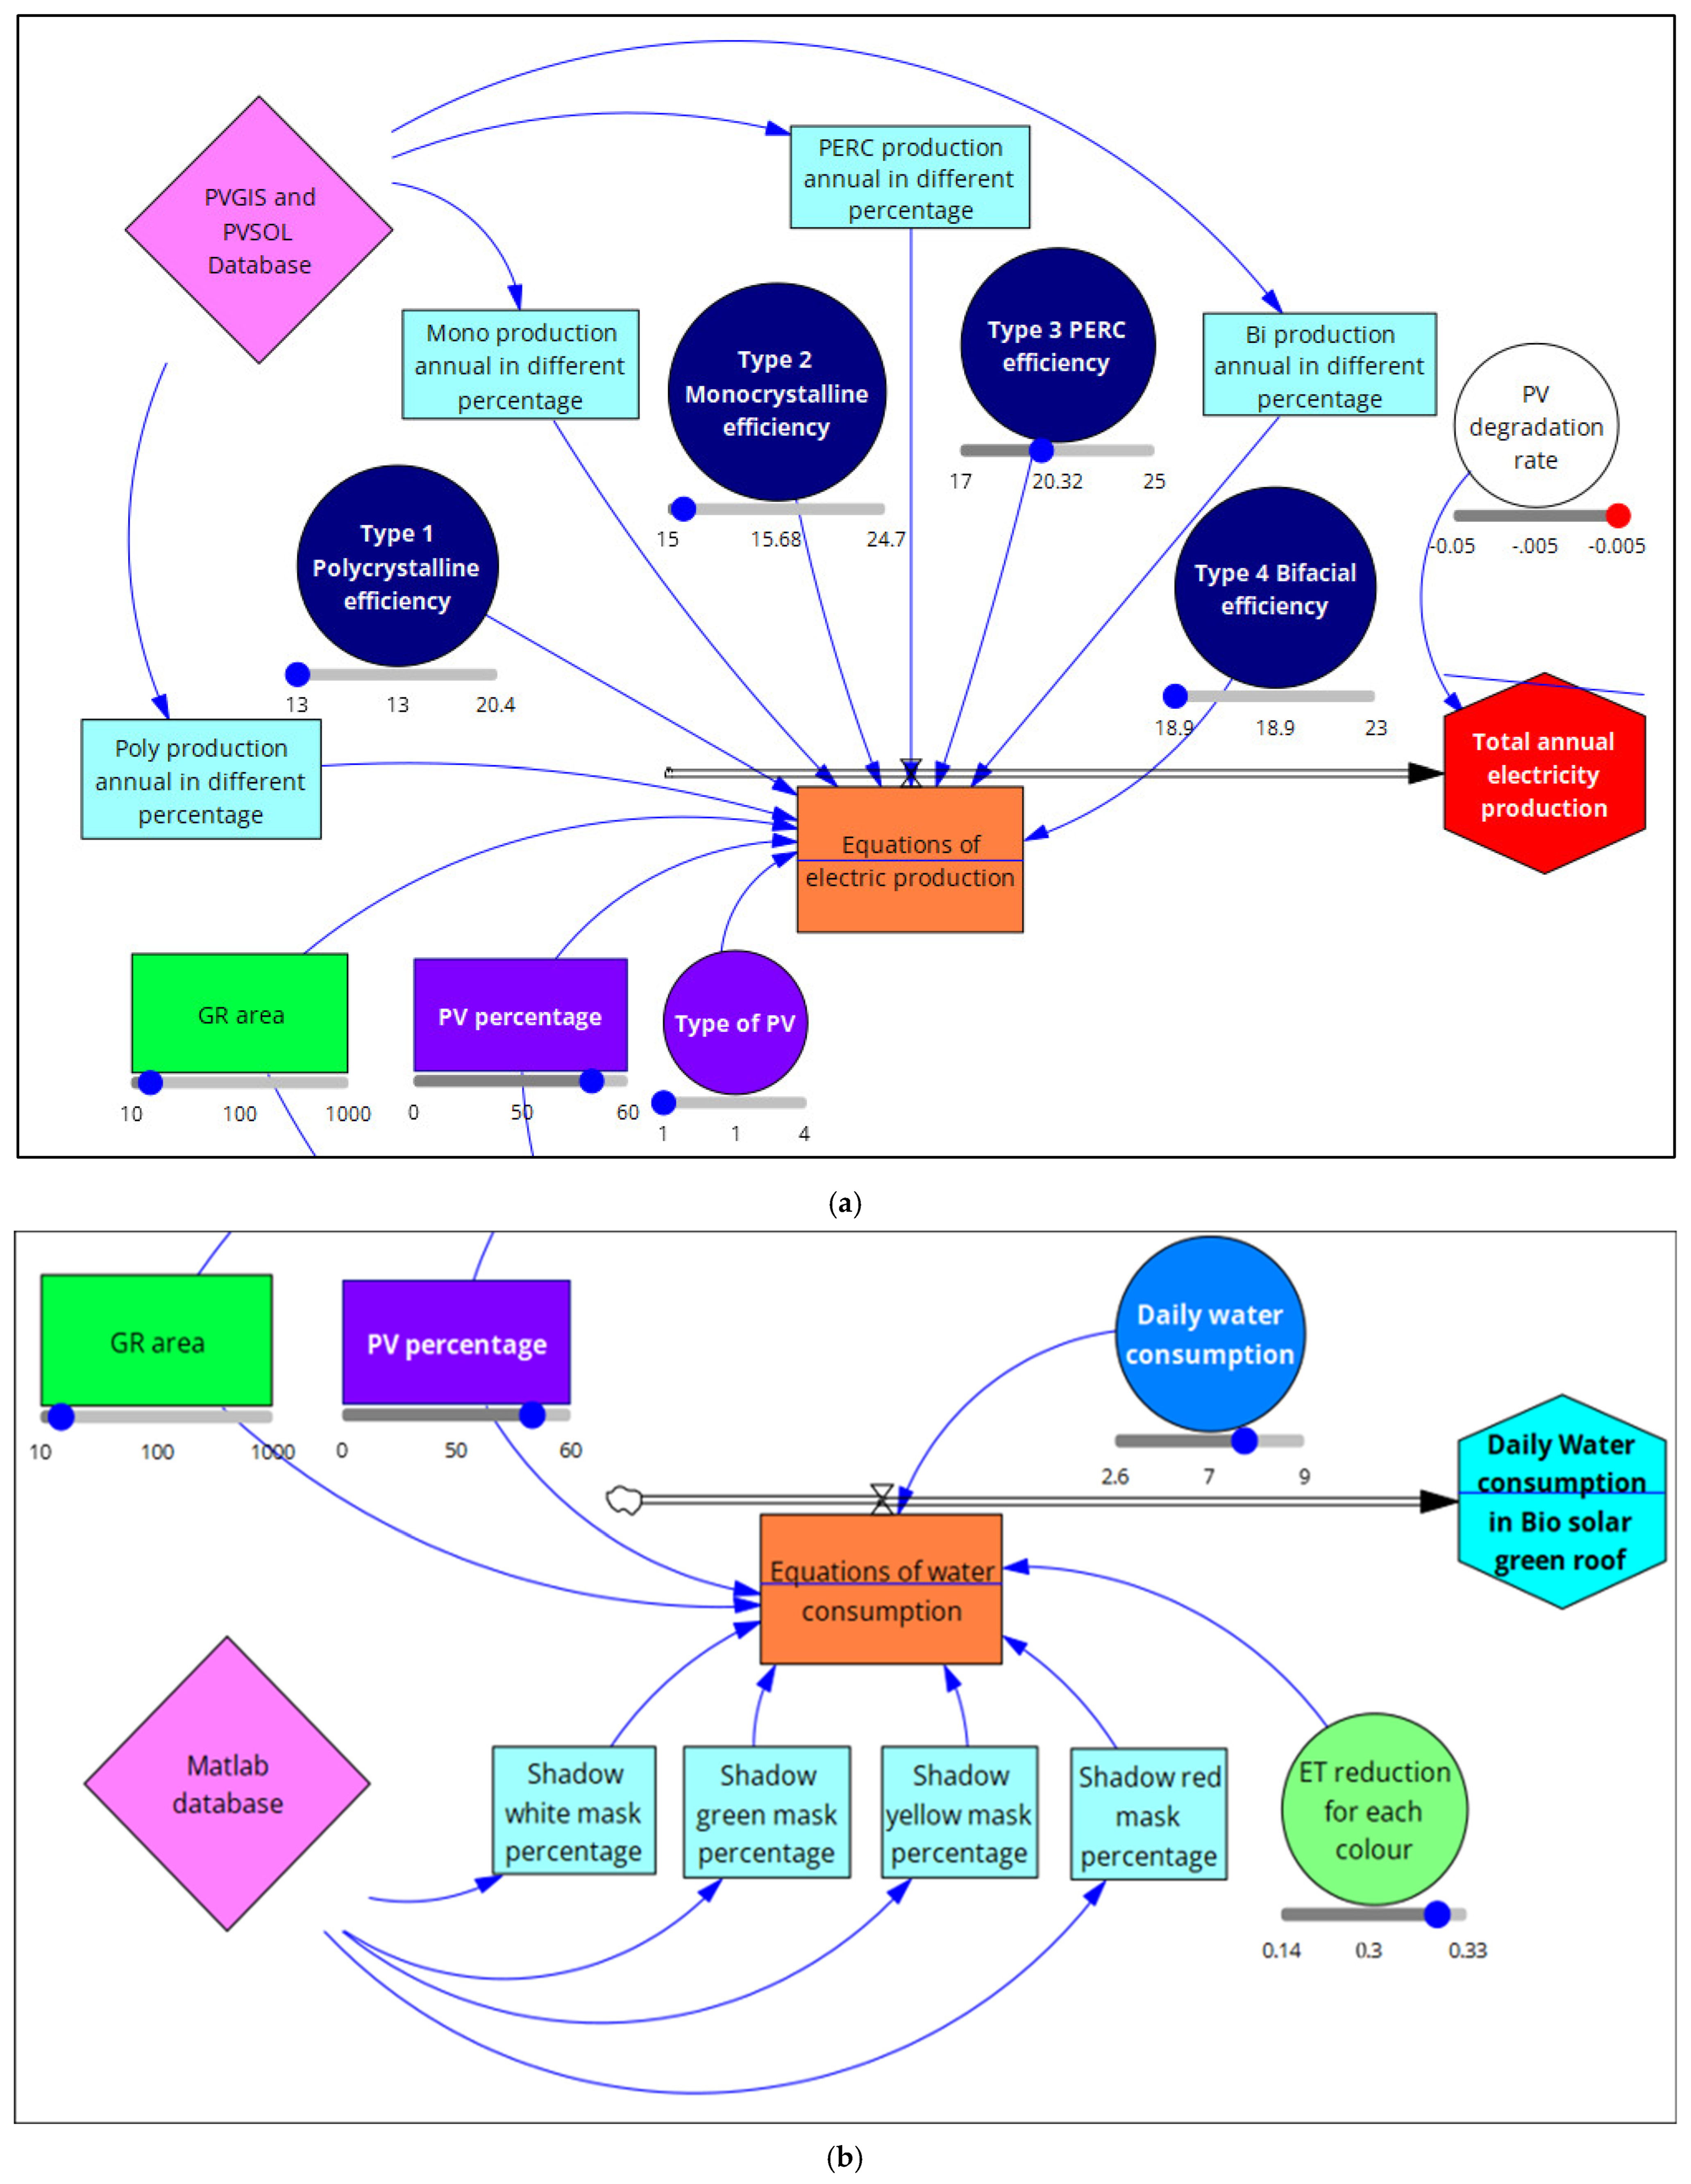
- Step 6 (generalizing the results by developing a dynamic model): In this stage, the databanks in step 5 can be used to provide a dynamic analysis model in Vensim PLE 10.2.1 software. The input of the Vensim PLE 10.2.1 can be single data, tables, or graphs. For example, it can be the minimum or maximum efficiency of polycrystalline modules or green roofs’ water consumption in different climates. Therefore, in this stage and for our case study, according to the results of PV production (by 48 simulations in PVSOL 2024 R3), the data can be added based on the type of module, type of roof, percentage of the PV on the roof, etc. The same can be performed for water consumption by green roofs in the Mediterranean climate, for the decline in water demand (ET reduction for each color of shadow provided by PVSOL 2024 R3, and amounts based on percentages of the roof area in MATLAB R2024b) with a full shadow and 33% shadow;
- Step 7: Analyze water and energy interactions in bio-solar green roofs with the developed dynamic model in Vensim PLE 10.2.1. In this step, instead of calculating each state separately (new simulations based on the type of PV, percentage of PV, size of roof, type of roof, etc.), different scenarios can be easily evaluated with a single run in Vensim PLE 10.2.1 software. For this purpose, just the boundary conditions (roof area, PV type, PV efficiency, and percentage of PV to the roof area) need to be selected, and the model can provide the impact of a conventional roof or green roof on the power production of a type of PV module with specific efficiency dynamically. The same goes for water demands and by choosing the roof area—the percentage of PV panels on the roof to the roof area—the shadow impact will be considered, and the model will provide the water consumption levels of conventional (0% PV module) and bio-solar green roofs.
2.1. Bio-Solar Green Roof Configurations and Analysis Procedures
- The determination of irradiance on the module surface is based on the tilt and orientation of the PV array, diffuse and direct radiation from weather data, shading effects from obstacles from 3D analysis, and reflection losses due to the module surface.
- Calculating the temperature effect on the PV module efficiency in PVSOL 2024 R3 is based on Equation (1).
- Calculate the power output at the maximum power point (MPP) operating condition, which is the highest possible power output of PV panels under given conditions. The MPP power output is calculated based on the solar irradiance and module’s efficiency using Equation (2).
- Deduct the losses from the efficiency of the modules due to the deviation from the standard spectrum AM1.5 (standard test conditions: 1000 W/m2 vertical radiation, 25 °C module temperature, and radiation spectrum), mismatch or reduced yield as a result of deviation from manufacturer information, and losses in diodes. The mentioned losses are deducted percentages from the module output in PVSOL 2024 R3.
2.2. Study Limitations and Potential Weaknesses
- The impact of the green roof type and irrigation technique is not taken into account;
- This study does not consider the type of plant and age of the green roof;
- The hodological performance of BS-GRs is not investigated in this study.
3. Results and Discussion
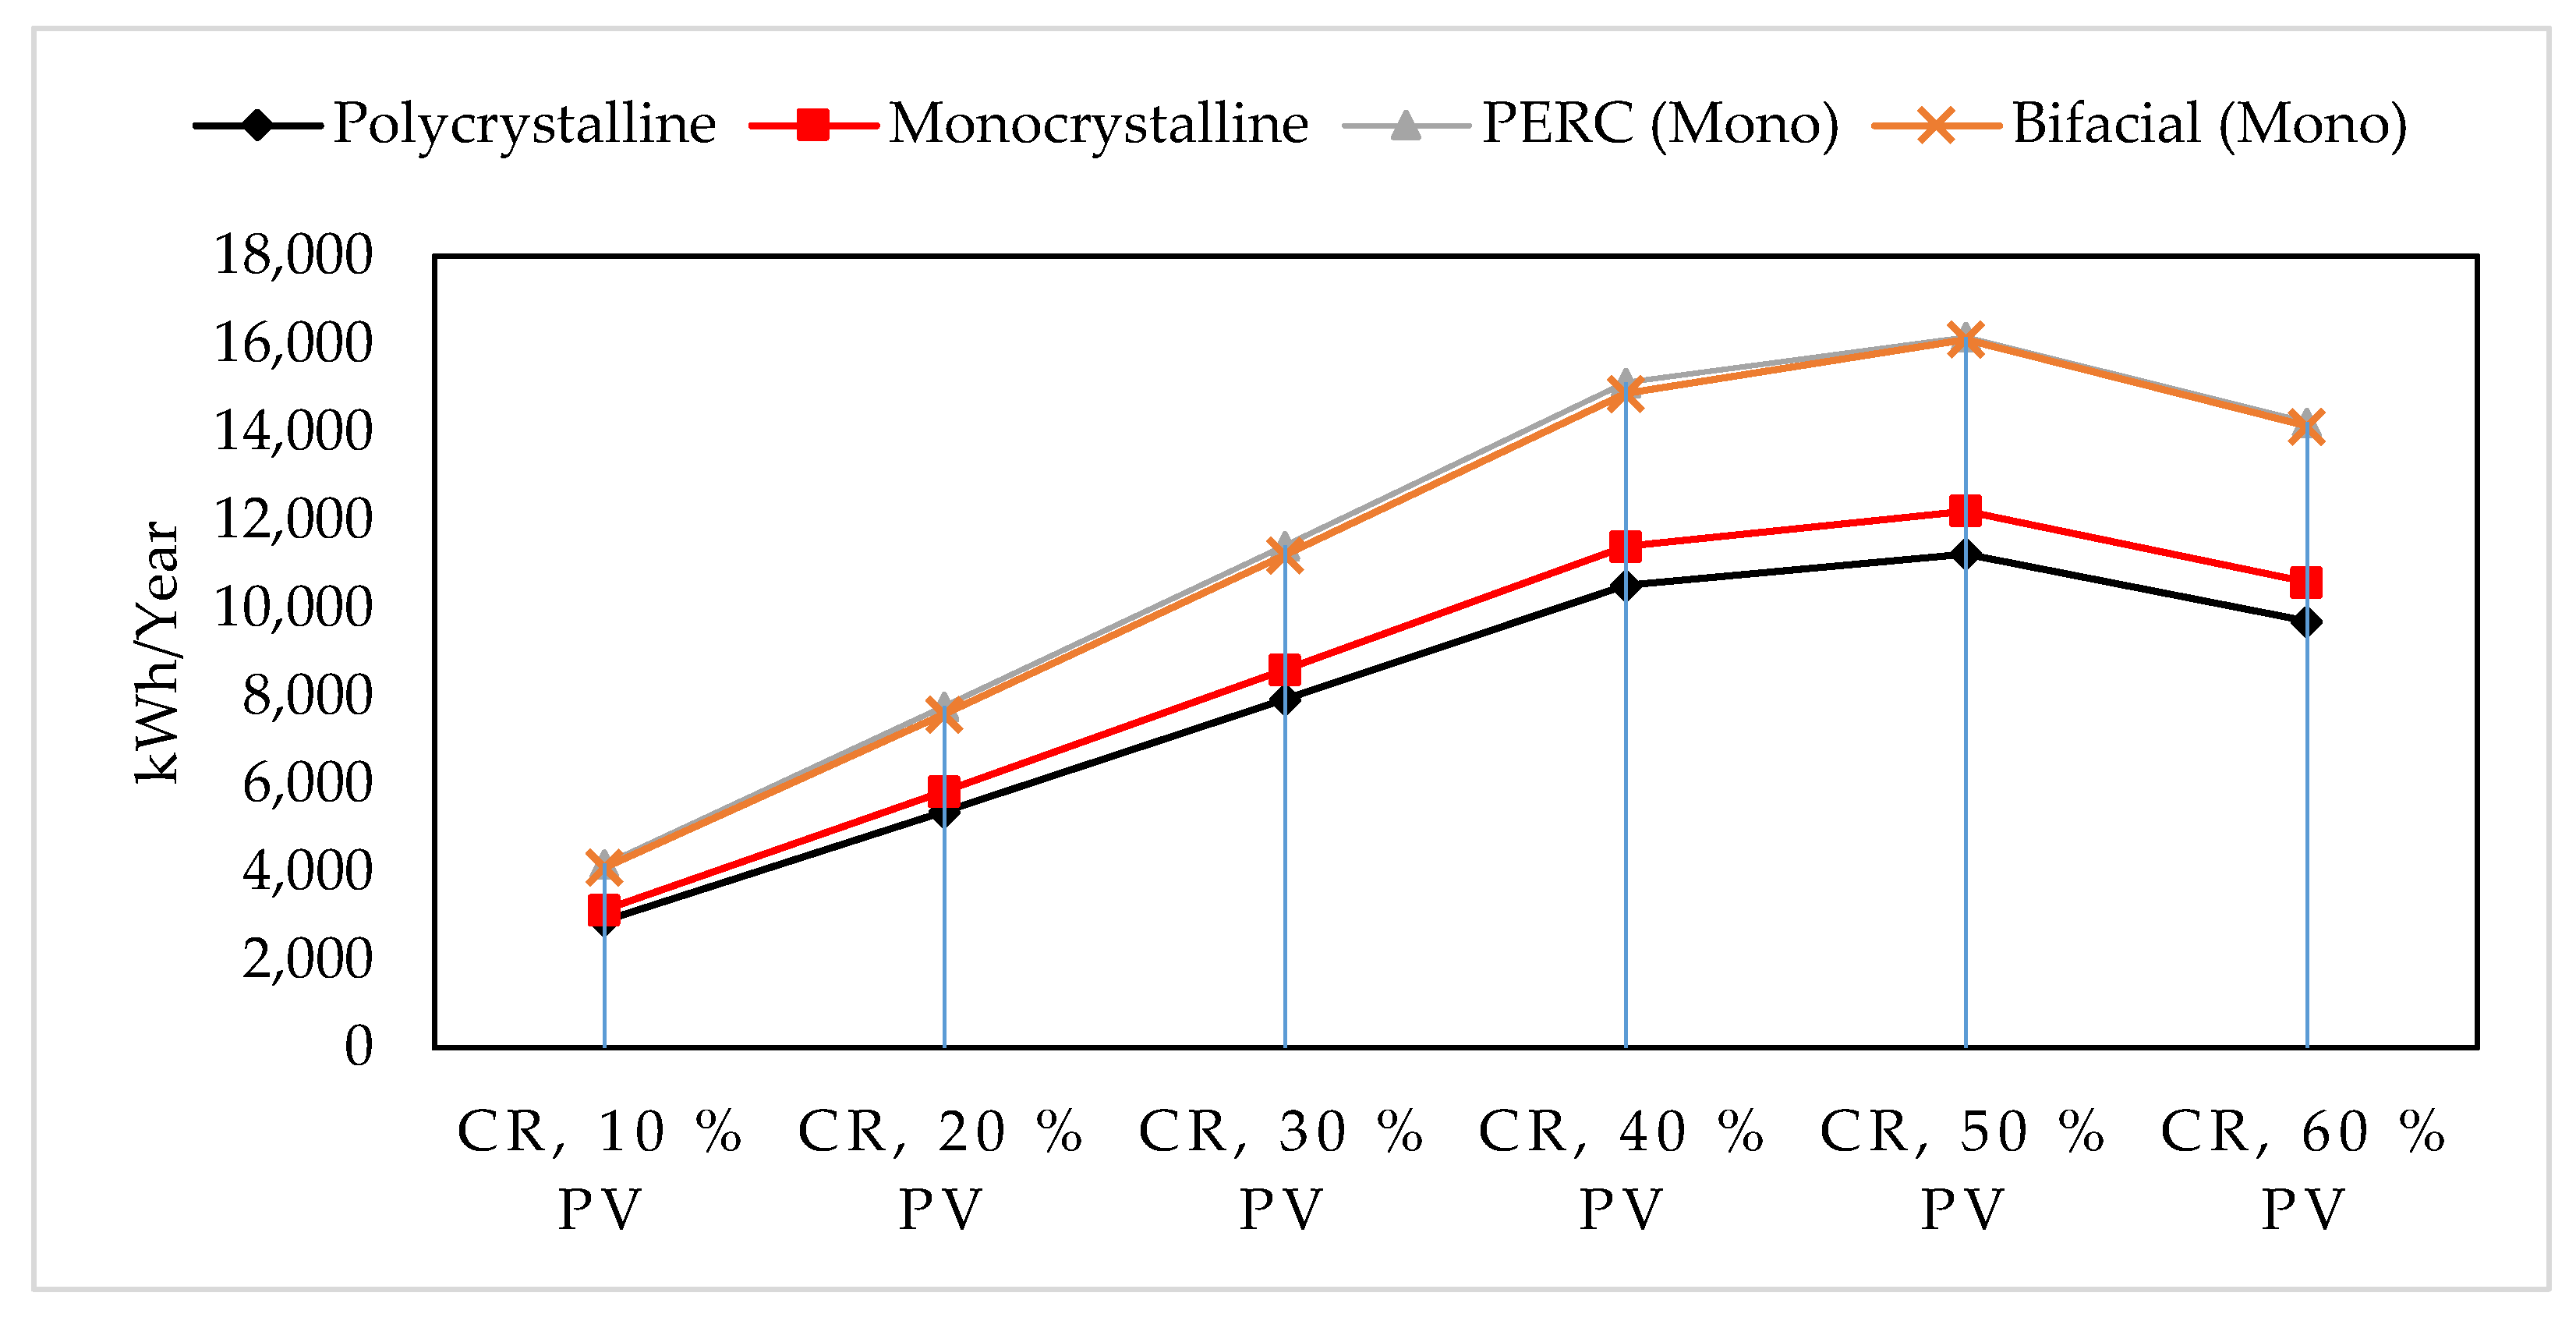
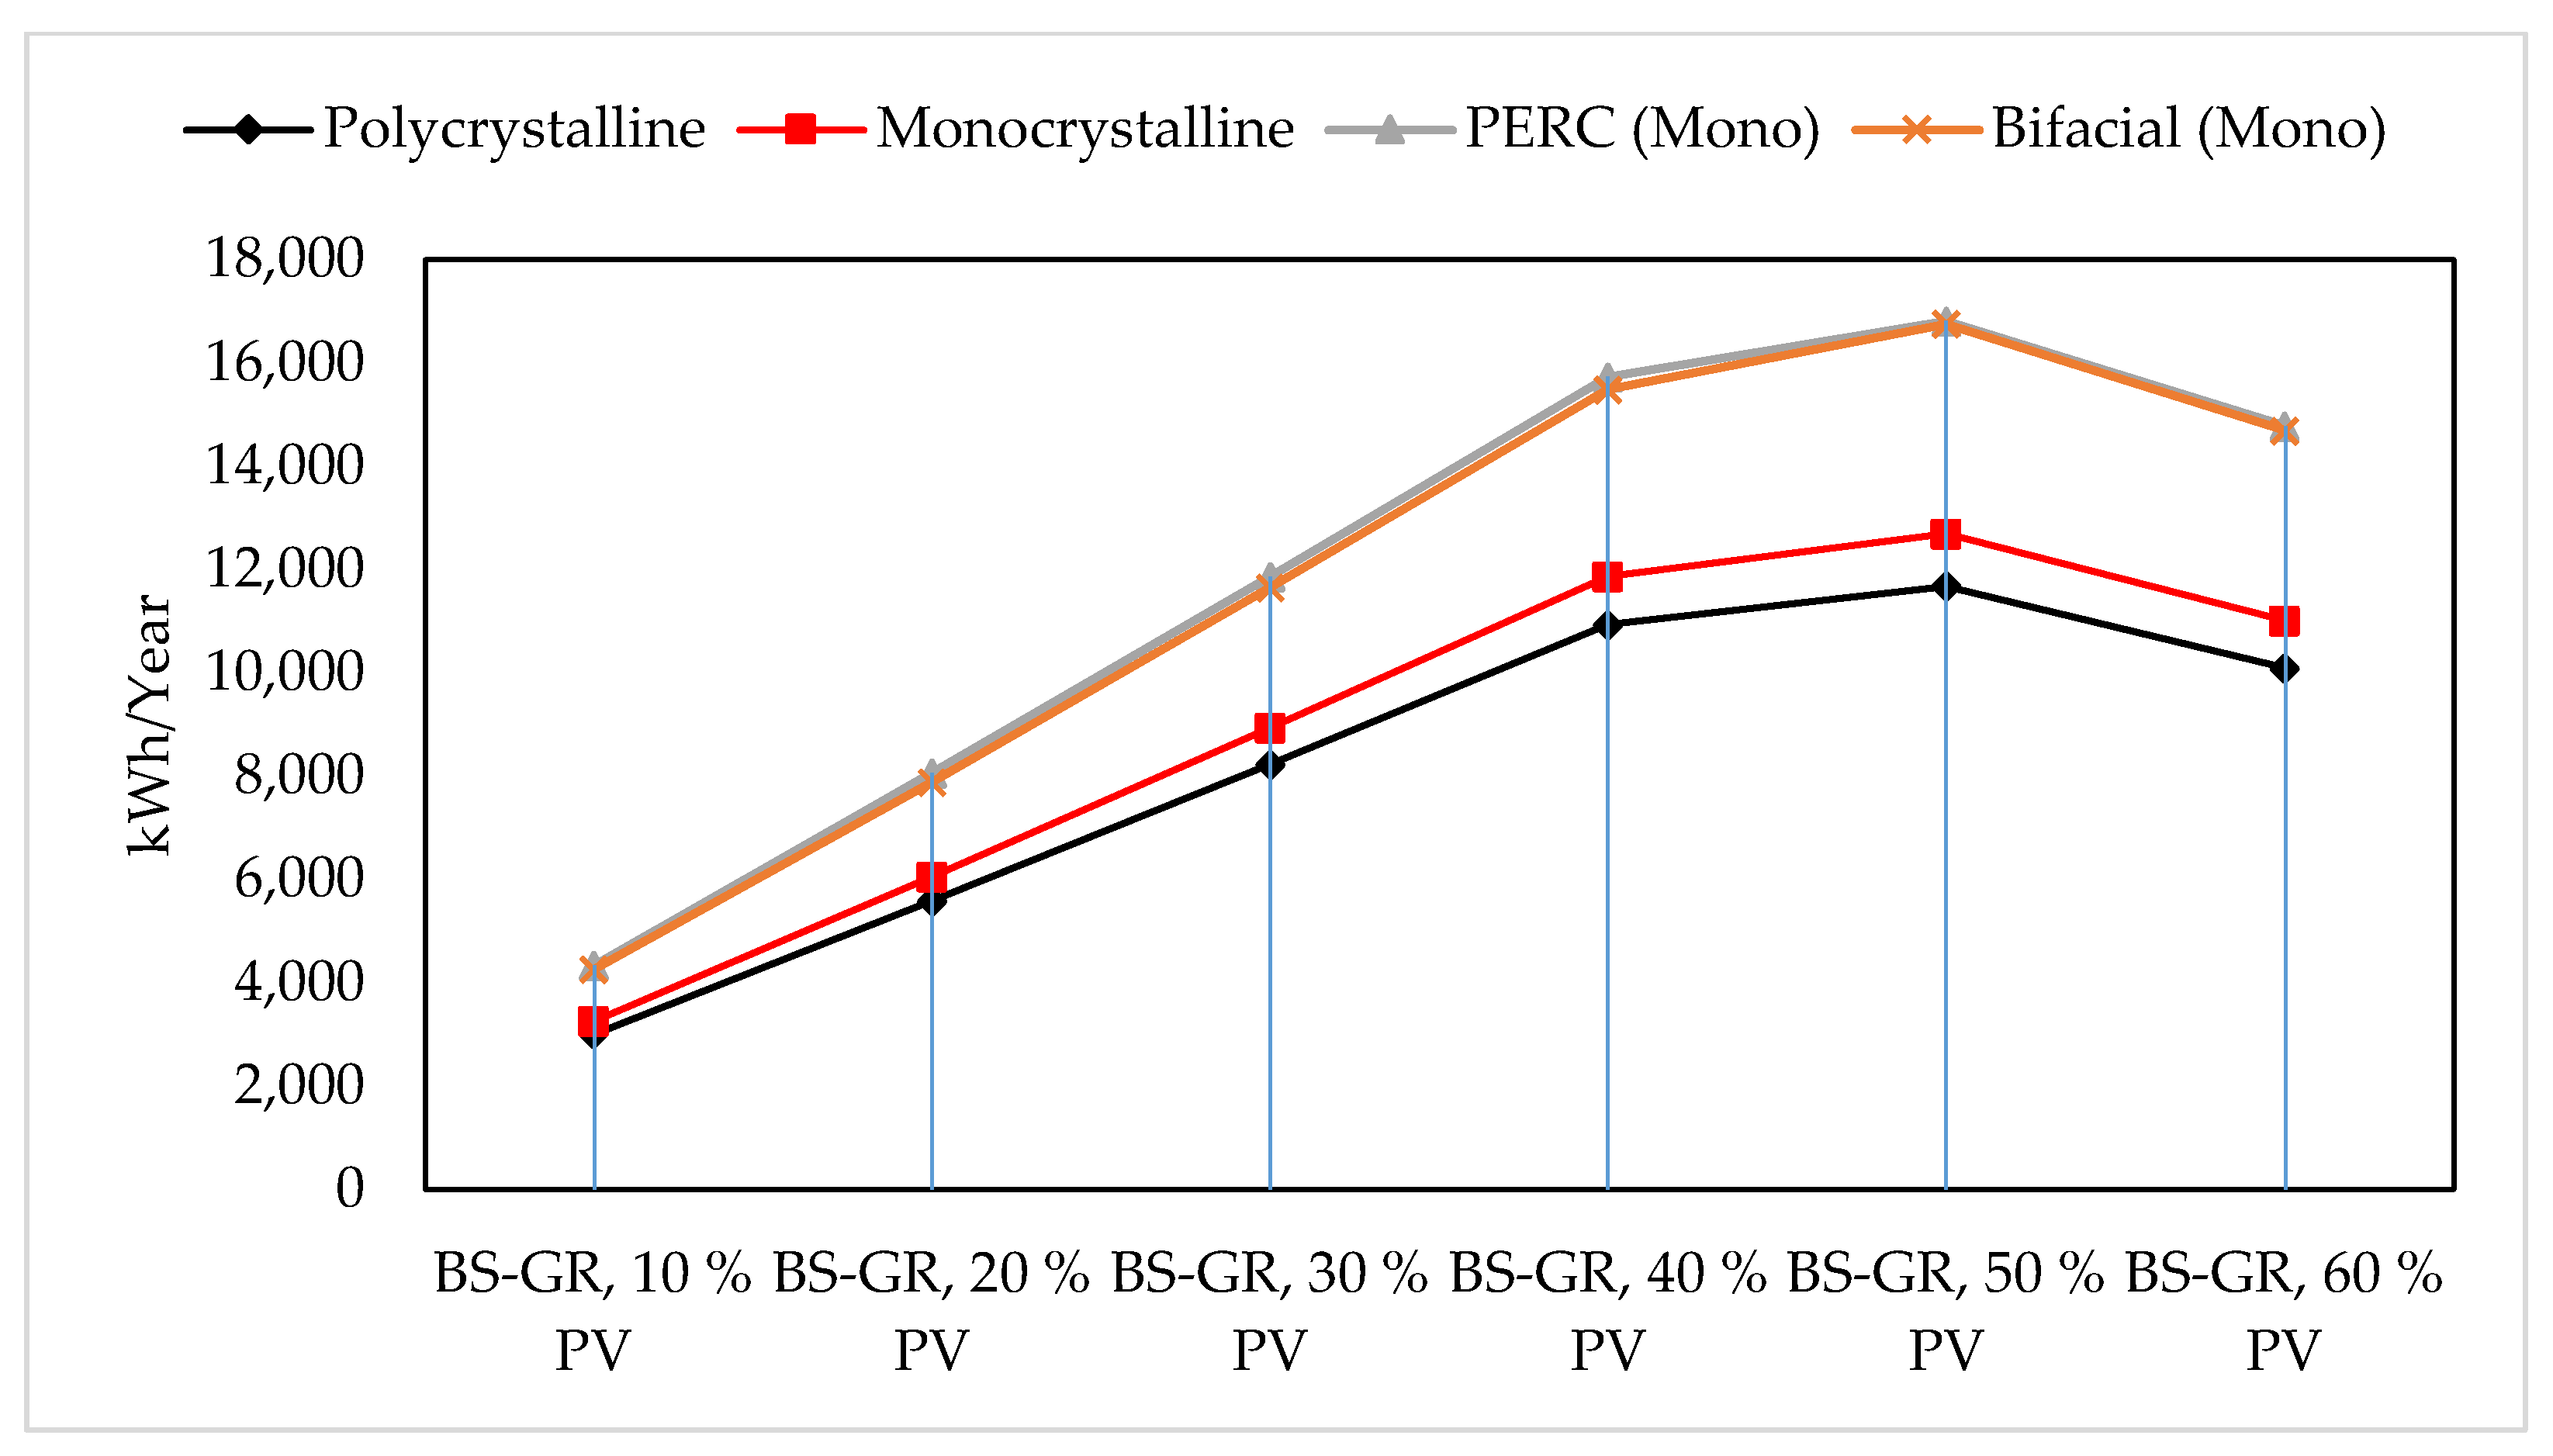
3.1. Shade Frequency of PV Panels on Panel Surfaces and the Impact on Annual Electricity Production
3.2. Shade Frequency of PV Panels on Green Roof Surfaces and the Impact on ET
3.3. Evaluation of Bio-Solar Green Roof Water–Energy Performance
3.4. Scope for Future Works
- Analysis of other inclinations (tilts) of solar panels in bio-solar green roofs and comparison with the optimized tilt angle in conventional roofs. In bio-solar green roofs, other angles might further decline the temperature of PV (effect of the power production) and also affect shade frequency (impact on the ET value). Therefore, optimization of PV inclination is suggested for future works;
- Further studies can be conducted for other roofs with higher values of albedos (such as white roofs) to investigate the impact of green roofs in comparison;
- Analyses of a windy climate and the impacts of PV on wind reduction and wind on PV panel temperature can improve the knowledge in this field and are suggested for future investigations;
- Analysis of different types of plants and green roofs is suggested for future studies;
- Finally, the thermal impact of bio-solar green roofs on building envelopes and the energy efficiency of buildings in the Mediterranean climate can be analyzed in future studies.
4. Conclusions
Author Contributions
Funding
Data Availability Statement
Acknowledgments
Conflicts of Interest
Abbreviations
| AET | Actual evapotranspiration |
| ET | Evapotranspiration |
| GRs | Green roofs |
| Mono | Monocrystalline |
| PERC | Passivated Emitter and Rear Contact |
| PV | Photovoltaic |
| Poly | Polycrystalline |
| UV | Ultraviolet |
Appendix A. MATLAB Code Development
- input_image = imread(‘C:\Users\\Desktop\test.jpg’);
- sharpened_image = imsharpen(input_image);
- resized_image = imresize(sharpened_image, 2);
- hsv_image = rgb2hsv(resized_image);
- hue = hsv_image(:,:,1);
- saturation = hsv_image(:,:,2);
- value = hsv_image(:,:,3);
- yellow_mask = (hue >= yellow_hue_min) & (hue <= yellow_hue_max) & (saturation > 0.2) & (value > 0.2);
- green_mask = (hue >= green_hue_min) & (hue <= green_hue_max) & (saturation > 0.2) & (value > 0.2);
- red_mask = ((hue >= red_hue_min_1) & (hue <= red_hue_max_1)|(hue >= red_hue_min_2) & (hue <= red_hue_max_2)) & (saturation > 0.2) & (value > 0.2);
- white_mask = (saturation <= white_saturation_max) & (value >= white_value_min);
- total_pixels = numel(hue);
- fprintf(‘Yellow: %.2f%%\n’, yellow_percentage);
- fprintf(‘Green: %.2f%%\n’, green_percentage);
- fprintf(‘Red: %.2f%%\n’, red_percentage);
- fprintf(‘White: %.2f%%\n’, white_percentage);
- figure;
References
- Palla, A.; Sansalone, J.J.; Gnecco, I.; Lanza, L.G. Storm water infiltration in a monitored green roof for hydrologic restoration. Water Sci. Technol. 2011, 64, 766–773. [Google Scholar] [CrossRef] [PubMed]
- Perini, K.; Bazzocchi, F.; Croci, L.; Magliocco, A.; Cattaneo, E. The use of vertical greening systems to reduce the energy demand for air conditioning. Field monitoring in Mediterranean climate. Energy Build. 2017, 143, 35–42. [Google Scholar] [CrossRef]
- Manso, M.; Teotónio, I.; Silva, C.M.; Cruz, C.O. Green roof and green wall benefits and costs: A review of the quantitative evidence. Renew. Sustain. Energy Rev. 2021, 135, 110111. [Google Scholar] [CrossRef]
- Cascone, S. Green roof design: State of the art on technology and materials. Sustainability 2019, 11, 3020. [Google Scholar] [CrossRef]
- Piro, P.; Carbone, M.; Penna, N.; Marsalek, J. Characterization of the settling process for wastewater from a combined sewer system. Water Res. 2011, 45, 6615–6624. [Google Scholar] [CrossRef]
- Maiolo, M.; Pirouz, B.; Bruno, R.; Palermo, S.A.; Arcuri, N.; Piro, P. The role of the extensive green roofs on decreasing building energy consumption in the mediterranean climate. Sustainability 2020, 12, 359. [Google Scholar] [CrossRef]
- Moratiel, R.; Bravo, R.; Saa, A.; Tarquis, A.M.; Almorox, J. Estimation of evapotranspiration by the Food and Agricultural Organization of the United Nations (FAO) Penman-Monteith temperature (PMT) and Hargreaves-Samani (HS) models under temporal and spatial criteria—A case study in Duero basin (Spain). Nat. Hazards Earth Syst. Sci. 2020, 20, 859–875. [Google Scholar] [CrossRef]
- Palla, A.; Gnecco, I.; Carbone, M.; Garofalo, G.; Lanza, L.G.; Piro, P. Influence of stratigraphy and slope on the drainage capacity of permeable pavements: Laboratory results. Urban Water J. 2015, 12, 394–403. [Google Scholar] [CrossRef]
- Ogaili, H.; Sailor, D.J. Measuring the Effect of Vegetated Roofs on the Performance of Photovoltaic Panels in a Combined System. J. Sol. Energy Eng. Trans. ASME 2016, 138, 061009. [Google Scholar] [CrossRef]
- Fleck, R.; Gill, R.; Pettit, T.J.; Torpy, F.R.; Irga, P.J. Bio-solar green roofs increase solar energy output: The sunny side of integrating sustainable technologies. Build. Environ. 2022, 226, 109703. [Google Scholar] [CrossRef]
- Pirouz, B.; Palermo, S.A.; Maiolo, M.; Arcuri, N.; Piro, P. Decreasing water footprint of electricity and heat by extensive green roofs: Case of southern italy. Sustainability 2020, 12, 10178. [Google Scholar] [CrossRef]
- Zhang, Z.; Szota, C.; Fletcher, T.D.; Williams, N.S.G.; Werdin, J.; Farrell, C. Influence of plant composition and water use strategies on green roof stormwater retention. Sci. Total Environ. 2018, 625, 775–781. [Google Scholar] [CrossRef]
- Silvestri, L.; Saraceni, M.; Bongioannini Cerlini, P. Quality management system and design of an integrated mesoscale meteorological network in Central Italy. Meteorol. Appl. 2022, 29, e2060. [Google Scholar] [CrossRef]
- Hui, S.C.M.; Chan, S.C. Integration of green roof and solar photovoltaic systems. In Proceedings of the Joint Symposium 2011: Integrated Building Design in the New Era of Sustainability, Hong Kong, China, 22 November 2011; Volume 2011, pp. 1–12. [Google Scholar]
- Zheng, Y.; Weng, Q. Modeling the effect of green roof systems and photovoltaic panels for building energy savings to mitigate climate change. Remote Sens. 2020, 12, 2402. [Google Scholar] [CrossRef]
- Pirouz, B.; Palermo, S.A.; Turco, M. Improving the efficiency of green roofs using atmospheric water harvesting systems (An innovative design). Water 2021, 13, 546. [Google Scholar] [CrossRef]
- Pirouz, B.; Palermo, S.A.; Becciu, G.; Sanfilippo, U.; Nejad, H.J.; Piro, P.; Turco, M. A Novel Multipurpose Self-Irrigated Green Roof with Innovative Drainage Layer. Hydrology 2023, 10, 57. [Google Scholar] [CrossRef]
- Schweitzer, O.; Erell, E. Evaluation of the energy performance and irrigation requirements of extensive green roofs in a water-scarce Mediterranean climate. Energy Build. 2014, 68, 25–32. [Google Scholar] [CrossRef]
- Brunetti, G.; Porti, M.; Piro, P. Multi-level numerical and statistical analysis of the hygrothermal behavior of a non-vegetated green roof in a mediterranean climate. Appl. Energy 2018, 221, 204–219. [Google Scholar] [CrossRef]
- Elamri, Y.; Cheviron, B.; Lopez, J.M.; Dejean, C.; Belaud, G. Water budget and crop modelling for agrivoltaic systems: Application to irrigated lettuces. Agric. Water Manag. 2018, 208, 440–453. [Google Scholar] [CrossRef]
- Marrou, H.; Dufour, L.; Wery, J. How does a shelter of solar panels influence water flows in a soil-crop system? Eur. J. Agron. 2013, 50, 38–51. [Google Scholar] [CrossRef]
- Adeh, E.H.; Selker, J.S.; Higgins, C.W. Remarkable agrivoltaic influence on soil moisture, micrometeorology and water-use efficiency. PLoS ONE 2018, 13, e0203256. [Google Scholar] [CrossRef]
- Jahanfar, A.; Drake, J.; Sleep, B.; Margolis, L. Evaluating the shading effect of photovoltaic panels on green roof discharge reduction and plant growth. J. Hydrol. 2019, 568, 919–928. [Google Scholar] [CrossRef]
- Ali Abaker Omer, A.; Liu, W.; Li, M.; Zheng, J.; Zhang, F.; Zhang, X.; Osman Hamid Mohammed, S.; Fan, L.; Liu, Z.; Chen, F.; et al. Water evaporation reduction by the agrivoltaic systems development. Sol. Energy 2022, 247, 13–23. [Google Scholar] [CrossRef]
- Chauhan, P.M.; Kim, W.S.; Lieth, J.H. Combined Effect of Whitening and Ventilation Methods on Microclimate and Transpiration in Rose Greenhouse. In Proceedings of the International Conference on Thermal Energy Storage Technologies, Indore, India, 21–24 March 2003. [Google Scholar]
- Tams, L.; Paton, E.N.; Kluge, B. Impact of shading on evapotranspiration and water stress of urban trees. Ecohydrology 2023, 16, e2556. [Google Scholar] [CrossRef]
- Smets, A.; Jäger, K.; Isabella, O.; René van Swaaij, M.Z. Solar Energy: The Physics and Engineering of Photovoltaic Conversion, Technologies and Systems; Bloomsbury: New York, NY, USA, 2016; ISBN 1853330566. [Google Scholar]
- Dhass, A.D.; Prakash, Y.; Ramya, K.C. Effect of temperature on internal parameters of solar cell. Mater. Today Proc. 2020, 33, 732–735. [Google Scholar] [CrossRef]
- Dhass, A.D.; Lakshmi, P.; Natarajan, E. Investigation of Performance Parameters of Different Photovoltaic Cell Materials using the Lambert-W Function. Energy Procedia 2016, 90, 566–573. [Google Scholar] [CrossRef]
- Teo, H.G.; Lee, P.S.; Hawlader, M.N.A. An active cooling system for photovoltaic modules. Appl. Energy 2012, 90, 309–315. [Google Scholar] [CrossRef]
- Elminshawy, N.A.S.; Mohamed, A.M.I.; Morad, K.; Elhenawy, Y.; Alrobaian, A.A. Performance of PV panel coupled with geothermal air cooling system subjected to hot climatic. Appl. Therm. Eng. 2019, 148, 1–9. [Google Scholar] [CrossRef]
- Golzari, S.; Kasaeian, A.; Amidpour, M.; Nasirivatan, S.; Mousavi, S. Experimental investigation of the effects of corona wind on the performance of an air-cooled PV/T. Renew. Energy 2018, 127, 284–297. [Google Scholar] [CrossRef]
- Lebbi, M.; Touafek, K.; Benchatti, A.; Boutina, L.; Khelifa, A.; Baissi, M.T.; Hassani, S. Energy performance improvement of a new hybrid PV/T Bi-fluid system using active cooling and self-cleaning: Experimental study. Appl. Therm. Eng. 2021, 182, 116033. [Google Scholar] [CrossRef]
- Bahaidarah, H.; Subhan, A.; Gandhidasan, P.; Rehman, S. Performance evaluation of a PV (photovoltaic) module by back surface water cooling for hot climatic conditions. Energy 2013, 59, 445–453. [Google Scholar] [CrossRef]
- Castanheira, A.F.A.; Fernandes, J.F.P.; Branco, P.J.C. Demonstration project of a cooling system for existing PV power plants in Portugal. Appl. Energy 2018, 211, 1297–1307. [Google Scholar] [CrossRef]
- Baloch, A.A.B.; Bahaidarah, H.M.S.; Gandhidasan, P.; Al-Sulaiman, F.A. Experimental and numerical performance analysis of a converging channel heat exchanger for PV cooling. Energy Convers. Manag. 2015, 103, 14–27. [Google Scholar] [CrossRef]
- Elminshawy, N.A.S.; El-Ghandour, M.; Elhenawy, Y.; Bassyouni, M.; El-Damhogi, D.G.; Addas, M.F. Experimental investigation of a V-trough PV concentrator integrated with a buried water heat exchanger cooling system. Sol. Energy 2019, 193, 706–714. [Google Scholar] [CrossRef]
- Shalaby, S.M.; Elfakharany, M.K.; Moharram, B.M.; Abosheiasha, H.F. Experimental study on the performance of PV with water cooling. Energy Rep. 2022, 8, 957–961. [Google Scholar] [CrossRef]
- Hadipour, A.; Rajabi Zargarabadi, M.; Rashidi, S. An efficient pulsed- spray water cooling system for photovoltaic panels: Experimental study and cost analysis. Renew. Energy 2021, 164, 867–875. [Google Scholar] [CrossRef]
- Bevilacqua, P.; Bruno, R.; Rollo, A.; Ferraro, V. A novel thermal model for PV panels with back surface spray cooling. Energy 2022, 255, 124401. [Google Scholar] [CrossRef]
- Hussein, H.A.; Numan, A.H.; Abdulrahman, R.A. Improving the Hybrid Photovoltaic/Thermal System Performance Using Water-Cooling Technique and Zn-H2O Nanofluid. Int. J. Photoenergy 2017, 2017. [Google Scholar] [CrossRef]
- Kane, A.; Verma, V.; Singh, B. Optimization of thermoelectric cooling technology for an active cooling of photovoltaic panel. Renew. Sustain. Energy Rev. 2017, 75, 1295–1305. [Google Scholar] [CrossRef]
- Salehi, R.; Jahanbakhshi, A.; Reza Golzarian, M.; Khojastehpour, M. Evaluation of solar panel cooling systems using anodized heat sink equipped with thermoelectric module through the parameters of temperature, power and efficiency. Energy Convers. Manag. X 2021, 11, 100102. [Google Scholar] [CrossRef]
- Wu, S.Y.; Wang, T.; Xiao, L.; Shen, Z.G. Effect of cooling channel position on heat transfer characteristics and thermoelectric performance of air-cooled PV/T system. Sol. Energy 2019, 180, 489–500. [Google Scholar] [CrossRef]
- Sheeba, K.N.; Rao, R.M.; Jaisankar, S. A study on the underwater performance of a solar photovoltaic panel. Energy Sources, Part A Recover. Util. Environ. Eff. 2015, 37, 1505–1512. [Google Scholar] [CrossRef]
- Chandrasekar, M.; Senthilkumar, T. Experimental demonstration of enhanced solar energy utilization in flat PV (photovoltaic) modules cooled by heat spreaders in conjunction with cotton wick structures. Energy 2015, 90, 1401–1410. [Google Scholar] [CrossRef]
- Li, R.; Shi, Y.; Wu, M.; Hong, S.; Wang, P. Photovoltaic panel cooling by atmospheric water sorption–evaporation cycle. Nat. Sustain. 2020, 3, 636–643. [Google Scholar] [CrossRef]
- Wang, W.; Aleid, S.; Shi, Y.; Zhang, C.; Li, R.; Wu, M.; Zhuo, S.; Wang, P. Integrated solar-driven PV cooling and seawater desalination with zero liquid discharge. Joule 2021, 5, 1873–1887. [Google Scholar] [CrossRef]
- Dida, M.; Boughali, S.; Bechki, D.; Bouguettaia, H. Experimental investigation of a passive cooling system for photovoltaic modules efficiency improvement in hot and arid regions. Energy Convers. Manag. 2021, 243, 114328. [Google Scholar] [CrossRef]
- Parkunam, N.; Pandiyan, L.; Navaneethakrishnan, G.; Arul, S.; Vijayan, V. Experimental analysis on passive cooling of flat photovoltaic panel with heat sink and wick structure. Energy Sources Part A Recover. Util. Environ. Eff. 2020, 42, 653–663. [Google Scholar] [CrossRef]
- Popovici, C.G.; Hudişteanu, S.V.; Mateescu, T.D.; Cherecheş, N.C. Efficiency Improvement of Photovoltaic Panels by Using Air Cooled Heat Sinks. Energy Procedia 2016, 85, 425–432. [Google Scholar]
- Hamed, T.A.; Alshare, A.; El-Khalil, H. Passive cooling of building-integrated photovolatics in desert conditions: Experiment and modeling. Energy 2019, 170, 131–138. [Google Scholar] [CrossRef]
- Marudaipillai, S.K.; Karuppudayar Ramaraj, B.; Kottala, R.K.; Lakshmanan, M. Experimental study on thermal management and performance improvement of solar PV panel cooling using form stable phase change material. Energy Sources Part A Recover. Util. Environ. Eff. 2023, 45, 160–177. [Google Scholar] [CrossRef]
- Özcan, Z.; Gülgün, M.; Şen, E.; Çam, N.Y.; Bilir, L. Cooling channel effect on photovoltaic panel energy generation. Sol. Energy 2021, 230, 943–953. [Google Scholar] [CrossRef]
- Li, Z.; Ma, T.; Zhao, J.; Song, A.; Cheng, Y. Experimental study and performance analysis on solar photovoltaic panel integrated with phase change material. Energy 2019, 178, 471–486. [Google Scholar] [CrossRef]
- Ramkiran, B.; Sundarabalan, C.K.; Sudhakar, K. Sustainable passive cooling strategy for PV module: A comparative analysis. Case Stud. Therm. Eng. 2021, 27, 101317. [Google Scholar] [CrossRef]
- Dwivedi, P.; Sudhakar, K.; Soni, A.; Solomin, E.; Kirpichnikova, I. Advanced cooling techniques of P.V. modules: A state of art. Case Stud. Therm. Eng. 2020, 21, 100674. [Google Scholar] [CrossRef]
- Li, S.; Zhou, Z.; Liu, J.; Zhang, J.; Tang, H.; Zhang, Z.; Na, Y.; Jiang, C. Research on indirect cooling for photovoltaic panels based on radiative cooling. Renew. Energy 2022, 198, 947–959. [Google Scholar] [CrossRef]
- Zaite, A.; Belouaggadia, N.; Abid, C.; Ezzine, M. Performance improvement of photovoltaic cells using night radiative cooling technology in a PV/T collector. J. Build. Eng. 2021, 42, 102843. [Google Scholar] [CrossRef]
- Metwally, H.; Mahmoud, N.A.; Ezzat, M.; Aboelsoud, W. Numerical investigation of photovoltaic hybrid cooling system performance using the thermoelectric generator and RT25 Phase change material. J. Energy Storage 2021, 42, 103031. [Google Scholar] [CrossRef]
- Perrakis, G.; Tasolamprou, A.C.; Kenanakis, G.; Economou, E.N.; Tzortzakis, S.; Kafesaki, M. Combined nano and micro structuring for enhanced radiative cooling and efficiency of photovoltaic cells. Sci. Rep. 2021, 11, 11552. [Google Scholar] [CrossRef]
- Martin, J. Monocrystalline vs Polycrystalline Solar Panels: Busting Myths. Available online: http://www.solarchoice.net.au/blog/monocrystalline-vs-polycrystalline-solar-panels-busting-myths/ (accessed on 15 December 2024).
- Lane, C. Types of Solar Panels: Which One Is the Best Choice? Available online: https://www.solarreviews.com/blog/pros-and-cons-of-monocrystalline-vs-polycrystalline-solar-panels (accessed on 17 December 2024).
- Lee, S. Solar Panels Size & Weight (Including Commercial Dimensions). Available online: https://www.velosolar.com/solar-panel-size/ (accessed on 12 December 2024).
- Green, M.A.; Dunlop, E.D.; Yoshita, M.; Kopidakis, N.; Bothe, K.; Siefer, G.; Hao, X. Solar cell efficiency tables (version 62). Prog. Photovolt. Res. Appl. 2023, 31, 651–663. [Google Scholar] [CrossRef]
- UK Solar Power PERC Solar Panel. Available online: https://cdn.enfsolar.com/z/pp/1ldo4ole213/UK6P60-270-290watts.pdf (accessed on 8 December 2024).
- Solar Magazine. A Complete Guide to PERC Solar Panels (vs. Other Techs). Available online: https://solarmagazine.com/solar-panels/perc-solar-panels/ (accessed on 14 November 2024).
- SRoeCo Solar Most Efficient Solar Panels. Available online: http://sroeco.com/solar/most-efficient-solar-panels (accessed on 17 November 2024).
- Zhu, S.; Causone, F.; Gao, N.; Ye, Y.; Jin, X.; Zhou, X.; Shi, X. Numerical simulation to assess the impact of urban green infrastructure on building energy use: A review. Build. Environ. 2023, 228, 109832. [Google Scholar] [CrossRef]
- The Renewable Energy Hub What Are the Different Types of Solar Photovoltaic Cells? Available online: https://news.energysage.com/types-of-solar-panels/ (accessed on 10 January 2025).
- Ren, X.; Li, J.; Jiao, D.; Gao, D.; Pei, G. Temperature-dependent performance of amorphous silicon photovoltaic/thermal systems in the long term operation. Appl. Energy 2020, 275, 115156. [Google Scholar] [CrossRef]
- Aho, A.; Isoaho, R.; Tukiainen, A.; Polojärvi, V.; Aho, T.; Raappana, M.; Guina, M. Temperature coefficients for GaInP/GaAs/GaInNAsSb solar cells. AIP Conf. Proc. 2015, 1679, 050001. [Google Scholar]
- American Solar Energy Society. Thin-Film Solar Panels. Available online: https://ases.org/thin-film-solar-panels/ (accessed on 12 January 2025).
- ENF Ltd. ENF Solar—Solar Companies and Products. Available online: https://www.enfsolar.com/ (accessed on 20 December 2024).
- Battery Equivalents Complete Guide to Bifacial Solar Panels. Available online: https://www.batteryequivalents.com/complete-guide-to-bifacial-solar-panels.html (accessed on 21 December 2024).
- Aussie Solar Tech a Complete Guide to Bifacial Solar Panels—Advantages and Disadvantages. Available online: https://aussiesolartech.com.au/solar-panel/bifacial-solar-panels/ (accessed on 10 January 2025).
- Alafnan, H. The Impact of PV Panel Degradation Rate, Initial System Efficiency, and Interest Rate on the Levelized Cost of Energy for PV Projects: Saudi Arabia as a Benchmark. Sustainability 2024, 16, 12. [Google Scholar] [CrossRef]
- Iftikhar, H.; Sarquis, E.; Costa Branco, P.J. Why can simple operation and maintenance (O&m) practices in large-scale grid-connected pv power plants play a key role in improving its energy output? Energies 2021, 14, 3798. [Google Scholar] [CrossRef]
- Kim, J.; Rabelo, M.; Padi, S.P.; Yousuf, H.; Cho, E.C.; Yi, J. A review of the degradation of photovoltaic modules for life expectancy. Energies 2021, 14, 4278. [Google Scholar] [CrossRef]
- da Fonseca, J.E.F.; de Oliveira, F.S.; Massen Prieb, C.W.; Krenzinger, A. Degradation analysis of a photovoltaic generator after operating for 15 years in southern Brazil. Sol. Energy 2020, 196, 196–206. [Google Scholar] [CrossRef]
- Ciacci, C.; Banti, N.; Di Naso, V.; Bazzocchi, F. Green strategies for improving urban microclimate and air quality: A case study of an Italian industrial district and facility. Build. Environ. 2023, 244, 110762. [Google Scholar] [CrossRef]
- Alshayeb, M.J.; Chang, J.D. Variations of PV panel performance installed over a vegetated roof and a conventional black roof. Energies 2018, 11, 1110. [Google Scholar] [CrossRef]
- Köhler, M.; Wiartalla, W.; Feige, R. Interaction between PV-systems and extensive green roofs. In Proceedings of the 5th Annual International Greening Rooftops for Sustainable Communities Conference, Awards and Trade Show, Minneapolis, MN, USA, 29 April–1 May 2007; pp. 1–16. [Google Scholar]
- Jahanfar, A.; Sleep, B.; Drake, J. Energy and Carbon-Emission Analysis of Integrated Green-Roof Photovoltaic Systems: Probabilistic Approach. J. Infrastruct. Syst. 2018, 24, 04017044. [Google Scholar] [CrossRef]
- Perez, M.J.R.; Wight, N.T.; Fthenakis, V.M.; Ho, C. Green-roof integrated pv canopies-an empirical study and teaching tool for low income students in the South Bronx. In Proceedings of the World Renewable Energy Forum, WREF 2012, Including World Renewable Energy Congress XII and Colorado Renewable Energy Society (CRES), Denver, CO, USA, 13–17 May 2012; Volume 5, pp. 4046–4052. [Google Scholar]
- Hendarti, R. The Influence of the Evapotranspiration Process of Green Roof Tops on PV Modules in the Tropics. Ph.D. Thesis, National University of Singapore, Singapore, 2013. Volume 1. [Google Scholar]
- Nagengast, A.L. Energy Performance Impacts from Competing Low-slope Roofing Choices and Photovoltaic Technologies. Bachelor’s Thesis, Publication Number: AAT 3536322. Carnegie Mellon University, Pittsburgh, PA, USA, 2012. [Google Scholar] [CrossRef]
- Arenandan, V.; Wong, J.K.; Ahmed, A.N.; Chow, M.F. Efficiency enhancement in energy production of photovoltaic modules through green roof installation under tropical climates. Ain Shams Eng. J. 2022, 13, 101741. [Google Scholar] [CrossRef]
- Osma-Pinto, G.; Ordóñez-Plata, G. Measuring factors influencing performance of rooftop PV panels in warm tropical climates. Sol. Energy 2019, 185, 112–123. [Google Scholar] [CrossRef]
- Waghmare, R.; Jilte, R.; Joshi, S.; Tete, P. Review on agrophotovoltaic systems with a premise on thermal management of photovoltaic modules therein. Environ. Sci. Pollut. Res. 2023, 30, 25591–25612. [Google Scholar] [CrossRef]
- Chemisana, D.; Lamnatou, C. Photovoltaic-green roofs: An experimental evaluation of system performance. Appl. Energy 2014, 119, 246–256. [Google Scholar] [CrossRef]
- Valentin Software GmbH PV*SOL. Available online: https://valentin-software.com/en/products/pvsol-premium/ (accessed on 15 August 2024).
- MathWorks MATLAB. Available online: https://it.mathworks.com/academia.html (accessed on 1 September 2024).
- Ventana Systems, Inc. Vensim. Available online: https://vensim.com/ (accessed on 10 October 2024).
- Commission, J.R.C.E. Photovoltaic Geographical Information System (PVGIS). Available online: https://re.jrc.ec.europa.eu/pvg_tools/es/#PVP%0Ahttps://ec.europa.eu/jrc/en/pvgis (accessed on 16 December 2024).
- Ahmad, F.F.; Rejeb, O.; Boudekji, G.; Ghenai, C. Green hydrogen production using bifacial solar photovoltaics integrated with high-albedo roof coating & micro-inverter. Int. J. Hydrogen Energy 2024, 56, 642–650. [Google Scholar] [CrossRef]
- Santamouris, M. Cooling the cities—A review of reflective and green roof mitigation technologies to fight heat island and improve comfort in urban environments. Sol. Energy 2014, 103, 682–703. [Google Scholar] [CrossRef]
- PV*SOL® Help. Available online: https://help.valentin-software.com/pvsol/en/pages/ (accessed on 15 August 2024).
- Anggraini, N.; Slamet, B. Thornthwaite Models for Estimating Potential evapotranspiration in Medan City. In Proceedings of the IOP Conference Series: Earth and Environmental Science, Medan, Indonesia, 24–25 August 2021; Volume 912. [Google Scholar]
- Peng, Z.; Stovin, V. Independent Validation of the SWMM Green Roof Module. J. Hydrol. Eng. 2017, 22, 04017037. [Google Scholar] [CrossRef]
- Carbone, M.; Principato, F.; Garofalo, G.; Piro, P. Comparison of Evapotranspiration Computation by FAO-56 and Hargreaves Methods. J. Irrig. Drain. Eng. 2016, 142, 06016007. [Google Scholar] [CrossRef]
- Hargreaves, G.H.; Zohrab, A. Samani Reference Crop Evapotranspiration from Temperature. Appl. Eng. Agric. 1985, 1, 96–99. [Google Scholar] [CrossRef]
- Jabeen, K.; Grossi, G.; Turco, M.; Dada, A.; Palermo, S.A.; Pirouz, B.; Piro, P.; Gnecco, I.; Palla, A. Continuous Simulations for Predicting Green Roof Hydrologic Performance for Future Climate Scenarios. Hydrology 2025, 12, 41. [Google Scholar] [CrossRef]


| Case Study | Shade Analysis Condition | ET Reduction in Shade | Climate | Ref. |
|---|---|---|---|---|
| Montpellier (France) | Agrivoltaic | 33% the ET0 level | Mediterranean climate | [20] |
| 14–29% decrease in actual evapotranspiration (AET) | [21] | |||
| Oregon (US) | Water efficiency increased by 328% | Warm summer Mediterranean climate | [22] | |
| Toronto (Canada) | Bio-solar | 81% in summer and 38% in fall | Continental | [23] |
| Fuyang (China) | Concentrated-lighting Agrivoltaic System (CAS) | Reduced water evaporation in soil surface: 21% | Temperate semi-humid | [24] |
| Even-lighting Agrivoltaic System (EAS) | Reduced water evaporation in soil surface: 33% | |||
| California (US) | Shading greenhouses | 25% | Mediterranean, Arid, Semi-arid | [25] |
| Berlin (Germany) | Tree (Tilia cordata) | 50% | Humid continental | [26] |
| Cooling Technique | Method | PV Temperature Reduction [°C] | Efficiency Enhancement [%] | Study Type | Refs. |
|---|---|---|---|---|---|
| Active air cooling | An inlet/outlet manifold is attached to a parallel array of ducts on the panel’s rear | 30.0 | 4.0 | Experimental | [30] |
| Geothermal air cooling | 9.8 | 23.0 | [31] | ||
| Cooling with a channel under the PV | 5.0 | 2.6 | [32] | ||
| Forced air cooling | 15.0 | 5.7 | [33] | ||
| Active water cooling | Back-surface water cooling | 11.0 | 9.0 | [34] | |
| Water flowing on the anterior surface of the panel | 30.0 | 12.0 | Theoretical and experimental | [35] | |
| Converging channel heat exchanger | 19.0 | 36.0 | [36] | ||
| Heat exchanger cooling | 29.1 | 22.8 | Experimental | [37] | |
| The pipe for water cooling is linked to the PV’s back surface | 12.0 | 2.4 | [38] | ||
| Pulsed-spray water cooling | 26.9 | 28.9 | [39] | ||
| Back-surface spray cooling | 28.2 | 7.8 | [40] | ||
| Active cooling by nanofluids | Heat exchanger on the rear of the panel (Zn-H2O nanofluid) | 18.0 | 7.8 | [41] | |
| Active thermoelectric cooling | Heat sink with thermoelectric module | 35.0 | 18.0 | Theoretical | [42] |
| Heat sink with thermoelectric module | 10.0 | 10.5 | Experimental | [43] | |
| Passive water cooling | Solar-driven rainwater cooling system | 19.0 | 8.3 | Theoretical | [44] |
| Underwater cooling | 34.0 | 11.8 | Experimental | [45] | |
| Heat spreaders and cotton wicks together | 6.1 | 14.0 | [46] | ||
| Atmospheric water sorption–desorption cycle | 10.0 | 16.0 | [47] | ||
| Solar-driven PV cooling | 47.0 | 8.0 | Theoretical and experimental | [48] | |
| Evaporative cooling (Burlap cloth and water) | 20.0 | 14.8 | Experimental | [49] | |
| Passive air cooling | Heat sink (Al and Cu fins) and wick structure on the rear of the panel | 5.2 | 3.1 | [50] | |
| Heat sink | 10.0 | 6.3 | Theoretical | [51] | |
| Natural cooling with a channel under the PV | 10.0 | 4.0 | Theoretical and experimental | [52] | |
| Fin-attached heat sink | 9.5 | 1.1 | Experimental | [53] | |
| Air duct (fins, flat and curved) placed on the rear of the panel | 18.1 | 18.9 | Theoretical | [54] | |
| Passive phase-change material | PCM (RT35HC paraffin wax) | 24.9 | 11.0 | [55] | |
| PCM (paraffin wax) | 4.2 | 1.5 | Experimental | [56] | |
| PCM-integrated natural cooling | 5.4 | 12.4 | Experimental | [57] | |
| Passive radiative cooling | Radiative cooling | 17.2 | 1.6 | Experimental | [58] |
| Night radiative cooling | 5.0 | 6.2 | Theoretical | [59] | |
| Hybrid cooling | Thermoelectric cooling with PCM (RT25) integrated | 27.7 | 3.0 | Theoretical | [60] |
| Radiative cooling with nano- and microstructuring | 5.1 | 3.0 | Theoretical | [61] |
| Type of PV | Efficiency (%) | Temperature Coefficient of Pmax (%) | Refs. | |
|---|---|---|---|---|
| Monocrystalline | 15.0–24.7 | −0.3 to −0.4 | [62,63,64,65] | |
| Polycrystalline | 13.0–20.4 | −0.3 to −1.0 | ||
| PERC | Mono PERC | 17.0–25.0 | −0.4 | [65,66,67,68,69] |
| Poly PERC | 16.0–17.0 | −0.4 | ||
| Thin-film panels | CIGS | 13.0–19.2 | −0.4 | [17,67,70,71,72,73] |
| GaAs | 20.0–25.1 | −0.1 | ||
| CdTe | 9.0–19.5 | −0.2 | ||
| Amorphous silicon (a-Si) | 6.0–12.3 | −0.1 to −0.2 | ||
| Bifacial | Mono or poly | 18.9–23.0 | −0.3 to −0.4 | [74,75,76] |
| Case Study | Type of Analysis | Increase in PV Efficiency | Type of System | Climate | Ref. |
|---|---|---|---|---|---|
| Kansas (US) | Experiment | 1.4% annually, 2.4% in summer | PV-GR | Humid subtropical | [82] |
| Berlin (Germany) | 6.0% | Moderate continental | [83] | ||
| Hong Kong (China) | Experiment (in summer) | 4.3% | Subtropical | [14] | |
| Simulation | 8.3% | ||||
| Toronto (Canada) | - | 2.0% | Continental | [84] | |
| New York (US) | Experiment | 2.4% | Humid subtropical | [85] | |
| Singapore | Experiment and simulation | 2% | Tropical | [86] | |
| Pittsburgh (Russia) | Experiment | 0.8–1.5% | Humid continental | [87] | |
| Malaysia | 1.6% | Tropical climate | [88] | ||
| Sydney (Australia) | 4.5% | Humid subtropical | [10] | ||
| Bucaramanga (Colombia) | 1–1.3% | Warm tropical | [89] | ||
| Nagpur (India) | Model | 18.0% | Agrophotovoltaics | Tropical wet and dry | [90] |
| Portland (US) | Experiment (summer) | 0.7–1.2% | Dianthus PV-GR | Mediterranean climate | [9] |
| Lleida (Spain) | Experiment (a sunny, five-day time period) | 3.3% | Sedum PV-GR | Subtropical (Mediterranean) | [91] |
| 1.3% | Gazania PV-GR |
| Item | Description |
|---|---|
| Solar panel coverage percentage | Six patterns: 10, 20, 30, 40, 50, and 60% |
| Weather data | MeteoNorm 8.2 (2001–2020) |
| Albedo | 20% conventional roof [96], 60% green roof [97] |
| Model for irradiation on the inclined plane | Hay and Davies (software method) |
| Types of PV panels | Polycrystalline, monocrystalline, PERC, and bifacial |
| Inclination (Tilt) | 33° |
| Polycrystalline module specification | Width: 1 m × 1.6 m, Efficiency: 14.7%, Nominal power: 240.0 W, MPP voltage: 29.9 V, MPP current: 8.0 A |
| Monocrystalline module specification | Width: 1 m × 1.6 m, Efficiency: 15.6%, Nominal power: 255.0 W, MPP voltage: 30.9 V, MPP current: 8.3 A |
| PERC module specification | Width: 1 m × 1.6 m, Efficiency: 20.3%, Nominal power: 335.0 W, MPP voltage: 35.66 V, MPP current: 9.4 A |
| Bifacial module specification | Width: 1 m × 1.6 m, Efficiency: 18.9%, Nominal power: 310.0 W, MPP voltage: 31.1 V, MPP current: 10.0 A |
| Dimensions of solar panels | Length: 1.5 m, Width: 1 m, Installation height: 0.4 m |
| ET (Water Consumed by Plants) Reduction Rate in Different Sections of Bio-Solar GR | White | Green | Yellow | Red | |
|---|---|---|---|---|---|
| 0% Shade | Near 0% Shade | 33% Shade | 100% Shade | ||
| Min | 14% | 1.0 | 1.0 | 1.0 | 0.9 |
| Max | 33% | 1.0 | 1.0 | 0.9 | 0.7 |
Disclaimer/Publisher’s Note: The statements, opinions and data contained in all publications are solely those of the individual author(s) and contributor(s) and not of MDPI and/or the editor(s). MDPI and/or the editor(s) disclaim responsibility for any injury to people or property resulting from any ideas, methods, instructions or products referred to in the content. |
© 2025 by the authors. Licensee MDPI, Basel, Switzerland. This article is an open access article distributed under the terms and conditions of the Creative Commons Attribution (CC BY) license (https://creativecommons.org/licenses/by/4.0/).
Share and Cite
Pirouz, B.; Naghib, S.N.; Kontoleon, K.J.; Bibin, B.S.; Javadi Nejad, H.; Piro, P. Investigation of the Interaction of Water and Energy in Multipurpose Bio-Solar Green Roofs in Mediterranean Climatic Conditions. Water 2025, 17, 950. https://doi.org/10.3390/w17070950
Pirouz B, Naghib SN, Kontoleon KJ, Bibin BS, Javadi Nejad H, Piro P. Investigation of the Interaction of Water and Energy in Multipurpose Bio-Solar Green Roofs in Mediterranean Climatic Conditions. Water. 2025; 17(7):950. https://doi.org/10.3390/w17070950
Chicago/Turabian StylePirouz, Behrouz, Seyed Navid Naghib, Karolos J. Kontoleon, Baiju S. Bibin, Hana Javadi Nejad, and Patrizia Piro. 2025. "Investigation of the Interaction of Water and Energy in Multipurpose Bio-Solar Green Roofs in Mediterranean Climatic Conditions" Water 17, no. 7: 950. https://doi.org/10.3390/w17070950
APA StylePirouz, B., Naghib, S. N., Kontoleon, K. J., Bibin, B. S., Javadi Nejad, H., & Piro, P. (2025). Investigation of the Interaction of Water and Energy in Multipurpose Bio-Solar Green Roofs in Mediterranean Climatic Conditions. Water, 17(7), 950. https://doi.org/10.3390/w17070950