Article

The Effects of Runoff and Erosion Hydrodynamics by Check Dams Under Different Precipitation Types in the Watershed of Loess Plateau

1
Power China Northwest Engineering Corporation Limited, Xi’an 710065, China
2
Shaanxi Province Institute of Water Resources and Electric Power Survey and Design Investigation, Xi’an 710005, China
3
State Key Laboratory of Water Engineering Ecology and Environment in Arid Area, Xi’an University of Technology, Xi’an 710048, China
*
Author to whom correspondence should be addressed.
Water 2025, 17(7), 947; https://doi.org/10.3390/w17070947
Submission received: 6 February 2025 / Revised: 21 March 2025 / Accepted: 21 March 2025 / Published: 25 March 2025
(This article belongs to the Section Hydraulics and Hydrodynamics)

Abstract

:
As one of the most important soil and water conservation engineering measures, the check dam plays an important role in the process of soil erosion control on the Loess Plateau of China. Combined with the hydrodynamic model, the regulation effects of runoff and erosion hydrodynamics on check dams was studied under different precipitation types in the Xiliugou watershed of Loess Plateau. The Xiliugou watershed is dominated by the four precipitation types, short duration and small total amounts (P1), long duration and small total amounts (small total amounts), short duration and larger total amounts (P3) and short duration and largest total amounts (P4). The results show that the peak flow time may lag behind in the upper and middle reaches, while it may be advanced in the downstream in the parallel layout of the dam system watershed. The check dam system plays a significant role in reducing runoff and erosion hydrodynamics. The construction of check dams results in a significant reduction in the peak flow under the P2 precipitation type, reaching 39.41%. For the average maximum velocity, runoff shear stress and runoff power along the main channel, the P2 precipitation type results in a significant reduction in hydrodynamics in the dam system watershed, reaching 16.72%, 21.44% and 33.10%, respectively. However, for peak velocity, runoff shear stress and runoff power along the main channel, the P3 precipitation type results in a significant reduction in hydrodynamics in the dam system watershed, reaching 14.34%, 19.99% and 31.42%, respectively. The regulation effect of the check dam system on erosion hydrodynamics is stronger in the middle reaches and gradually weakened in the lower reaches of the watershed.

1. Introduction

The Loess Plateau has garnered significant attention from both domestic and international scholars due to severe soil erosion and land degradation [1], stemming from factors such as intense rainfall [2], sparse vegetation [3], and high soil erodibility, leading to a landscape of numerous ravines and degraded soil [4,5]. To address the severe phenomenon of soil and water loss, a series of soil and water conservation measures have been implemented [6]. Among these measures, the check dam is the most significant channel management strategy in the Loess Plateau, utilized to trap sediment, control gully erosion, and mitigate flood and sediment-related disasters [7,8,9,10,11]. Check dams primarily act on the hydrological processes of watersheds by intercepting surface runoff and enhancing infiltration [12]. Among these effects, the regulation of surface runoff processes primarily shows a significant reduction in peak flow and flood volume [13], extended flood detention time [14], and delayed peak arrival [15,16,17,18,19]. Different check dam system arrangements have varying impacts on runoff processes [20]. Numerical simulations and laboratory experiments both show that hybrid check dam layouts have the greatest effect on watershed flood processes [21]. Huang [22] assessed the impact of check dam systems on watershed water redistribution and found that they can effectively reduce surface runoff in the watershed by 60%. On the other hand, check dams alter their regulation methods of floods during different stages of deposition. In the early stages, they mainly intercept completely, while in the later stages, they shift to peak shaving and flood detention [23]. Due to the sediment deposition in the check dam land raising the erosion base level of the channel, even under near-full sedimentation conditions, the backwater effect at the downstream end of the deposition area can still slow down the upstream runoff erosion process [24]. By regulating runoff, check dams have a further significant impact on diminishing the erosion dynamics of channel floods [25]. Under the same precipitation conditions, the erosion energy along the channel have decreased to varying extents [26,27]. This implies that as runoff continuously converges and is transferred downstream, the sediment production from channel erosion decreases [28]. Research by Poeppl [29] and Díaz [30] indicates that check dams alter the riverbed slope and channel depth, reducing or interrupting the connectivity of watershed runoff and sediment, thereby diminishing the capacity of river channels to transport water and sediment. Castillo [31] has also observed this phenomenon through field investigations, indicating that check dams intercept sediment, leading to a reduction in the longitudinal slope of the river channel, with greater sediment deposition upstream than erosion downstream.
Although significant progress has been made in the study of check dams on the Loess Plateau, studies in other similar regions around the globe (e.g., the Great Plains of the United States of America, the Sahel region of Africa, and the arid zones of Australia) have shown that the problems of soil erosion and land degradation are equally prevalent in these regions [32,33,34,35]. For example, the gully erosion problem in the Great Plains of the United States has similarities with the Loess Plateau [36], while land degradation in the Sahelian region of Africa is closely related to climate change and human activities [37]. Experiences from these regions suggest that check dams or other similar engineering measures have a wide potential for application on a global scale. However, significant differences in precipitation characteristics, topographic conditions and soil properties in different regions may lead to different hydrological and erosion control effects of check dams [38,39]. Therefore, a systematic study of the effects of check dams on runoff and erosion dynamics under different precipitation characteristics is of great significance for optimizing soil and water conservation measures and achieving sustainable regional development.
Based on the above background, this study used the MIKE-SHE and MIKE-11 coupled models to analyze the regulation of runoff processes in the study area by the newly constructed check dam system under typical rainfall conditions, and to reveal the mechanism of the check dam system’s influence on the change in channel erosion dynamics. The results of this study not only provide a scientific basis for soil and water conservation in the Loess Plateau, but also provide an important reference for ecological environment management and water resources management in similar regions around the world.

2. Model Establishment
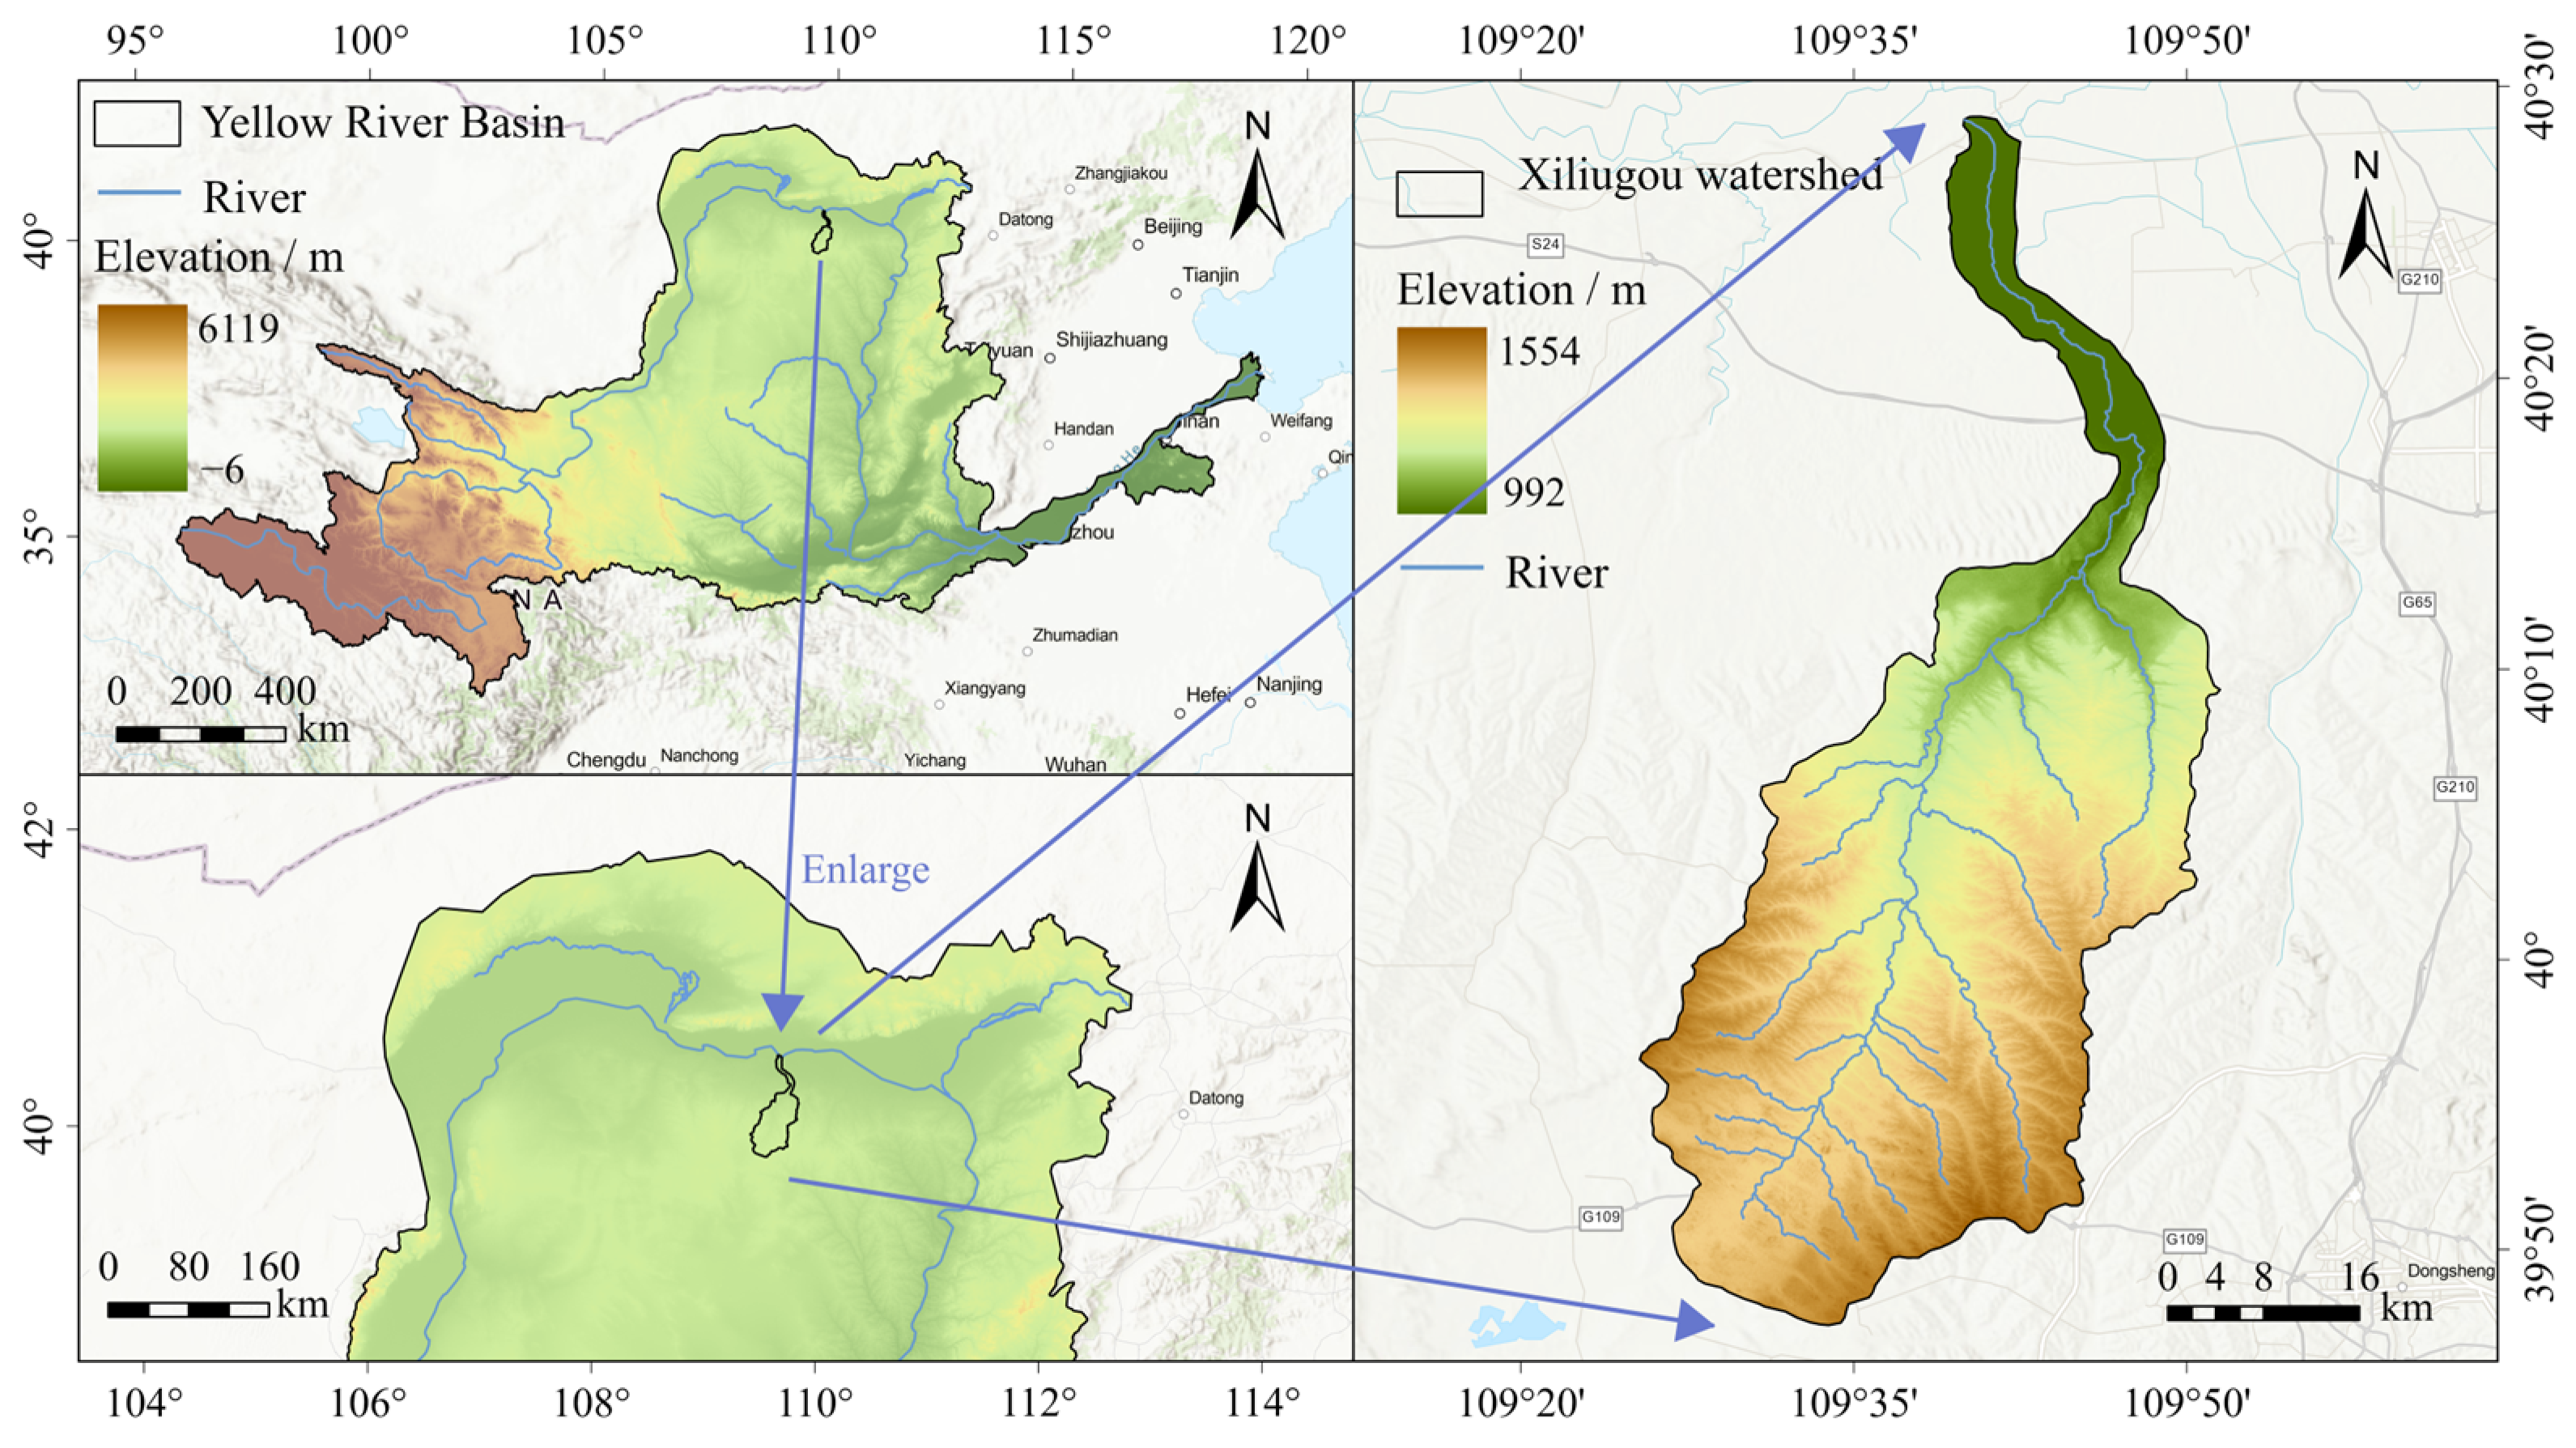
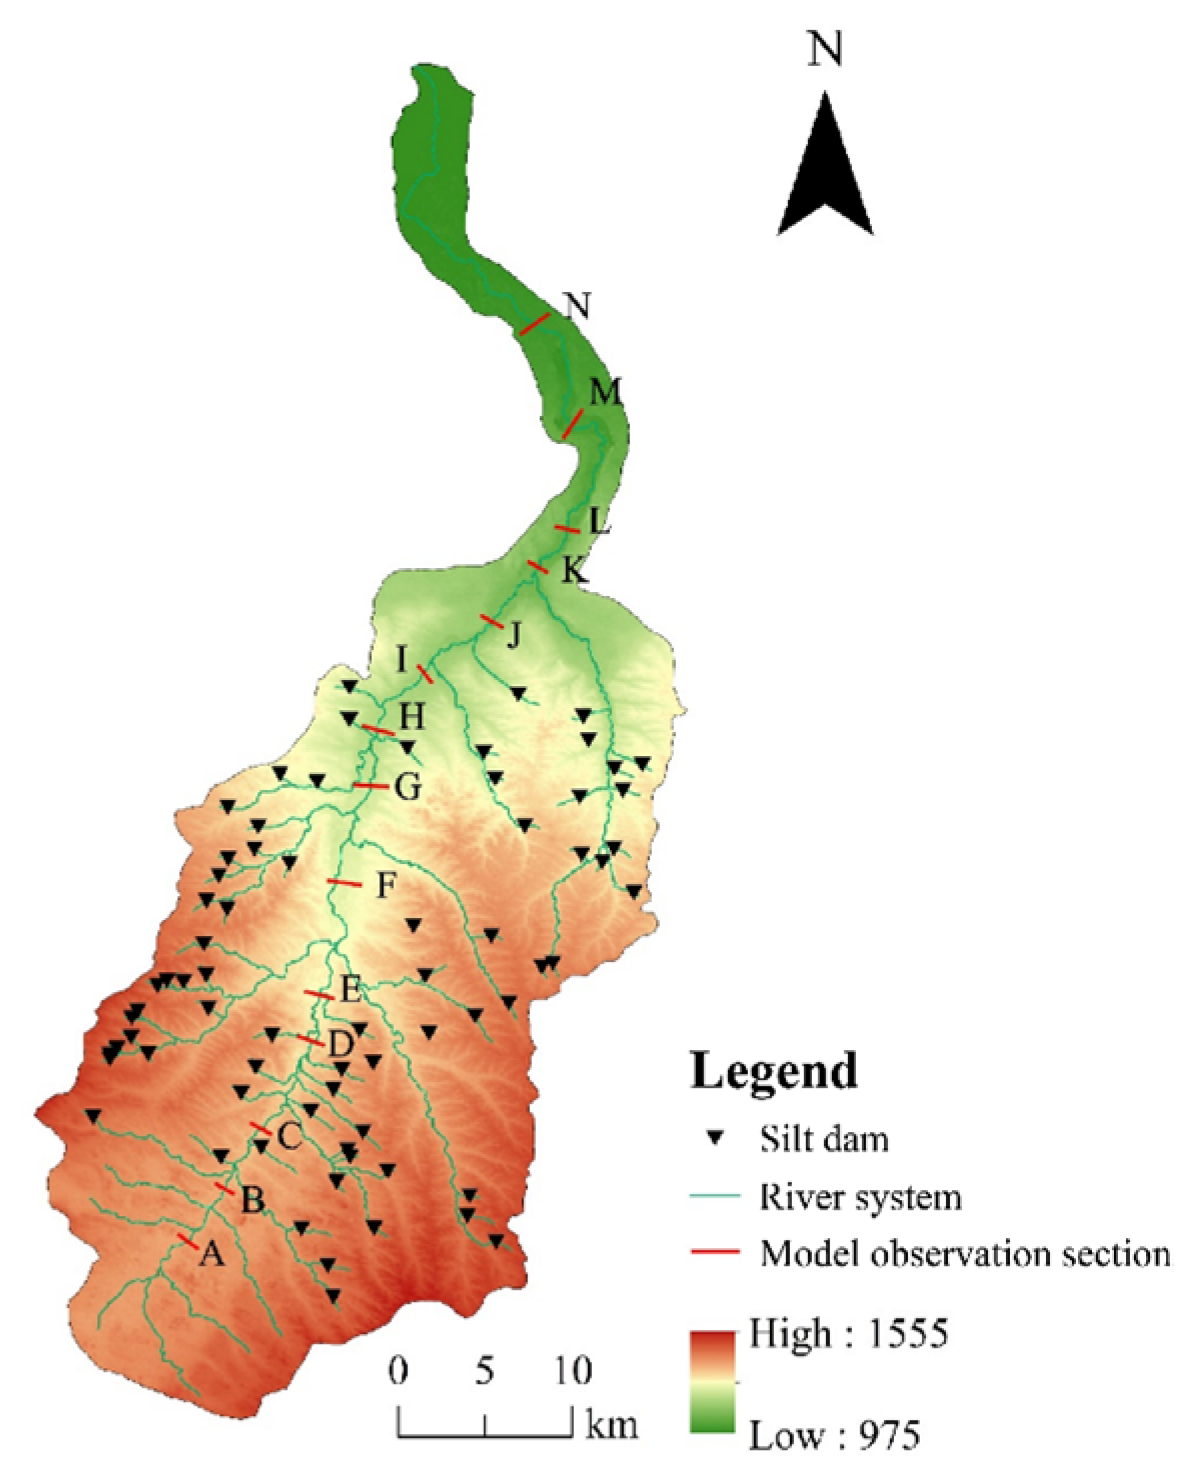
2.1. Study Area

The Xiliugou watershed is located in Ordos City, Inner Mongolia Autonomous Region, geographically located between 109°24′ and 110°00′ east longitude and 39°47′ and 40°30′ north latitude. The basin covers an area of 1192.4 km2, with rugged terrain, sparse vegetation and serious soil erosion. It originates from the top of Zhangjia Mountain in Danglai Township, Dongsheng District, and flows into the Yellow River from Hebian Village, Zhaogun Tomb Township, with a total length of 106.5 km, and the average longitudinal drop of the river channel is 3.6‰. The basin has a semi-arid continental climate, with obvious differences in seasonal changes, an average precipitation of 271.2 mm and an average temperature of 6.4 °C. The relative geographical location of the study area in the Yellow River basin is shown in Figure 1.
There are 144 existing check dams in the study area (Figure 2), which can be classified into two categories according to their engineering scale: small-sized check dams (70.1%) with a height of 9.5–16.5 m, a total reservoir capacity of 8.19 × 10⁴–45.25 × 10⁴ m3, and siltation areas of 1.94–16.13 hm2, which are mainly located in the Zhimao ditch upstream; medium-sized check dam (29.9%) dam height 12–17.5 m, total capacity 37.97 × 10⁴–155.25 × 10⁴ m3, silt area 7.12–55.14 hm2, mostly located in the key nodes of the main river channel. New construction accounts for 82.6% of the total, of which 18 medium-sized dams have been implemented by raising and thickening for reconstruction and expansion, forming a gradient sand-blocking system.

2.2. MIKE-SHE Model Construction

2.2.1. Model Scope and Grid Division

This study uses the watershed divide of the Xiliugou watershed as the boundary to define the model extent [40]. The simulation size of the Xiliugou watershed is determined to be 1192 km2. The model developed in this study is primarily used to simulate watershed flood events, and the grid size of the simulation will have a certain impact on the model’s computation and simulation process. A finer grid resolution helps in more comprehensively representing the terrain data of the watershed and allows for more accurate simulations of surface runoff and flow convergence processes [41]. Therefore, considering the size of the study area and the resolution of the DEM, the grid scale for watershed spatial discretization is chosen to be 100 × 100 m, resulting in a total of 314,000 grid cells.

2.2.2. Watershed Terrain Setting

To simulate watershed hydrological processes based on spatial terrain differences, the MIKE-SHE model typically accepts terrain input data in its proprietary spatial grid data format (*.dfs2) or direct input of shape format data. The model can further perform interpolation using various methods such as triangular and bilinear interpolation based on these data [42]. In this study, the DEM is converted into shapefiles containing elevation information and inputted into the model, employing triangular interpolation for further processing. With reference to the grid division scale, a search radius of 100 m is set. The terrain results in MIKE-SHE are illustrated in Figure 3.

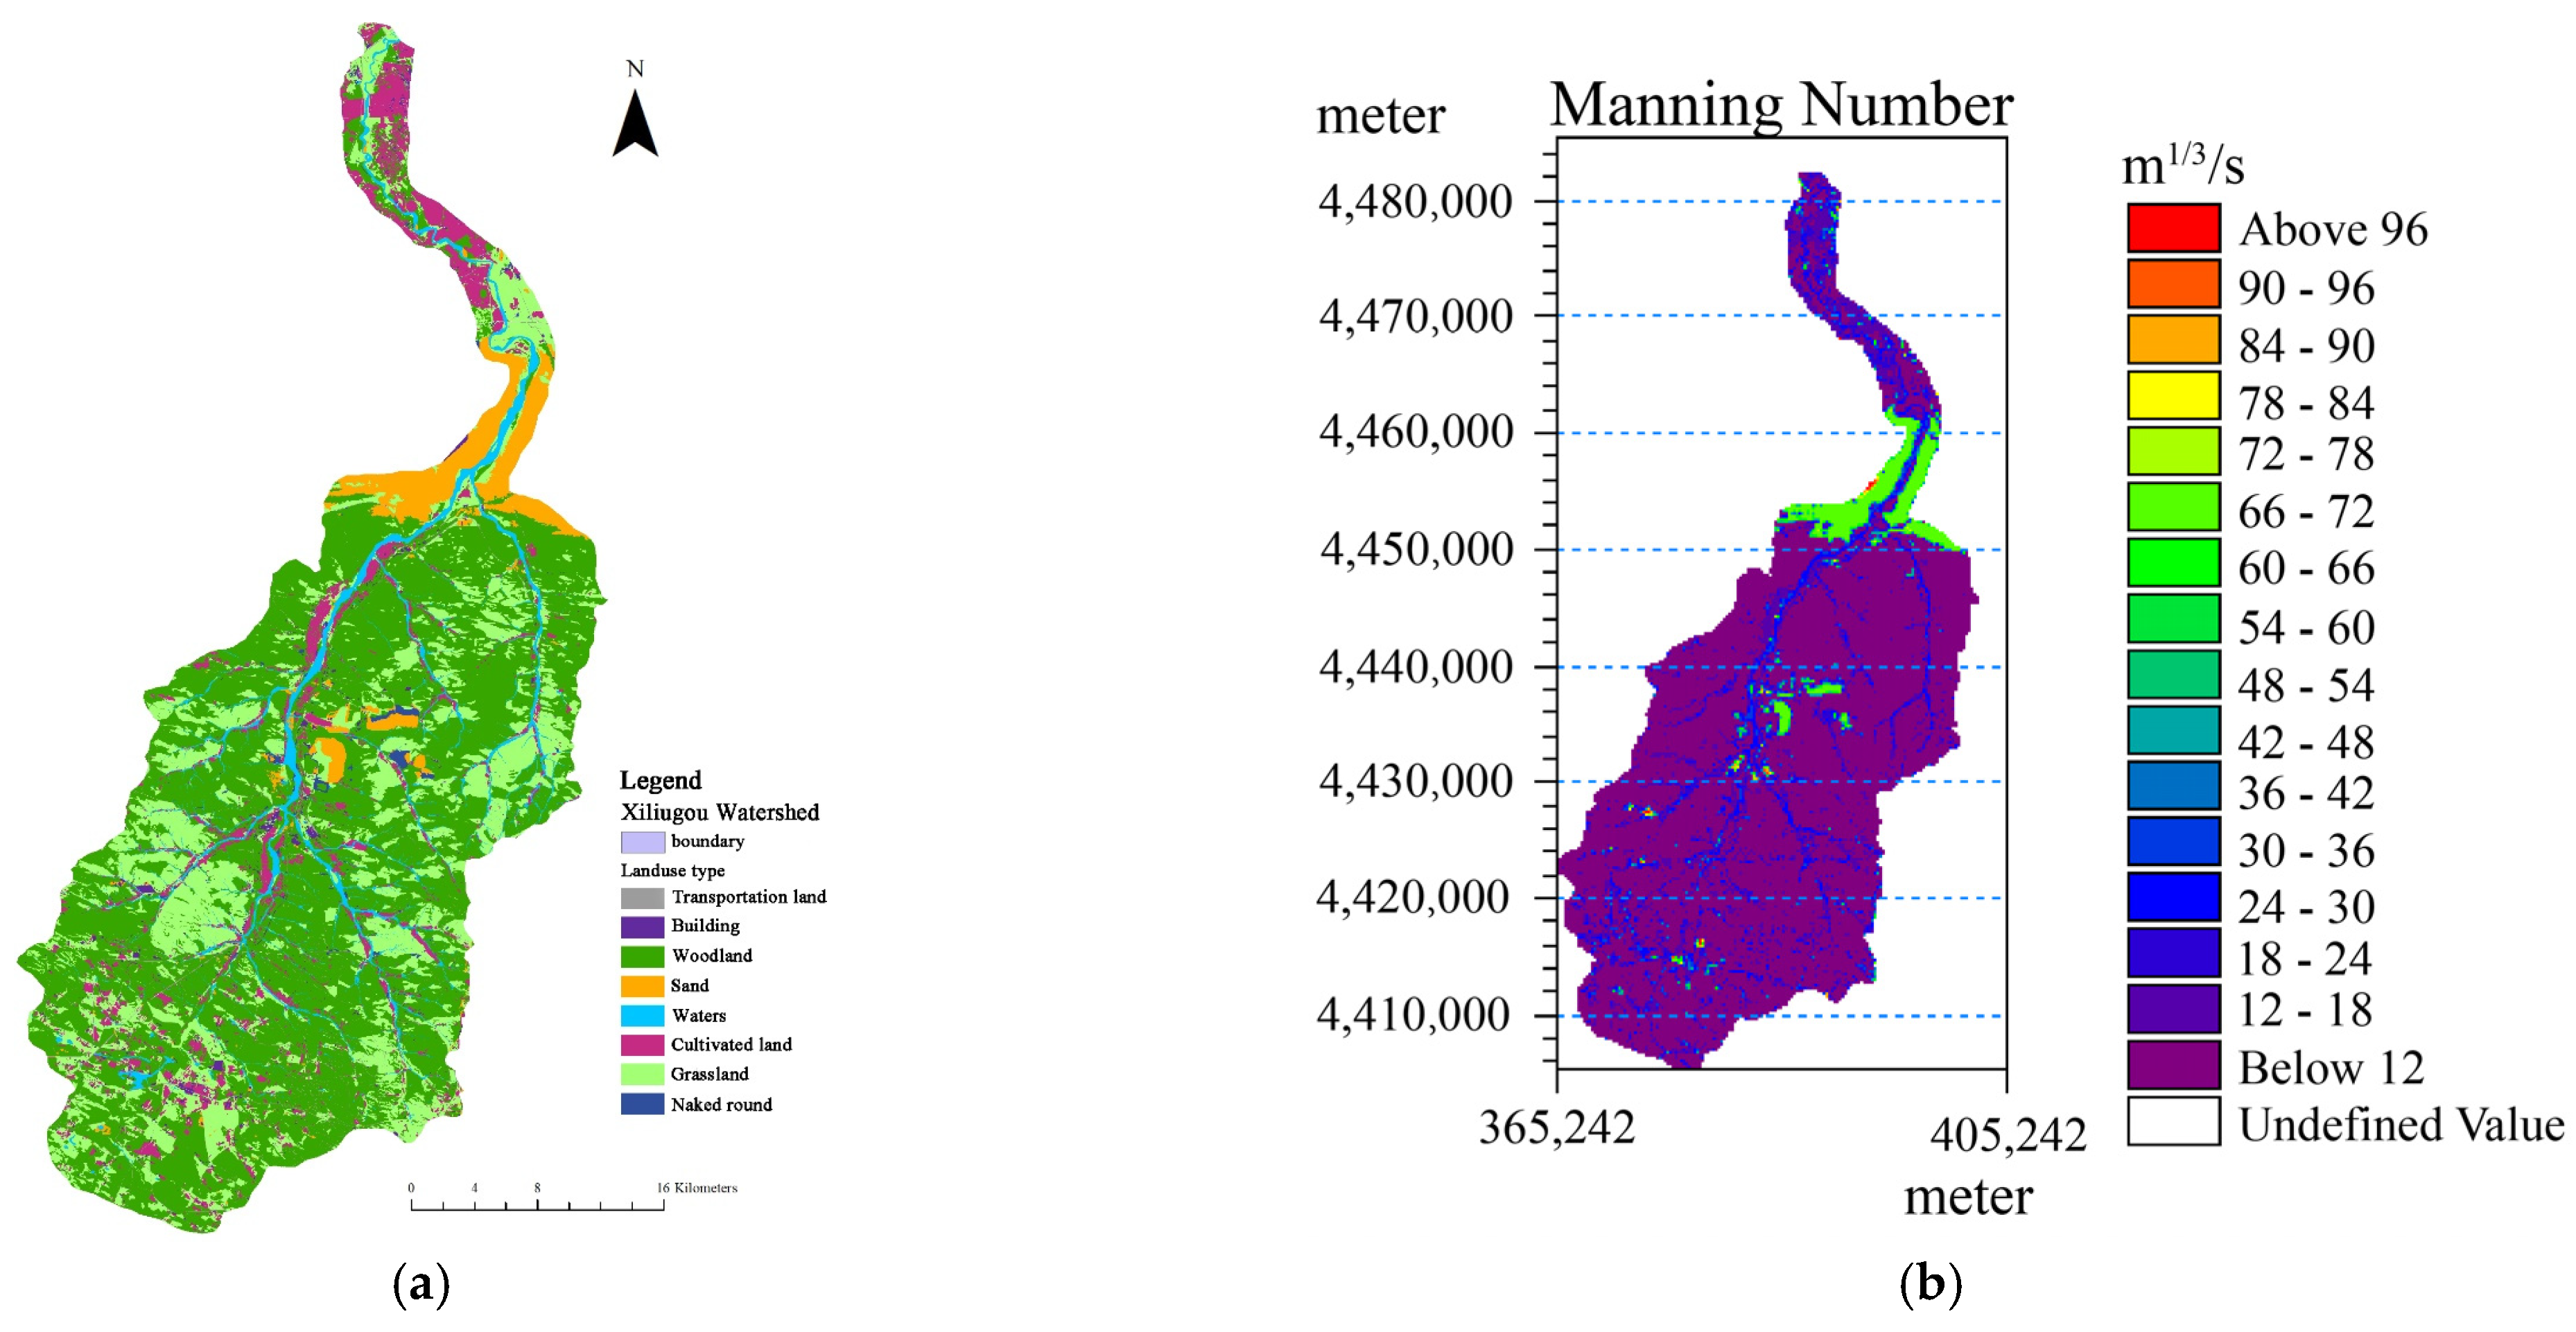
2.2.3. The Slope Flow Module

This module encompasses three parameters: the Manning number, detention storage, and initial water depth on the surface. In practical applications, observational variables need to be adjusted or calibrated, and the number of parameters should be minimized during model calibration. Thus, detention storage and initial water depth are set as uniform values across the watershed, and values for the Manning number were assigned based on land use type. Based on Engman [43], the Manning number values for various land types in the Xiliugou watershed are detailed in Table 1. Furthermore, the net precipitation input into the model subtracts the soil stable infiltration rate to depict the soil infiltration process. The values for the infiltration rate are primarily derived from empirical values proposed by relevant studies [24,26,43] for various land use types, with the reference infiltration rates for different land uses detailed in Table 1. The distribution of different land uses in the Xiliugou watershed and the assignment of the Manning number in the model are illustrated in Figure 4.

2.3. MIKE-11 Model Construction

In this research, the MIKE-SHE model encompasses the river and lake module (OC), implemented through coupling with the MIKE-11 model, involving four primary files: the river network file (.nwk11), the cross-section file (.xns11), the boundary file (.bnd11), and the parameter file (.hd11).
(1)
The river network file (*.nwk11)
This research employed ArcGIS 10.2 software to extract the Xiliugou watershed river network system (*shp) from a DEM with a resolution of 30 m. In total, 18 channels were imported into the Xiliugou watershed, including ZG (Main channel) and zhi01-zhi17 (the tributaries).
(2)
The cross-section file (*.xns11)
The three-dimensional shape of the river channel is described by the cross-section file, where the width of the river surface and flow quantity at a specific water level are affected by the geometric dimensions of the cross-section, and the flow direction is determined by the height difference between neighboring cross-sections.
(3)
The boundary file (*.bnd11)
The boundary file for the Xi Liugou watershed generally necessitates the provision of external and internal boundary conditions.
These boundary conditions should be defined according to real-world conditions, since although the specification of internal boundary conditions does not affect model performance, it can influence the accuracy of the simulation results. To guarantee stable operation of the model, the upstream boundary flow for all watercourses in the Xi Liugou watershed is defined as 0.001 m/s, whereas a fixed water level is assigned to the downstream boundary of the main river channel. All boundary attributes are defined as open boundaries.
(4)
Dynamic parameter file (*.hd11)
The dynamic parameter file serves to define hydrodynamic variables and parameters associated with hydrological model computations. In this research, the initial water depth is determined using the first method, and the bed roughness is established through calibration.

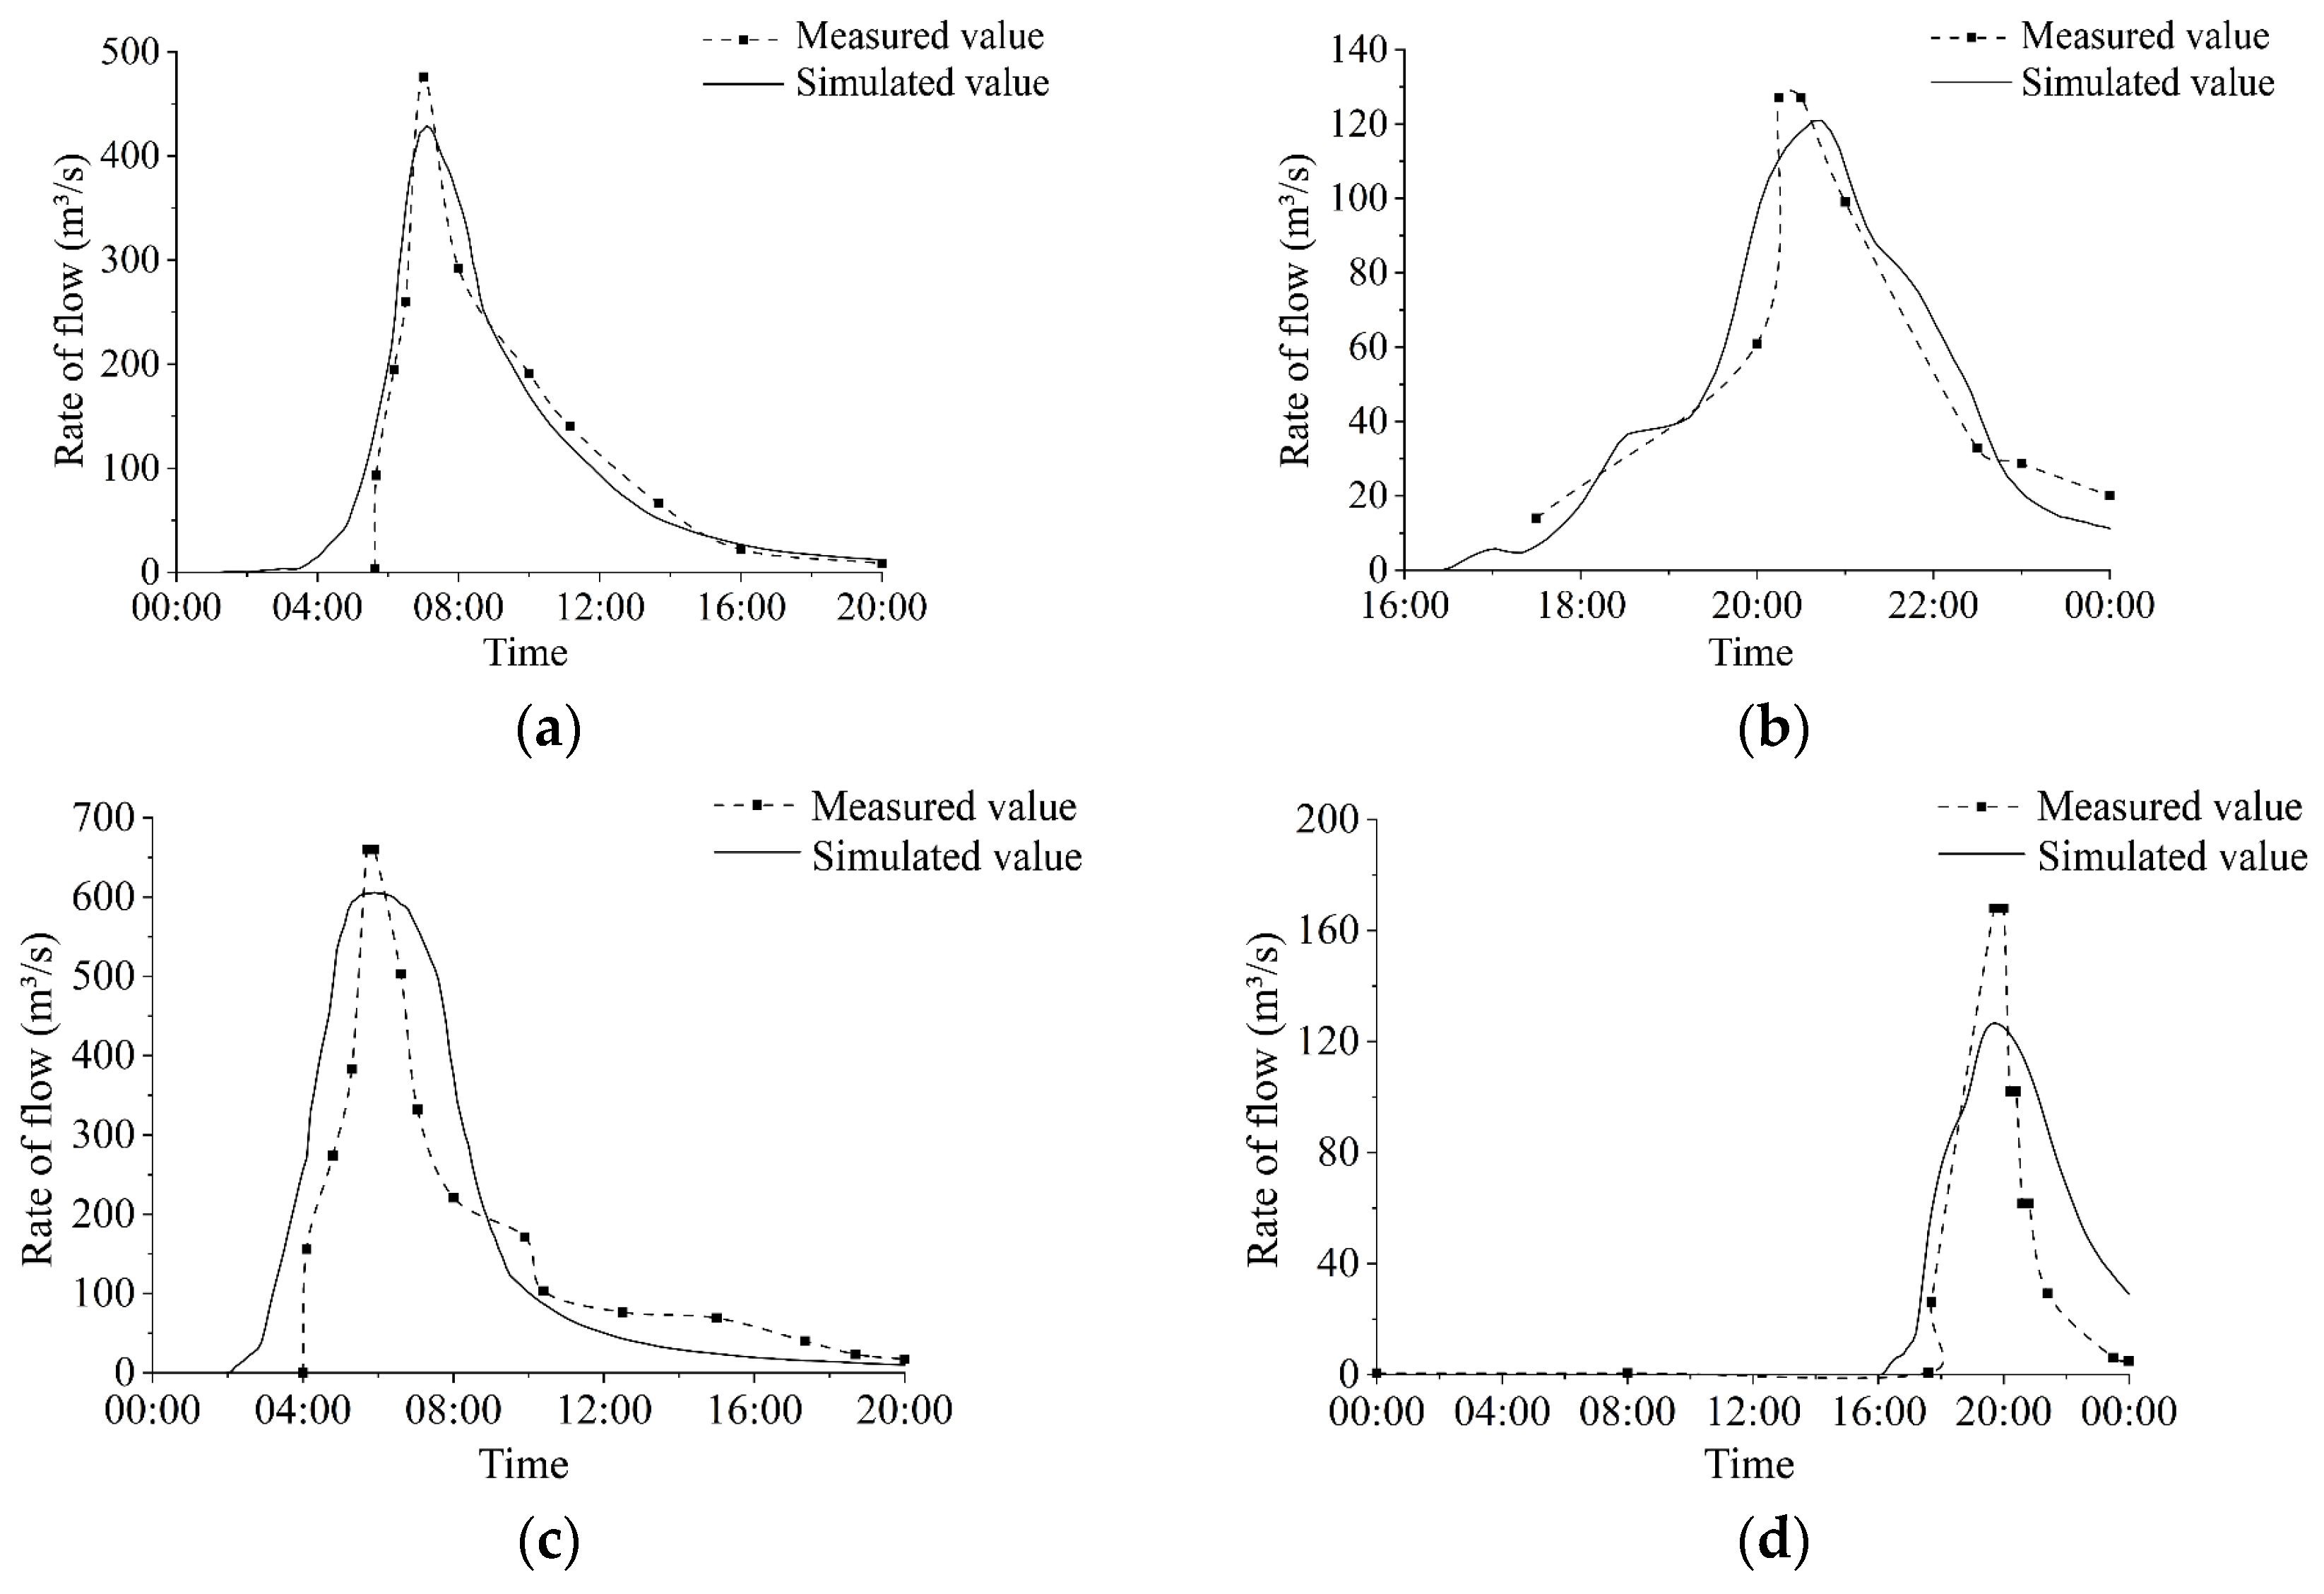
2.4. Calibration and Validation

After constructing the hydrological–hydrodynamic model, calibration and validation are necessary, which involves assessing the model’s reliability. Commonly, three indicators are employed for verification [44]: the Nash–Sutcliffe efficiency coefficient ( N S E ), the coefficient of determination ( R 2 ), and the relative error ( R e ) as the discriminant parameters. The N S E is a dimensionless index of goodness-of-fit, used to assess the model’s capability to simulate changes in runoff hydrological curves, with a value ranging from 0 to 1. Values of the N S E closer to 1 indicate a higher degree of fit between observed and simulated data, while N S E values ≤ 0.5 suggest poor reliability of the simulation results [45]. The evaluation is performed using the following formula:
N S E = 1 i = 1 n ( S i O i ) 2 i = 1 n ( O i o ¯ ) 2 ( , 1 ]
where n represents the length of the data sequence; Q i represents the observed data; S i denotes the simulated data; o ¯ is the mean value of the observed data.
R 2 indicates the linear correlation between the actual runoff and the simulated process values, and is calculated using the following formula:
R 2 = i = 1 n ( O i o ¯ ) ( S i s ¯ ) i = 1 n ( O i o ¯ ) 2 i = 1 n ( S i s ¯ ) 2 2
where s ¯ denotes the mean value of the simulated data.
R e indicates the deviation between the measured and simulated values, primarily calculated using the following formula:
R e = ( S i O i ) O i
In this study, the measured flow processes at the Longtouguai hydrological station, located at the watershed’s river outlet, are used as the reference values for model calibration. The selected rainfall and flood events should encompass various magnitudes. Furthermore, each event should feature complete data, high accuracy, and a full rising and receding water process. Moreover, the chosen rainfall and flood events are typical of the front-concentrated type (precipitation concentrated in the early stage) commonly observed in the study area. Among them, two rainstorm flood events from 1975 and 1979 were utilized for model calibration (Figure 5a,b), and two rainstorm flood events from 1984 to 1988 were used for model verification (Figure 5c,d). Following calibration and validation, R e of the peak flow during the calibration period were 9.91% and 4.74%, respectively, N S E were 0.81 and 0.87, and R 2 were 0.86 and 0.88, respectively. During the validation period, R e were 8.22% and 11.03%, N S E were 0.64 and 0.66, and R 2 were 0.78 and 0.71, respectively (Table 2). The results indicate that N S E values were greater than 0.6 during both the calibration and validation periods, thus the model constructed in this study demonstrates high reliability.

2.5. Simulation Scenario Setting

(1)
Conditions of check dam system construction
To simulate the impact of the construction of the Xiliugou check dam system on the flood processes in the watershed’s channels, construction scenarios for the check dam system in the Xiliugou watershed were set up. Primarily using the detention storage feature in MIKE-SHE to reflect the storage effect of the check dams, indicating that only floods exceeding the designated detention storage can flow downstream. Two scenarios are configured, with WB denoting a watershed without check dams and YB denoting a watershed with check dams.
(2)
Determination of model precipitation conditions
To analyze the regulatory effects of the Xiliugou watershed check dam system on flood processes of various magnitudes and channel runoff erosion dynamics, this study used the total precipitation and duration of 1017 events over the past 30 years in Xiliugou as variables. Employing the K-means clustering method, it categorizes all precipitation events into four types. The results of the precipitation clustering analysis are used as the input conditions for the numerical model’s precipitation, and the flood processes of the watershed under each precipitation condition are separately simulated. The categorization results of precipitation types are presented in Table 3.
Table 3 shows that the Xiliugou watershed is dominated by P1 type of precipitation, featuring short duration and small total amounts, while P4 type of heavy rain, with short duration but large total amounts, is the least common. Using Fisher’s linear discriminant function for validation, the discriminant function for the precipitation clustering results of the Xiliugou watershed is presented in Equation (4), with the clustering results illustrated in Figure 6. As shown in the figure, the scatter plot of the discriminant functions for the four types of precipitation exhibits a high degree of clustering, signifying that the classification results are largely reasonable.
G 1 = 1.192 P + 0.207 T 14.85 G 2 = 0.153 P + 0.211 T 1.768 G 3 = 5.647 P 0.481 T 295.229 G 4 = 3.109 P 0.181 T 0.504
where G k ( k = 1, 2, 3, 4) denotes the classification score for the k -th group; P represents the amount of precipitation; T represents the duration of precipitation.
Taking into account the precipitation features across various regions in China and the temporal variations in rainfall intensity, it is evident that precipitation in the Yellow River watershed predominantly shows a front-loaded pattern [46]. This finding can be extended to the Xiliugou watershed. Based on the precipitation process distribution in the Xiliugou watershed and combined with the precipitation amounts from different clusters, the precipitation events were classified into different types, ultimately resulting in precipitation process curves for four types of rainfall in the Xiliugou watershed (refer to Figure 7).
As P1 rainfall process fails to meet the criteria for runoff generation and erosive conditions [47], only the flood processes under the remaining three rainfall conditions are considered in this research. Integrating the scenarios for the construction of check dams in the watershed as detailed in the preceding section, the simulated conditions of the Xiliugou hydrological and hydrodynamic model are illustrated in Figure 8.

3. The Regulating Effect of Check Dam Systems on Runoff Process

Building on the previous study, which examined the impact of sediment detention check dams on flood processes at the watershed outlet, check dams influence runoff in several ways. They affect infiltration and evaporation losses, and they alter the timing of discharge peaks from the tributaries. [48]. The distribution of the Xiliugou check dam system (Figure 9) shows that check dams are mainly located in the primary and secondary tributaries. How will the interception of upstream runoff by these check dams change the watershed’s water system confluence process?
Building on the above concerns, this section examines the flood characteristics at various cross-sections along the Xiliugou main channel, investigating the effects of the check dam system on flood processes at different main channel cross-sections. The cross-sections chosen are illustrated in Figure 10, with their distance details as below: Cross-section A (5017 m), Cross-section B (9551 m), Cross-section C (15,145 m), Cross-section D (20,075 m), Cross-section E (24,923 m), Cross-section F (33,606 m), Cross-section G (40,383 m), Cross-section H (44,803 m), Cross-section I (50,332 m), Cross-section J (56,054 m), Cross-section K (60,751 m), Cross-section L (64,384 m), Cross-section M (74,605 m), and Cross-section N (84,560 m). Looking at peak flow, peak reduction rate, and time lag of peak occurrence at each cross-section as the fundamental elements to depict the flood process, taking into account the effects of the check dam system construction on these three metrics.
Figure 10a illustrates the peak flow at each cross-section along the main gully of the Xiliugou watershed under various precipitation conditions with and without check dam construction. As observed from Figure 10a, with the increase in distance along the main gully, the peak flow across the cross-sections under all six scenarios demonstrates an increasing trend, with the peak flow under the P2 precipitation type showing a slower increase and the peak flow under the P4 precipitation type exhibiting the most significant increase, while check dam construction markedly reduces the peak flow at all cross-sections. Figure 10b presents the peak flow reduction rate at each cross-section along the main gully of the Xiliugou watershed under various precipitation conditions with and without check dam construction. As depicted in Figure 10b, there is no reduction in peak flow at upstream cross-sections A and B, but starting from cross-section C, peak flow shows varying degrees of reduction under different rainfall intensities, notably higher peak flow reduction rates are seen at cross-sections D through J.
Table 4 shows the statistical results of peak discharge along the main channel of the Xiliugou watershed under different precipitation conditions, comparing dam and no-dam scenarios. As observed in Table 4, the dam system decreases the average peak discharge in the main gully by 39.41% under the P2 precipitation condition, the reduction amounts to 38.54% under the P3 precipitation condition, and the reduction is 37.07% under the P4 precipitation condition. Furthermore, comparison of the standard deviations ( S T D ) of peak discharge in the main gully across various scenarios shows, that under different precipitation conditions, the S T D of peak discharge in the main gully is lower in dam construction situations compared to those without dam construction, indicating that dam system construction can modify flood transport in the gully, resulting in a more stable flood process.
As depicted in Figure 11, each point on the graph is derived from the subtraction of the peak appearance time under the dam construction scenario from that under the no-dam scenario. From the graph, it can be seen that from cross-section C to cross-section G in the main gully, the dam system causes a delay in the peak flow to varying degrees; however, beginning from cross-section H, the peak flow in the main gully of the basin un-der the dam construction scenario manifests earlier in comparison to the no-dam scenario.

4. The Influence of Check Dam Systems on the Erosion Dynamics of Channels

Check dams can have a marked regulatory effect on the runoff transport processes within a watershed, and additionally, the runoff can lead to considerable changes in the channel erosion processes. Thus, this section focuses on the dynamics of runoff erosion, by simulating the hydrodynamic processes of the channel under various conditions, calculating the flow velocity, runoff shear stress, and runoff power changes along the channel sections, to elucidate the regulatory effects of check dams on the runoff erosion processes in the channel. Additionally, to explore the dynamic regulation effects of the tributary check dam system on different cross-sections along the main gully of the watershed, a differential analysis of dynamic parameters is performed based on the 14 cross-sections of the main gully in the Xiliugou watershed discussed in the preceding section.
The MIKE-11 hydrodynamic model calculates the cross-sectional runoff at each time step by solving the Saint-Venant equations, and the average flow velocity for each cross-section can be obtained by dividing by the wetted area of that cross-section. The model is capable of providing direct outputs of the cross-sectional flow velocity results:
V = Q / A
where V is the average flow velocity at the cross-section, m/s; Q is the cross-sectional flow, m3/s; A is the wetted area of the cross-section, m2.
The shear stress of runoff in the channel is calculated using the formula advanced by Foster [49]:
τ = γ R J
where τ is the shear stress of runoff, in N/m2; γ is the specific weight of the water, in kg/m3; R is the hydraulic radius, in m; J is the hydraulic slope.
The runoff power, which is the rate of change in potential energy per unit area over time, is calculated using the following equation [50]:
ω = τ V
where ω is the runoff power, in N/(m·s); V is the average flow velocity, in m/s.

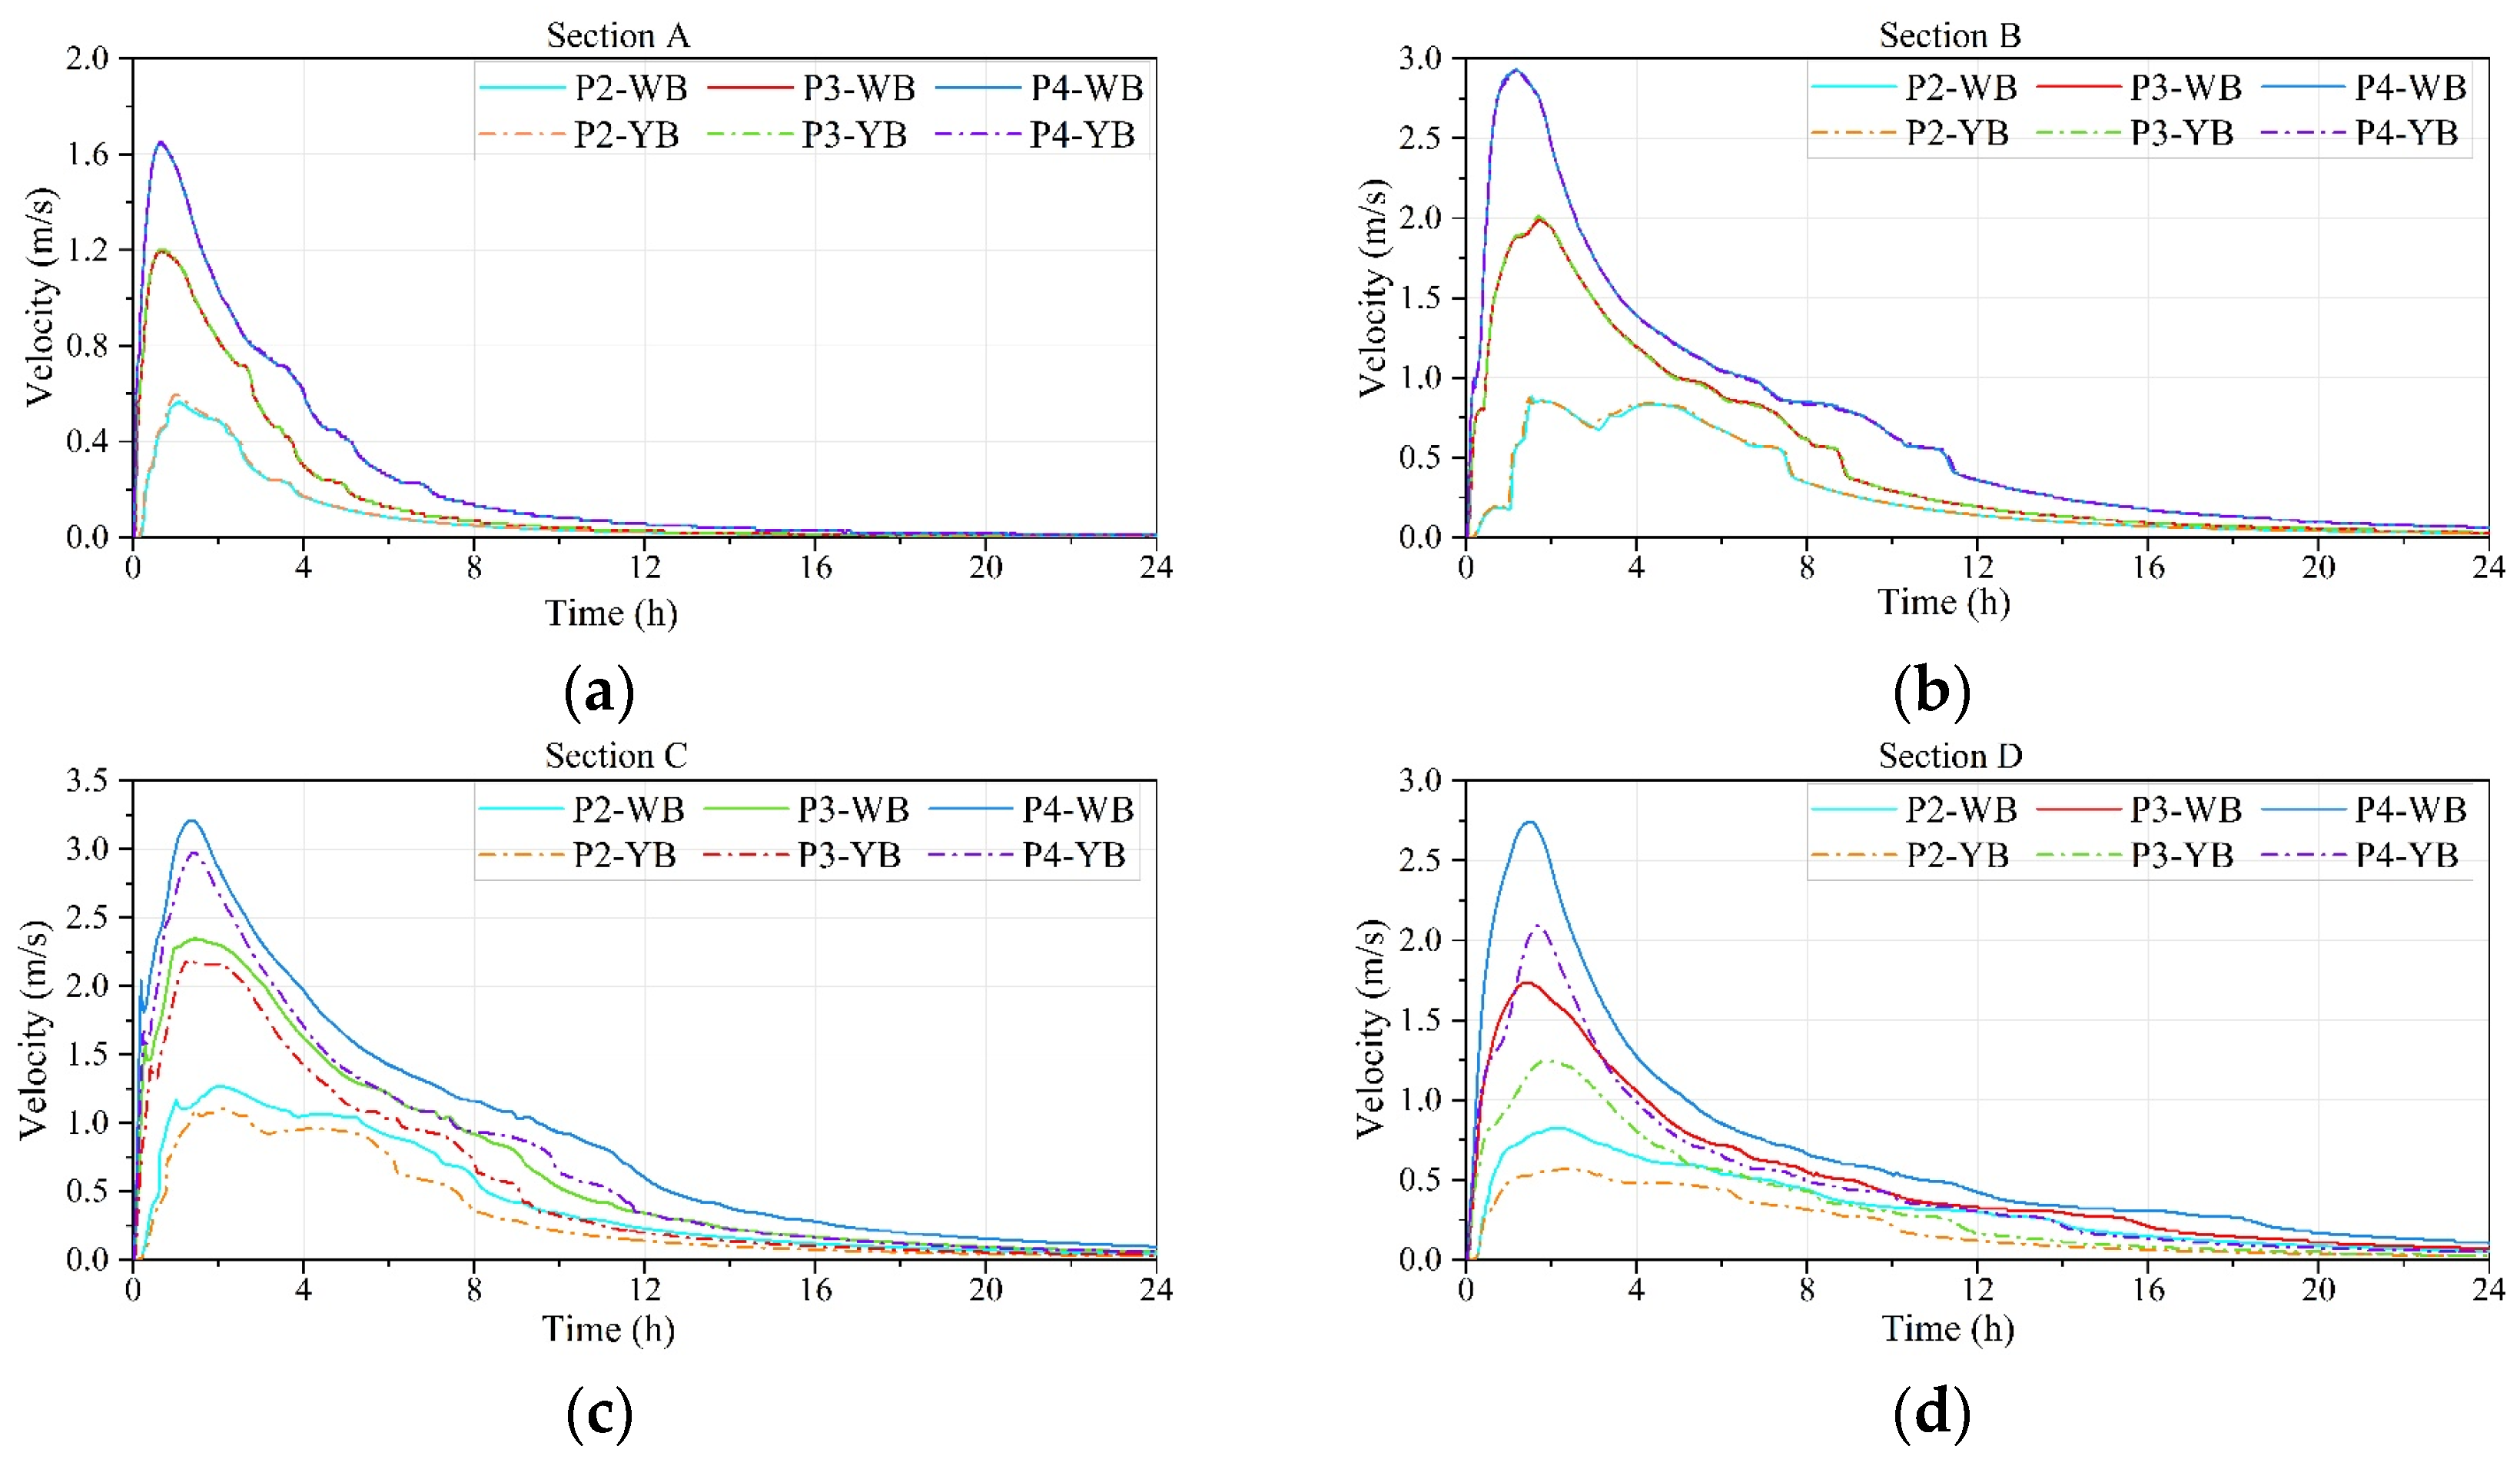
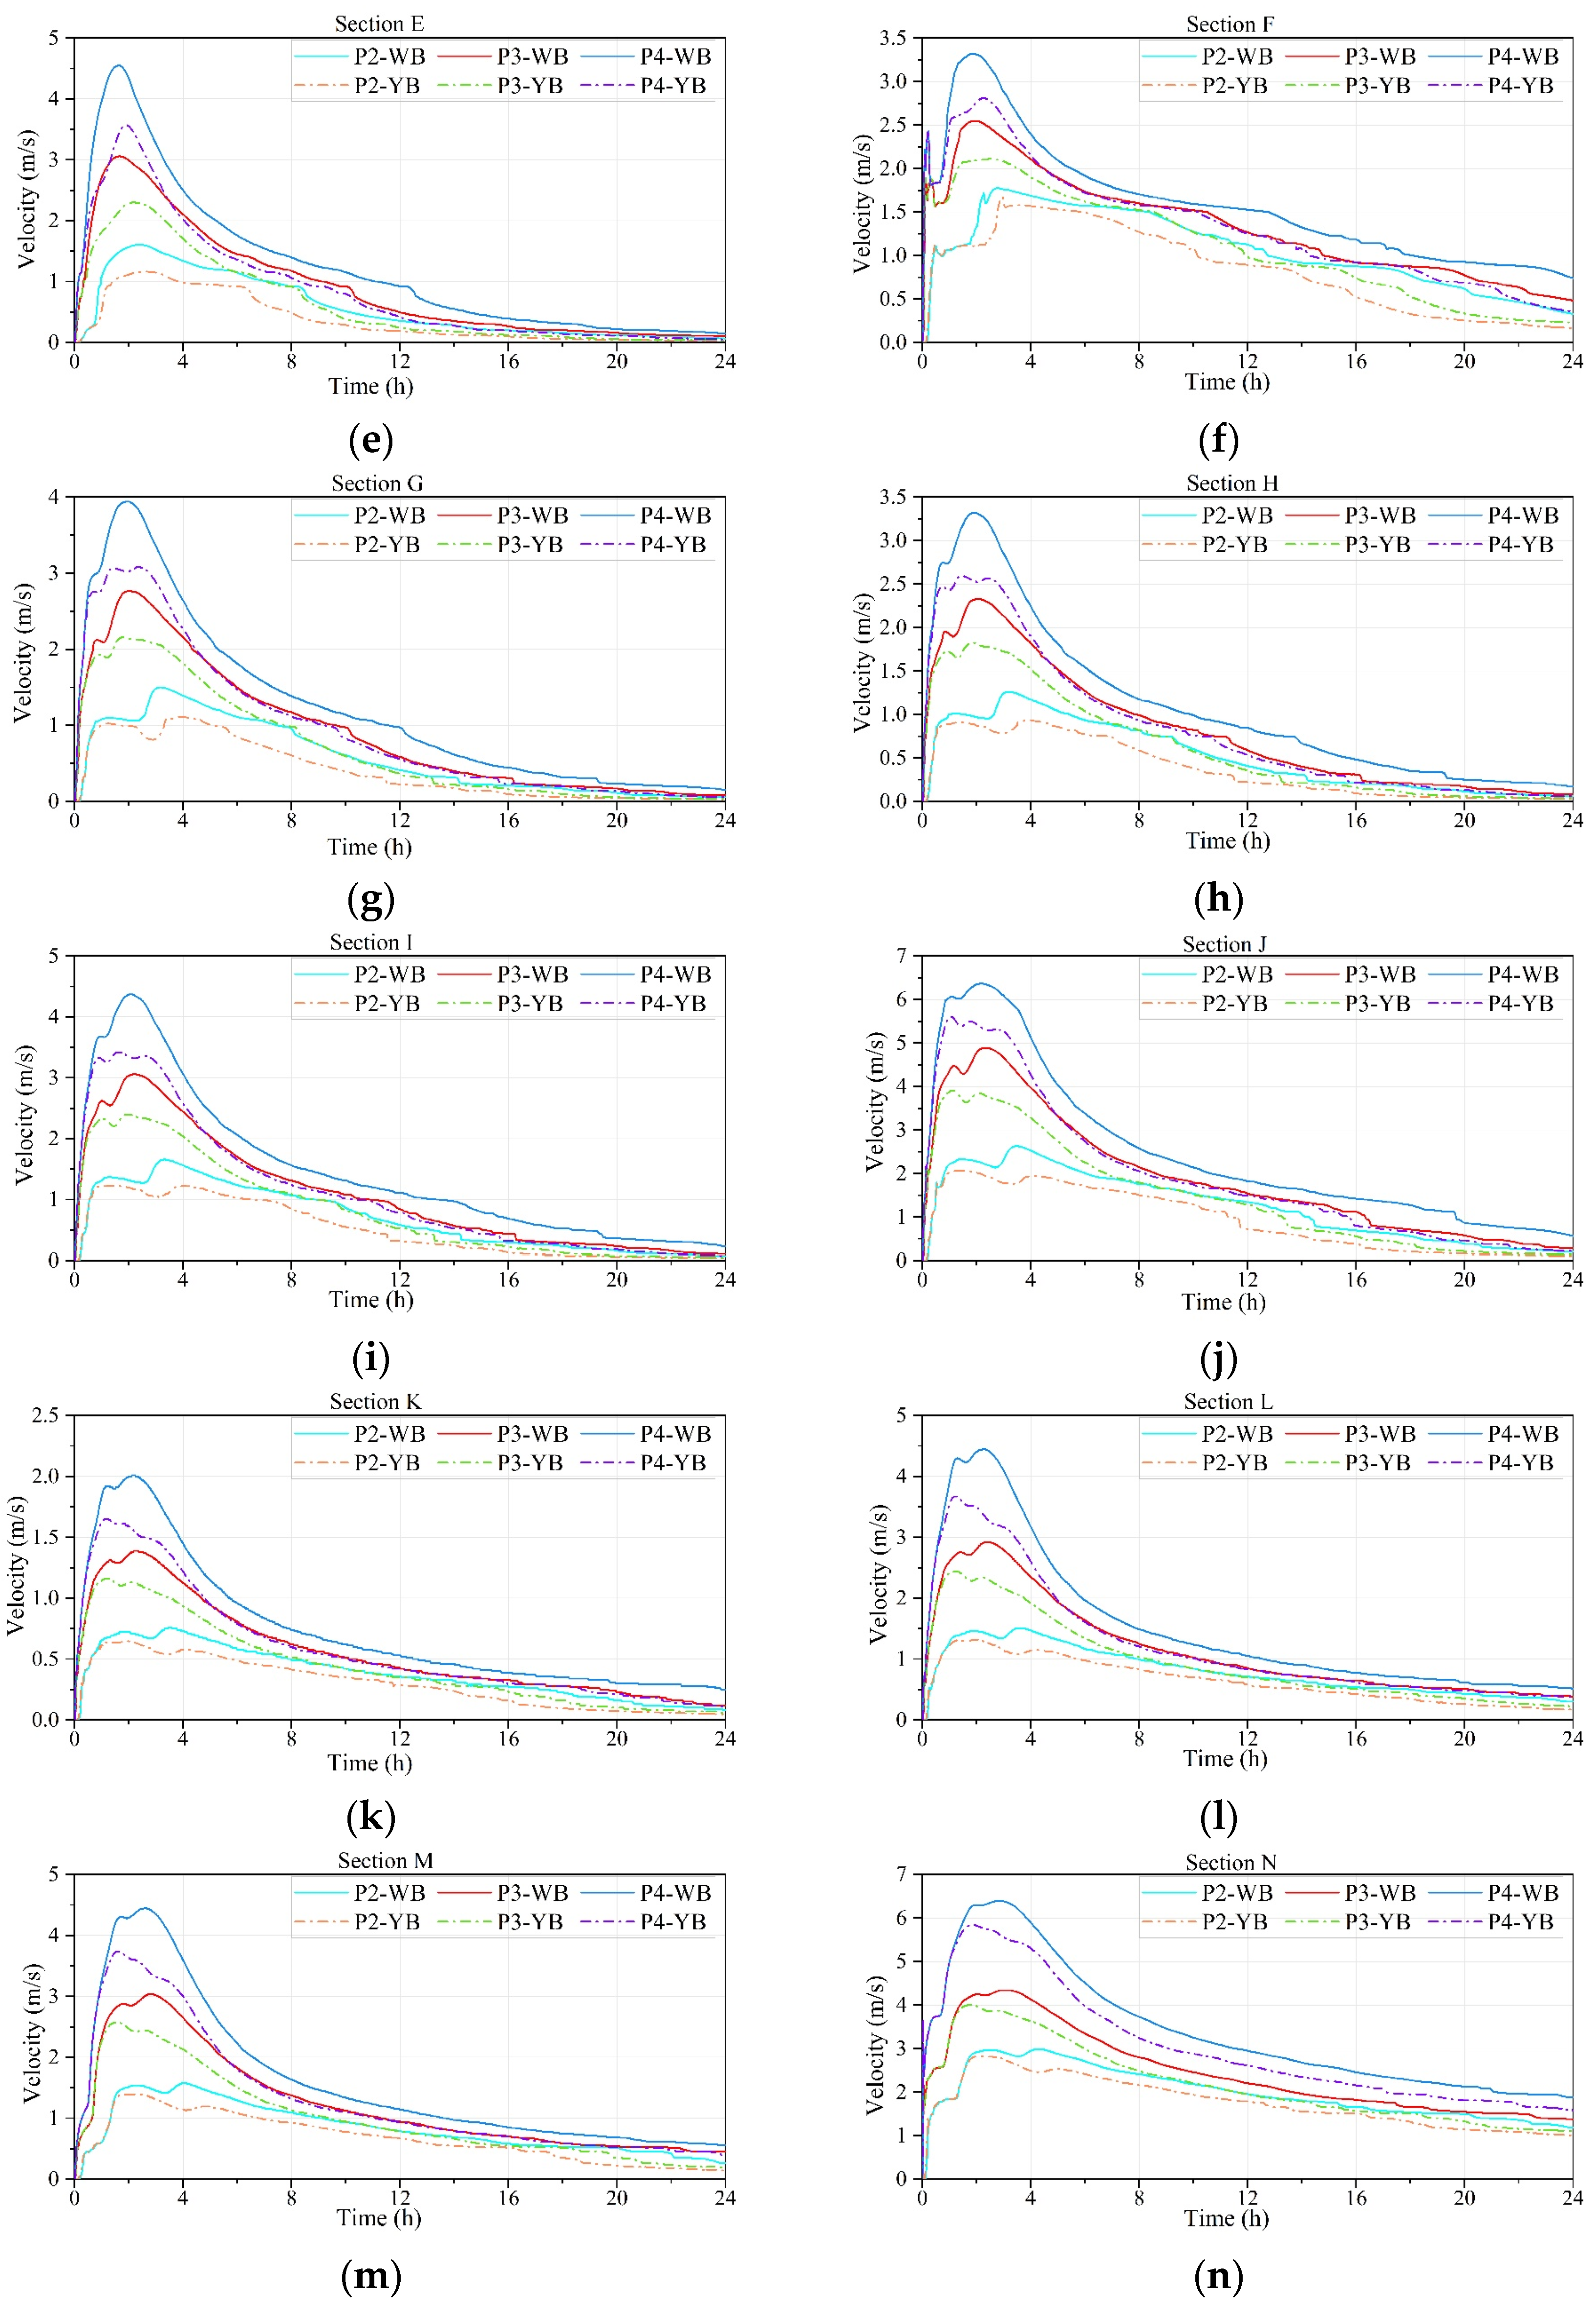
4.1. Temporal and Spatial Differences in Channel Velocity

4.1.1. Spatial Character

Figure 12 illustrates the distribution of maximum flow velocity along the main channel of the Xiliugou watershed under conditions with and without check dams. The figure shows that, across the six scenarios, the maximum velocity in the main channel generally exhibits a fluctuating upward trend from upstream to downstream. The velocity characteristics in the upstream section (approximately 0–10 km) are almost identical under both conditions. However, beyond 10 km, the maximum velocity in the check-dam scenario begins to decline sharply, becoming significantly lower than in the without check-dam scenario. Moreover, the difference between the two conditions widens with increasing distance. This phenomenon can be attributed to the fact that there are fewer tributaries in the upstream section, and no check dams are present. In the midstream and downstream sections, water from tributaries continuously converges, influencing the flow velocity along the main channel. This further emphasizes the critical role of tributary inflows in determining the flow velocity in the main channel. Under the P2 rainfall conditions, the maximum flow velocity in the main channel of the no-check-dam scenario peaks at 52.94 km, while the check-dam scenario also reaches its peak at the same cross-section. Under the P3 rainfall conditions, the peak maximum flow velocity in the no-check-dam scenario occurs at 62.98 km, whereas in the check-dam scenario, it occurs at 63.92 km. For the P4 rainfall conditions, the maximum flow velocity peaks at 63.92 km in both scenarios. These findings indicate that while the check dam system reduces the flow velocity in the channel, factors such as watershed topography and channel gradient may have a more significant influence on the distribution of runoff velocity. Consequently, the cross-sections where the peak maximum flow velocity occurs are generally consistent between the two scenarios.
By statistically analyzing the mean, peak, and standard deviation of the maximum flow velocity along the main channel under conditions with and without check dams, the variability of the maximum flow velocity along the Xiliugou main channel was quantitatively assessed (results shown in Table 5). The analysis reveals that, following the formation of the check dam system, partial flood retention reduces the volume of runoff entering the main channel, significantly decreasing the velocity and altering its distribution along the channel. Under the P2 rainfall conditions, the mean maximum velocity along the main channel is 1.52 m/s without check dams and 1.27 m/s with check dams, representing a 16.72% reduction due to check dam construction. The peak velocities are 3.50 m/s and 3.26 m/s, respectively, with a 6.86% reduction. Under the P3 rainfall conditions, the mean maximum flow velocity decreases from 2.72 m/s to 2.30 m/s (15.30% reduction), and the peak velocity decreases from 6.09 m/s to 5.22 m/s (14.34% reduction). For the P4 rainfall conditions, the mean maximum flow velocity decreases from 3.76 m/s to 3.24 m/s (13.84% reduction), and the peak velocity decreases from 8.32 m/s to 7.22 m/s (13.28% reduction). Additionally, as flood magnitude increases, the ability of the check dam system to reduce the mean maximum velocity along the main channel gradually diminishes. Comparing the standard deviation of maximum velocity along the main channel under different rainfall conditions reveals that the variability in velocity distribution decreases after check dam construction. This indicates that the regulation effect of the check dam system smoothens the fluctuations in flow velocity along the channel, thereby further reducing the erosive impact of runoff on channel sediment.

4.1.2. Temporal Character

As shown in Figure 13, a detailed analysis was conducted to assess the regulatory effect of tributary check dams on velocity at various cross-sections along the main channel. Under the three rainfall scenarios, the velocities at each cross-section in both the no-check-dam and check-dam scenarios exhibit a pattern of rapid increase followed by a gradual decrease. Notably, the closer to the downstream region, the longer the high flow velocity is sustained, as the channel sections become wider and the wetted sectional area increases, resulting in a slower rate of velocity decline. Since Section A and B are located in the uppermost region of the watershed, where tributaries are sparse and no-check-dams are installed, the flow velocity processes remain identical between the no-check-dam and check-dam scenarios. From Section C onward, the flow velocities at each cross-section in the check-dam scenario are significantly reduced compared to those in the no-check-dam scenario. Additionally, the intensity of velocity fluctuations decreases, indicating that the construction of the check dam system enhances the regulatory effect on channel flow velocity. This effectively reduces the erosive stress of runoff on downstream sections and the sediment transport capacity.

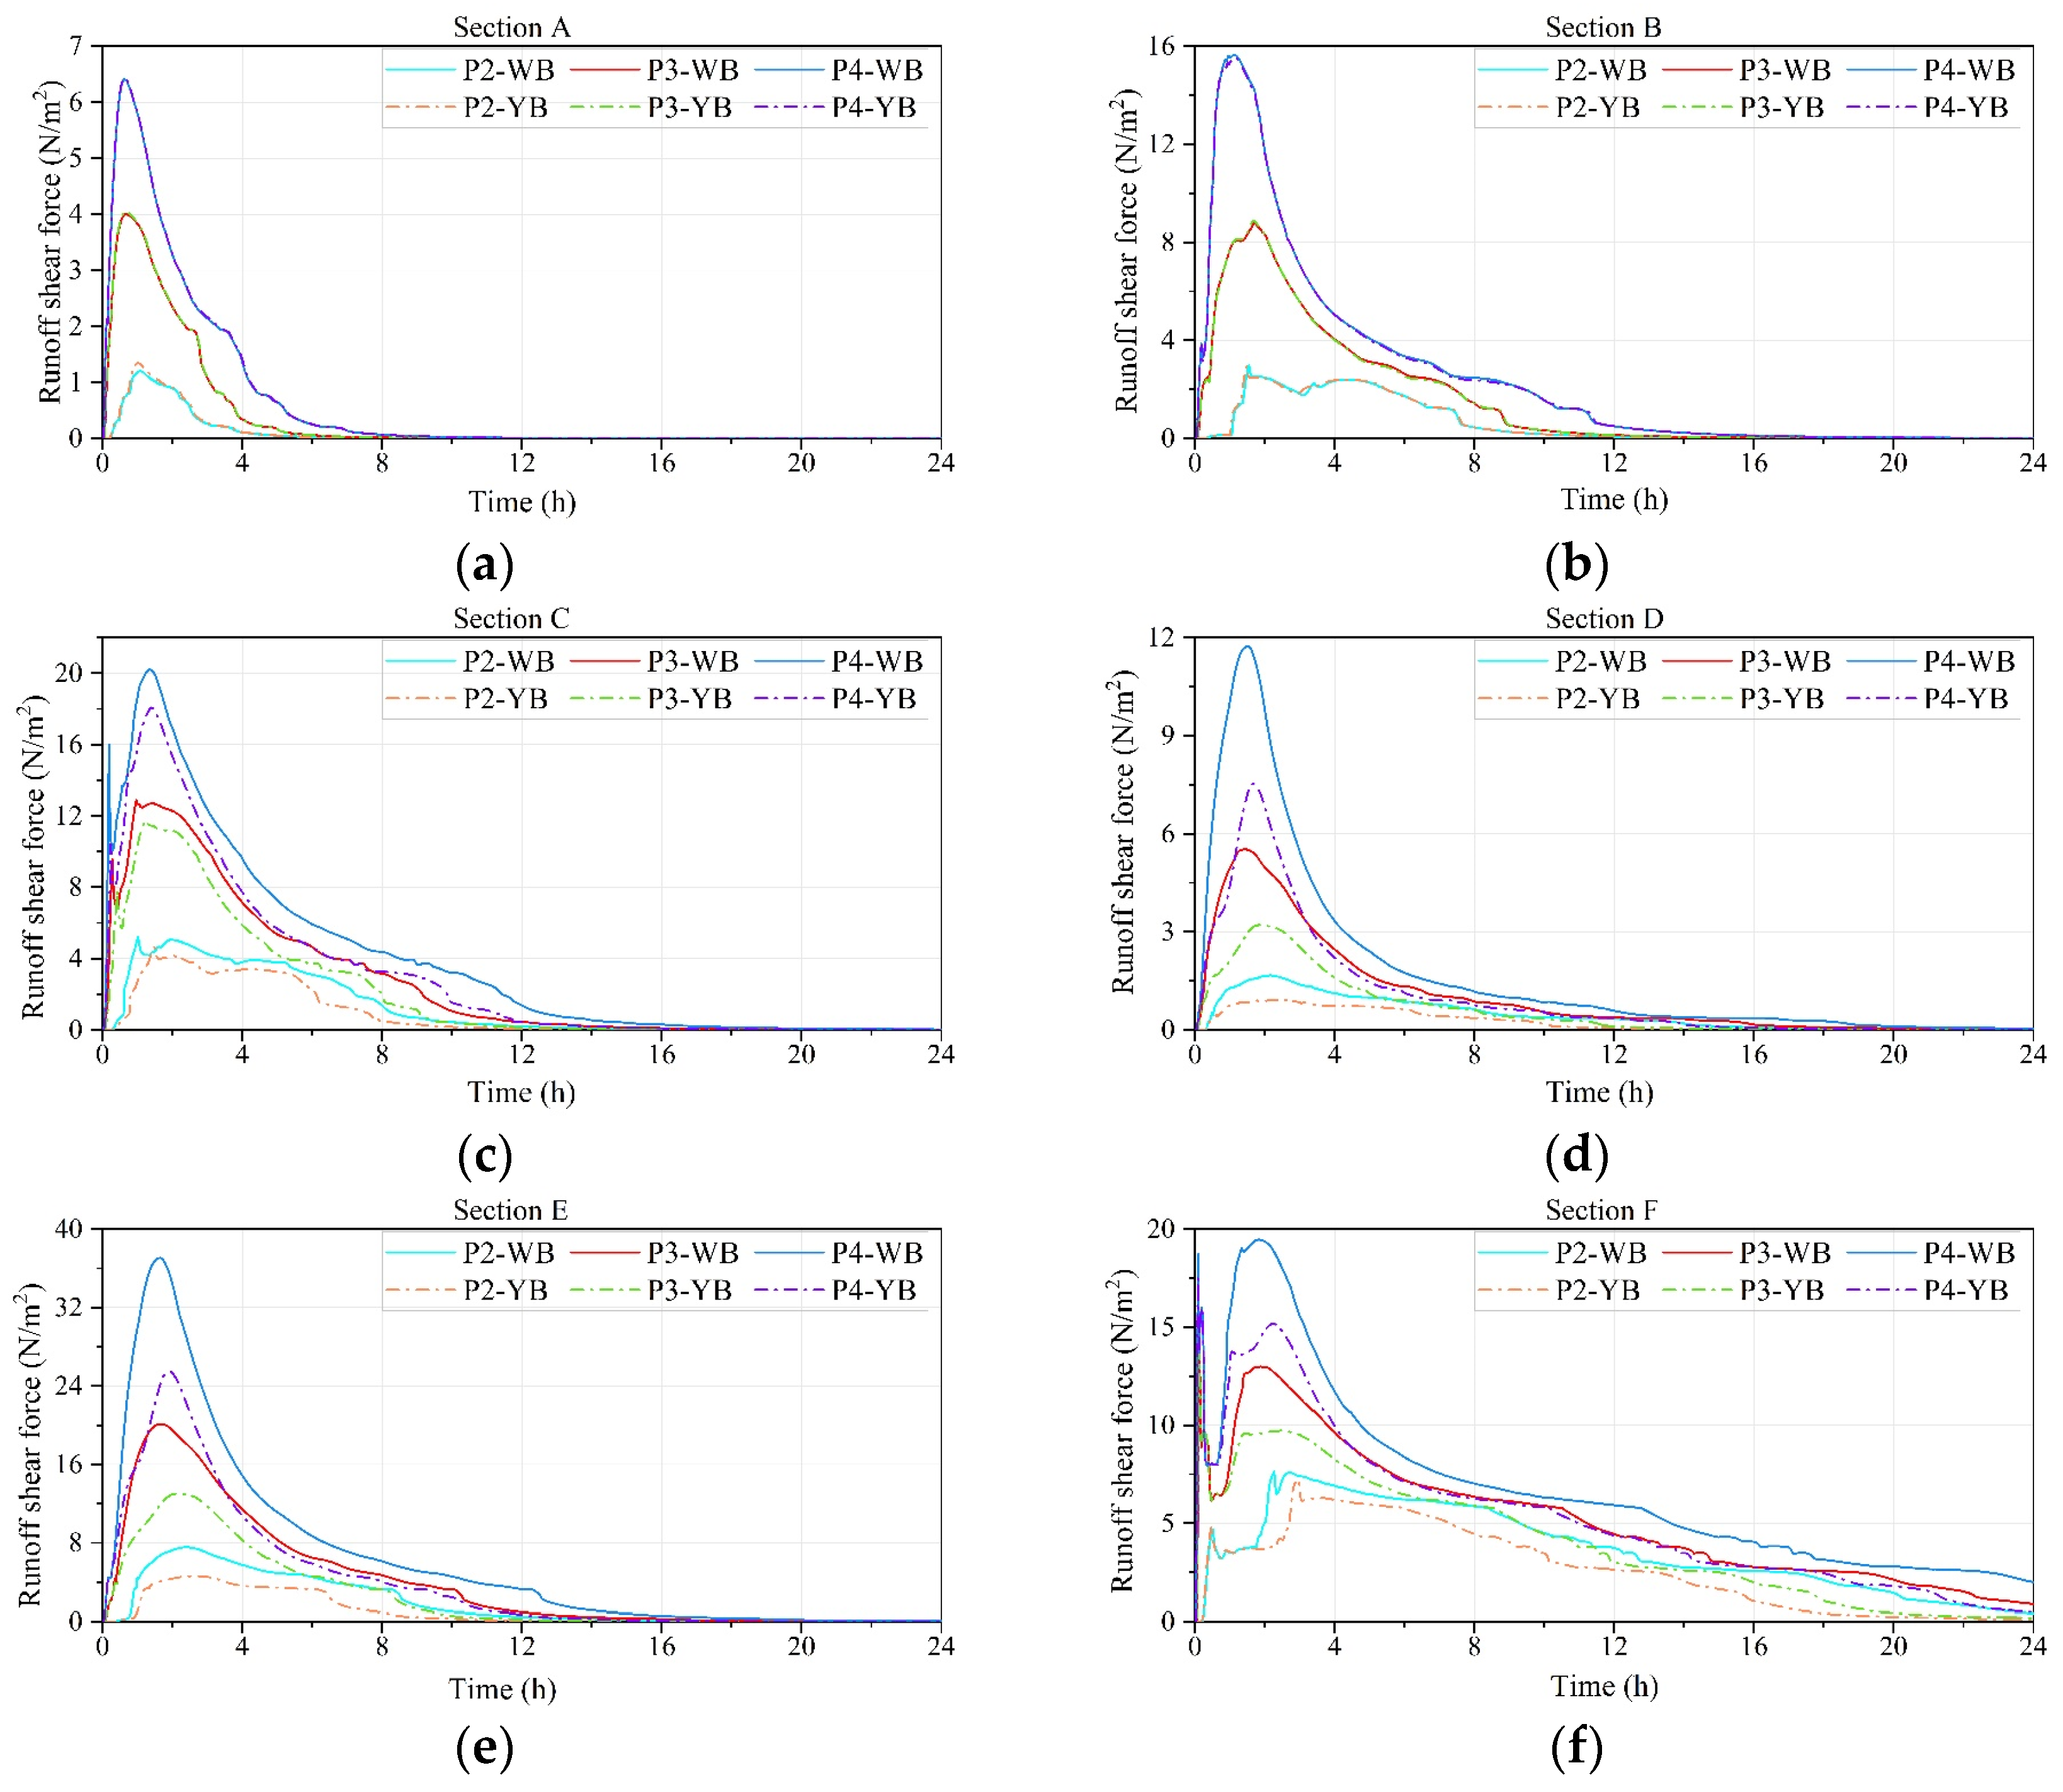
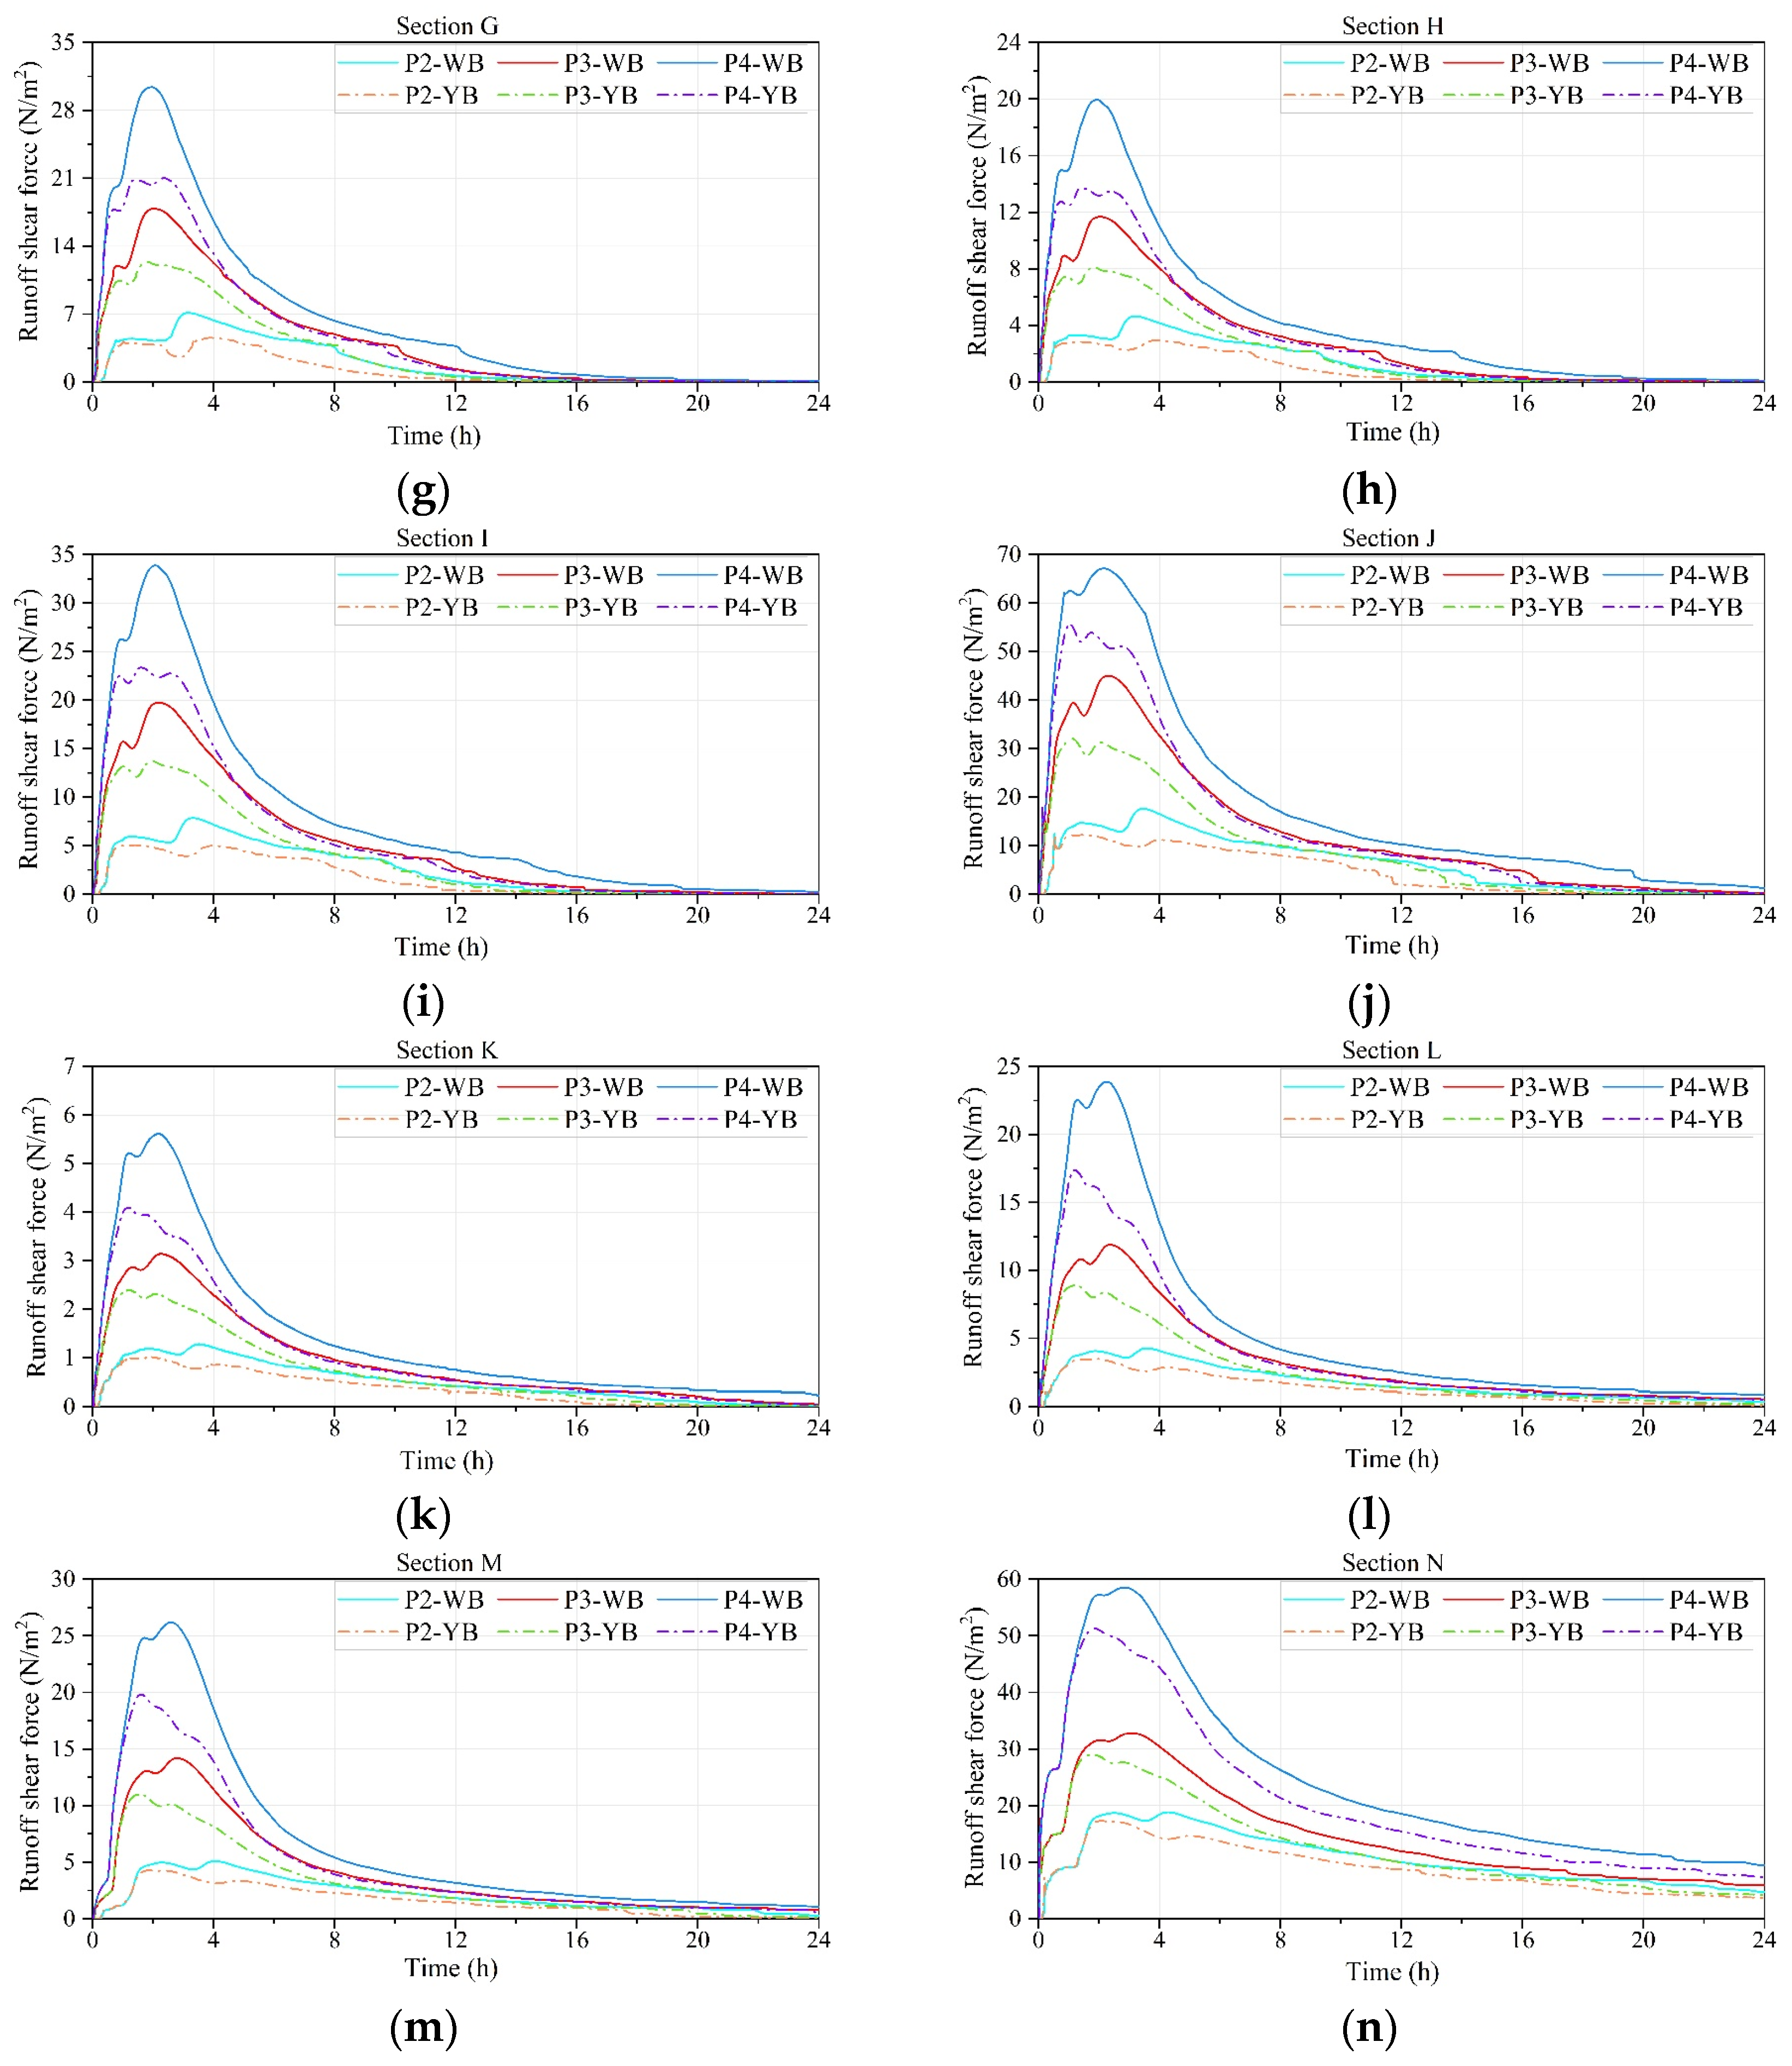
4.2. Temporal and Spatial Differences in Channel Runoff Shear

4.2.1. Spatial Character

Figure 14 illustrates the distribution of maximum runoff shear stress along the main channel of the Xiliugou watershed under various precipitation conditions for scenarios with and without check dams. In all six scenarios, the maximum runoff shear stress in the main channel of the watershed shows an overall fluctuating trend from upstream to downstream, although the rate of increase is lower than that of the maximum flow velocity. Moreover, the shear stress characteristics in the main channel from 0 to 10 km are broadly consistent, and after the 10 km mark, the maximum shear stress in the check-dam condition begins to be lower than that in the no-check-dam condition, and the difference in shear stress gradually increases in the downstream direction. Under the three rainfall conditions, both the no-check-dam and check-dam scenarios reach their maximum shear stress in the main channel at the 63.92 km mark, thus suggesting that the check dam system reduces the shear stress of the runoff on the channel bed sediment, but it is likely that factors such as watershed topography and channel slope exert a greater influence on runoff velocity distribution, leading to a similar distribution of runoff shear stress throughout the main channel.
Using statistical analysis of the average value, peak value, and standard deviation of the maximum runoff shear stress along the course for both no-check-dam and check-dam scenarios, we quantitatively evaluated the fluctuation of the maximum runoff shear stress along the main channel of the Xiliugou watershed. The results are presented in Table 6. In the P2 precipitation condition, the average maximum runoff shear stress along the course is 8.0 N/m2 and 6.3 N/m2 for the no-check-dam and check-dam conditions, respectively, the construction of check dams leads to a 21.44% decrease in the average maximum runoff shear stress of the main channel, with peak runoff shear stresses being 27.6 N/m2 and 24.3 N/m2, respectively, the construction of check dams causes a 12.22% reduction in the peak maximum runoff shear stress of the main channel. In the P3 precipitation condition, the average maximum runoff shear stress along the course is 18.5 N/m2 and 14.7 N/m2 for the no-check-dam and check-dam conditions, respectively, with peak runoff shear stresses being 65.4 N/m2 and 52.3 N/m2, respectively, the construction of check dams results in a reduction of 20.49% and 19.99% in the average value and peak value, respectively. In the P4 precipitation condition, the average maximum runoff shear stress along the course is 29.9 N/m2 and 24.4 m/s for the no-check-dam and check-dam conditions, respectively, with peak shear stresses being 102.7 N/m2 and 84.2 N/m2, respectively, the construction of check dams leads to reductions of 18.52% and 17.96% in the average value and peak value, respectively. Comparing the standard deviations of the maximum runoff shear stress along the course under the three types of precipitation conditions, the regulatory effect of check dam construction reduces the fluctuation of runoff shear stress along the course, leading to a reduction in the dispersion of runoff shear stress by 1.14, 2.78, and 3.62, respectively.

4.2.2. Temporal Character

Figure 15 illustrates the temporal variation in flow shear stress at each cross-section along the main gully under differing check dam construction scenarios in Xiliugou. According to Figure 15, the flow shear stress at the 14 observed cross-sections under both no-check-dam and check-dam scenarios exhibits an initial sharp increase followed by a gradual decrease, akin to the velocity variation at each cross-section. The variation in flow shear stress at cross-sections A: 5017 m and B: 9551 m is identical under both no-check-dam and check-dam scenarios. From cross-section C: 15,145 m onwards, the flow shear stress under the check-dam scenario is less than that under the no-check-dam scenario. The check-dam scenario exhibits a strong ability to mitigate the maximum flow shear stress, with reductions exceeding 45%.

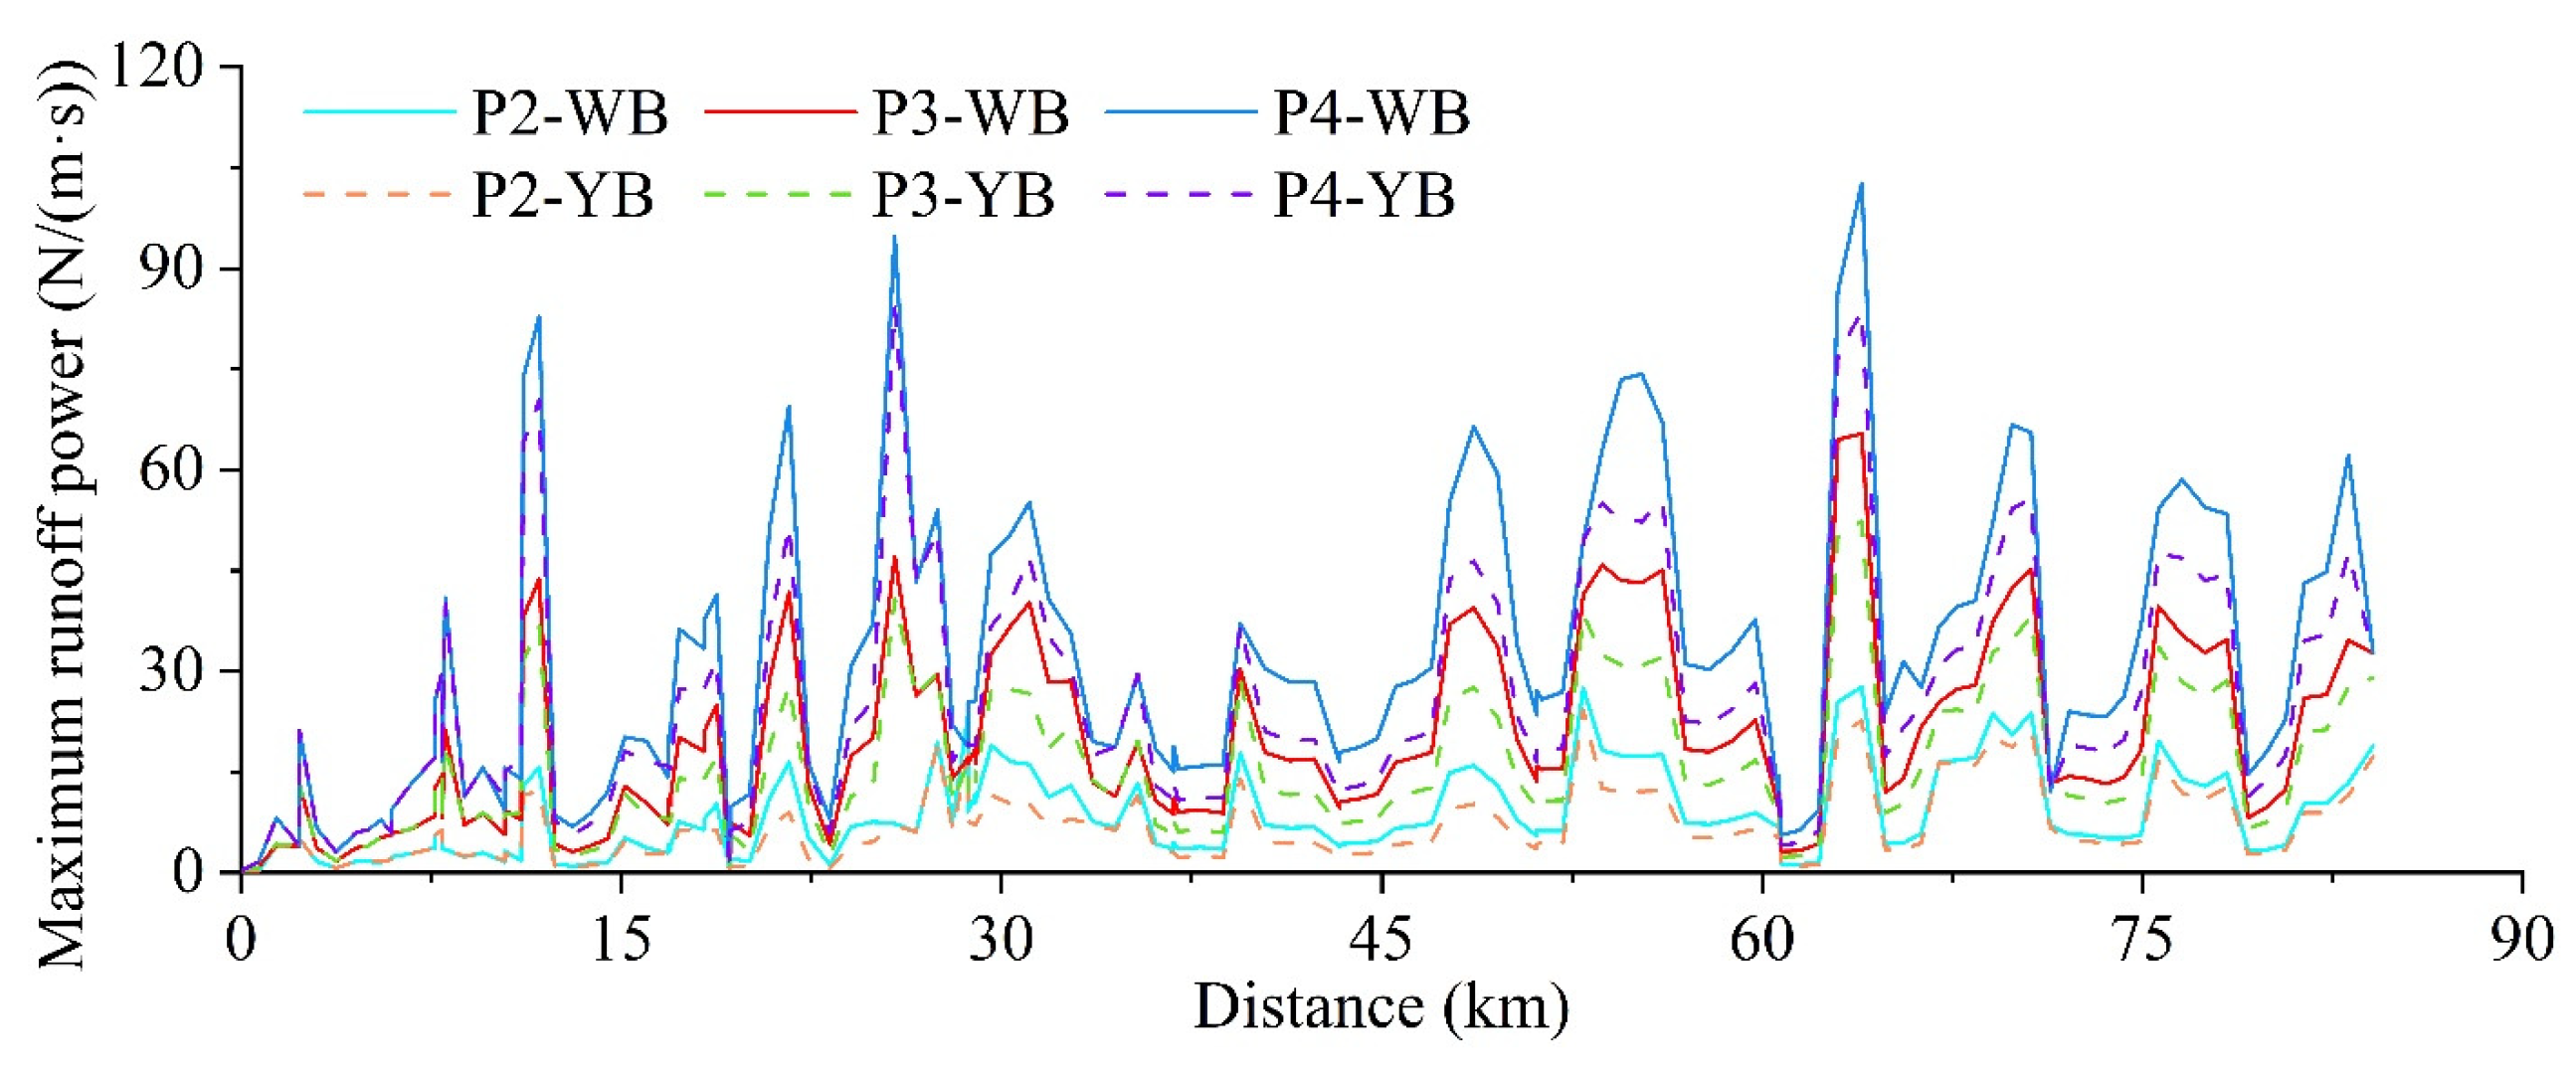
4.3. Temporal and Spatial Differences in Channel Runoff Power

4.3.1. Spatial Character

The process of soil erosion caused by channel runoff involves energy expenditure in performing work. According to Bagnold [51], runoff power is more effective in predicting sediment transport intensity compared to hydraulic factors like flow velocity and shear stress. Runoff power refers to the rate of change in potential and kinetic energy of water per unit area with respect to time. This parameter represents the power exerted by the water flow on a unit area and can indicate the magnitude of the runoff’s erosion capability.
The trend of maximum runoff power along the channel trajectory before and after check dam construction (Figure 16) resembles that of flow shear stress.
In the six scenarios, the maximum flow shear stress in the main gully fluctuates along the upstream-to-downstream direction, without a clear overall increase. The variations in the mid section of the main gully are less pronounced. The presence of multiple tributaries in this section significantly influences the development of runoff power.
A quantitative analysis of the variation in maximum runoff power along the main gully of Xiliugou is conducted by calculating the average, peak, and standard deviation of runoff power under both no-check-dam and check-dam scenarios, as shown in Table 7. In the P2 precipitation condition, the average maximum runoff power along the channel under no-check-dam and check-dam conditions is 16.93 N/(m·s) and 11.33 N/(m·s), respectively. The check dam construction leads to a 33.10% decrease in the average maximum runoff power of the main gully. The peak runoff power values are 95.98 N/(m·s) and 79.01 N/(m·s), respectively. Construction of the check dam results in a 17.68% decrease in the peak maximum runoff power of the main gully. In the P3 precipitation condition, the average maximum runoff power along the channel under no-check-dam and check-dam conditions is 64.80 N/(m·s) and 43.68 N/(m·s), respectively. The peak values of runoff power are 397.89 N/(m·s) and 272.88 N/(m·s), respectively. The check dam results in decreases of 32.58% and 31.42% in the average and peak values, respectively. In the P4 precipitation condition, the average maximum runoff power along the channel under no-check-dam and check dam conditions is 140.82 N/(m·s) and 99.22 N/(m·s), respectively. The peak runoff power values are 854.38 N/(m·s) and 604.02 N/(m·s), respectively. The construction of the check dam leads to decreases of 29.54% and 29.30% in the average and peak values, respectively. Furthermore, the check dam system’s ability to mitigate the average maximum runoff power in the main gully diminishes as the magnitude of the flood increases. Comparing the standard deviation of the maximum runoff power along the route under three precipitation conditions, the construction of the check dam system reduces the fluctuations in runoff power along the channel. The degree of dispersion of runoff power decreases by 5.30, 23.52, and 41.92, respectively.

4.3.2. Temporal Character

Figure 17 illustrates the temporal variation in runoff power across various cross-sections of the main gully in the Xiliugou watershed before and after check dam construction. The figure reveals that the runoff power at 14 simulated observation points in the main gully initially increases sharply and then decreases gradually, aligning with the changes in flow velocity and shear stress at the watershed outlet. This phenomenon occurs because runoff power is the product of flow velocity and shear stress. By contrasting the two scenarios (without check dam and with check dam), it is evident that the check dams constructed in tributaries exert a regulatory influence on the distribution of runoff power in the main gully. Notably, the reduction in runoff power at cross-sections F: 42,328.3 m to J: 66,271.4 m surpasses 75%, primarily because the tributary density of check dams is higher in this region relative to others, signaling that the regulatory effect of check dams on runoff power exhibits a spatial transfer effect.

5. Discussion

5.1. Runoff Process Regulation

For the four rainfall types, the average flood peak flow in the main ditch gradually decreased after the dam was constructed, but the reduction gradually decreased with the increase in rainfall intensity, indicating that the regulating capacity of the tributary dam system on the flood peak flow in the main ditch diminished with the increase in flood magnitude. When the water level in front of the dam reaches the discharge requirement, part of the water is discharged and the capacity reduction decreases.
Under the P4 condition, the flood peak flow increases rapidly in sections A to D without dam, there is no obvious increase in sections D to E, there is no obvious upward trend in sections E to K, and the increase is not obvious beyond section K. The flood peak flow in sections A to D increases rapidly in the absence of dam. The increase in flood flow in some sections is mainly due to the inflow of water from the upstream and midstream tributaries. Compared with the no-dam scenario, the dam system is mainly located in the upstream of the tributaries, and the runoff downstream of the dam site still has an influence on the flood peak flow in the main ditch. As a result, the increase in main channel peak flood flows is typically smaller under dammed conditions than under no dam conditions. The dam system reduces channel flood flows and, by intercepting floodwaters upstream of the tributaries, also reduces the main channel flood flow increase.
The dam system is more effective in flood control in sections D through J, primarily due to the high tributary inflow and high dam density in this area. However, the peak reduction effect on the main ditch beyond section K gradually weakened, indicating that the dam’s peak reduction effect on downstream flow decreases with increasing distance.
After the construction of the dams, the time of the watershed outlet flood was advanced. Most of the dams are located in tributaries upstream of section H, which are densely distributed. tributaries in sections C to E are all first-order tributaries, and the dams were built on the main stem of these tributaries, which resulted in delaying the downstream main gully flood flow after intercepting the runoff. For the downstream section of the main gully, which is a large distance away, the peak time is advanced mainly due to the fact that part of the runoff is intercepted by the dam system, resulting in the downstream flood water not being transported. As a result, the flooding process gradually receded after peaking with the dams, while tributary runoff continued to converge without the dams and downstream main gully flooding continued to grow.
Therefore, for larger watersheds with a parallel check dam layout, upstream and midstream floods will be delayed, and downstream floods will recede earlier due to insufficient runoff conveyance, leading to an earlier phenomenon of peak time. However, some scholars [15,17] have demonstrated through simulations of check dam layout impacts on flood processes in small watersheds like Wangmaogou and Shejiagou that check dams can, to varying degrees, delay the peak time of downstream channels after retaining floods. However, it remains to be seen whether the rules of flood peak time differ for larger watersheds primarily dominated by parallel check dam systems.

5.2. Erosion Power Regulation

Once the check dam system is established, the interception of part of the floodwater reduces the volume entering the main gully, thereby significantly decreasing the flow shear stress and energy in the main channel, as well as altering the distribution of erosional dynamics in the channel.
The capacity of the check dam system to weaken the average maximum flow shear stress in the main gully decrease progressively with the increase in flood magnitude. From section C onward, the flow shear stress at each moment in the check-dam-constructed condition is lower than that in the no-check-dam condition, as tributaries converge upstream of the section, and the check dams in the tributaries help regulate the flow. Specifically, the channels from section F to section M are situated in the middle and lower reaches of the watershed, where tributaries frequently join. The water-blocking effect of the check dams upstream in the tributaries decreases the flood volume flowing into the main gully, thereby shortening the sediment transport distance. This sediment accumulation also lessens the channel slope, further reducing the flow shear stress.
The runoff power over time transitions gradually from a “sharp and thin” to a “short and wide” pattern, yet the magnitude of the runoff power consistently escalates. At the same section, as the erosive rainfall gradually decreases, the runoff power gradually changes from a “sharp and thin” to a “short and wide” pattern. This phenomenon arises from the convergence of tributaries and the flood flow in the main gully, which results in a larger flood volume at downstream cross-sections, coupled with hydraulic gradients that cause the potential energy of the main gully flood to continuously transform into kinetic energy during its transport. The increased scour intensity of the channel thus amplifies the hydraulic energy slope and flow shear stress, eventually leading to a significant elevation in flow power.
By comparing the distribution characteristics of flow velocity, flow shear stress, runoff power along the main gully of the Xiliugou watershed under conditions with and without check dams, it is observed that the upstream area, lacking check dams, exhibits essentially consistent erosion dynamics; in the middle reaches, with numerous tributaries and a high proportion of constructed check dams, erosion dynamics significantly diminish under check-dam-constructed conditions. Due to the check dam structures retaining upstream floods, the flood volume entering the main gully is significantly reduced, resulting in varying degrees of decrease in flow velocity along the main gully. When the flood volume and flow velocity change, the hydraulic radius and hydraulic energy slope, which determine the flow shear stress, also decrease, correspondingly reducing the flow shear stress. As both flow velocity and flow shear stress decrease, the flow power, which is the product of these two factors, also experiences more significant variations. The check dam system in the Xiliugou watershed exerts a significant regulatory effect on channel erosion dynamics, capable of weakening the sediment transport capability of the runoff and its erosive capacity on the valleys. Furthermore, considering the geographical distribution characteristics of the check dam system, it is concluded that parallel tributary check dam systems significantly influence the distribution of erosion dynamics in the main gully, indicating that check dams have a regulating effect on channel erosion dynamics with a broader spatial impact.
Current research on surface runoff erosive capacity is mainly focused on sand holding force, erosion power and erosion energy, in comparison [52,53], the use of energy parameters to characterize soil erosion dissipation, transfer and other aspects is more relevant [54]. Among them, the runoff erosion power as a water flow energy factor comprehensively considered the watershed subsurface factors, precipitation and runoff, and there is a highly significant power function correlation with the sand transport modulus, different scholars based on the runoff erosion power of the watershed erosion process has been studied. Gong Junfu et al. [55] revealed that the runoff erosion power in the Yanhe River basin has the spatial distribution characteristics of “tributary large, main stream small”. Wang et al. [56] found the same pattern in the Wuding River basin. In addition. Yuan et al. [15] and Sun et al. [57] found that the construction of check dams and reservoirs effectively reduced the sand transport in the hilly and gully areas by utilizing the sub-storm water–sand response model based on runoff erosion power. Therefore, in this study, by predicting future erosive precipitation conditions in the Xiliu Gully watershed, the sub-storm water–sand response model was further utilized to estimate the gully scour erosion reduction power of sand barriers. The sand production and transport process from the slope to the channel in the watershed before and after the construction of the barrage did not differ significantly under the same conditions of soil, vegetation, and precipitation in the control watershed. In this study, we only designed two conditions before and after the construction of the barrage to change the sub-bedding factors in the channel, so the factors that led to the difference in the amount of sand transported at the outlet of the watershed were mainly the change in the transport process of the channel water and sand. Since there is no significant difference in the incoming sand from the slope, the difference in sand transport obtained using the sub-storm water–sand response relationship is the channel scour erosion reduction.

5.3. Limitations and Implications

Our study established a hydrological–hydrodynamic model for the Xiliugou watershed to simulate channel runoff and hydrodynamic processes under different rainfall types after the construction of check dams. This approach provides valuable insights into the regulatory effects of check dam systems on channel erosion dynamics, thereby offering a more comprehensive understanding of the critical role of check dams in watershed soil and water conservation efforts. However, due to a lack of observational data, this study faces certain limitations in the calibration and validation of the MIKE-SHE and MIKE-11 models. While the calibration and validation were conducted for scenarios without check dams, the absence of sufficient observational data under check dam conditions prevented direct validation of this scenario. This limitation hinders the ability to reliably compare simulated results with observational data under check dam conditions. The construction of check dams in the watershed was concentrated between 2021 and 2023, whereas the observational data we collected did not include events from this period. As a result, we opted to calibrate and validate the model parameters using the WB scenario, which aligns better with the temporal conditions of the available data. We acknowledge that this limitation reduces the reliability of the model’s application under check dam conditions. Future research should prioritize the collection of observational data under these conditions to enable comprehensive calibration and validation. Additionally, expanding the range and conditions of simulated events will help improve the accuracy and generalizability of the study findings.

6. Conclusions

This article is based on the integration of the distributed hydrological model MIKE-SHE and the one-dimensional hydrodynamic model MIKE-11 to analyze the impact of check dam system construction on channel flood transport, and erosion dynamics processes. The hydrological and hydrodynamic model was calibrated and validated, the NSE for the calibration period was 0.81 and 0.87, respectively, and the validation period reached 0.64 and 0.66, respectively, indicating that the model simulations are reliable and can be used to simulate secondary flood processes in the Xiliugou watershed. The peak flow time may lag behind in the upper and middle reaches, while that may be advanced in the downstream in the parallel layout of dam system’s watershed. The check dam system plays a significant role in reducing runoff and erosion hydrodynamics. The construction of check dams results in a significant reduction in the peak flow under P2 precipitation type, reaching 39.41%. For the average maximum velocity, runoff shear stress and runoff power along the main channel, the P2 precipitation type results in a significant reduction in hydrodynamics in the dam system watershed, reaching 16.72%,21.44% and 33.10%, respectively. However, for peak velocity, runoff shear stress and runoff power along the main channel, the P3 precipitation type has the most significant response to the reduction in hydrodynamics in the dam system watershed, reaching 14.34%, 19.99% and 31.42%, respectively. The regulation effect of the check dam system on erosion hydrodynamics is stronger in the middle reaches and gradually weakened in the lower reaches of the watershed. Although this study has achieved some results, there are still some limitations. Future studies can further collect and collate rainfall, runoff and sediment data after the construction of the check dam system to verify the adaptability of the model in different periods and working conditions as well as optimize the model structure and improve the simulation accuracy by combining higher-precision topographic data with more complex erosion dynamics mechanisms. In addition, considering the effects of climate change and extreme precipitation events, we carry out multi-scenario simulations to evaluate the long-term regulation of check dam systems under different climatic conditions, so as to provide more reliable theoretical support for watershed management and ecological restoration.

Author Contributions

Conceptualization, data curation, investigation, methodology, formal analysis, and writing—original draft, N.Z.; conceptualization, methodology, formal analysis, and writing—review and editing, and supervision, Y.F.; validation, writing—review and editing, and funding acquisition, P.L.; writing—review and editing, F.Y. and Y.C.; writing—review and editing, Z.X. and S.Z.; validation and writing—review and editing, P.W., T.W., X.G. and S.Z. All authors have read and agreed to the published version of the manuscript.

Funding

This research was supported by the National Natural Science Foundation of China (Grant No. U2243201) and Natural Science Foundations of Shaanxi Province (Grant No. 2023-ZDLSF-65).

Data Availability Statement

The data on runoff, sediment, and precipitation used in this study were sourced from the “Hydrological Data of the Yellow River Watershed,” covering the time periods of 1961–1990 and 2007–2012. These data primarily include excerpts from the flood hydrological elements and precipitation tables for each year in the watershed. The topographic data for the comparative small watersheds, namely Selan 13 and Bashitu 2, were obtained through drone aerial photography. The photography was conducted in late September 2022 using the DJI Phantom4 Pro V2.0 drone. The aerial photos of each small watershed were calibrated and stitched using Photoscan, resulting in DEM data for each watershed, with a spatial resolution of 1 m. The land use data (LUCC) for the Xiliugou watershed are sourced from the Remote Sensing Monitoring Database of China’s Current Land Use (http://www.resdc.cn, accessed on 6 March 2023), with a precision of 30 × 30 m.

Conflicts of Interest

Author Naichang Zhang, Zhaohui Xia, Fan Yue, Yongxiang Cao, and Pengfei Wang was employed by the company Northwest Engineering Corporation Limited. The remaining authors declare that the research was conducted in the absence of any commercial or financial relationships that could be construed as a potential conflict of interest.

References

  1. Xia, L.; Bi, R.; Song, X.; Hu, W.; Lyu, C.; Xi, X.; Li, H. Soil Moisture Response to Land Use and Topography across a Semi-Arid Watershed: Implications for Vegetation Restoration on the Chinese Loess Plateau. J. Mt. Sci. 2021, 19, 103–120. [Google Scholar] [CrossRef]
  2. Feng, Z.; Li, Z.; Shi, P.; Li, P.; Wang, T.; Duan, J. Impact of Sedimentation by Check Dam on the Hydrodynamics in the Channel on the Loess Plateau of China. Nat. Hazards 2021, 107, 953–969. [Google Scholar] [CrossRef]
  3. Clilverd, H.M.; Thompson, J.R.; Heppell, C.M.; Sayer, C.D.; Axmacher, J.C. Coupled Hydrological/Hydraulic Modelling of River Restoration Impacts and Floodplain Hydrodynamics. River Res. Appl. 2016, 32, 1927–1948. [Google Scholar] [CrossRef]
  4. Gao, H. Study on the Eco-Hydrological Effects of Gully Control Engineering in the Hilly and Gully Region of the Loess Plateau. Ph.D. Thesis, Graduate University of Chinese Academy of Sciences (Research Center for Soil and Water Conservation and Ecological Environment, Ministry of Education), Beijing, China, 2013. [Google Scholar]
  5. Fu, B.; Liu, Y.; Lü, Y.; He, C.; Zeng, Y.; Wu, B. Assessing the Soil Erosion Control Service of Ecosystems Change in the Loess Plateau of China. Ecol. Complex. 2011, 8, 284–293. [Google Scholar] [CrossRef]
  6. Bai, L.; Wang, N.; Jiao, J.; Chen, Y.; Tang, B.; Wang, H.; Chen, Y.; Yan, X.; Wang, Z. Soil Erosion and Sediment Interception by Check Dams in a Watershed for an Extreme Rainstorm on the Loess Plateau, China. Int. J. Sediment Res. 2020, 35, 408–416. [Google Scholar] [CrossRef]
  7. Shi, P.; Zhang, Y.; Ren, Z.; Yu, Y.; Li, P.; Gong, J. Land-Use Changes and Check Dams Reducing Runoff and Sediment Yield on the Loess Plateau of China. Sci. Total Environ. 2019, 664, 984–994. [Google Scholar] [CrossRef]
  8. Li, P.; Xu, G.; Lu, K.; Zhang, X.; Shi, P.; Bai, L.; Ren, Z.; Pang, G.; Xiao, L.; Gao, H.; et al. Runoff Change and Sediment Source during Rainstorms in an Ecologically Constructed Watershed on the Loess Plateau, China. Sci. Total Environ. 2019, 664, 968–974. [Google Scholar] [CrossRef]
  9. Stone, M.C.; Byrne, C.F.; Morrison, R.R. Evaluating the Impacts of Hydrologic and Geomorphic Alterations on Floodplain Connectivity. Ecohydrology 2017, 10, e1833. [Google Scholar] [CrossRef]
  10. Wang, Z.; Chen, Z.; Yu, S.; Zhang, Q.; Wang, Y.; Hao, J. Erosion-Control Mechanism of Sediment Check Dams on the Loess Plateau. Int. J. Sediment Res. 2021, 36, 668–677. [Google Scholar] [CrossRef]
  11. Turkyilmazoglu, M. Evidence of Stretching/Moving Sheet-Triggered Nonlinear Similarity Flows: Atomization and Electrospinning with/without Air Resistance. Int. J. Numer. Methods Heat Fluid Flow 2024, 34, 3598–3614. [Google Scholar] [CrossRef]
  12. Luo, Z.; Yong, C.; Fan, J.; Shao, M.; Wang, S.; Jin, M. Precipitation Recharges the Shallow Groundwater of Check Dams in the Loessial Hilly and Gully Region of China. Sci. Total Environ. 2020, 742, 140625. [Google Scholar] [CrossRef] [PubMed]
  13. Reza, I.A.; Mehdi, S.; Hossein, M.; Mahboobeh, K.H.; Afshin, G.; Zeynalabedin, H.S.; Mehdi, A.M. Application of Multi-Criteria Decision Making and GIS for Check Dam Layout in the Ilanlu Basin, Northwest of Hamadan Province, Iran. Phys. Chem. Earth 2018, 114, 102803. [Google Scholar]
  14. Bonumá, N.B.; Rossi, C.G.; Arnold, J.G.; Reichert, J.M.; Minella, J.P.; Allen, P.M.; Volk, M. Simulating Landscape Sediment Transport Capacity by Using a Modified SWAT Model. J. Environ. Qual. 2014, 43, 55–66. [Google Scholar] [CrossRef] [PubMed]
  15. Yuan, S.; Li, Z.; Li, P.; Xu, G.; Gao, H.; Xiao, L.; Wang, F.; Wang, T. Influence of Check Dams on Flood and Erosion Dynamic Processes of a Small Watershed in the Loess Plateau. Water 2019, 11, 834. [Google Scholar] [CrossRef]
  16. Wang, T.; Hou, J.; Li, P.; Zhao, J.; Li, Z.; Matta, E.; Ma, L.; Hinkelmann, R. Quantitative Assessment of Check Dam System Impacts on Catchment Flood Characteristics—A Case in Hilly and Gully Area of the Loess Plateau, China. Nat. Hazards 2021, 105, 3059–3077. [Google Scholar] [CrossRef]
  17. Tang, H.; Pan, H.; Ran, Q. Impacts of Filled Check Dams with Different Deployment Strategies on the Flood and Sediment Transport Processes in a Loess Plateau Catchment. Water 2020, 12, 1319. [Google Scholar] [CrossRef]
  18. Feng, Y.; Li, P.; Zhang, Y.; Zhou, S.; Dong, Y.; Li, J. Simulation of the Erosion Reduction Capacity of Check Dams in the Xiliugou Watershed. J. Soil Water Conserv. 2022, 36, 24–31. [Google Scholar] [CrossRef]
  19. Dai, W.; Qian, W.; Liu, A.; Wang, C.; Yang, X.; Hu, G.; Tang, G. Monitoring and Modeling Sediment Transport in Space in Small Loess Catchments Using UAV-SfM Photogrammetry. Catena 2022, 214, 106244. [Google Scholar] [CrossRef]
  20. Cucchiaro, S.; Cazorzi, F.; Marchi, L.; Crema, S.; Beinat, A.; Cavalli, M. Multi-Temporal Analysis of the Role of Check Dams in a Debris-Flow Channel: Linking Structural and Functional Connectivity. Geomorphology 2019, 345, 106844. [Google Scholar] [CrossRef]
  21. Xue, S. Experimental Study on the Regulation of Water and Sediment by Check Dams. Master’s Thesis, Xi’an University of Technology, Xi’an, China, 2022. [Google Scholar]
  22. Huang, J.; Hinokidani, O.; Yasuda, H.; Ojha, C.S.P.; Kajikawa, Y.; Li, S. Effects of the Check Dam System on Water Redistribution in the Chinese Loess Plateau. J. Hydrol. Eng. 2013, 18, 929–940. [Google Scholar] [CrossRef]
  23. Shuilong, Y.; Zhanbin, L.; Li, C.; Peng, L.; Zeyu, Z. Influence of Check Dams on Flood Hydrology across Varying Stages of Their Lifespan in a Highly Erodible Catchment, Loess Plateau of China. Catena 2022, 210, 105864. [Google Scholar] [CrossRef]
  24. Qihua, R.; Honglei, T.; Feng, W.; Jihui, G. Numerical Modelling Shows an Old Check-Dam Still Attenuates Flooding and Sediment Transport. Earth Surf. Processes Landf. 2021, 46, 1549–1567. [Google Scholar] [CrossRef]
  25. Mishra, A.; Froebrich, J.; Gassman, P. Evaluation of the SWAT Model for Assessing Sediment Control Structures in a Small Watershed in India. Trans. ASABE 2007, 50, 469–477. [Google Scholar] [CrossRef]
  26. Duan, J. Simulation Study on the Impact of Different Sediment Accumulation Levels on Hydrodynamic Processes in Check Dams. Master’s Thesis, Xi’an University of Technology, Xi’an, China, 2019. [Google Scholar]
  27. You, Y.; Li, Z.; Gao, P.; Hu, T. Impacts of Dams and Land-Use Changes on Hydromorphology of Braided Channels in the Lhasa River of the Qinghai-Tibet Plateau, China. Int. J. Sediment Res. 2022, 37, 214–228. [Google Scholar] [CrossRef]
  28. Rahmati, O.; Ghasemieh, H.; Samadi, M.; Kalantari, Z.; Tiefenbacher, J.P.; Nalivan, O.A.; Cerdà, A.; Ghiasi, S.S.; Darabi, H.; Haghighi, A.T.; et al. TET: An Automated Tool for Evaluating Suitable Check-Dam Sites Based on Sediment Trapping Efficiency. J. Clean. Prod. 2020, 266, 122051. [Google Scholar] [CrossRef]
  29. Poeppl, R.E.; Keesstra, S.D.; Hein, T. The Geomorphic Legacy of Small Dams—An Austrian Study. Anthropocene 2015, 10, 43–55. [Google Scholar] [CrossRef]
  30. Díaz, V.; Mongil, J.; Navarro, J. Topographical Surveying for Improved Assessment of Sediment Retention in Check Dams Applied to a Mediterranean Badlands Restoration Site (Central Spain). J. Soils Sediments 2014, 14, 2045–2056. [Google Scholar] [CrossRef]
  31. Castillo, V.M.; Mosch, W.M.; García, C.C.; Barberá, G.G.; Cano, J.A.N.; López-Bermúdez, F. Effectiveness and Geomorphological Impacts of Check Dams for Soil Erosion Control in a Semiarid Mediterranean Catchment: El Cárcavo (Murcia, Spain). Catena 2006, 70, 416–427. [Google Scholar] [CrossRef]
  32. Trimble, S.W.; Mendel, A.C. The Cow as a Geomorphic Agent—A Critical Review. Geomorphology 1995, 13, 233–253. [Google Scholar] [CrossRef]
  33. Lal, R. Soil Degradation by Erosion. Land Degrad. Dev. 2001, 12, 519–539. [Google Scholar] [CrossRef]
  34. Nicholson, S.E. The West African Sahel: A Review of Recent Studies on the Rainfall Regime and Its Interannual Variability. Int. Sch. Res. Not. 2013, 2013, 453521. [Google Scholar] [CrossRef]
  35. Wilcox, B.P.; Huang, Y. Woody Plant Encroachment Paradox: Rivers Rebound as Degraded Grasslands Convert to Woodlands. Geophys. Res. Lett. 2010, 37, L07402. [Google Scholar] [CrossRef]
  36. Walling, D.E.; Fang, D. Recent Trends in the Suspended Sediment Loads of the World’s Rivers. Glob. Planet. Change 2003, 39, 111–126. [Google Scholar] [CrossRef]
  37. Herrmann, S.M.; Hutchinson, C.F. The Changing Contexts of the Desertification Debate. J. Arid Environ. 2005, 63, 538–555. [Google Scholar] [CrossRef]
  38. Nyssen, J.; Poesen, J.; Deckers, J. Land Degradation and Soil and Water Conservation in Tropical Highlands. Soil Tillage Res. 2009, 103, 197–202. [Google Scholar] [CrossRef]
  39. García-Ruiz, J.M.; Beguería, S.; Nadal-Romero, E.; González-Hidalgo, J.C.; Lana-Renault, N.; Sanjuán, Y. A Meta-Analysis of Soil Erosion Rates across the World. Geomorphology 2015, 239, 160–173. [Google Scholar] [CrossRef]
  40. Sonnenborg, T.O.; Christiansen, J.R.; Pang, B.; Bruge, A.; Stisen, S.; Gundersen, P. Analyzing the Hydrological Impact of Afforestation and Tree Species in Two Catchments with Contrasting Soil Properties Using the Spatially Distributed Model MIKE SHE SWET. Agric. For. Meteorol. 2017, 239, 118–133. [Google Scholar] [CrossRef]
  41. Rujner, H.; Leonhardt, G.; Marsalek, J.; Viklander, M. High-Resolution Modelling of the Grass Swale Response to Runoff Inflows with Mike SHE. J. Hydrol. 2018, 562, 411–422. [Google Scholar] [CrossRef]
  42. Ma, L.; He, C.; Bian, H.; Sheng, L. MIKE SHE Modeling of Ecohydrological Processes: Merits, Applications, and Challenges. Ecol. Eng. 2016, 96, 137–149. [Google Scholar] [CrossRef]
  43. Engman, E.T. Roughness Coefficients for Routing Surface Runoff. J. Irrig. Drain. Eng. 1986, 112, 39–53. [Google Scholar] [CrossRef]
  44. Wang, S.; Zhang, Z.; Sun, G.; Strauss, P.; Guo, J.; Tang, Y.; Yao, A. Multi-Site Calibration, Validation, and Sensitivity Analysis of the MIKE SHE Model for a Large Watershed in Northern China. Hydrol. Earth Syst. Sci. 2012, 16, 4621–4632. [Google Scholar] [CrossRef]
  45. Bhasme, P.; Vagadiya, J.; Bhatia, U. Enhancing Predictive Skills in Physically-Consistent Way: Physics Informed Machine Learning for Hydrological Processes. J. Hydrol. 2022, 615, 128618. [Google Scholar] [CrossRef]
  46. Yin, S.; Wang, Y.; Xie, Y.; Liu, A. Characteristics of Rainfall Process Time Distribution in China. Adv. Water Sci. 2014, 25, 617–624. [Google Scholar] [CrossRef]
  47. Wu, L.; Liu, X.; Ma, X. Spatiotemporal Distribution of Rainfall Erosivity in the Yanhe River Watershed of Hilly and Gully Region, Chinese Loess Plateau. Environ. Earth Sci. 2016, 75, 315. [Google Scholar] [CrossRef]
  48. Li, L. Research on Flow Routing in Distributed Hydrological Models. Ph.D. Thesis, Hohai University, Nanjing, China, 2007. [Google Scholar]
  49. Foster, G.R.; Meyer, L.D. Transport of Soil Particles by Shallow Flow. Trans. ASAE 1972, 56, 515–522. [Google Scholar] [CrossRef]
  50. Sha, X.; Wang, W.; Lou, Y.; Kang, H. Differences in Runoff Erosion Dynamics on Engineering Accumulation Slopes with Different Soil Types. J. Nat. Disasters 2022, 31, 191–199. [Google Scholar] [CrossRef]
  51. Bagnold, R.A. An Approach to the Sediment Transport Problem from General Physics; U.S. Government Printing Office: Washington, DC, USA, 1966. [Google Scholar]
  52. Ali, M.; Seeger, M.; Sterk, G.; Moore, D. A Unit Stream Power Based Sediment Transport Function for Overland Flow. Catena 2013, 101, 197–204. [Google Scholar] [CrossRef]
  53. Zhou, S.; Li, P.; Feng, Y.; Guo, J. Dynamic Mechanism of Check Dams on Evolution of River Corridors Based on UAV Telemetry Combined with Numerical Simulations. Land Degrad. Dev. 2024, 35, 3523–3538. [Google Scholar] [CrossRef]
  54. Zhang, Y.; Xu, G.; Li, Z.; Li, P.; Jia, L.; Wang, B. Simulation Accuracy of Sediment Transport Models Based on Runoff Erosion Power at Different Time Scales. Res. Soil Water Conserv. 2020, 27, 1–7+22. [Google Scholar] [CrossRef]
  55. Gong, J.; Li, Z.; Li, P.; Ren, Z.; Yang, Y.; Han, L.; Tang, S.; Sun, Q. Spatial Distribution of Runoff Erosion Energy in the Yanhe River Basin Based on the SWAT Model. Trans. Chin. Soc. Agric. Eng. 2017, 33, 120–126. [Google Scholar]
  56. Wang, W.; Li, Z.; Yang, R.; Jia, L.; Ren, Z.; Li, P. Spatiotemporal Variation Characteristics of Runoff Erosion Power in the Wuding River Basin. Res. Soil Water Conserv. 2020, 27, 26–32. [Google Scholar] [CrossRef]
  57. Sun, Q.; Li, Z.; Yu, K.; Lu, K.; Tang, S. Parameters of the Sediment Transport Model for Single Rainstorms in the Loess Hilly and Gully Region under Changing Environments. Sci. Soil Water Conserv. 2016, 14, 1–9. [Google Scholar] [CrossRef]
Figure 1. Geographic location and overview of the West Willow Gulch Watershed.
Water 17 00947 g001
Figure 2. Loess Plateau check dams landscape map.
Water 17 00947 g002
Figure 3. Model terrain file.
Water 17 00947 g003
Figure 4. Documentation of land use types and the Manning number in the study area. (a) Land use type. (b) Reciprocal of the Manning coefficient.
Water 17 00947 g004
Figure 5. Comparison of measured and simulated values of the Xiliugou model. (a) A 19,750,811 flood rating; (b) a 19,790,911 flood rating; (c) a 19,840,809 flood rating; (d) a 19,880,626 flood rating.
Water 17 00947 g005
Figure 6. Discriminant analysis results of precipitation types in the Xiliugou watershed.
Water 17 00947 g006
Figure 7. Typical precipitation in the Xiliugou watershed.
Water 17 00947 g007
Figure 8. Simulated working conditions.
Water 17 00947 g008
Figure 9. Location of check dams in the Xiliugou watershed.
Water 17 00947 g009
Figure 10. Flood peak flow of sections along the main channel under different rainfall. (a) Peak flow rate; (b) peak reduction rate.
Water 17 00947 g010
Figure 11. Differences in flood peak time at the main channel under different rainfall.
Water 17 00947 g011
Figure 12. Distribution of maximum velocity from upstream to downstream of the main gully in different simulation scenarios of the Xiliugou watershed.
Water 17 00947 g012
Figure 13. Velocity changes at different sections of the main gully in different simulation scenarios of the Xiliugou watershed.
Water 17 00947 g013aWater 17 00947 g013b
Figure 14. Distribution of maximum runoff shear stress from upstream to downstream of the main gully in different simulation scenarios of the Xiliugou watershed.
Water 17 00947 g014
Figure 15. Runoff shear stress changes at different sections of the main gully in different simulation scenarios of the Xiliugou watershed. (a) Section A; (b) section B; (c) section C; (d) section D; (e) section E; (f) section F; (g) section G; (h) section H; (i) section I; (j) section J; (k) section K; (l) section L; (m) section M; (n) section N.
Water 17 00947 g015aWater 17 00947 g015b
Figure 16. Distribution of maximum runoff power from upstream to downstream of the main gully in different simulation scenarios of the Xiliugou watershed.
Water 17 00947 g016
Figure 17. Runoff power changes at different sections of the main gully in different simulation scenarios of the Xiliugou watershed. (a) Section A; (b) section B; (c) section C; (d) section D; (e) section E; (f) section F; (g) section G; (h) section H; (i) section I; (j) section J; (k) section K; (l) section L; (m) section M; (n) section N.
Water 17 00947 g017aWater 17 00947 g017b
Table 1. The Manning coefficient and infiltration rate values for different land uses.
Land Use TypeArea
(km2)
Area Ratio
(%)
Manning Coefficient n
(s/m1/3)
Gauckler–Strickler Coefficient Ks
(m1/3/s)
Infiltration Rate
(mm/h)
Grassland278.7523.370.1059.52.51
Woodland675.0156.580.2504.06.00
Bare round5.580.470.04522.24.30
Cultivated land92.207.730.05717.52.78
Sand58.554.910.01471.418.00
Building14.171.190.010100.00
Transportation land13.601.140.01758.80
Water body
(river, lake, reservoir, pond)
55.064.620.03330.3-
Table 2. Calibration and verification results of the Xiliugou watershed model.
StageFlood CodeActual Flow
Measurement Value
(m3/s)
Flow Simulation
Value
(m3/s)
Re
(%)
N S E R 2
Calibration period19,750,811476429−9.910.810.86
19,790,911127121−4.740.870.88
Verification period19,840,809660606−8.220.640.78
19,880,626168127−11.030.660.71
Table 3. Main precipitation types in the Xiliugou watershed.
TypeAverage ValueCharacteristicQuantity
/Field
Total Precipitation/mmPrecipitation Duration/h
P13.01.45Small total amount, short duration864
P222.22.18Small total amount, long duration132
P357.41.08Larger total amount, short duration19
P4104.21.00Largest total amount, short duration2
Table 4. Statistical analysis of main channel peak flow characteristics under different precipitation conditions.
Precipitation TypeNo Check DamsCheck Dams
Average Discharge (m3/s) S T D (m3/s)Average Discharge (m3/s) S T D (m3/s)Decrease (%)
P217.059.1910.336.8139.41
P380.5040.8549.4827.0638.54
P4194.6290.51122.4857.9837.07
average97.3946.8560.7630.6238.34
Table 5. Statistics of maximum velocity along the main gully of the Xiliugou watershed.
Rainfall TypeWorking ConditionAverage Value
(m/s)
Mean ReductionPeak Value
(m/s)
Peak Reduction S T D (m/s)
P2WB1.5216.72%3.506.86%0.76
YB1.273.260.66
P3WB2.7215.30%6.0914.34%1.17
YB2.305.220.97
P4WB3.7613.84%8.3213.28%1.50
YB3.247.221.28
Table 6. Statistics of maximum runoff shear stress indicators along the main channel of the Xiliugou watershed.
Rainfall TypeWorking ConditionAverage Value
(N/m2)
Mean ReductionPeak Value
(N/m2)
Peak Reduction S T D
(N/m2)
P2WB8.021.44%27.612.22%6.4
YB6.324.35.3
P3WB18.520.49%65.419.99%13.4
YB14.752.310.6
P4WB29.918.52%102.717.96%20.9
YB24.484.217.3
Table 7. Statistics of maximum runoff power indicators along the main gully of the Xiliugou watershed.
Rainfall TypeWorking ConditionAverage Value
(N/(m·s))
Mean ReductionPeak Value
(N/(m·s))
Peak Reduction S T D
(N/(m·s))
P2WB16.9333.10%95.9817.68%20.71
YB11.3379.0115.41
P3WB64.8032.58%397.8931.42%72.76
YB43.68272.8849.24
P4WB140.8229.54%854.3829.30%150.29
YB99.22604.02108.37
Disclaimer/Publisher’s Note: The statements, opinions and data contained in all publications are solely those of the individual author(s) and contributor(s) and not of MDPI and/or the editor(s). MDPI and/or the editor(s) disclaim responsibility for any injury to people or property resulting from any ideas, methods, instructions or products referred to in the content.

