Article

Enhanced Landslide Risk Evaluation in Hydroelectric Reservoir Zones Utilizing an Improved Random Forest Approach

by
Aichen Wei
1,
Hu Ke
1,
Shuni He
1,
Mingcheng Jiang
1,
Zeying Yao
2 and
Jianbo Yi
2,*
1
Dadu River Basin Reservoirs and Dams Management Center of China National Energy, Chengdu 610095, China
2
School of Mechanical and Electrical Engineering, University of Electronic Science and Technology of China, Chengdu 611731, China
*
Author to whom correspondence should be addressed.
Water 2025, 17(7), 946; https://doi.org/10.3390/w17070946
Submission received: 10 February 2025 / Revised: 12 March 2025 / Accepted: 20 March 2025 / Published: 25 March 2025

Abstract

:
Landslides on reservoir slopes are one of the key geologic hazards that threaten the safe operation of hydropower plants. The aim of our study was to reduce the limitations of the existing methods of landslide risk assessment when dealing with complex nonlinear relationships and the difficulty of quantifying the uncertainty of predictions. We established a multidimensional system of landslide risk assessment that covers geological settings, meteorological conditions, and the ecological environment, and we proposed a model of landslide risk assessment that integrates Bayesian theory and a random forest algorithm. In addition, the model quantifies uncertainty through probability distributions and provides confidence intervals for the prediction results, thus significantly improving the usefulness and reliability of the assessment. In this study, we adopted the Gini index and SHAP (SHapley Additive exPlanations) value, an analytical methodology, to reveal the key factors affecting slope stability and their interaction. The empirical results obtained show that the model effectively identifies the key risk factors and also provides an accurate prediction of landslide risk, thus enhancing scientific and targeted decision making. This study offers strong support for managing landslide risk and providing a more solid guarantee of the safe operation of hydropower station sites.

1. Introduction

As one of the main sources of clean energy in China, hydropower plants play an important role in the restructuring of the energy mix. With the rapid development of China’s economy over the past 40 years and the acceleration of urbanization, the growth in demand for electricity has also led to a rapid expansion in the construction of hydropower plants [1]. By the end of 2022, China’s installed hydropower capacity reached 418.2 GW, and its installed conventional hydropower capacity is forecast to reach 420 GW by 2030 and 500 GW by 2060 [2]. However, hydropower projects are often constructed in high mountain valleys and rivers, i.e., areas with complex geological settings, with a wide range of water storage areas, which inevitably imply severe problems, such as diverse topography, unstable geological formations, fragile ecology, and variable meteorological conditions. This magnifies the difficulty in the analysis of slope stability in disaster assessment and creates protection issues in hydropower reservoir areas. The slope stability of hydropower stations is directly related to their safe operation. Slope instability may lead to landslides, collapses, and other disastrous processes that in turn affect the normal operation of hydropower stations, e.g., the dam failure of reservoirs and damage to hydropower facilities, even affecting the power supply capacity of the power system, resulting in blackouts and the risk of its collapse. Furthermore, the instability of hydropower plant slopes may affect the safety of the surrounding areas so that landslides or collapses may lead to natural disasters, such as mudslides and floods, which pose a threat to the lives and properties of the surrounding residents [3]. In addition, if the slope instability of a hydropower station is not managed promptly, it may lead to long-term safety hazards and affect the social stability and economic development of the surrounding areas. Hence, it becomes particularly important to study the stability of the slopes of hydropower stations, which is not only useful in predicting geological disasters, such as landslides, in advance and reducing the possibility of their occurrence but also helps in providing some theoretical support to the normal construction and operation of hydropower stations.
Scholars have summarized the methods of traditional slope stability analysis, which are mainly divided into three categories: a theoretical calculation method, a numerical modeling method, and a field monitoring and analysis method. Theoretical calculations provide a quick and intuitive initial stability determination. Bala Padmaja et al. [4] explored the effects of rainfall infiltration and water level differences on slope stability by calculating soil stiffness parameters along the shear plane. Cai et al. [5] evaluated the stability of slopes under rainfall conditions using the strength discount method combined with a high-performance computer, stating that rainfall creates water pressure inside the slope, thereby reducing slope stability. Machay et al. [6] analyzed the influencing factors of landslides using hierarchical multicriteria analysis and confirmed that lithology is an important factor influencing landslide formation. Numerical simulation methods are popular because of their high-precision analytical capabilities. Alemdag et al. [7] analyzed the slope stability in the area of an ancient landslide using the finite element and limit equilibrium methods and concluded that the sliding state of accumulation is consistent with the monitoring results. Steger et al. [8] proposed a dynamic spatial landslide initiation model, which provides new ideas for landslide analysis by introducing predictive visualization and dynamic spatial thresholds. The in situ monitoring and analysis method allows for the real-time monitoring of at-risk slopes and supports the dynamic adjustment of slope models. Drakatos et al. [9] demonstrated the importance of developing an effective slope monitoring and risk management program by using remote sensing and satellite observation techniques for the real-time monitoring of slopes. In the face of the complexity of environmental factors and the growing demand for early warning systems, slope stability analysis is shifting from traditional static analysis to more dynamic prediction methods. Traditional analytical methods can be divided into manual empirical prediction and statistical analysis prediction methods based on their methodological characteristics [10]. Qualitative methods, such as hierarchical analysis, fuzzy logic criterion, and evidence-weighted analysis, are favored by experts and scholars because of their intuitive effects, easy-to-judge relevance, and other advantages. Quantitative methods, such as the use of logistic regression models and information quantity models, are also widely employed. Atkinson et al. [11] established a logistic regression model to predict slope stability by selecting independent evaluation indicators, which was confirmed using remote sensing images and field verification. Yue et al. [12] employed In-SAR technology to investigate the relationship between slope sliding and deformation, effectively identifying impending landslides and characterizing slope behavior.
In recent years, the theory of machine learning has continued to develop, and more and more algorithms have been applied to different aspects of slope stability assessment and prediction, such as neural networks, support vector machines, decision trees, and random forest models [13]. Based on sample data, the slope is modeled, trained, and then modeled again, and a model with appropriate regional characteristics is constructed for prediction. The results of the model are further optimized by adjusting its parameters, which is more convenient and easier to conduct compared with traditional methods. Machine learning models are more suited for complex regional data, and they can be used to solve the nonlinear characteristics of samples and results and effectively obtain the interaction between multivariate variables. Chih et al. [14] utilized a multi-convolutional attention mechanism to segment satellite images to detect slope stability, which solves the multi-scale problem in the detection process. Bing et al. [15] combined light gradient lift, a gradient lift tree, and an extreme gradient lift machine through ensemble learning algorithms to evaluate slope landslides and found that ensemble learning algorithms produce better results compared with classical machine learning algorithms. Dieu et al. introduced a deep learning neural network algorithm into the assessment framework for landslide-sensitive evaluation in the Vietnam region, compared it with other machine algorithms, and then found that it had better performance [16].
The landslide risk assessments mentioned appear to focus on the prediction results but fail to adequately consider the importance of quantifying the uncertainty of the results and analyzing the influencing factors. This limitation makes it difficult to dynamically adjust the strategy used and affects the accuracy and reliability of landslide risk assessment, thus failing to provide effective and timely preventive measures. Based on this, in our study, we constructed a multidimensional landslide assessment system covering geological settings, meteorological conditions, and the ecological environment. A Bayesian random forest model was proposed to quantify uncertainty and analyze the key factors affecting slope stability in depth by means of the Gini index and SHAP values.
The subsequent sections discuss the following processes: (i) constructing the multidimensional landslide assessment index system; (ii) training the Bayesian random forest landslide risk assessment model; and (iii) validating the accuracy of the model by applying it to real engineering cases.

2. Modeling of Multidimensional Landslide Assessment System

2.1. Modeling Process

To establish a comprehensive and accurate multidimensional landslide assessment system, in this study, we deeply analyzed the key factors affecting slope stability and selected key assessment indicators. Meanwhile, the historical landslide risk data of Zhangcun Gully of the Pillow Head Dam Level 1 Hydropower Station in the Dadu River Basin were utilized as the core of the model dataset, and data from other risk locations in the basin were integrated to enhance the diversity and representativeness of the dataset. Additionally, in this study, the outliers in the samples were detected and removed using the local outlier factor (LOF) algorithm to ensure the quality and reliability of the dataset; the Synthetic Minority Over-Sampling Technique (SMOTE) was applied to balance the distribution of data categories to improve the extensiveness of the training set and the learning efficiency of the model. Finally, the optimized and processed dataset was used to train the landslide risk assessment model, and the whole modeling process is shown in Figure 1.

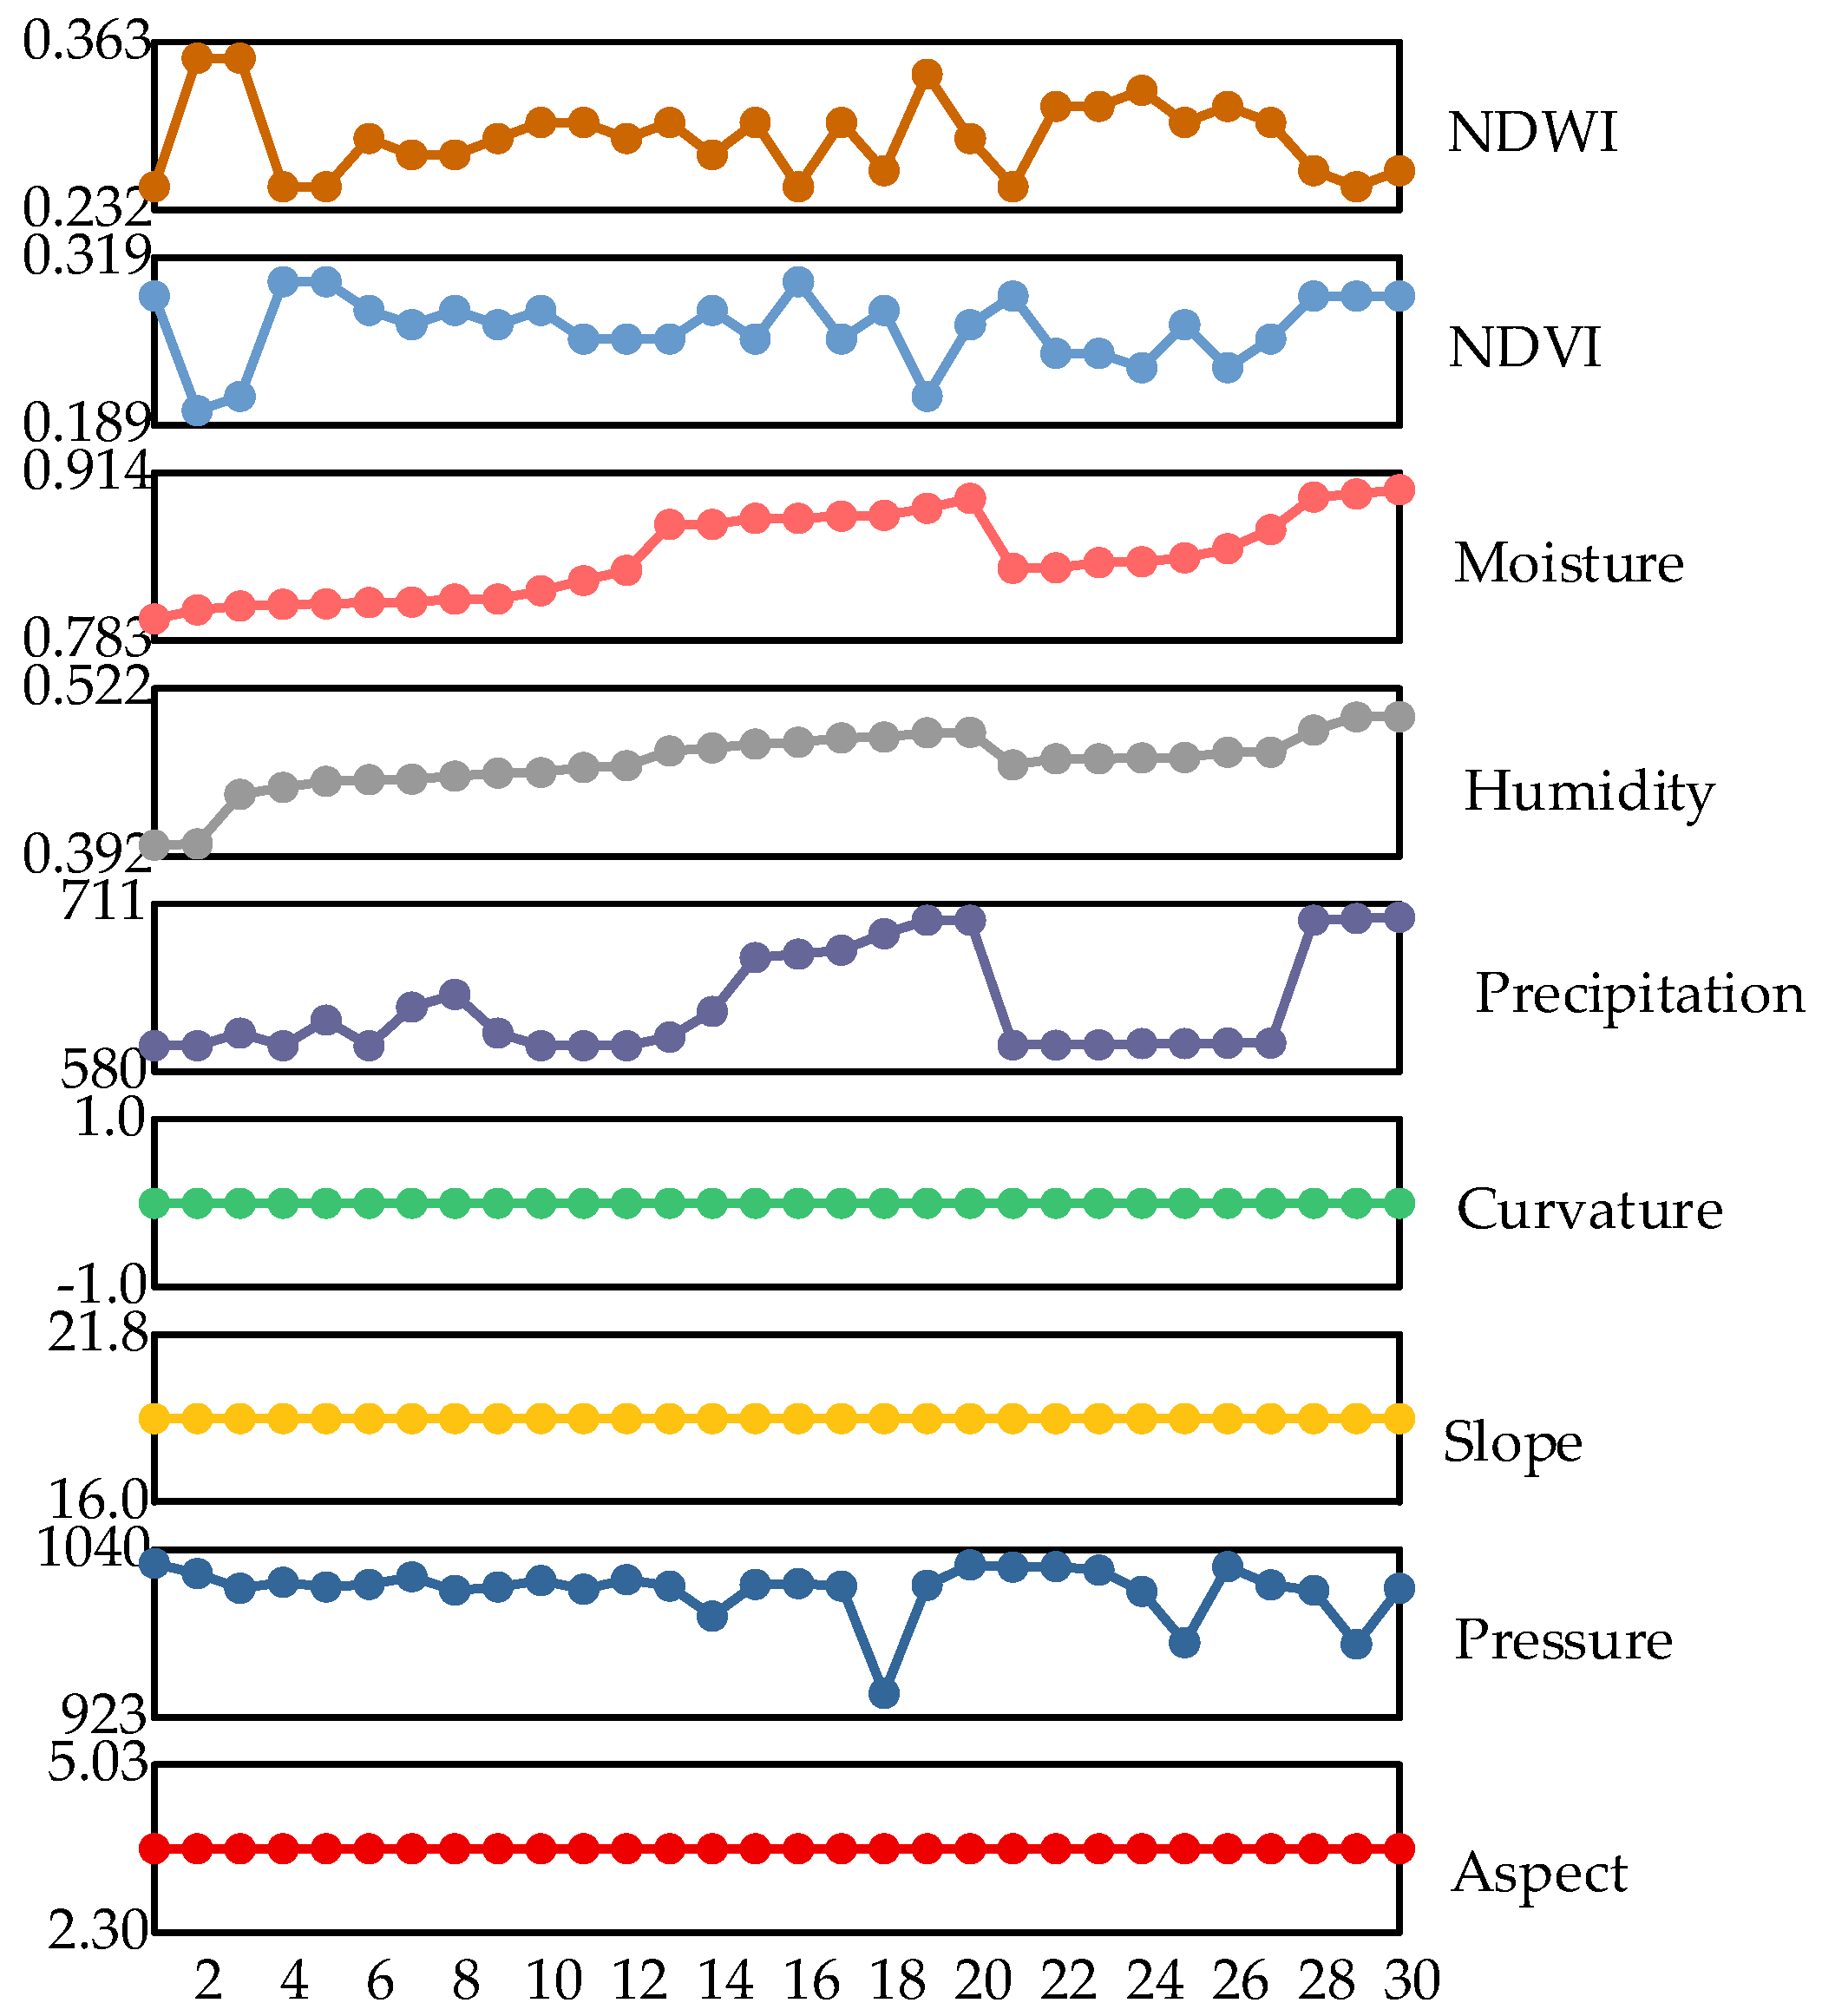
2.2. Selection of Assessment Indicators

Kai et al. [17] showed that geological conditions are important predisposing factors for landslides and the deformation of slopes, are the basic conditions for evaluating the stability of hydropower plant slopes, and are the factors that must be considered, as they determine the carrying capacity of slopes. These factors include the slope direction, pore water pressure, slope gradient, and curvature, which are interrelated and interact with each other, and together, they determine the stability of hydropower station slopes and the risk of geohazards. In addition, geological conditions also affect the rainfall distribution and the formation of surface runoff, which in turn affect slope stability.
Meteorological conditions are important factors affecting the stability of hydropower plant slopes, and they affect slope stability more in densely vegetated alpine valleys [18], as 90% of slope instability is triggered by meteorological conditions [19]. The meteorological conditions selected in this study include precipitation, humidity, and moisture. Among these, precipitation is the main meteorological factor affecting slope stability, and a large amount of precipitation rapidly increases the moisture content in soil, enhances pore water pressure, and triggers slope sliding. At the same time, precipitation also increases soil erosion, leading to soil structure loosening, and then reduces the bearing capacity of the slope and slope stability and increases the risk of geologic disasters occurring in hydropower station slopes.
Hydropower stations are often located in high mountain valleys and flowing water zones, and their environments are more complex and changeable. Based on this, this study introduces additional ecological environment-related variables in the selection of characteristic variables, including the Normalized Vegetation Index (NDVI) and Normalized Difference Water Body Index (NDWI). The NDVI reflects the growth density and health of plants; a higher NDVI value means more luxuriant plant growth and a more developed root system, which can fix soil better and strengthen the stability of the slope. The value of the NDWI can reflect the existence of surface water bodies; a higher NDWI value indicates that there is a greater risk of erosion and disaster, which reduces the stability of the slope. To summarize, the characteristic variables selected in this study are shown in Table 1.

2.3. Correlation Analysis

In slope stability studies, identifying the key influencing factors and their interrelationships is crucial for the accurate prediction of landslide risk. To gain a deeper understanding of the potential linkages between individual characterization variables, this study used the Pearson’s correlation coefficient method to assess the linear relationships of the characterization variables, which were calculated using the following formula:
r = i = 1 n ( x i - X ¯ ) ( y i - Y ¯ ) i = 1 n ( x i - X ¯ ) 2 i = 1 n ( y i - Y ¯ ) 2
where x and y are the feature variables, X ¯ and Y ¯ are the sample means of the feature variables, and x i , y i are the samples of the feature variables x and y .
According to the correlation judgment rule proposed in [20], when the absolute value of the Pearson correlation coefficient is less than 0.2, it indicates that there is no obvious correlation between the two indicators. Conversely, when the absolute value is greater than 0.7, it indicates that there is a strong correlation between the indicators. By calculating the correlation coefficient between the characteristic variables, the results are obtained and are shown in Figure 2.
As can be seen in Figure 2, the correlation coefficient of the ecological environment variables NDVI and NDWI is 0.94, with a strong linear correlation, and that of rainfall and geotechnical water content is 0.43, with an obvious linear correlation. However, although some linear correlations exist for some of the characteristic variables, overall, landslide stability exhibits a complex, nonlinear relationship.

2.4. Sample Dataset Preprocessing

2.4.1. Outlier Detection

In statistics, outliers are data points that are significantly different from other observations, and they can cause serious problems in statistical analysis. In machine learning models, the quality of the sample dataset determines the upper limit of the machine learning output results because the model is very sensitive to the range and distribution of values. Although the random forest model has excellent outlier tolerance compared with other machine learning models, the presence of outliers can also distort the model to some extent, resulting in a longer training time and reduced accuracy and performance. Values also distort the model to a certain extent, thus leading to a longer training time, lower accuracy, and poorer performance, so outlier detection needs to be performed on the dataset before training the model to improve the quality of the dataset [21].
Local outlier factor (LOF) is a density-based outlier detection algorithm that detects outliers by measuring the density deviation between a data point and its neighbors (k neighbors) [22]. The steps of the LOF algorithm are as follows:
Calculate the distance from data point p to the k neighboring point:
k _ d i s t a n c e ( p ) = ( x 1 p x 1 k ) 2 + ( x 2 p x 2 k ) 2 + + ( x n p x n k ) 2
where x 1 , x 2 , x n are the characteristic variables of the dataset.
For a data point p , compute the set of all data points within k distances, i.e., the k-distance neighborhood, denoted as k n n ( p ) . For the set of data points q within the set, the distance to p is denoted as d ( p , q ) .
Compute the reachable distance from data point q to p in k n n ( p ) :
r e a c h _ d i s t ( p , q ) = m a x { d ( p , q ) , k _ d i s t a n c e ( q ) }
Compute the local reachable density and local outlier factor for data point p :
l r d ( p ) = 1 q k n n ( p ) r e a c h _ d i s t ( p , q ) / k
L O F ( p ) = 1 k q k n n ( p ) l r d ( q ) l r d ( p )

2.4.2. Data Sample Balance

In this study, when constructing the dataset, the number of samples of slope stability is much larger than that of slope instability, and the dataset samples are not balanced. If the imbalanced samples are used directly to train the model, the model will learn a priori information about the proportion of the samples in the training set, which can lead to over-reliance and overfitting problems, and its evaluation results will also be emphasized on the majority of classes, which will decrease its accuracy. In this study, we use the Synthetic Minority Over-sampling Technique (SMOTE) [23] to balance the samples, as it can effectively expand the training dataset without increasing noise, thus improving the accuracy of the model. Its formula for synthesizing new samples is as follows:
x n = x i + R a n d ( 0 , 1 ) × ( x i z x i )
In this formula, x i is a sample in a small number of samples; x i z is the z sample randomly selected from the K -nearest neighbors via the sampling multiplicity N ; x n is a newly generated sample; R a n d ( 0 , 1 ) is a random number in (0,1).

3. Bayesian Random Forest for Slope Risk Assessment

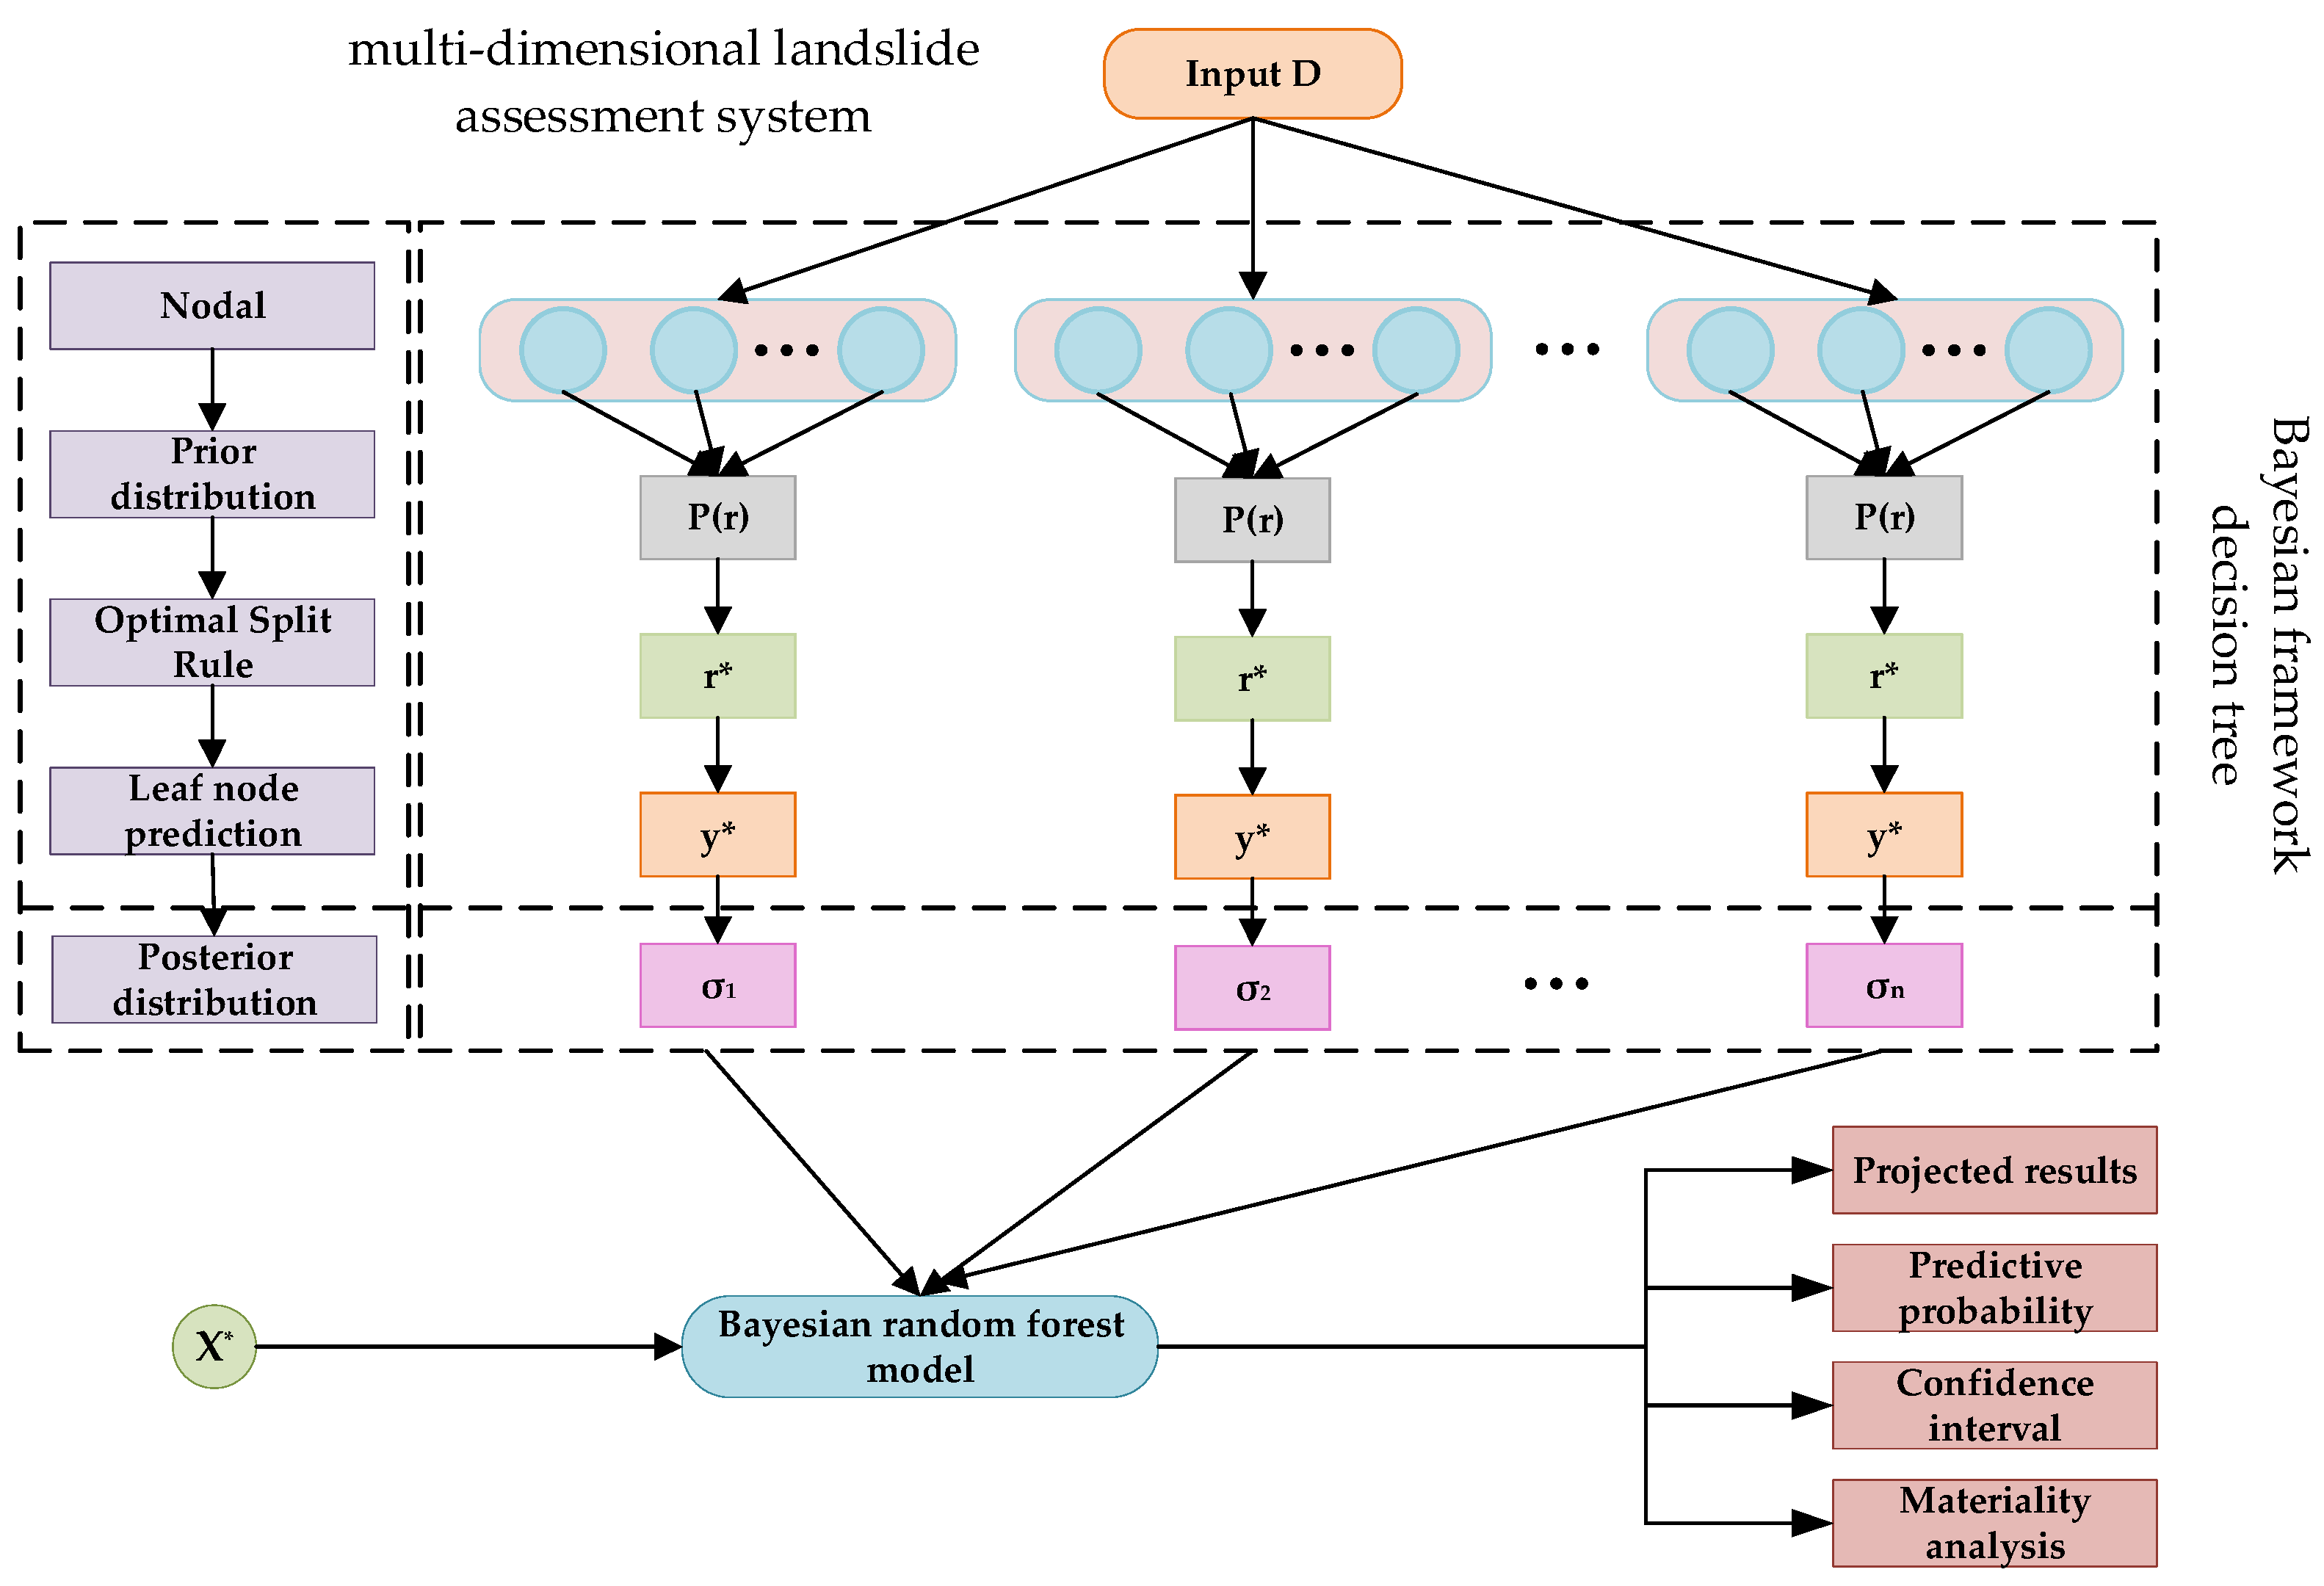
3.1. Bayesian Random Forest Risk Assessment Model Structure

Random forest (RF) is an integrated machine learning model that combines the advantages of decision trees and integrated learning to efficiently handle high-dimensional data and complex nonlinear relationships [24]. Random forests provide accurate and reliable predictions by constructing multiple decision trees to predict the results, which can not only effectively handle many input features but also have a high tolerance for outliers and missing data.
The landslide risk assessment used for hydropower station slopes does not solely rely on historical data. It also involves the interactions of hydrological conditions, meteorological changes, and other complex factors, which exhibit nonlinear, multi-featured, and significant time lag characteristics. Not only should the accuracy of the prediction be considered, but the uncertainty of the prediction results is equally important. Traditional random forests, while providing accurate results, are deficient in terms of quantifying the uncertainty of the predicted results. Therefore, in this study, we combine the Bayesian statistical framework with random forests to build a Bayesian random forest model, which provides a probability distribution for each prediction result through Bayesian inference, thus effectively quantifying the uncertainty of the prediction. The structure of the Bayesian random forest is shown in Figure 3.
The Bayesian random forest model introduces the Bayesian statistical framework when constructing the decision tree and first sets the prior distribution for the splitting rule and structure of each decision tree when performing the landslide risk assessment of hydropower station slopes. In this study, to enhance model training efficiency to reduce computational burden, the uniform distribution is used as the split rule prior distribution, and to prevent the model from being too complex and overfitting, the number of nodes that decayed prior is used as the prior distribution of the decision tree structure:
P ( r ) = 1 R = 1 m × k
P ( T ) = e υ n ( T ) T Τ e υ n ( T )
where R is the number of all splitting rules; m is the number of features of the decision tree nodes; k is the number of nodes that may split for each feature; n ( T ) denotes the number of nodes of the structure; υ is the hyperparameter controlling the strength of the a priori information; and Τ is the set of all decision tree structures.
After setting the prior distribution, the quality of each splitting rule is evaluated by selecting the best splitting rule based on the posterior probability under the Bayesian statistical framework. The splitting rule r splits the set of samples D n from the node into two subsets D r i g h t and D l e f t . When carrying out hydropower station slope landslide risk assessment, this study uses conditional probability to represent the likelihood function:
L ( D n r ) = P ( D n r ) = k { l e f t , r i g h t ) P ( D k T k )
P ( D k T k ) = i D k p k y i ( 1 p k ) 1 y i
p k = i D k y i D k
where D k is the set of all samples in the child node k ; p k is the probability that a sample in the child node k belongs to a landslide; and y i is the target variable for the i sample.
According to Bayes’ theorem, the posterior probability of the splitting rule is as follows:
P ( r D n ) = L ( D n r ) P ( r ) r R L ( D n r ) P ( r )
The optimal splitting rule for the decision tree at this point is the following:
r * = arg max r P ( r D n )
To improve the generalization of the model, B e t a ( α l , β l ) is used as the prior distribution of the leaf nodes of the decision tree, and the posterior distribution of the nodes is as follows:
P ( p l D l ) = B e t a ( α 1 + i D l y i , β l + N l i D l y i )
where N l is the number of samples in node l and p l is the probability that a sample in node l belongs to a landslide.
At this point for sample x * , the prediction results and uncertainty of the nodes can be measured using the posterior mean and the standard deviation of the posterior distribution:
p l = α l + i D i y i α l + β l + N i
y * = arg max y P ( y x * , D )
σ l = p l ( 1 p l ) α l + β l + N l + 1
where y * is the prediction category of the pair x * and σ l is the standard deviation of the posterior distribution.
After constructing M decision trees, the final predicted probability of the Bayesian random forest for sample x * belonging to a landslide is as follows:
P ( y * = 1 x * , D ) = 1 M m = 1 M p l m
where p l m is the predicted probability of each decision tree in the Bayesian random forest model that the sample x * belongs to a landslide.
The confidence interval for each decision tree prediction result is the following:
C I 95 % ( y * = 1 | x * , D m ) = ( p l m 1.96 σ l m , p l m + 1.96 σ l m )
σ l m = p l m ( 1 p l m ) α l m + β l m + N l m + 1
where C I 95 % ( p l m ) and σ l m are the confidence interval and standard deviation of the predicted probability for each decision tree, respectively.
The confidence interval for the final prediction result y * is as follows:
σ a v g = 1 M m = 1 M σ l m 2
C I 95 % ( y * ) = ( P ( y * = 1 x * , D ) 1.96 σ a v g , P ( y * = 1 x * , D ) + 1.96 σ a v g )

3.2. Characteristic Importance Analysis Methods

Feature importance analysis is of great significance in hydropower plant slope landslide risk assessment and is crucial in understanding model decisions and optimizing feature selection. In this study, the Gini index and SHAP values (SHapley Additive exPlanations, SHAP, values) are used to rank the importance of the nine selected feature variables and to analyze the influence of each feature on hydropower station slope landslides in depth.
The Gini index assesses the importance of features for landslide risk assessment modeling by quantifying their effects on sample purity in a Bayesian random forest model [25]. The Gini index G I m of the nodes m in the model is as follows:
G I m = K = 1 K p m ( 1 p ) m
where K is the number of categories in the sample set. In this study, K = 2 . p m is the probability that a sample in a node l belongs to a landslide.
At this point, the characteristic variable X j importance is the following:
V j m = G I m G I l G I r
D i j = m M V j m
D j = 1 n i = 1 n D i j
where V j m is the amount of change in the Gini index before and after the node splits; M is the number of times the feature variable appears in the decision tree i ; n is the number of decision trees in the Bayesian random forest model; D i j is the importance of the feature variable in the individual decision tree; and D j is the importance of the feature variable in the whole model.
SHAP values (SHapley Additive exPlanations, SHAP, values) are based on cooperative game theory and are used to assess the importance of features by quantifying the specific contribution of each feature variable to a single prediction [26]. This method assigns a SHAP value to each feature, indicating its average impact on model predictions, providing a combined global and local ranking of landslide feature importance.
ϕ i ( x ) = S F \ { i } | S | ! ( | F | | S | 1 ) ! | F | ! ( f ( S { i } f ( S ) )
S H A P i = 1 N j = 1 N ϕ i , j
where ϕ i ( x ) is the SHAP value of the feature X i over sample x ; S is the set of excluded features X i ; F is the set of all features; f ( S ) is the predicted value of the model trained on the set of features S ; | S | and | F | are the number of features in sets S and F , respectively; S H A P i is the average SHAP value of the feature over all samples; N is the number of sample groups; and ϕ i , j is the SHAP value of the feature in the J sample.

3.3. Risk Assessment Model Training

To study the effects of the number of training samples on the performance of Bayesian random forest models, the occupancy ratio of the test set needs to be adjusted to compare the performance of the model under different occupancy ratios. Adjusting the test set using a smaller step size will lead to too many experiments and increase the computational cost, while too large a step size will lead to an insignificant trend in model performance or the loss of key information. Under comprehensive consideration, this study divides the test set occupancy into nine groups according to a step size of 0.1, and the model accuracy and training time under the training set occupancy obtained are shown in Table 2.
According to the analysis of the data presented in the table above, it is evident that the accuracy of the Bayesian random forest model is low when the proportion of training samples is below 70%. However, as the number of training samples increases, the model’s accuracy improves significantly, reaching over 90% once the training sample percentage exceeds 70%. This phenomenon can be attributed to the fact that with a smaller training set, the model cannot fully learn from the underlying patterns in the data, thus leading to lower accuracy. As the size of the training set increases, the model gains more information from the data, thereby enhancing its accuracy. The highest accuracy is observed when the training samples constitute 80% of the dataset. Beyond this point, further increases in the number of training samples result in a decline in model accuracy, while the training time continues to lengthen. This decrease in performance occurs because an excessively high proportion of training data causes the model to overfit to noise or random patterns within the data, ultimately reducing its effectiveness on the test set. Therefore, the final choice of training samples is selected as 80% of the dataset ratio to train the model; this ratio not only has a higher accuracy but also, to a certain extent, is better for controlling the training time.
In the process of machine learning, parameter settings are very important because the model parameters directly affect the training effect. There are many algorithms for optimizing hyperparameters for machine learning, and the most commonly used ones are grid search, random search, and Bayesian optimization [27]. Compared with grid search and random search, Bayesian optimization can obtain better results with fewer iterations and can quickly and accurately find the optimal solution of hyperparameters, so it is widely used in parameter combination optimization problems.
In this study, the Bayesian algorithm is used to find the optimal parameter combination of the Bayesian random forest model, and the steps in the process of using the Bayesian algorithm [28] are as follows. Step 1: set the parameter range to be optimized and initialized. Step 2: define the gain function. This study uses AUC-ROC, accuracy, etc., as the gain function to calculate the gain expectation (Expected Improvement, EI). Step 3: train the prediction model using the best parameter combinations, and then input the parameter combinations with the largest EI value into the model for training. The Bayesian optimization results are shown in Figure 4.
As can be seen from Figure 4, the model performance is the best when the number of iterations is three and remains stable with an increase in the number of iterations. Therefore, the final combination of parameters chosen for the hydropower plant landslide risk assessment model in this study is as follows: the number of decision trees is 17, the maximum number of features is 7, and the maximum depth is 5.

4. Application Testing and Analysis

In this study, the risk point location of the Zhangcungou of Pillow Head Dam first-level hydropower station in the Dadu River Basin is selected for the comprehensive assessment of hydropower station slope stability example verification, as shown in Figure 5. The Zhangcungou geohazard risk location is located outside the camp of the Pillow Head Dam first-level hydropower station, and geohazards, such as mudslides, originate from the ditch of the mountain behind the camp. The length of the ditch of the upper and lower mountains is about 3100 m, and the difference in elevation between the upper and lower mountains is about 1200 m. On 6 August 2019, there was a mudslide that blocked the culvert of Zhangcun ditch, which affected the inside of the camp and led to damage to equipment and facilities.

4.1. Access to Evaluation Indicators

The indicators of the topographic and geomorphologic types of risk point locations in Zhangcun Gully in September 2024 were obtained through the geospatial data cloud (https://www.gscloud.cn/ (accessed on 9 February 2025)) and the GNSS equipment installed by Pillow Head Dam Company. The slope direction faces southwest, the slope is 18.9%, and the curvature is 0.0024 rad/m. For the rest of the meteorological and ecological data that need to be monitored in real time, corresponding sensors are installed at the potential risk point locations of the slope for the real-time monitoring and data collection of the selected characteristic variables. The locations where sensor installation and monitoring were conducted are shown in Figure 6.
At the Zhangcun Gully geohazard risk site, to realize the regular and timed collection of slope-related data, we set up two monitoring areas along the slope’s direction and installed a variety of sensors in each monitoring area. These devices can monitor pore water pressure, rainfall, humidity, geotechnical water content, the NDVI, the NDWI, and other characteristic variables in real time, providing key data for the comprehensive assessment of hydropower plant slope stability.
To ensure that neighboring residents and hydropower station staff can be quickly notified when the slope is in critical stability or destabilization, we deployed wireless speakers at the foot and top of the slope. When the sensors detect slope instability or rapid changes in data, loudspeakers will automatically issue an early warning to minimize the damage caused by geologic hazards and more effectively protect the lives and properties of the surrounding residents and hydropower plants. The slope data of Zhangcun ditch obtained through the sensor monitoring network are shown in Figure 7.
As shown in this figure, continuous rainfall from 14 September 2024 to 20 September 2024 resulted in a significant increase in humidity and soil water content. This increase may have compromised the stability of the hydropower plant’s slopes, thereby increasing the risk of landslides. As the rainfall gradually decreases, the humidity and soil water content are expected to return to the normal range due to the recovery of temperature and plant transpiration, thus reducing the risk of landslides on the slopes.

4.2. Example Assessment Results

The data of the Zhangcungou landslide risk location were input into the trained Bayesian random forest risk assessment model. The assessment results are shown in Figure 8.
In this figure, red indicates the probability of landslides occurring on the slopes of the hydropower station, and blue represents the probability of slope stabilization. As shown in this figure, the probability of landslide occurrence at the risk location of Zhangcun Gully gradually increased from 16 September 2024. This change is mainly due to continuous rainfall, which increased the soil moisture and soil water content, thus resulting in a decrease in soil shear strength, increasing the risk of landslides. In addition, with the rise in the soil water content, the pore water pressure also rose, further reducing the effective stress of the soil, thus weakening the stability of slopes. The heavy rainfall on 28 September 2024 further increased the landslide risk.
As can be seen from the model assessment results, the changes in landslide risk predicted by the model are consistent with the changes in the assessment indicators in the study area, which confirms the validity of the hydropower station landslide risk assessment model established in this study. It is worth noting that the confidence interval of the model prediction results is less than 5%, which indicates that the prediction results of the model have good credibility. This high-precision and high-confidence landslide risk assessment is crucial for the safety management of hydropower stations.

4.3. Characteristic Importance Analysis

The order of importance of the model feature variables is shown in Figure 9. As can be seen in this figure, rainfall is ranked first in the ranking results of both methods, and the importance of rainfall is obviously greater than that of the other feature variables. The importance of slope direction is in last place in the ranking of both methods, and that of the rest of the feature variables is ranked as follows: humidity, geotechnical water content, NDWI, pore water pressure, NDVI, slope, and curvature. The results obtained via the two methods are slightly different.
The importance analysis methods of random forests exhibit quantitative differences in this study. Given these differences, a direct and comprehensive comparison between them may not be sufficiently convincing. Thus, to make more objective conclusions, this study subsequently normalized the summation method to synthesize the ranking results of the two types of importance analyses. The normalized sum method was used to normalize the results obtained from the Gini index and SHAP method to 0~1, as shown in Figure 10.
As shown in this figure, rainfall, humidity, and soil moisture content have the highest importance in the landslide risk assessment of hydropower station slopes, with scores of 2.182, 1.237, and 1.203, respectively.
From the above analysis of the importance ranking of the normalized sum method, the following can be concluded.
The importance of rainfall is far greater than that of the other characterizing variables. Rainfall is about twice as important as humidity and geotechnical water content. The reason for this is that a large amount of rainfall will rapidly increase the moisture content in soil, increase the humidity and soil water content, and elevate pore water pressure, which triggers slope sliding. Therefore, for hydropower plant slope landslide risk assessment, rainfall should receive more attention than other characteristic variables.
The moisture and soil water content are second in importance only to rainfall. Humidity reflects the amount of water in soil. Excessive humidity may lead to an increase in pore water pressure, reducing the bearing capacity of soil and increasing the risk of slope landslides. Geotechnical water content is directly related to the physical properties and mechanical characteristics of soil, and when the soil water content is too high, the strength of the soil body decreases, thus making it prone to landslides or collapses. Therefore, a change in geotechnical water content has a significant effect on the landslide risk of hydropower station slopes.
The overall importance value of the ecological environment characteristic variables NDVI and NDWI is 1.239, which is comparable to the importance scores of humidity and geotechnical water content. This value is about 1.5 times the importance scores of the curvature, slope, and slope direction, and it accounts for about 17% of the overall importance of the characteristic variables and about 23% of the importance of rainfall without considering rainfall changes, thus indicating that in the stability assessment of hydropower plant slopes, the ecological environment is not negligible. Therefore, it is necessary to carry out research on ecological environment indicators in landslide risk assessment.

5. Conclusions

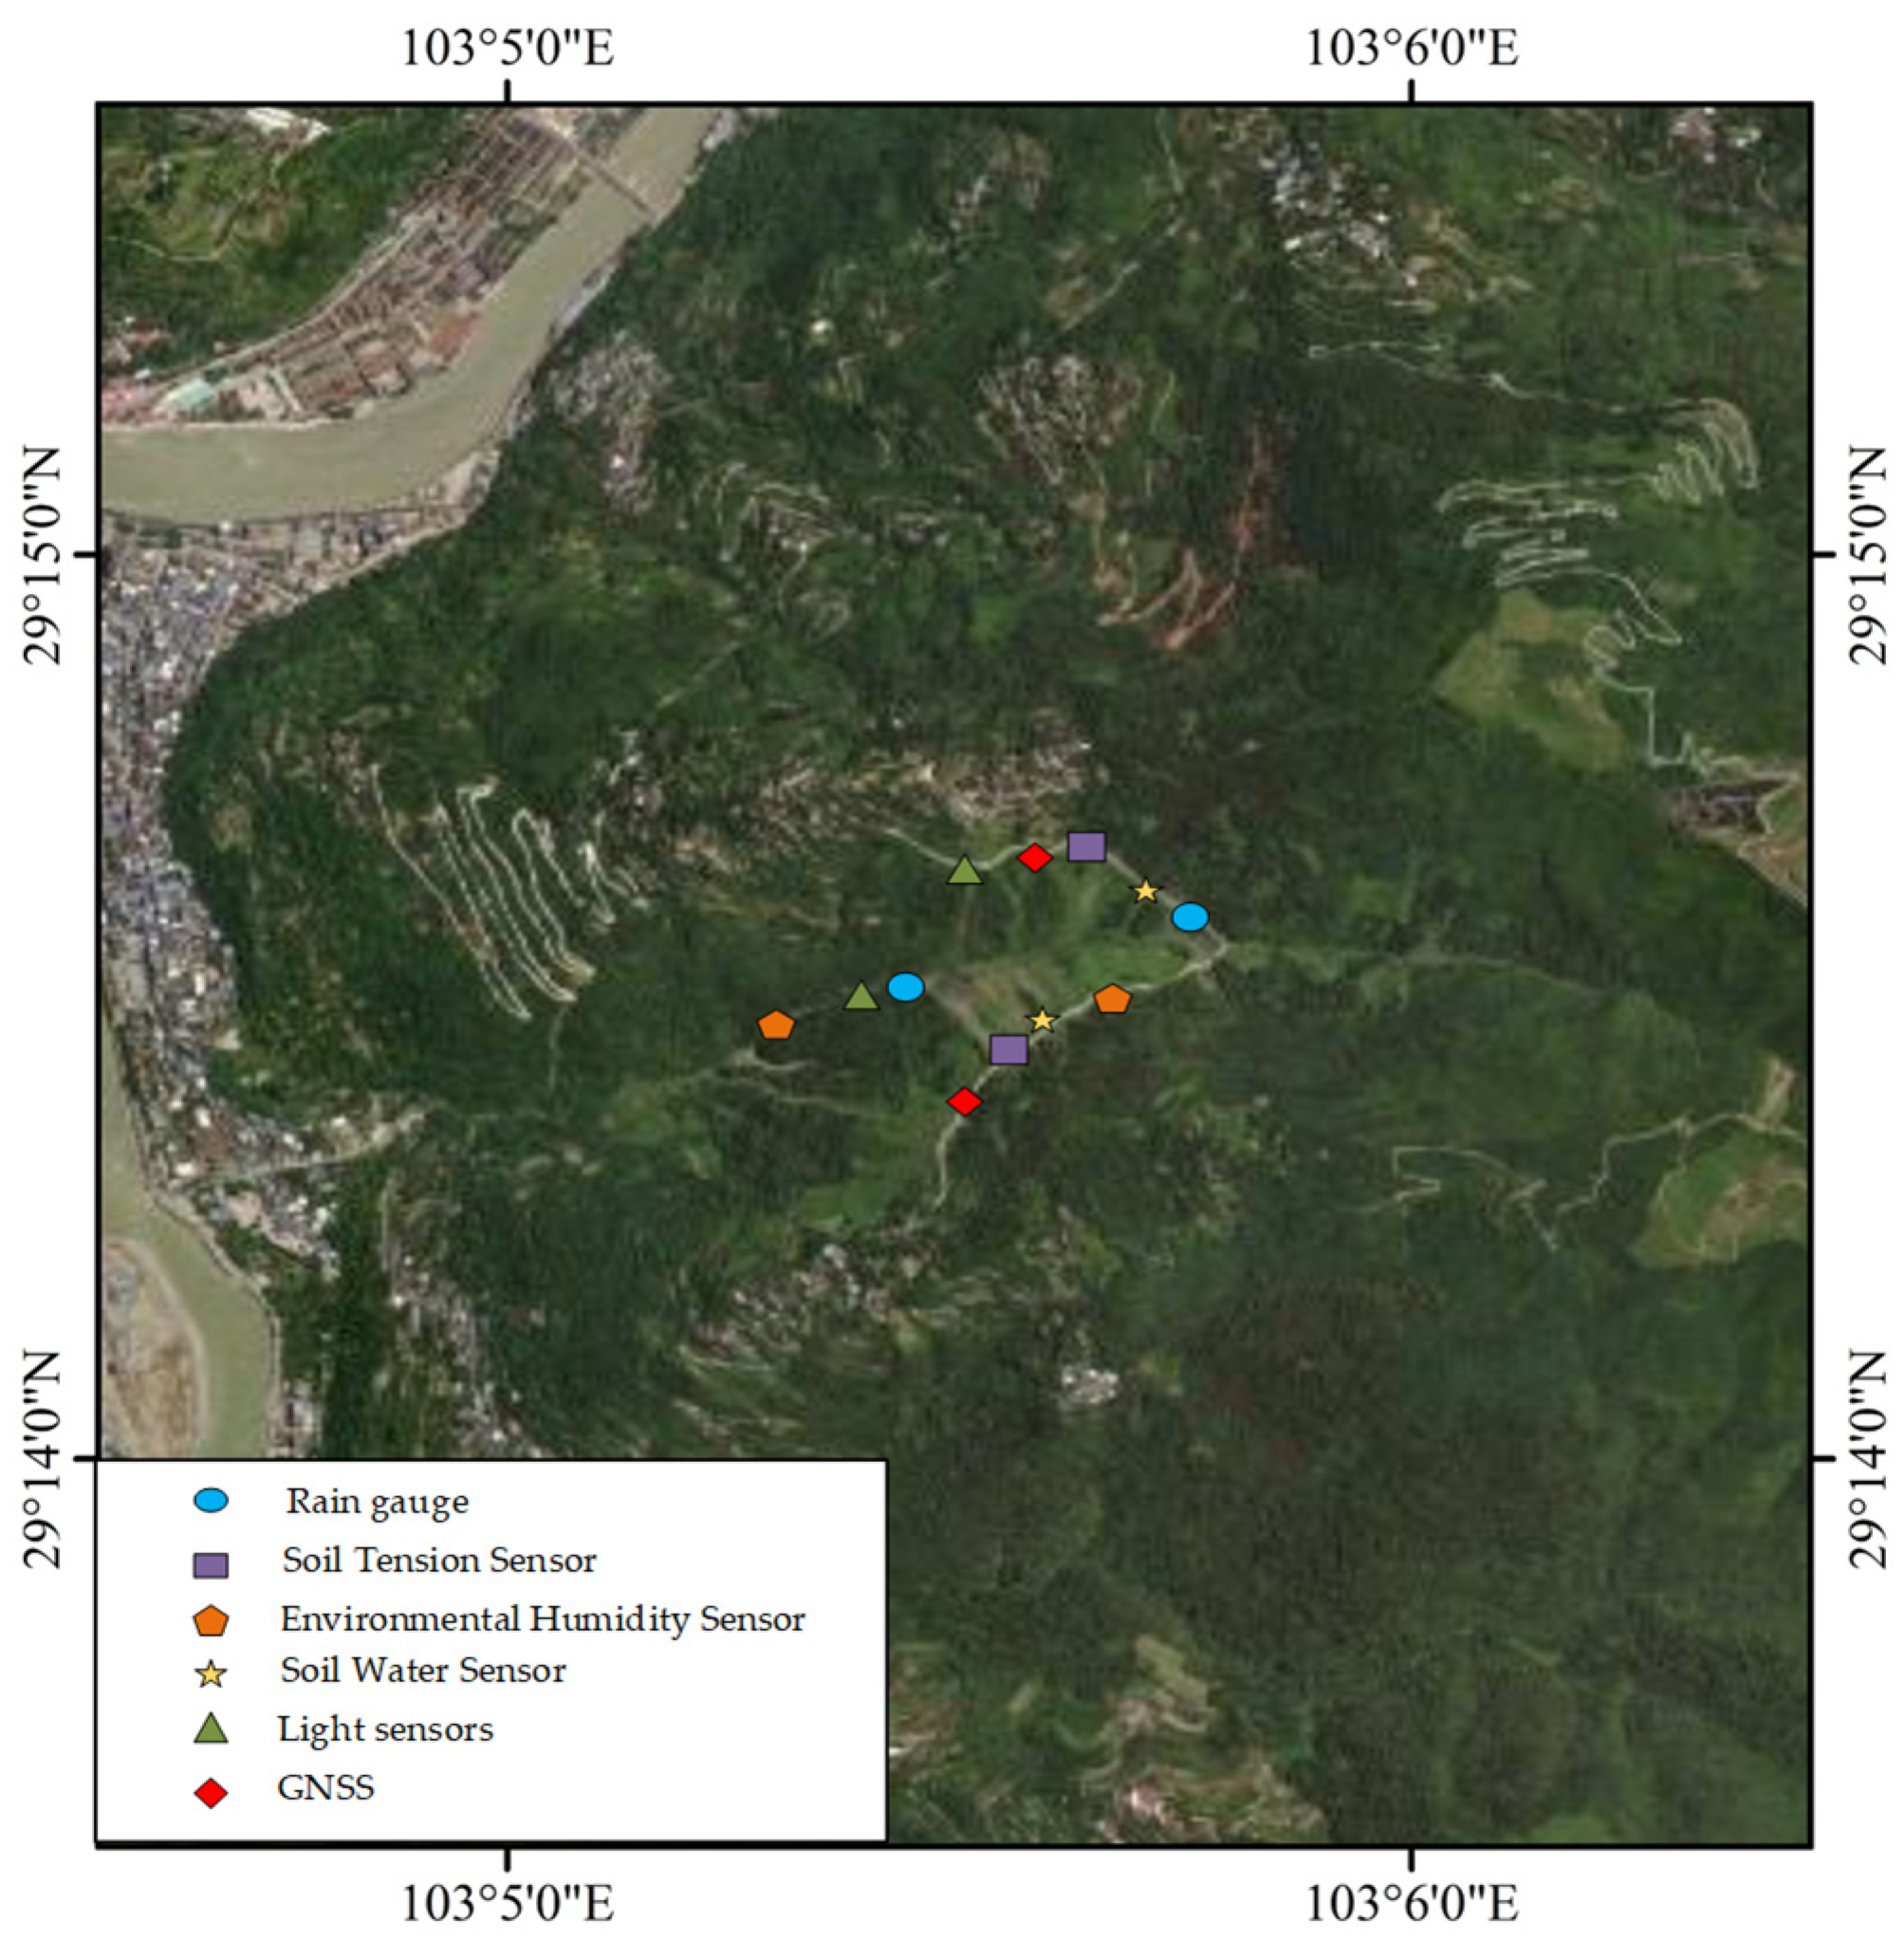
  • This study carried out a landslide risk assessment of hydropower station slopes, integrating meteorological and ecological data, and thoroughly investigated the multifaceted factors affecting slope stability. A multidimensional landslide risk assessment system covering geological conditions, meteorological conditions, and the ecological environment was established.
  • In view of the complexity of the slope landslide system and the uncertainty of the prediction results, this study introduced a Bayesian statistical framework into a random forest model and established a Bayesian random forest model for slope landslide risk assessment. This model not only assessed and predicted the slope risk but also quantified the uncertainty of the model prediction results, which is of great significance for the development of risk strategies for hydropower stations.
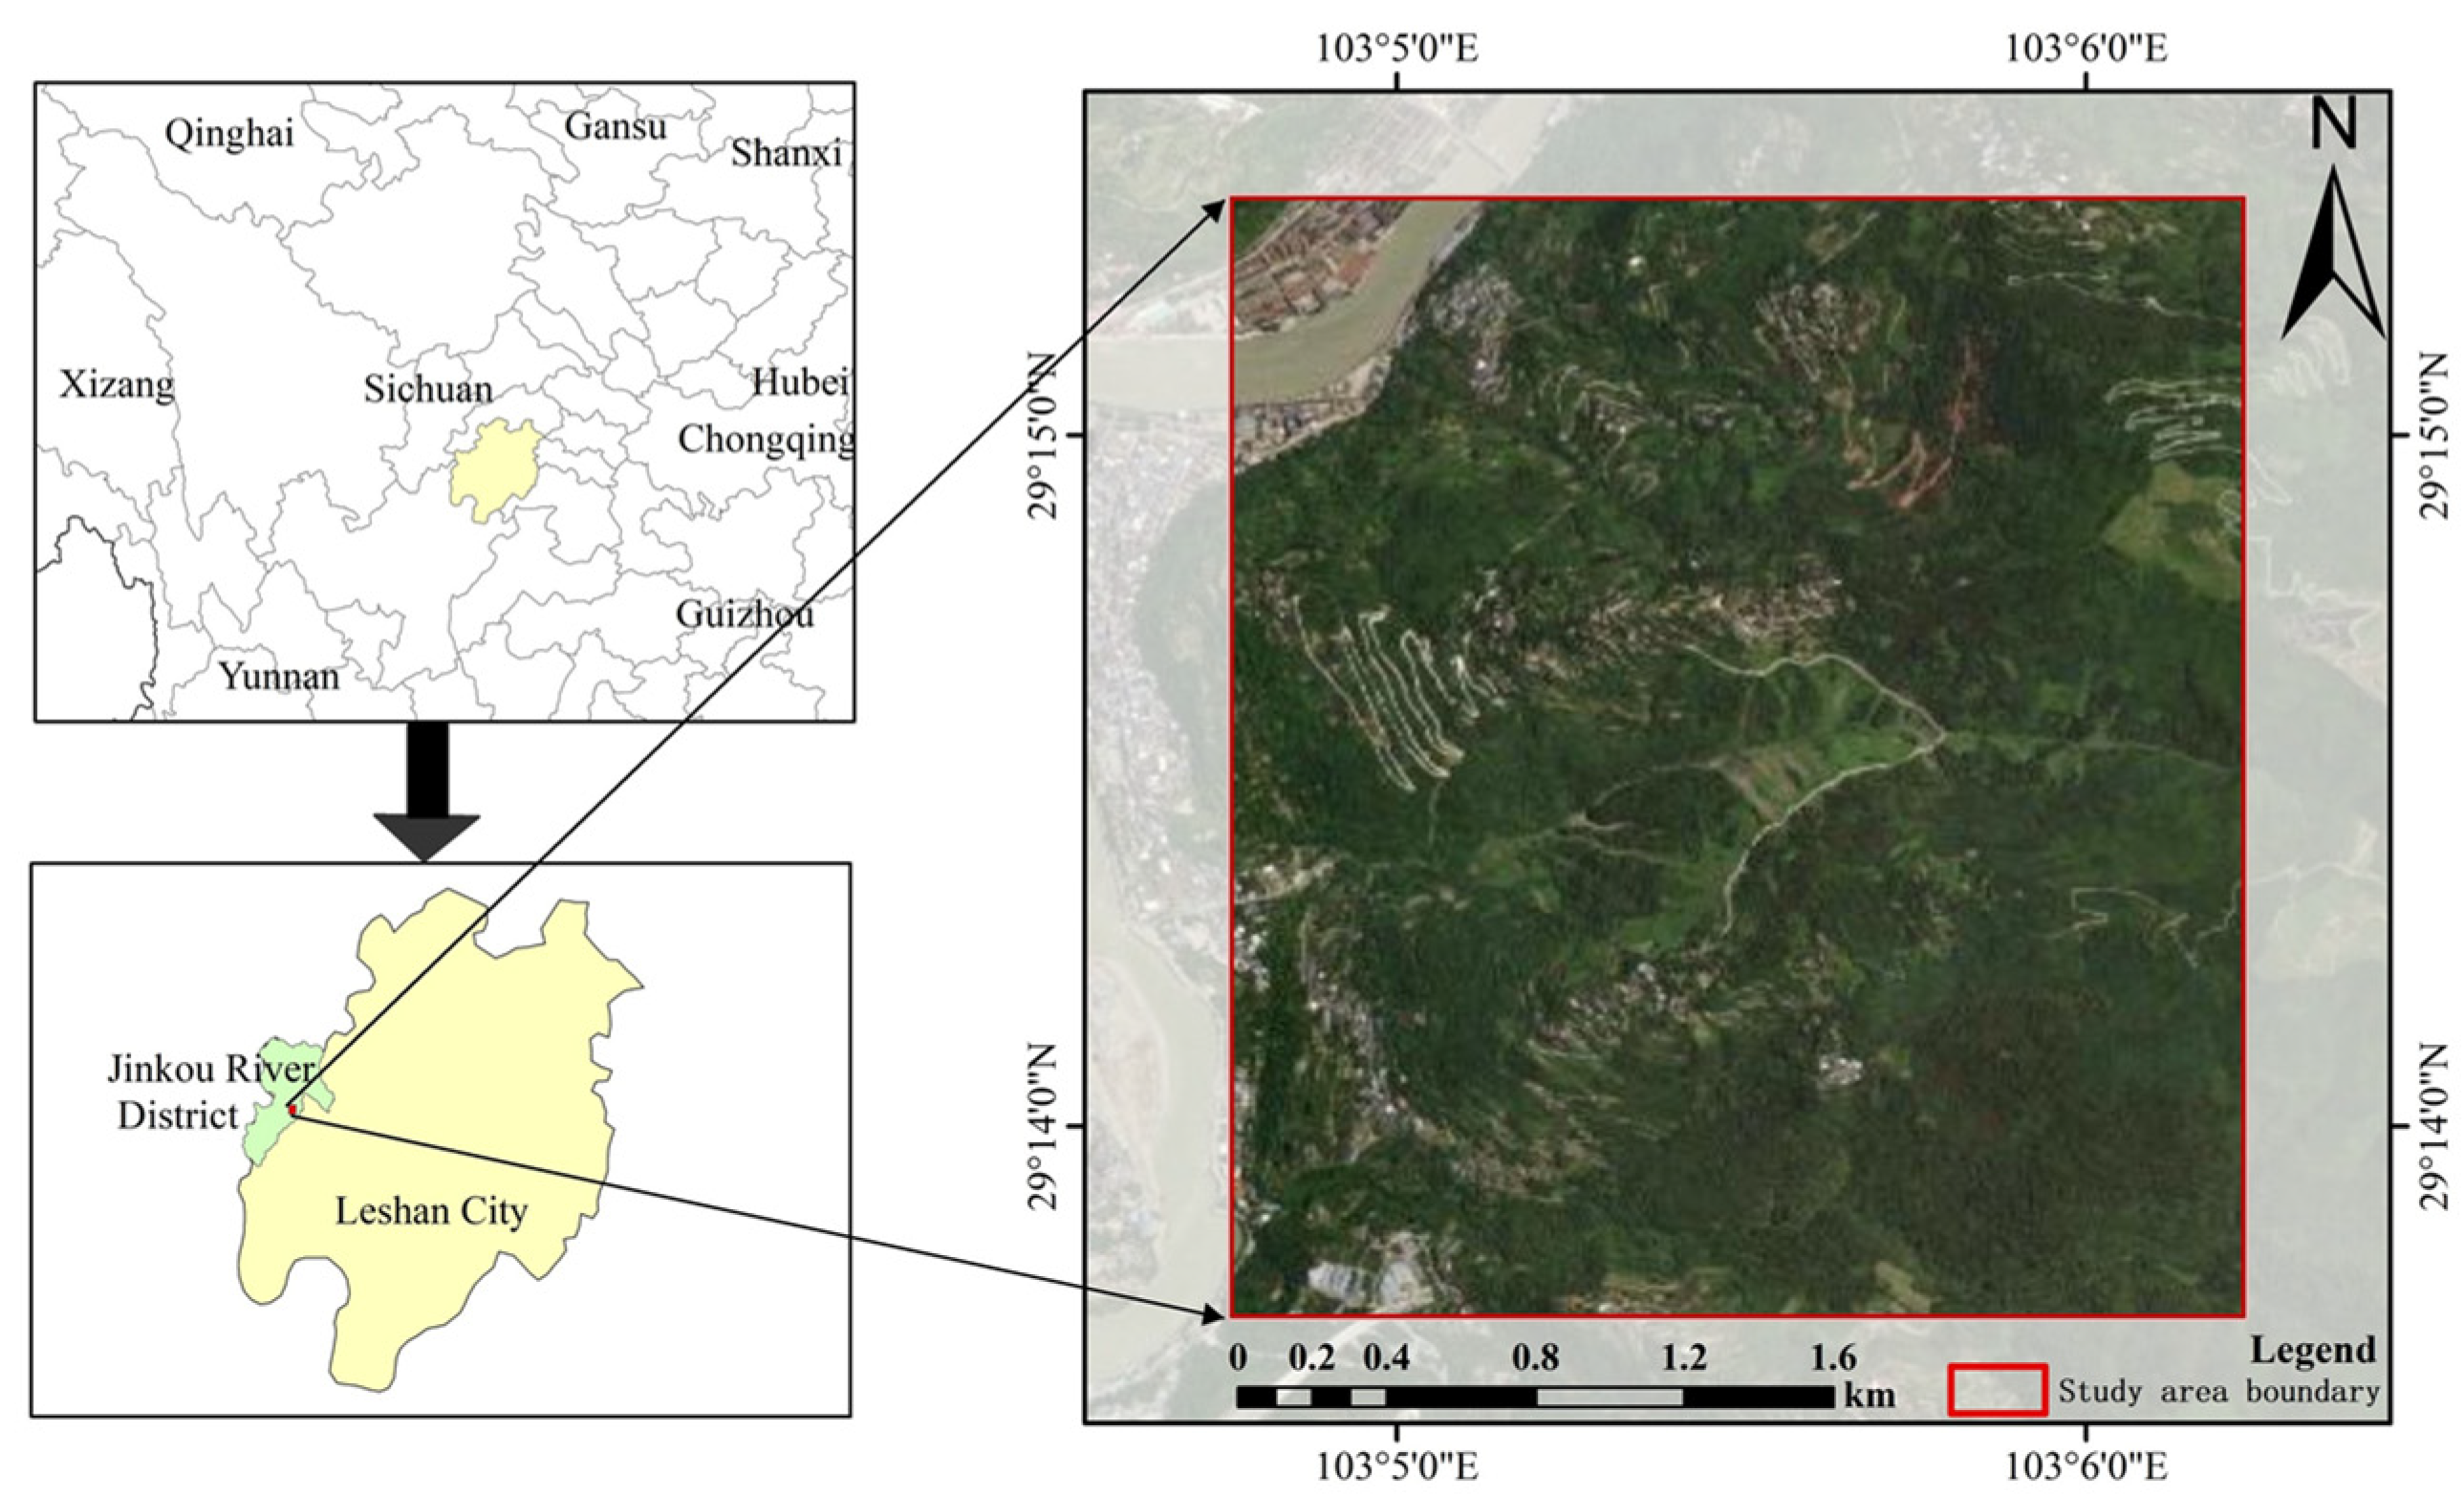
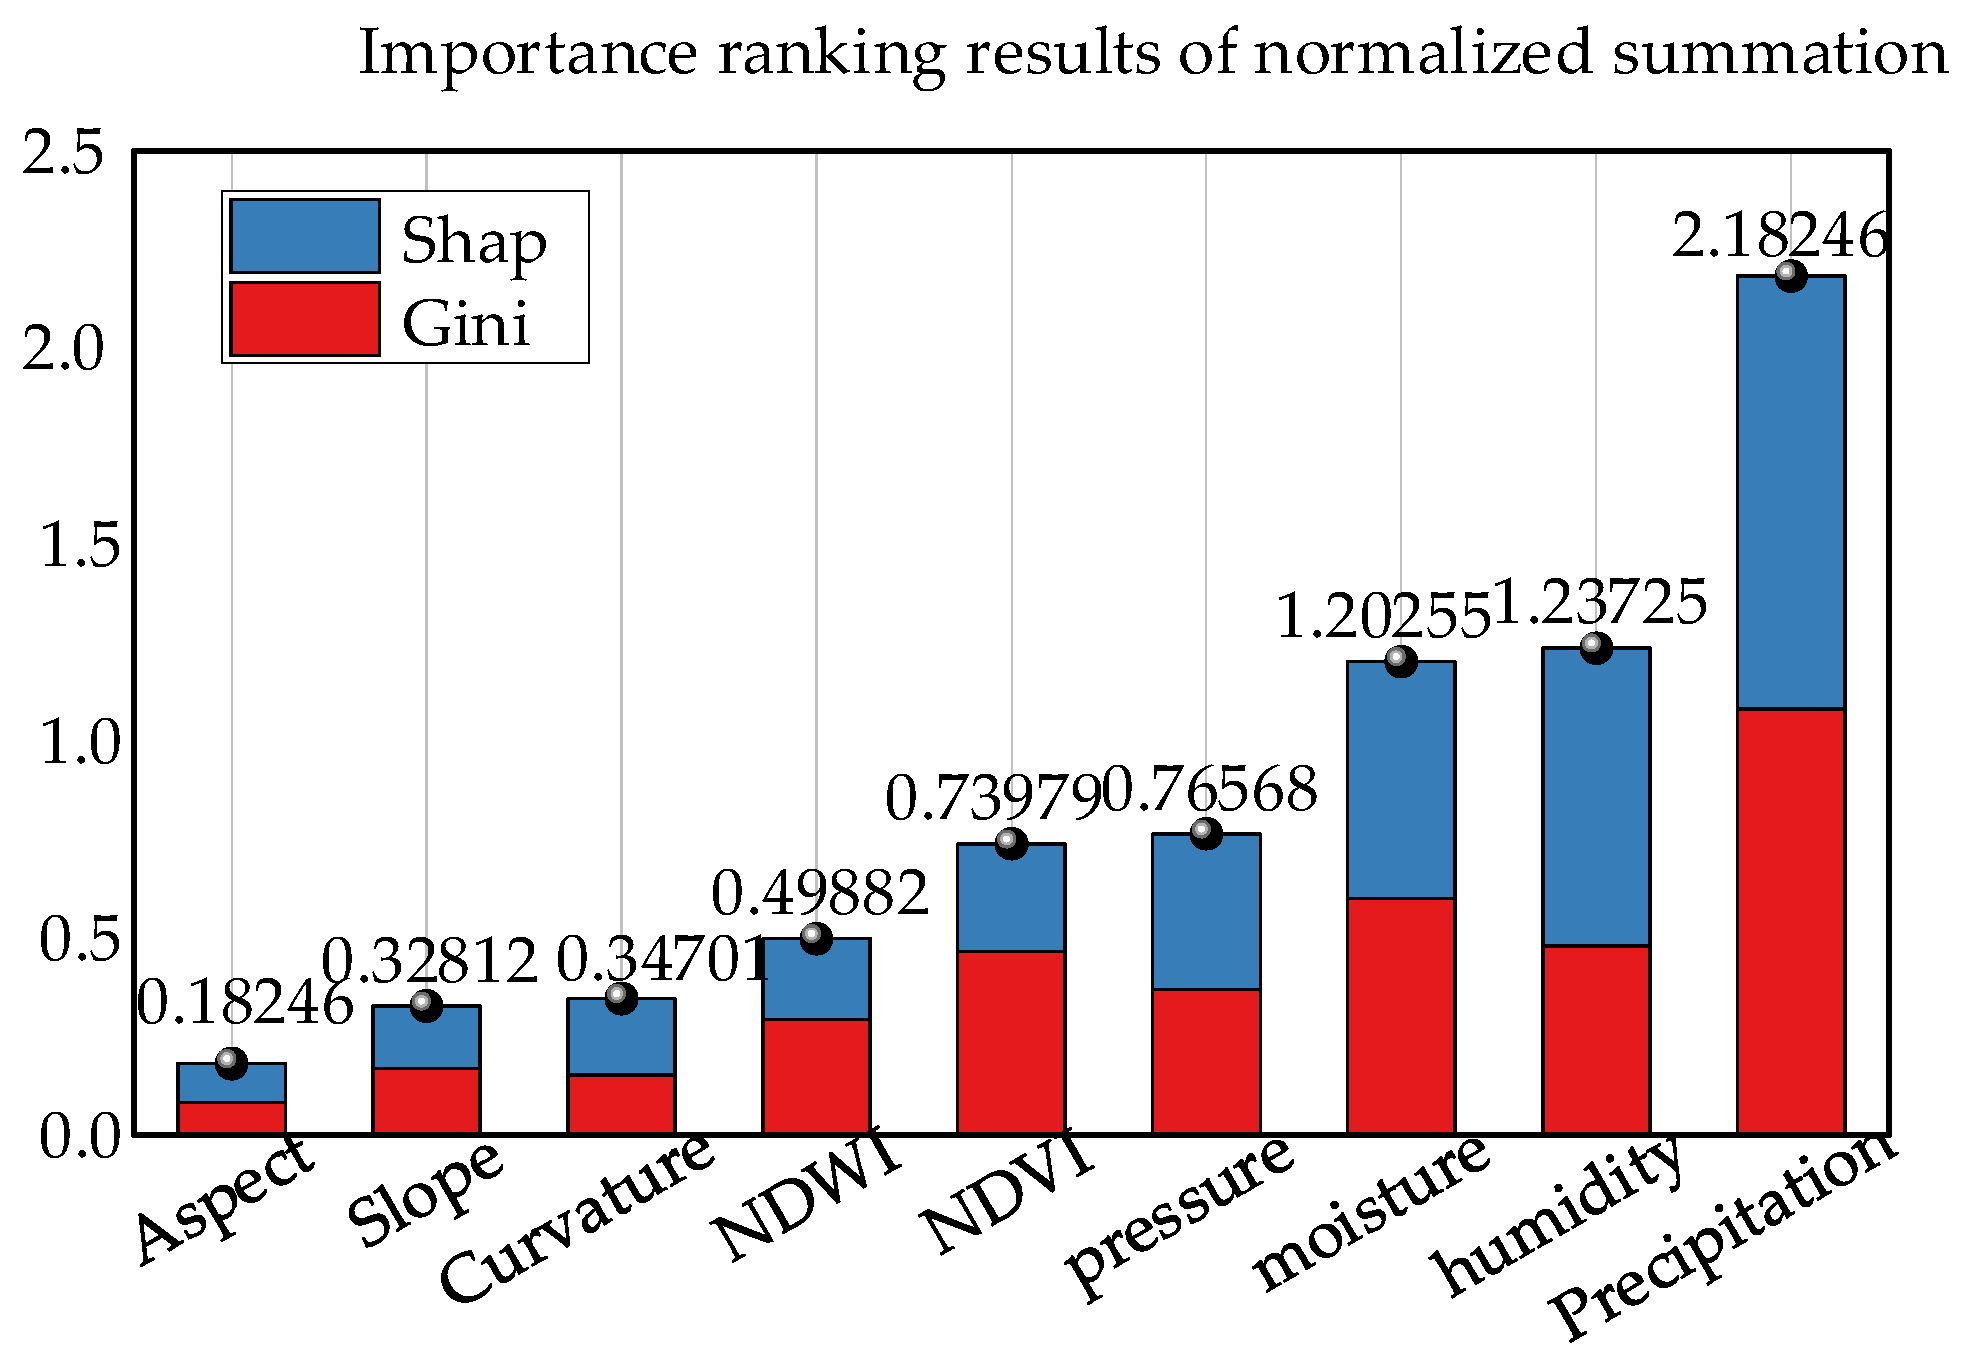
  • This study also analyzed feature importance using the Gini index and SHAP value, identified the key factors affecting the slope landslide risk, and provided a scientific basis and technical support for the safety management of hydropower station reservoir areas. A model was applied to the slopes of the hydropower station reservoir area in the Dadu River Basin, Southwest China, to verify its ability to accurately assess the slope landslide risk, which provides strong support for long-term slope risk management and prevention.

Author Contributions

Conceptualization, A.W. and Z.Y.; methodology, H.K.; validation, J.Y.; writing—original draft preparation, A.W.; writing—review and editing, J.Y.; visualization, Z.Y.; supervision, S.H.; project administration, M.J.; funding acquisition, J.Y. All authors have read and agreed to the published version of the manuscript.

Funding

This research was funded by the Key R&D Program of Sichuan Provincial Department of Science and Technology, grant number 2022YFG0120.

Data Availability Statement

The data presented in this study are available on request from the corresponding author. The data are not publicly available due to privacy.

Acknowledgments

The authors would like to thank the Dadu River Basin Reservoirs and Dams Management Center of China National Energy for their support of this project.

Conflicts of Interest

The authors declare no conflicts of interest.

References

  1. Solarin, S.A.; Bello, M.O.; Olabisi, O.E. Toward sustainable electricity generation mix: An econometric analysis of the substitutability of nuclear energy and hydropower for fossil fuels in Canada. Int. J. Green Energy 2021, 18, 834–842. [Google Scholar] [CrossRef]
  2. Chu, S.J.; Dhakal, S.; Ou, C. Greening small hydropower: A brief review. Energy Strategy Rev. 2021, 36, 100676. [Google Scholar] [CrossRef]
  3. Bessa, R.; Moreira, C.; Silva, B. Role of pump hydro in electric power systems. J. Phys. Conf. Ser. 2017, 813, 012002. [Google Scholar] [CrossRef]
  4. Padmaja, S.B.; Reddy, G.; Reddy, E.S. Landslide stability analysis using mathematical approach. Mater. Today Proc. 2022, 51, 596–599. [Google Scholar] [CrossRef]
  5. Cai, F.; Ugai, K. Numerical Analysis of Rainfall Effects on Slope Stability. Int. J. Geomech. 2004, 4, 69–78. [Google Scholar] [CrossRef]
  6. Machay, F.; El Moussaoui, S.; El Talibi, H. Insights into large landslide mechanisms in tectonically active Agadir, Morocco: The significance of lithological, geomorphological, and soil characteristics. Sci. Afr. 2023, 22, e01901. [Google Scholar] [CrossRef]
  7. Alemdag, S.; Yalvaç, S.; Oršulić, O.B.; Kara, O.; Zeybek, H.I.; Bostanci, H.T.; Markovinović, D. Monitoring Surface Deformations in a Fossil Landslide Zone and Identifying Potential Failure Mechanisms: A Case Study of Gümüşhane State Hospital. Sensors 2024, 24, 4995. [Google Scholar] [CrossRef]
  8. Steger, S.; Moreno, M.; Crespi, A.; Gariano, S.L.; Brunetti, M.T.; Melillo, M.; Peruccacci, S.; Marra, F.; de Vugt, L.; Zieher, T.; et al. Adopting the margin of stability for space–time landslide prediction—A data-driven approach for generating spatial dynamic thresholds. Geosci. Front. 2024, 15, 101822. [Google Scholar] [CrossRef]
  9. Drakatos, G.; Paradissis, D.; Anastasiou, D.; Elias, P.; Marinou, A.; Chousianitis, K.; Papanikolaou, X.; Zacharis, E.; Argyrakis, P.; Papazissi, K.; et al. Joint approach using satellite techniques for slope instability detection and monitoring. Int. J. Remote Sens. 2013, 34, 1879–1892. [Google Scholar] [CrossRef]
  10. Leung, M.F.; Santos, J.R.; Haimes, Y.Y. Risk Modeling, Assessment, and Management of Lahar Flow Threat. Risk Anal. 2003, 23, 1323–1335. [Google Scholar] [CrossRef]
  11. Atkinson, P.; Massari, R. Generalized linear modelling of susceptibility to landsliding in the central Apennines, Italy. Comput. Geosci. 1998, 24, 373–385. [Google Scholar] [CrossRef]
  12. Chen, Y.; Liu, Y. Research on the Application of Dynamic Process Correlation Based on Radar Data in Mine Slope Sliding Early Warning. Sensors 2024, 24, 4976. [Google Scholar] [CrossRef]
  13. Oh, H.; Lee, S. Shallow Landslide Susceptibility Modeling Using the Data Mining Models Artificial Neural Network and Boosted Tree. Appl. Sci. 2017, 7, 1000. [Google Scholar] [CrossRef]
  14. Chih, Y.; Yuan, C. Semantic Segmentation of Satellite Images for Landslide Detection Using Foreground-Aware and Multi-Scale Convolutional Attention Mechanism. Sensors 2024, 24, 6539. [Google Scholar] [CrossRef]
  15. Xin, B.; Huang, Z. Ensemble Learning Improves the Efficiency of Microseismic Signal Classification in Landslide Seismic Monitoring. Sensors 2024, 24, 4892. [Google Scholar] [CrossRef]
  16. Bui, D.T.; Tsangaratos, P. Comparing the prediction performance of a Deep Learning Neural Network model with conventional machine learning models in landslide susceptibility assessment. Catena 2020, 188, 104426. [Google Scholar] [CrossRef]
  17. Ye, K.; Wang, Z. Deformation Monitoring and Analysis of Baige Landslide (China) Based on the Fusion Monitoring of Multi-Orbit Time-Series InSAR Technology. Sensors 2024, 24, 6760. [Google Scholar] [CrossRef]
  18. Yang, Y.; Zhao, Z. Identification and Analysis of the Geohazards Located in an Alpine Valley Based on Multi-Source Remote Sensing Data. Sensors 2024, 24, 4057. [Google Scholar] [CrossRef]
  19. Jiang, N.; Li, H.-B.; Li, C.-J.; Xiao, H.-X.; Zhou, J.-W. A fusion method using terrestrial laser scanning and unmanned aerial vehicle photogrammetry for landslide deformation monitoring under complex terrain conditions. IEEE Trans. Geosci. Remote Sens. 2022, 60, 4707214. [Google Scholar] [CrossRef]
  20. Bao, X.; Jiang, Y.; Zhang, L.; Liu, B.; Chen, L.; Zhang, W.; Xie, L.; Liu, X.; Qu, F.; Wu, R. Accurate Prediction of Dissolved Oxygen in Perch Aquaculture Water by DE-GWO-SVR Hybrid Optimization Model. Appl. Sci. 2024, 14, 856. [Google Scholar] [CrossRef]
  21. Wu, R.; Qi, J.; Li, W. Landscape genomics analysis provides insights into future climate change-driven risk in rhesus macaque. Sci. Total Environ. 2023, 899, 165746. [Google Scholar] [CrossRef] [PubMed]
  22. Zou, D.; Xiang, Y.; Zhou, T. Outlier detection and data filling based on KNN and LOF for power transformer operation data classification. Energy Rep. 2023, 9, 698–711. [Google Scholar] [CrossRef]
  23. Fang, Z.; Zhang, F. Strip Steel Defect Prediction Based on Improved Immune Particle Swarm Optimisation–Improved Synthetic Minority Oversampling Technique–Stacking. Appl. Sci. 2024, 14, 5849. [Google Scholar] [CrossRef]
  24. Weidner, L.; Walton, G. Generalized Extraction of Bolts, Mesh, and Rock in Tunnel Point Clouds: A Critical Comparison of Geometric Feature-Based Methods Using Random Forest and Neural Networks. Remote Sens. 2024, 16, 4466. [Google Scholar] [CrossRef]
  25. Masuda, A.; Matsuodani, T. Knowledge of Time-bin Data Selection using Gini Index based Type Classification in GitHub. Procedia Comput. Sci. 2022, 207, 1783–1791. [Google Scholar] [CrossRef]
  26. Luo, Z.; Qi, X. Investigation of influential variations among variables in daylighting glare metrics using machine learning and SHAP. Build. Environ. 2024, 254, 111394. [Google Scholar] [CrossRef]
  27. Zhang, B.; Zhao, P. Acceleration model of online educational games based on improved ensemble ML algorithm. Entertain. Comput. 2024, 50, 100654. [Google Scholar] [CrossRef]
  28. Li, X.; Zhou, S. CNN-BiGRU sea level height prediction model combined with bayesian optimization algorithm. Ocean Eng. 2024, 315, 119849. [Google Scholar] [CrossRef]
Figure 1. Flowchart of landslide risk assessment model.
Water 17 00946 g001
Figure 2. Thermal map of characteristic variable correlation coefficients.
Water 17 00946 g002
Figure 3. Bayesian random forest structural diagram.
Water 17 00946 g003
Figure 4. Bayesian optimization results.
Water 17 00946 g004
Figure 5. Geographic location of study area.
Water 17 00946 g005
Figure 6. Layout of Zhangcun Gully monitoring sensor network.
Water 17 00946 g006
Figure 7. Data of key indicators from 1 September 2024 to 30 September 2024.
Water 17 00946 g007
Figure 8. The results of the landslide risk assessment from 1 September 2024 to 30 September 2024.
Water 17 00946 g008
Figure 9. Importance ranking chart.
Water 17 00946 g009
Figure 10. Importance ranking results of normalized summation.
Water 17 00946 g010
Table 1. Selection of assessment indicators.
Type of IndicatorIndicatorMathematical UnitEmpirical Results
Geologic factorsSlope direction/1–8
PressureKPa−50–1200
Slope gradient%0–1
Curvaturerad/m0–1
Meteorological factorsPrecipitationmm0–1000
Humidity%0–1
Moisture%0–1
Ecological factorsNDVI/−1–1
NDWI/−1–1
Table 2. The score of the model under the proportion of different test sets.
PercentageAccuracyTrain Time/sPercentageAccuracyTrain Time/sPercentageAccuracyTrain Time/s
0.90.906912.76390.60.88696.34450.30.84725.4732
0.80.93748.54810.50.86916.12060.20.82685.3219
0.70.92277.14370.40.86325.95720.10.75705.0207
Disclaimer/Publisher’s Note: The statements, opinions and data contained in all publications are solely those of the individual author(s) and contributor(s) and not of MDPI and/or the editor(s). MDPI and/or the editor(s) disclaim responsibility for any injury to people or property resulting from any ideas, methods, instructions or products referred to in the content.

