Article

Impact of Drip Irrigation Levels on the Growth, Production, and Water Productivity of Quinoa Grown in Arid Climate Conditions

1
College of Hydraulic and Civil Engineering, Xinjiang Agricultural University, Urumqi 830052, China
2
Xinjiang Uygur Autonomous Region Meteorological Service, Urumqi 830002, China
*
Author to whom correspondence should be addressed.
Water 2025, 17(7), 917; https://doi.org/10.3390/w17070917
Submission received: 13 February 2025 / Revised: 16 March 2025 / Accepted: 19 March 2025 / Published: 21 March 2025
(This article belongs to the Special Issue Crop Evapotranspiration, Crop Irrigation and Water Savings)

Abstract

:
Globally, water scarcity demands immediate attention, particularly in arid regions like Northwest China, necessitating efficient water use strategies in crop cultivation. Quinoa (Chenopodium quinoa Willd.), celebrated for both its drought tolerance and nutritional value, has consequently emerged as a central focus in contemporary agricultural research seeking solutions to this challenge. To explore the effects of different irrigation amounts on quinoa yield and water productivity, a mulched drip irrigation technique was applied in community trials of quinoa in Mulei County in 2020 and in Bole City in 2021. The “JL-1” quinoa variety was used as the experimental material, and four irrigation levels were set (255 mm, 292 mm, 330 mm, and 367 mm). This study examined the impact of varying irrigation amounts on quinoa growth indicators, like plant height, stem diameter, leaf area index, aboveground biomass, and yield, and analyzed water productivity. The results from two years of trials indicated that different irrigation gradients had significant or extremely significant effects on quinoa growth indicators. The maximum values of growth indicators were achieved under the highest irrigation level of the control treatment. Water production rates in the 2020 trial in Mulei were highest at an irrigation amount of 330 mm, while in the 2021 trial in Bole, the highest water production rate was observed at 292 mm. Across the two years of trials, when the irrigation amounts were the same prior to the heading stage, the differences among all treatments were not significant, whereas varying irrigation gradients had a significant impact on growth after the heading stage. Furthermore, the growing environment significantly affected the quinoa yield; in the Bole trial, strong winds in the mid-growth period led to severe lodging of quinoa. The findings suggest that managing irrigation amounts, specifically by appropriately increasing irrigation during the water-sensitive stage of quinoa (from heading to grain filling) and reducing water during the early growth stage, can control the growth in quinoa height, thereby improving yield while conserving water resources.

1. Introduction

Water resource shortages have made efficient water conservation an important issue, prompting the search for optimal irrigation methods and systems suitable for various crops in order to address the problem of water scarcity and to increase crop yields [1,2]. Micro-irrigation technology not only enhances water resource utilization efficiency but also promotes crop growth and improves yields [3,4,5], making it particularly suitable for use in regions where water resources are relatively limited [6].
In arid areas, drip irrigation, especially plastic-film-covered drip irrigation, is widely used due to its ability to significantly improve water productivity [7,8]. In Xinjiang, efforts to enhance water resource utilization efficiency include the promotion of efficient water-saving technologies, such as drip and spray irrigation, which have notably improved agricultural water efficiency and reduced water resource waste [9]. Plastic-film-covered drip irrigation effectively reduces water evaporation and enhances soil moisture retention [10,11]. This technology is widely applied in the cultivation of high-value crops such as cotton, corn, and sugar beets in Xinjiang, significantly increasing both yield and quality while reducing water usage by 30–50% [7,12].
Quinoa (Chenopodium quinoa Willd.) is a flowering plant in the amaranth family, native to the Andean region of South America [13,14,15]. Prior to the European discovery of the Americas, quinoa was prized for its drought tolerance, cold resistance, and salt–alkali tolerance [6,7,8], and it is widely regarded as an ideal crop for addressing food security challenges [8,9,16,17], especially in arid regions [10,18,19]. As the global cultivation of and market demand for quinoa continue to grow [11,12,13,20], many countries have intensified their research on this crop [10,14,15,16,17,18,19,21,22].
In America, NASA started to use quinoa as early as the 1980s, using it as a staple food for astronauts. The FAO has recognized quinoa as the only crop that can meet all the nutritional needs of humans when grown alone and has promoted and advocated for quinoa [23]. The year 2013 was designated by the United Nations as the International Year of Quinoa, calling attention to food security and balanced nutrition [24].
In China, quinoa cultivation began in Tibet [25,26] and achieved initial success in the high-altitude areas of Shanxi [27]. Currently, various regions across the country are actively undertaking research on quinoa and exploring its potential as a staple food [24,28,29]. Quinoa is known for its strong drought resistance [30], and traditional cultivation methods primarily rely on natural precipitation, which is also the case in arid and semi-arid regions [31]. Scientists have conducted in-depth studies on the growth and development of quinoa [32] utilizing deficit irrigation techniques. They have found that quinoa is most sensitive to water during its flowering and grain filling stages, suggesting that irrigation during these phases could enhance the efficiency of water use.
In recent years, extreme weather phenomena such as high temperatures, heavy rainfall, flooding, and drought have frequently occurred in various regions around the world, posing serious challenges to agricultural production [1]. This is particularly evident in arid areas in western China, such as Xinjiang, where drought has become the main climate disaster limiting agricultural production [7].
In the face of scarce water resources, finding efficient water-saving agricultural technologies has become especially important. Against this backdrop, in 2019, the introduction of drought-resistant, high-nutrition crops such as quinoa was initiated in Mulei County, located in the northwest arid region, with the intention of assessing whether quinoa could adapt to the local climate environment [33]. Research found that quinoa thrived under the climatic conditions of Mulei County [33]. The water sources in Mulei County primarily come from snowmelt and rainfall, with plains and Gobi Desert areas accounting for over 60% of the total area of the county [34]. Due to the scarcity of water resources, the utility value of these areas is relatively low [35]. However, the ability of quinoa to grow healthily in this region demonstrates its potential to promote economic development.
The experiment lasted from 2019 to 2021, conducted in Mulei County in 2019 and 2020 and in Bole City in 2021. The experimental area, which is a major cultivation zone for wheat (Mulei County) and cotton (Bole City), also serves as an important base for the introduction of quinoa. The study explored the effects of different irrigation regimes, including mulched and non-mulched drip irrigation, on quinoa’s dry matter accumulation and grain yield. Non-mulched drip irrigation was implemented in Mulei County in 2019 and 2020 [33], while mulched drip irrigation was carried out in Mulei County in 2020 and in Bole City in 2021. This article discusses the results of field trials on mulched drip irrigation conducted in Mulei County and Bole City, analyzing the impact of different irrigation regimes on the growth and development characteristics, dry matter accumulation, and yield of quinoa. The aim is to assess quinoa’s growth adaptability in the northwest arid region and its water requirements and sensitivity, providing a theoretical basis for food security production in the northwest arid region.

2. Materials and Methods

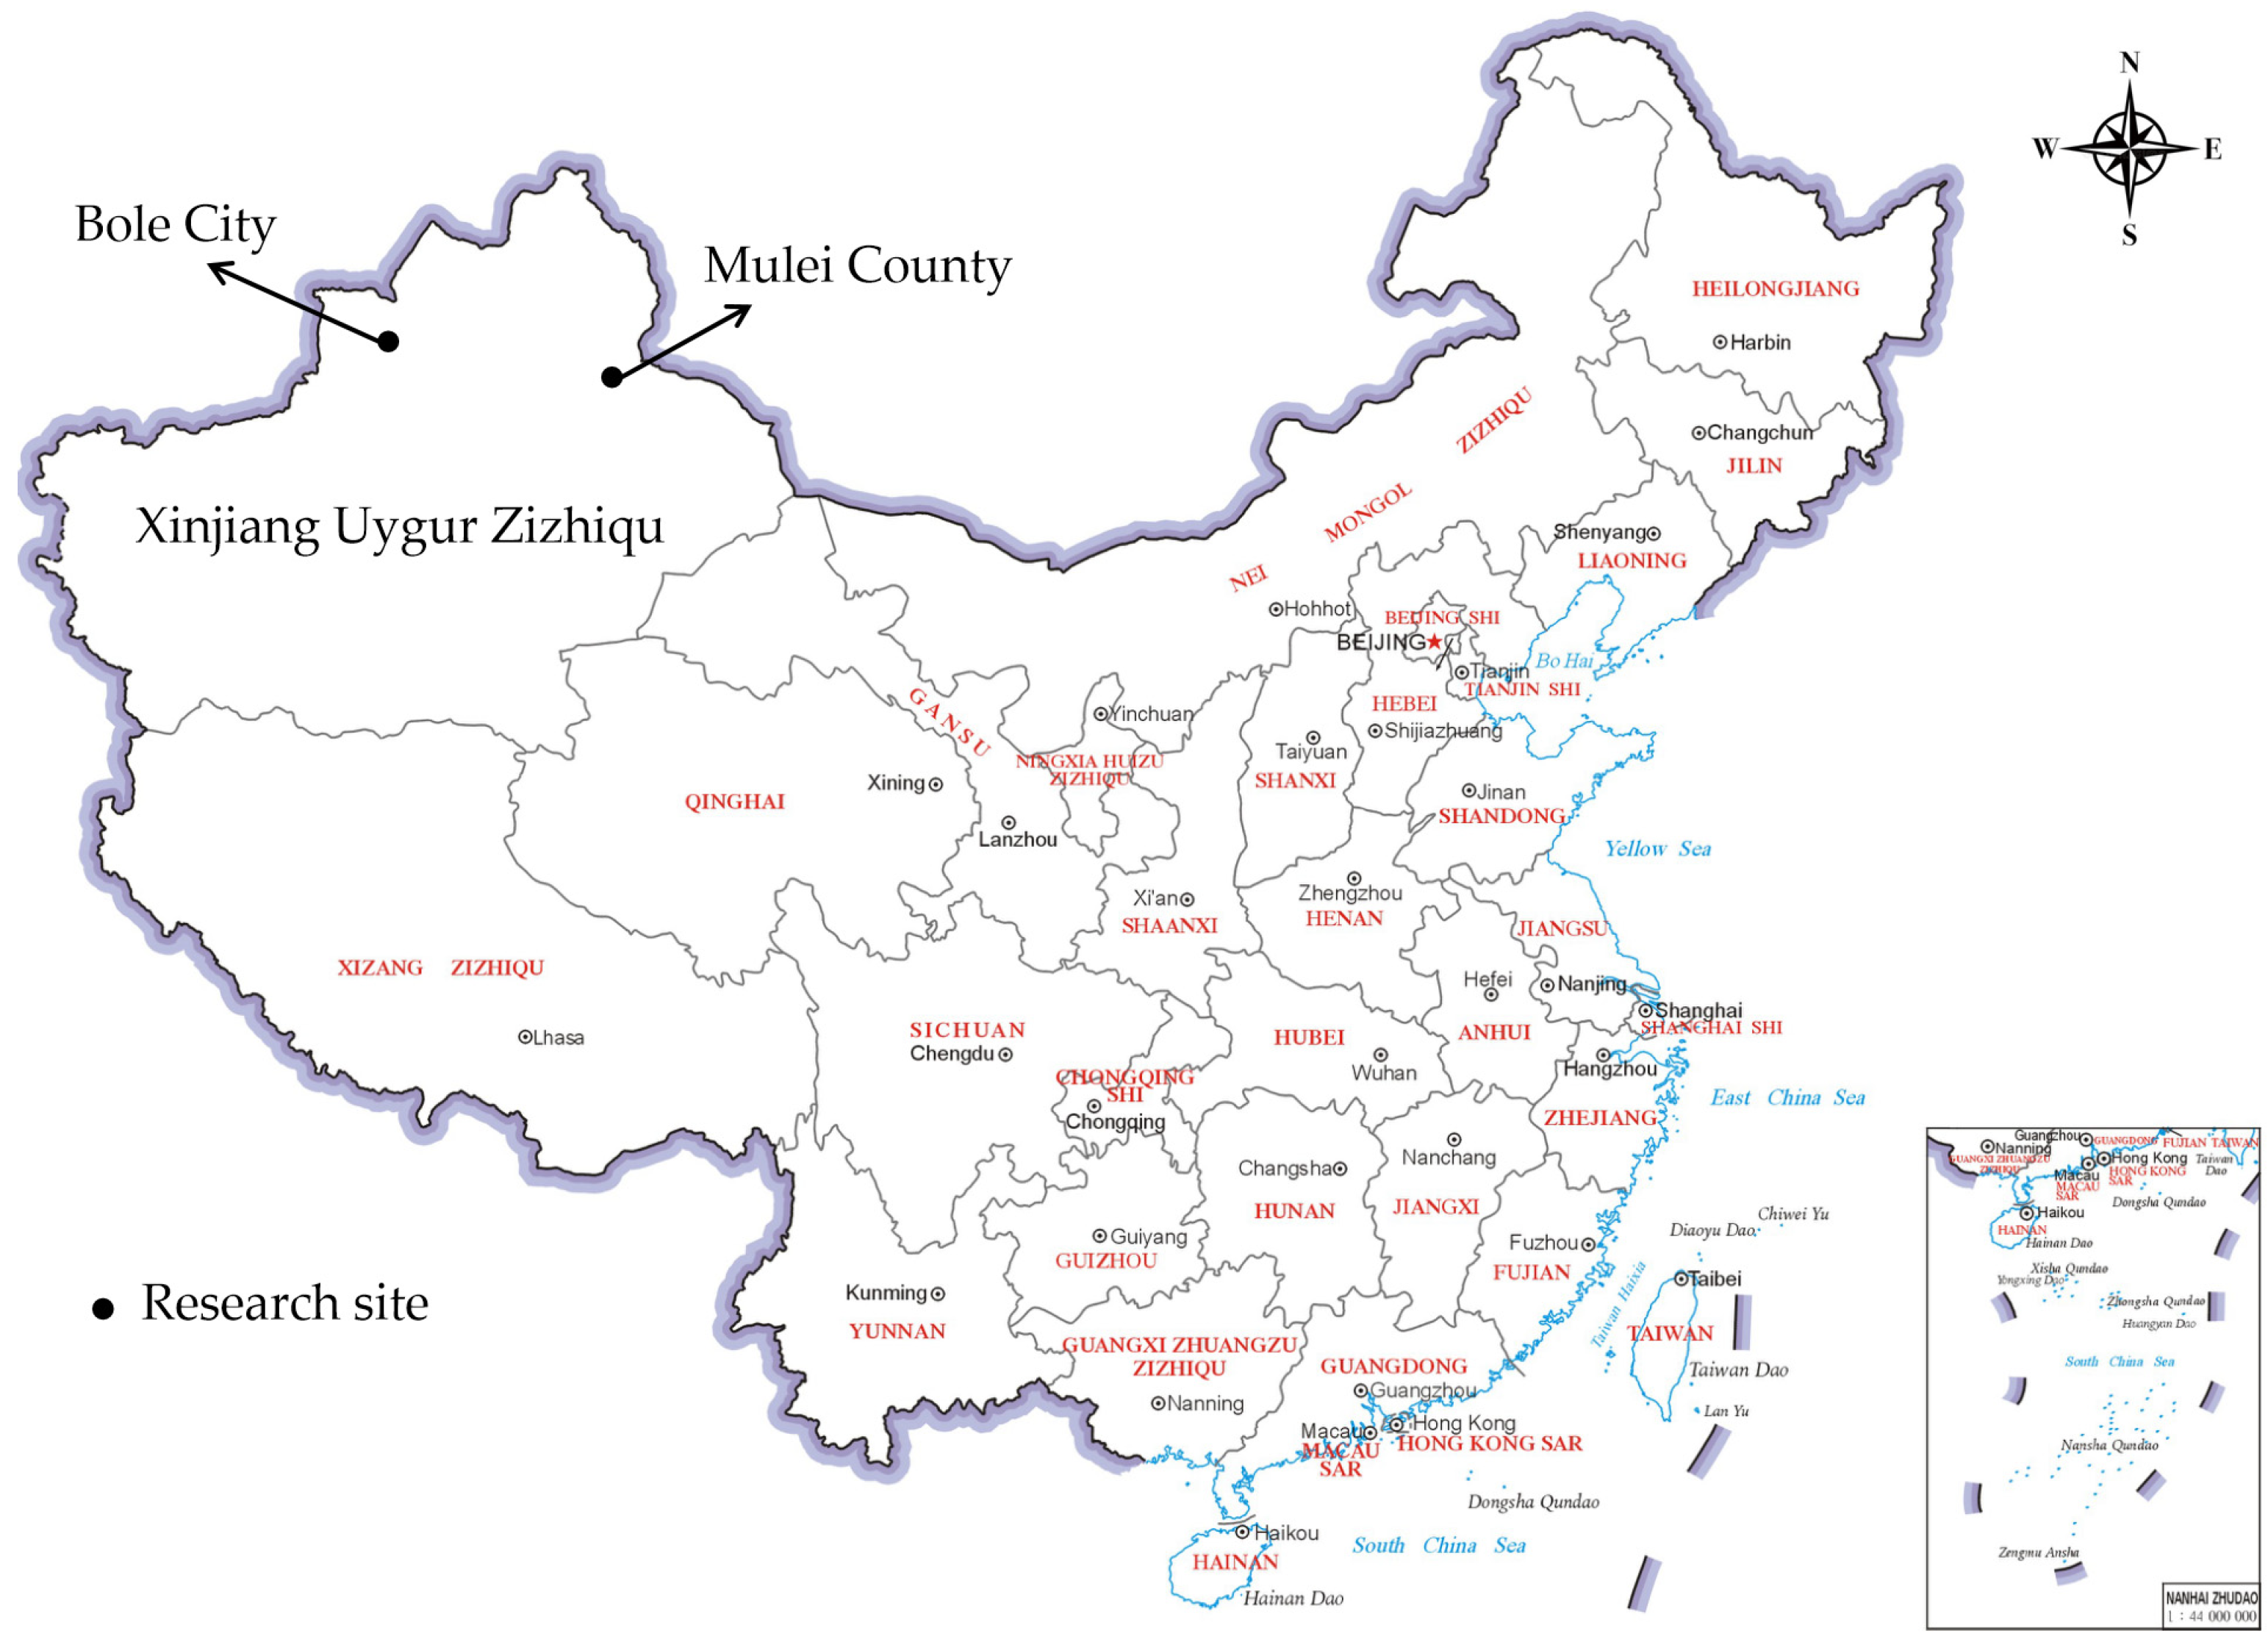
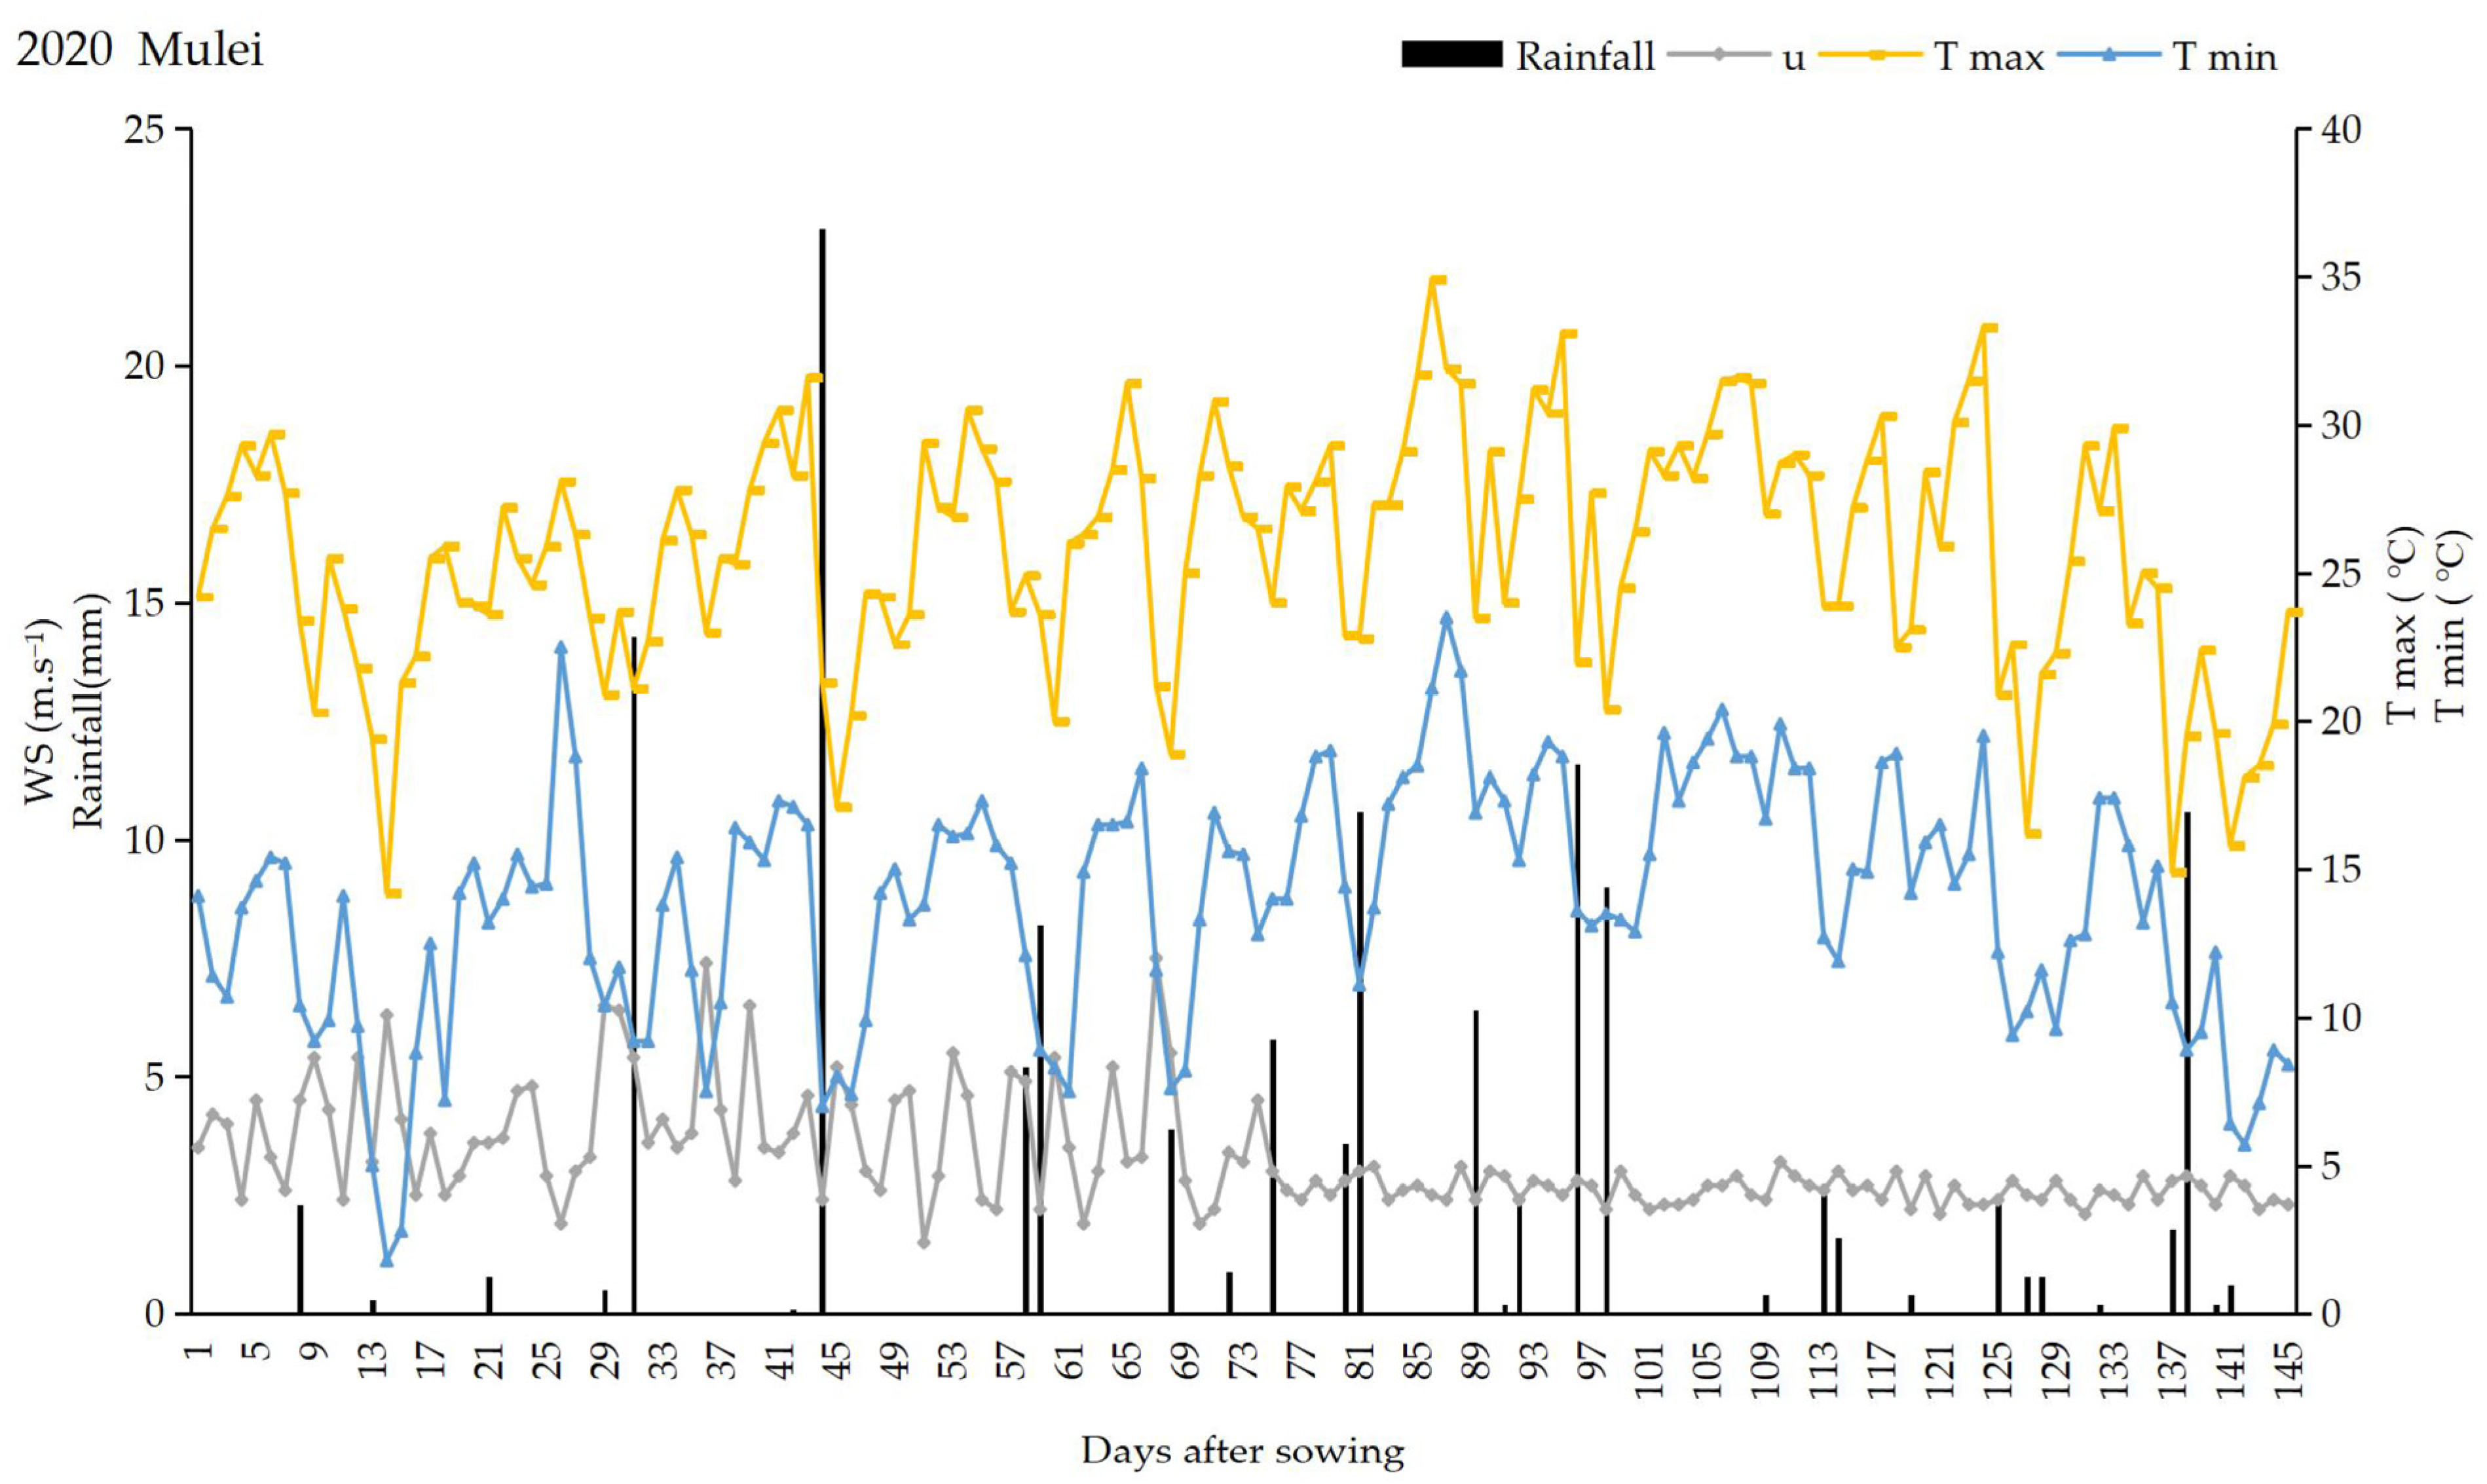
2.1. Climatic Conditions

The experiments were conducted from April to October 2020 at the Mulei County test station in Xinjiang, China (longitude 90°16′, latitude 43°52′, altitude 1191 m) (Figure 1), which is located within the gentle terrain of the northern foothills of the Tianshan Mountains and the southeastern edge of the Junggar Basin. From April to October 2021, further experiments took place in Hurxi Village, Bole City, Xinjiang, China (longitude 82°10′, latitude 44°54′, altitude 427 m) (Figure 1); this area is west of Lake Ebinur, in the northern foothills of the western Tianshan Mountains and the southwestern part of the Junggar Basin. Both areas have a temperate continental arid climate.
In Mulei County, the average annual temperature ranges from 5 to 6 °C, with accumulated temperatures above 10 °C being approximately 2600 °C. The total annual sunlight is approximately 3000 h, there is a frost-free period of 136–157 days, and the average annual precipitation is 343.5 mm; this precipitation mainly occurs in the mountainous areas. Based on data from an automatic agricultural weather station (Wuhan Hanqin System Tech Co., Ltd., Wuhan, China) installed 2 m above a small bare plot 10 m from the test station, which recorded data every two minutes from 24 April to 15 September 2020, the highest temperature was 34.90 °C (18 July) and the lowest was −1.80 °C (7 May), with an average temperature of 19.24 °C (Figure 2). The total rainfall was 135.80 mm, and the average wind speed was 3.26 m·s−1 (Figure 2). The preliminary soil analysis parameters are shown in Table 1. The organic matter content decreased with soil depth, from 17.48 g·kg−1 at the surface to 4.90 g·kg−1 in deeper layers (Table 1). The soil pH remained relatively stable across different layers, while the total salt content decreased with depth, from 0.65 mg·g−1 at the surface to 0.21 mg·g−1 in deeper layers (Table 1).
The average annual temperature of Bole City is approximately 6 °C, the average annual precipitation is approximately 181 mm, and the average annual evaporation rate is approximately 1562.4 mm. In periods of extreme weather, the temperature in Bole City can be as high as 44 °C and as low as −36 °C. The average annual sunshine in Bole City is approximately 2800 h, with accumulated temperatures above 10 °C being approximately 3100 °C, and there is a frost-free period of approximately 169 days. The region’s climate with respect to light, heat, and water is well suited to the cultivation of a variety of agricultural and melon crops. From 24 April to 15 September 2021, the highest temperature was 38.9 °C (6 July) and the lowest temperature was −0.5 °C (24 April), with an average temperature of 21.34 °C (Figure 2). The total rainfall was 84.8 mm, and the average wind speed was 1.99 m·s−1 (Figure 2). Preliminary soil analysis indicates that the organic matter content decreases with soil depth, from 3.43 g·kg−1 at the surface to 2.92 g·kg−1 at deeper layers (Table 1). The soil PH remains relatively stable across different layers, with an average of 8.32 (Table 1). The total salt content also decreases with depth, from 0.36 mg·g−1 at the surface to 0.15 mg·g−1 in deeper layers (Table 1). Other soil parameters are also shown in Table 1.

2.2. Experiments

In the experiment, quinoa variety JL-1 was used as the test variety, and a plastic film drip irrigation technique was employed. The process of laying the film and installing the drip irrigation pipes was similar to that used in local corn planting operations. First, a mechanical setup was used to arrange the covering film and drip irrigation pipes in a 0.067 ha experimental field, followed by manual sowing. The width of the plastic film was 80 cm, and it was white in color and had a thickness of approximately 0.01 mm. The drip irrigation system was designed as “one pipe, two rows” system to ensure even water distribution, with a row spacing of 0.5 m, a drip emitter flow rate of 1.8 L/h, and a drip emitter spacing of 0.3 m. Sowing was conducted using a point sowing method, with the depth of each planting hole controlled to between 2 and 5 cm, and about 10 seeds were placed per hole. The thickness of the soil cover layer should ideally be between 1 and 2 cm. Thinning was carried out when the quinoa reached 10 cm in height to ensure only one quinoa plant remained per hole.
During the germination period, it is best to maintain the soil moisture content at between 10 and 15%. The plant spacing was controlled between 0.4 and 0.5 m, with a distance of 2.0 to 2.5 m between different treatments, ensuring that different irrigation treatments did not interfere with each other. Prior to the experiment, an organic fertilizer treatment was applied; 1.60 Mg·ha−1 of composted cow and sheep manure was used to increase the organic matter content of the soil, improve its properties, enhance its structure, and promote permeability and aeration. Seeding took place on 24 April, with the irrigation trials starting on 3 May. All treatments received two watering sessions during the seedling stage at 15 mm each. From the late panicle emergence phase (29 June), different irrigation volumes were applied. The irrigation cycle was set to 14 days.
Soil moisture was monitored using the soil auger method before and 24 h after each irrigation, with soil samples taken every 0.1 m to a depth of 0.8 m, and irrigation ended on 24 August, with harvesting taking place on 15 September. In the experiment in 2020, four treatments were set up for mulched drip irrigation—YM1, YM2, YM3, and CK—with irrigation depths of 255 mm, 292 mm, and 330 mm for the first three treatments, respectively (Table 2). Each treatment was repeated three times. This was the second year that quinoa was introduced to Mulei County and the first year that it was introduced to Bole City. Therefore, irrigation experiments conducted in different regions, both domestically and internationally, were referenced, and a control group (CK) with an irrigation depth of 367 mm was established. In 2021, the same experimental conditions were replicated in Bole City, and the trials were labeled as YM11, YM12, YM13, and CK1 (Table 2). This was the first time that quinoa was introduced to Bole City.

2.3. Data Collection

Calculation of reference crop evapotranspiration: The reference crop evapotranspiration (ETo) in the experimental area was calculated using the Penman–Monteith formula, as follows [36,37]:
E T O = 0.408 ( R n G ) + γ 900 T + 273 U 2 ( e a e d ) + γ ( 1 + 0.34 U 2 )
where
E T O is the reference crop evapotranspiration (mm·day−1);
is the slope of the saturation vapor pressure curve (kPa·°C−1);
R n is the radiation (MJ·m−2·day−1);
G is the soil heat flux density (MJ·m−2·day−1);
T is the mean daily air temperature (°C);
U 2 is the wind speed at 2 m height (m·s−1);
e a is the saturation vapor pressure (kPa);
e d is the actual vapor pressure (kPa);
γ is the psychrometric constant (kPa·°C−1).
Crop water consumption at each growth stage: This is usually calculated based on the principle of water balance in actual production [37]. The calculation formula is shown in Equation (2):
E T c 1 2 = 10 i = 1 n γ i H i ( W i 1 W i 2 ) + M + P + K + C
where
E T c 1 2 is the evapotranspiration during growth stage (mm·day−1);
n is the total number of soil layers;
γ i is the bulk density of the ith soil layer (g·cm−3);
H i is the thickness of the ith soil layer (cm);
W i 1 is the moisture content at the beginning of the period in the ith soil layer (percentage of dry soil weight);
W i 2 is the moisture content at the end of the period in the ith soil layer (percentage of dry soil weight);
M is the irrigation amount during the period (mm);
P is the precipitation amount during the period (mm);
K is the groundwater recharge amount during the period (mm);
C is the drainage amount during the period (sum of surface- and lower-layer drainage; mm).
As the groundwater level was below 30 m in the experimental area, groundwater recharge was not considered ( K = 0). Based on observations of quinoa root distribution, over 90% of the roots were within a soil depth of 40 cm. In this study, when analyzing soil moisture throughout the entire growth period of quinoa, a constant planned wetting depth of 80 cm was assumed. As all the irrigation water was assumed to infiltrate into the soil without deep percolation for micro-irrigation, C was not considered.
Actual crop coefficient: The actual crop coefficient, denoted by K c a c t , refers to the ratio of actual water consumption to the reference crop evapotranspiration, as shown in Formula (3):
K c a c t = E T c / E T O
where
E T O is the reference crop evapotranspiration (mm·day−1);
E T c is the crop water consumption in each growth stage (mm·day−1);
K c a c t is related to factors such as the crop type, variety, crop population, and leaf area index.
Meteorological Data: The automatic weather station was installed approximately 10 m from the edge of the experimental field, with a ground height of 2 m. The meteorological equipment included a rain gauge, a wind speed sensor, a wind direction sensor, a radiation sensor, an air temperature sensor, and an air humidity sensor, which observed data every two minutes and saved them to the measurement collector. A small amount of wild grass grew around the automatic weather station, and the surrounding soil was dry.
Quinoa growth indicators: Starting from the seedling stage, the plant height, stem thickness, and leaf area of quinoa under different treatments were monitored every ten days. Then, the average values of these parameters at different growth stages were calculated. If the growth period was less than ten days, the frequency of monitoring was increased at the beginning and end of the growth period.
Dry matter: Three quinoa plants were sampled in their seedling, branching, heading, flowering, grain filling, and maturity stages. The leaves, bolting parts, and stems were oven-dried at 80 °C to a constant weight and weighed, and the average values were calculated. This process yielded the biological yield per plant, which was converted to the biological yield per unit area.
Yield collection method: During the maturity stage, the yield of quinoa planted in 10 m2 was measured for each treatment to analyze the average weight of a thousand grains. Subsequently, the yield per plant for each treatment was converted to yield per unit area (Ya, Mg·ha−1). The harvest index of quinoa can be calculated using Formula (4), and the water productivity (WP) can be calculated using Formula (5).
HI = Ya/biological yield (excluding roots)
W P = Y a / E T c 1 2
HI is the harvest index;
Ya is the seed yield of quinoa;
Biological yield is the accumulation of dry matter (excluding roots) at the end of the growth stage;
WP is the water productivity.

2.4. Data Processing and Analysis

In this study, we meticulously organized the meteorological data, quinoa yield-related data, and biological yield using WPS Office software and calculated important parameters such as the reference crop evapotranspiration, quinoa water consumption, actual crop coefficients, and water productivity. Additionally, we conducted Duncan’s variance analysis on quinoa data under different treatment conditions using SPSS 19.0 software. We also employed Pearson correlation coefficient analysis to examine the relationship between the quinoa water consumption, yield-related factors, and growth indicators.

3. Results

3.1. Reference Crop Evapotranspiration ( E T O )

Once we organized and performed a detailed analysis of the meteorological parameters that were collected from the automatic weather stations in the test area in 2020 and 2021, we calculated the evapotranspiration ( E T O ) of the reference crop using Formula (1), and the results are shown in Figure 3. The analysis indicates that throughout the growth period of quinoa, the evaporation generally exceeded the precipitation. Specifically, the average net radiation at the crop surface (Rn) and humidity (HR) during the 2020 growing season (24 April to 15 September) were 7.82 MJ·(m2·d)−1 and 39.88%, respectively, while the corresponding ETo of the reference crop was 666.23 mm (Figure 3). In 2021, the average net radiation at the crop surface (Rn) and humidity (HR) were 8.44 MJ·(m2·d)−1 and 47.94%, respectively, with an ETo of 691.99 mm (Figure 3). These variations may be attributed to the annual climatic conditions and changes in water storage of the soil in the test area.
A comparative analysis of the data over these two years reveals that the factors influencing E T O include not only Rn, HR, and the soil moisture content but also the geographic location, temperature, rainfall, and wind speed of the test area. On cloudy days, an increase in rainfall typically raises the humidity of the air, thereby reducing the evapotranspiration of the reference crop; conversely, under clear and hot weather conditions, both crop transpiration and surface evaporation are enhanced (Figure 3). Therefore, we infer that in the different test areas, E T O tends to decrease with increased rainfall and overcast weather; meanwhile, under conditions of less rainfall, higher temperatures, and clear skies, E T O values are likely to increase. The geographic advantages and abundant water resources of Bole City, coupled with its high temperatures during the quinoa growing season, contribute to the higher ETo values.

3.2. Changes in Water Consumption During the Growth Stages of Quinoa

According to the data shown in Table 3, in 2020, the water consumption of quinoa during various growth stages exhibited distinct phase characteristics. The grain filling stage exhibited the highest water consumption, followed by the flowering stage, heading stage, branching stage, seedling stage, and maturity stage. From the seedling stage to the branching stage, the average volume of water consumed increased from 45.80 mm to 46.69 mm, with no significant differences between the treatments during these two stages. At the end of the heading stage, differences in the irrigation volume began to appear among the treatment groups, with the control group (CK) receiving the highest volume at 66.69 mm and the YM1 group receiving the lowest volume at 45.80 mm (Table 3). During this stage, the water consumption of the YM1, YM2, and YM3 groups decreased by 28%, 21%, and 10%, respectively, compared to the CK, showing significant differences.
During the flowering stage, each treatment group was irrigated once, with the water consumption ranging between 71.87 mm and 92.68 mm (Table 3). The water consumption of the YM1, YM2, and YM3 groups decreased by 22%, 16%, and 8%, respectively, compared to the CK, with the first two groups showing significant differences. In the grain filling stage, water was applied three times, with its consumption ranging from 182.89 mm to 256.30 mm (Table 3). The water consumption of the YM1, YM2, and YM3 groups decreased by 29%, 19%, and 9%, respectively, compared to the CK, again with significant differences. By the maturity stage, although no irrigation was applied to any group, the water consumption of the YM1 group was 17% lower than that of the CK, showing a significant difference; meanwhile, the reductions observed in the YM2 and YM3 groups were 8% and 6%, respectively, and thus were not significant.
For the quinoa irrigation trials conducted in 2021, although the conditions were similar to those in 2020 and the mulching drip irrigation techniques were also employed with consistent water usage, the trials were carried out in different regions. This led to similar but unidentical trends in water consumption. The data demonstrate the stage-specific characteristics of water consumption during the various growth phases of quinoa. Notably, there was a significant reduction in water usage during the heading and flowering stages compared to the control group, especially during the grain filling stage; this indicates that the management of moisture could offer water-saving benefits.

3.3. Quinoa Actual Crop Coefficient ( K c a c t )

Based on the data analysis presented in Table 4, it is clear that the actual crop coefficient of quinoa under mulched drip irrigation exhibits significant stage-specific characteristics throughout its entire growth period, showing a “high in the middle, low at both ends” trend. In the early growth stage, due to the small size of the quinoa plants, which do not extensively cover the soil, the K c a c t is relatively low, at approximately 0.4 ( K c ini, Table 4). As the plants enter a rapid growth phase, an increase in the leaf area leads to enhanced transpiration; this causes the K c a c t to rise, with values around 1.15 ( K c mid, Table 4) during the grain filling period. When the plants enter the maturity phase, as growth slows and some leaves begin to age, the K c a c t starts to decline, with values of around 0.5 ( K c end, Table 4). Finally, during the harvest period, when the crop’s evapotranspiration demand is at its lowest, the K c a c t also drops to the lowest point throughout the entire growth period. Additionally, the K c a c t of quinoa increases with the applied irrigation amount; during the grain filling period, as irrigation increases from 135 mm to 202 mm, the K c a c t rises from 0.89 to 1.26. These changes reflect the varying water requirements of quinoa at different growth stages.

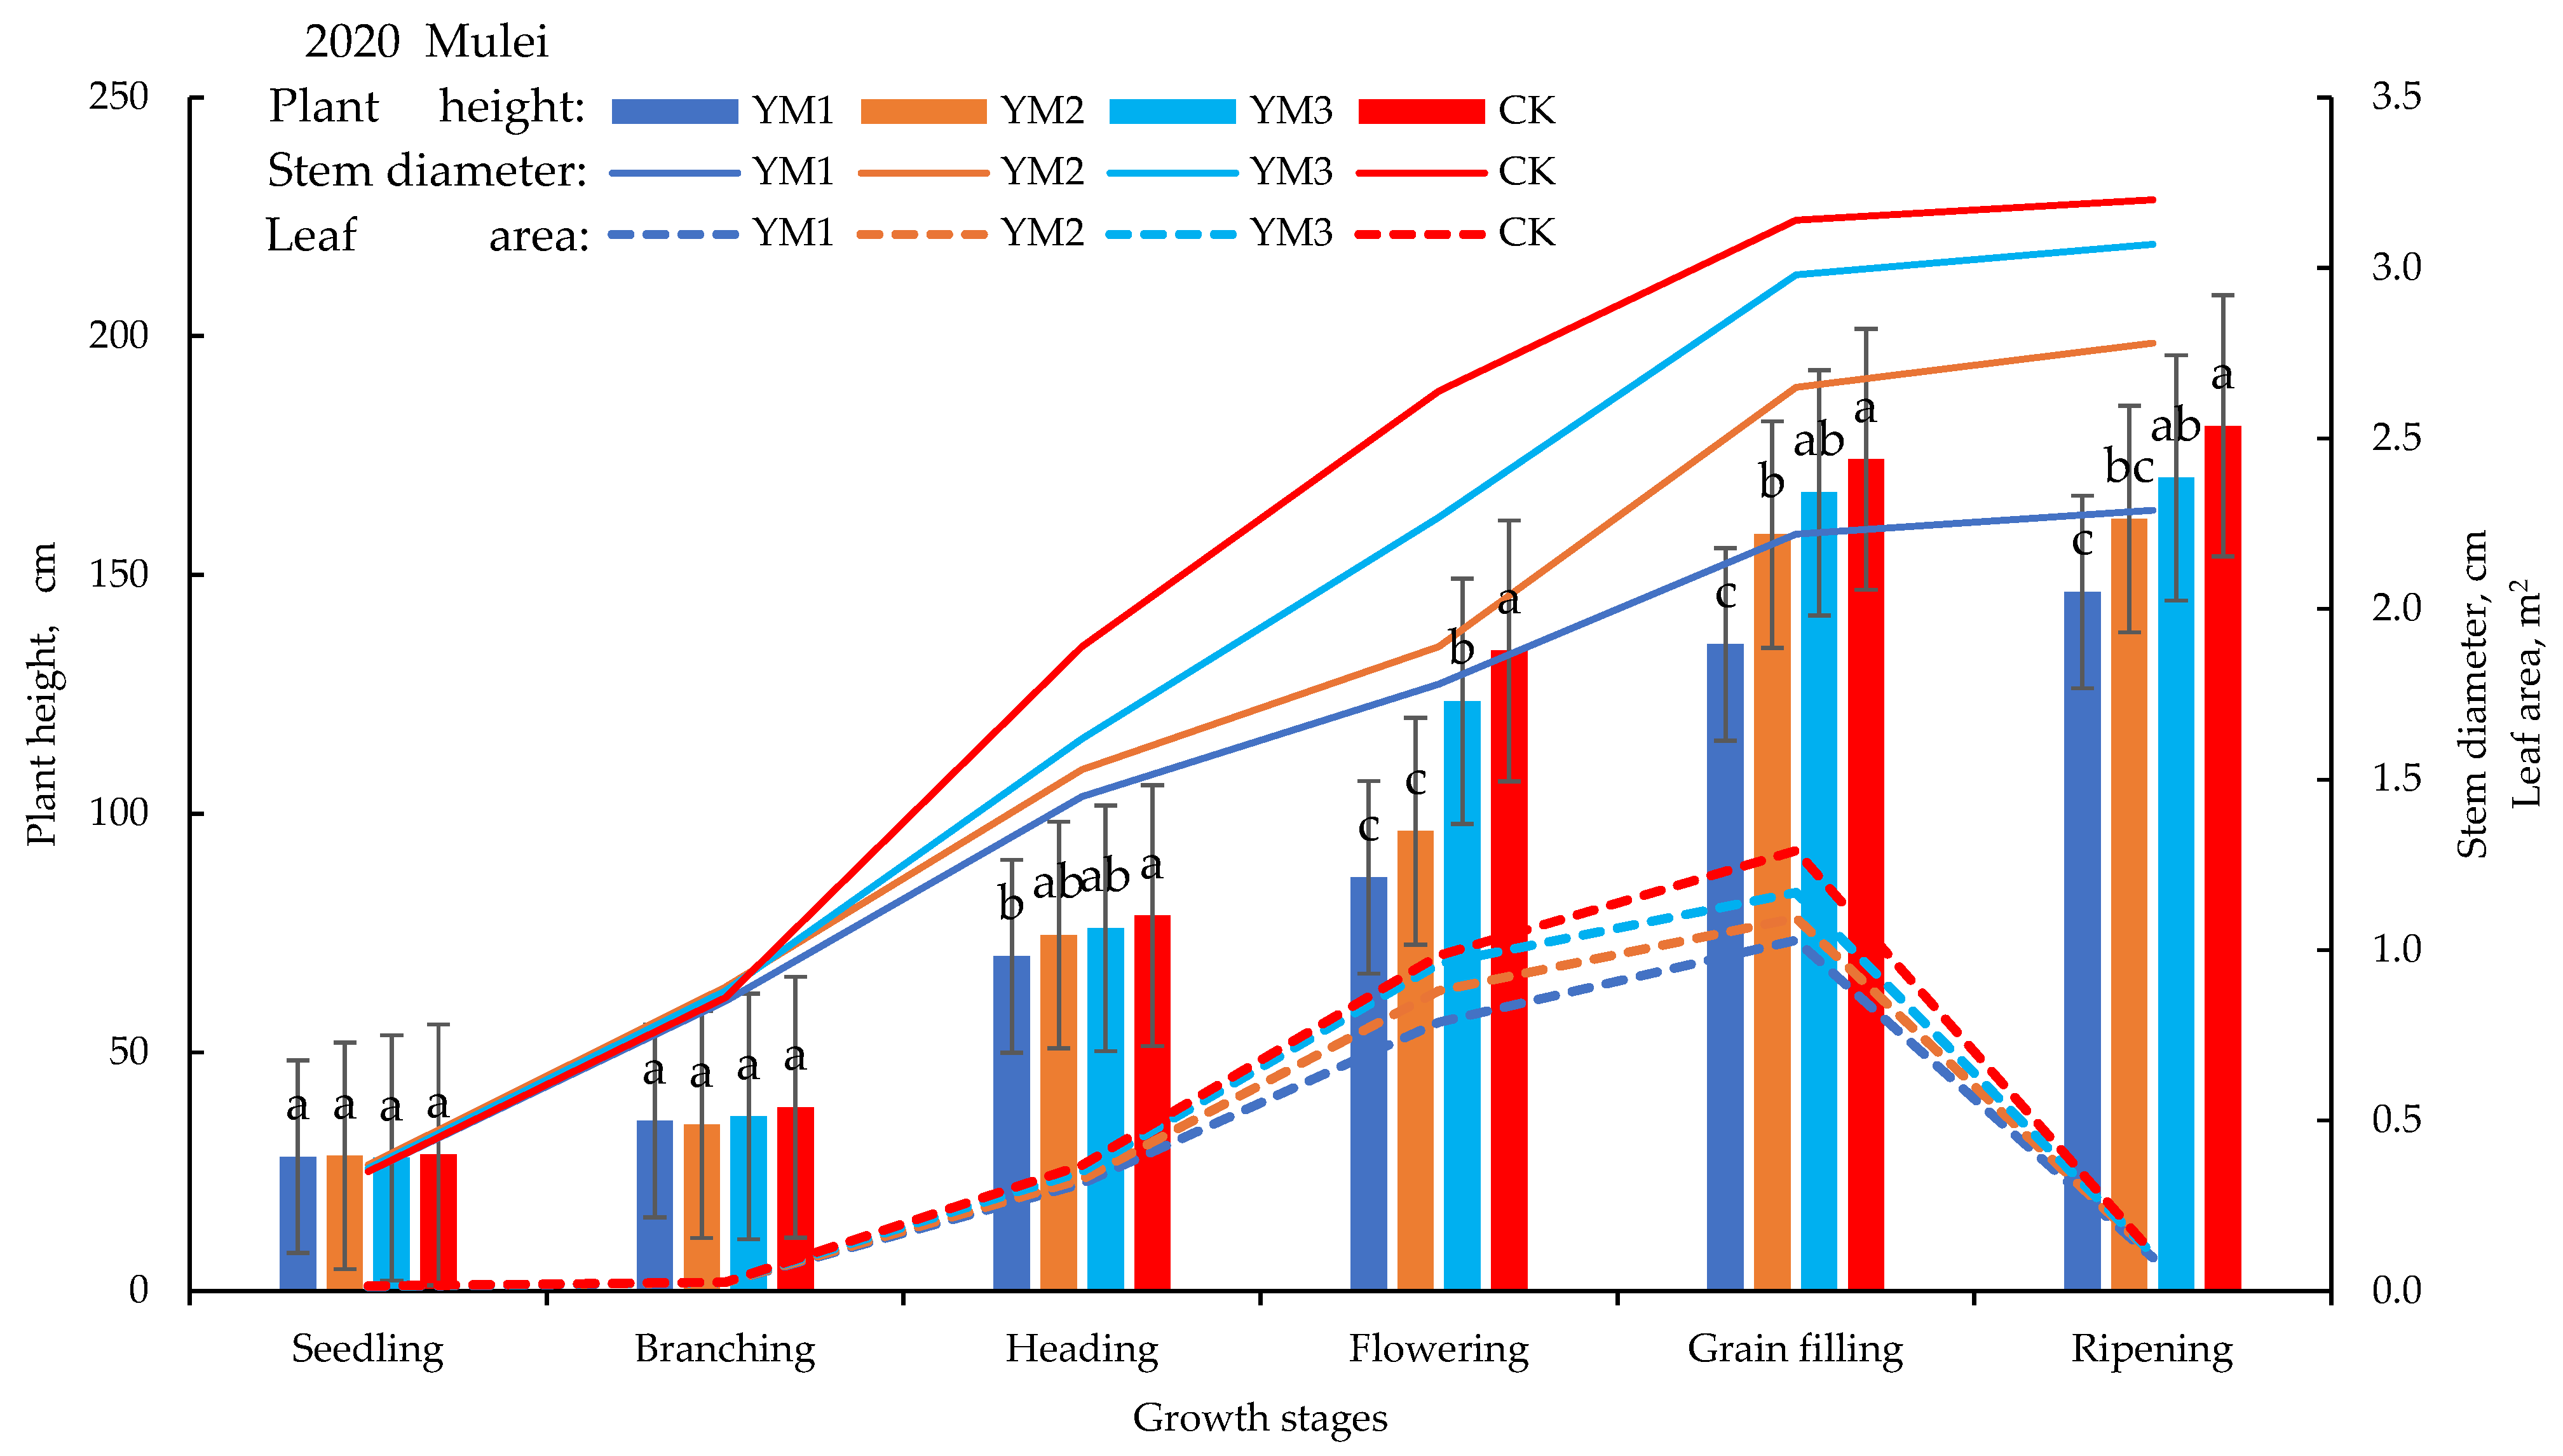
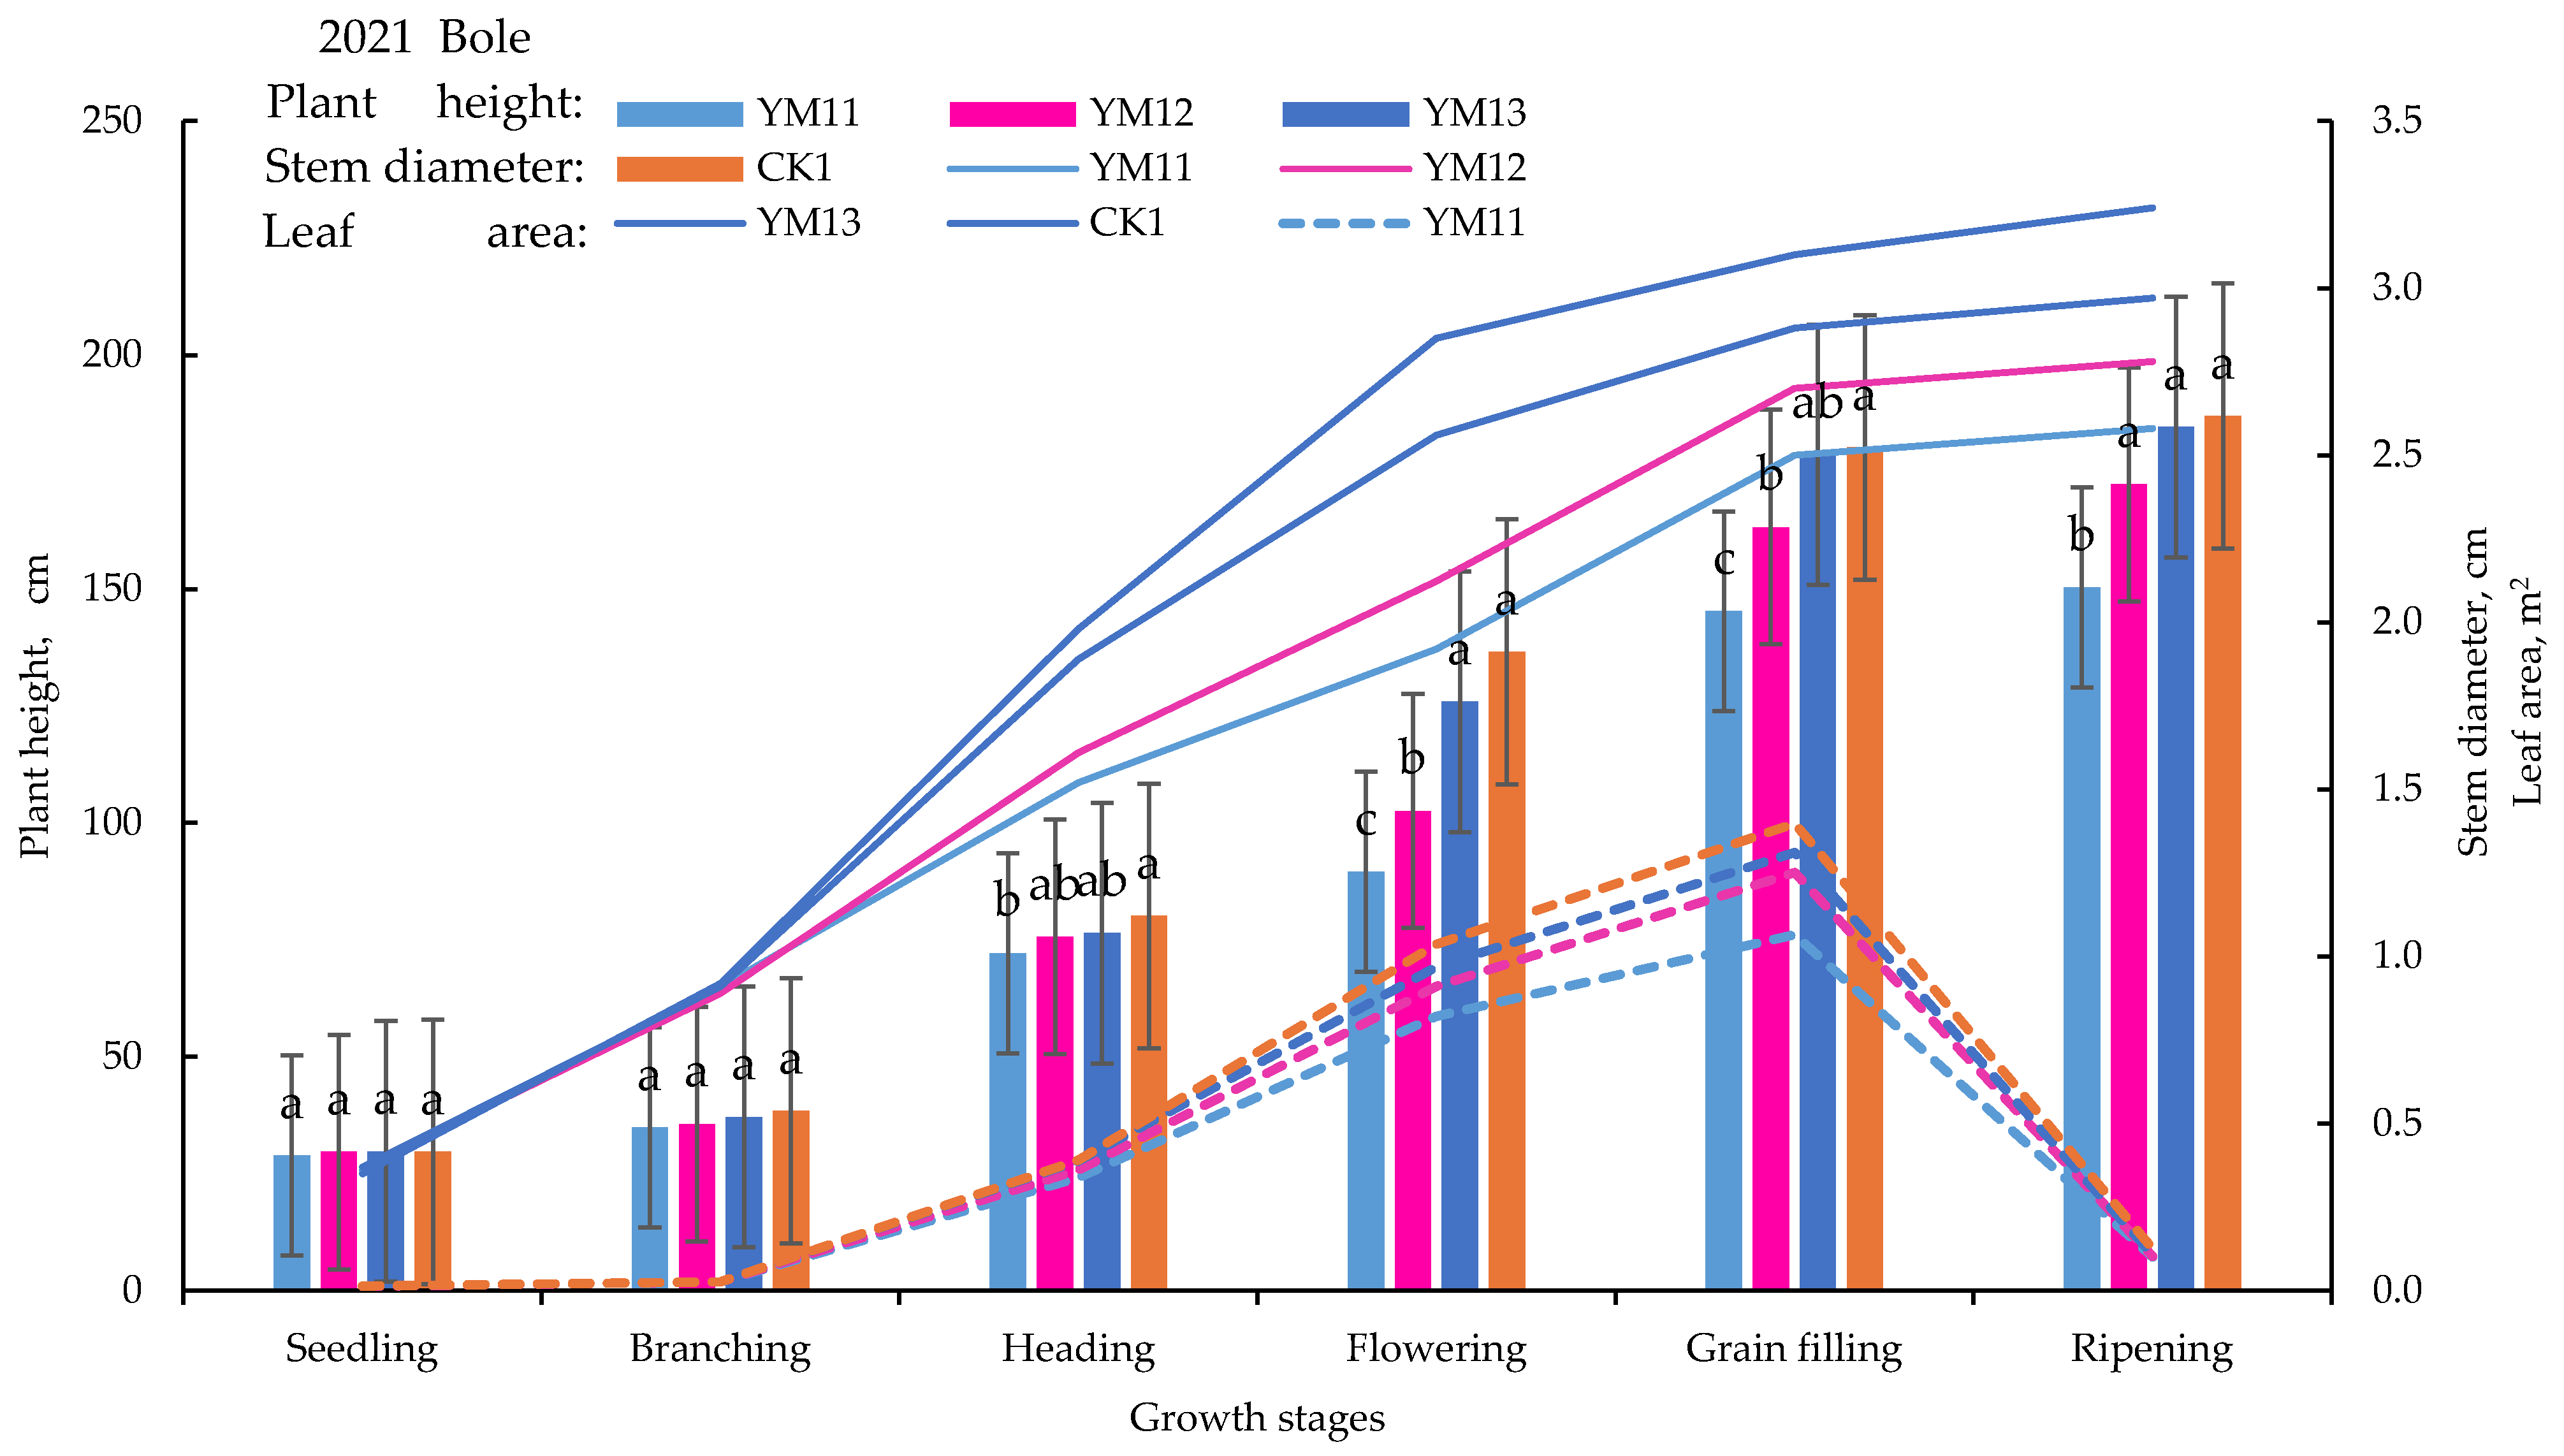
3.4. Biological Yield at Different Growth Stages in Quinoa

Table 5 clearly shows that under mulched drip irrigation, different water treatments significantly impacted the accumulation of dry matter in each quinoa plant, especially in certain growth stages. From the seedling stage to the branching stage, although the differences in the biological yield among the treatments were not significant, a notable increase began at the end of the heading stage as the irrigation levels increased; significant differences from the control group (CK) were observed (p < 0.05). When entering the flowering and grain filling stages, these differences became even more pronounced, with a substantial increase in the accumulation of dry matter across all treatments. In particular, during the maturity stage, although the rate of biological yield slowed down and even declined, a significant difference remained when compared to the CK. Moreover, the decline in biological yield from the grain filling stage to the maturity stage in 2021 was greater than in 2020, likely due to the adverse weather conditions and the occurrence of disease in that year. These results emphasize the importance of proper management of water to enhance the efficiency and adaptability of quinoa production; they also highlight the potential impact of late-stage environmental factors on the accumulation of dry matter in quinoa.
In the early growth stages, the quinoa height and stem thickness increase slowly. During the seedling phase, the plant height is about 0.3 m and the stem thickness is about 0.5 cm (Figure 4). Once the plant enters the flowering stage, it begins its rapid growth phase. After the grain filling period, the plant height can reach up to 1.8 m or even higher, and the stem thickness can increase to about 3.0 cm (Figure 4). As the quinoa reaches maturation, the growth rate slows down again. Similarly, the leaf area growth starts slowly, with an approximate area of 0.014 m2 during the seedling stage (Figure 4). In the mid-growth phase, quinoa experiences rapid leaf area expansion, reaching about 1.4 m2 (Figure 4). However, by the maturation stage, most leaves start yellowing and falling off, resulting in a decrease in leaf area.

3.5. Relationship Between Growth Indicators in Quinoa and Water Consumption During Different Growth Stages

During the quinoa growing seasons of 2020 and 2021, under mulched drip irrigation conditions, the Pearson correlation coefficients between the quinoa growth indicators and water consumption were positive throughout the growth period, as indicated in Table 6. Specifically, there was a significant positive correlation between the leaf area during the seedling stage and water consumption (0.623 *, 0.669 *). In the other growth stages of quinoa, the correlations between plant height, stem thickness, and water consumption were even more significant. Furthermore, there was a highly significant positive correlation between the accumulation of dry matter and water consumption in the stems, roots, and leaves throughout the entire growth cycle from the seedling to the maturity stage. These data not only reveal quinoa’s dependency on water resources but also emphasize the importance of effective water resource management in quinoa production.

3.6. Factors Affecting the Yield of Quinoa

Table 7 shows that, during the two years of mulched drip irrigation, the yield components of quinoa were significantly affected by the volume of irrigation. As the irrigation volume increased, so did the yield of quinoa. In 2020, the yield per treatment ranged from 1.364 to 2.178 Mg·ha−1, and the biological yield ranged from 5.47 to 7.00 Mg·ha−1. Compared to the control group (CK), the yields of treatments YM1, YM2, and YM3 were reduced by 37%, 31%, and 7%, respectively, with the first two treatments showing significant differences from the CK (p < 0.05). Similarly, the harvest index was highest for the CK treatment that year. However, the water production efficiency was highest for treatment YM3, with no significant difference from the CK treatment. The thousand-grain weight ranged from 2.226 g to 2.389 g, with no significant differences between treatments.
In 2021, except for the YM11 treatment, the treatments showed no significant differences compared to the control group (p > 0.05); this indicated that the amount of irrigation had a limited impact on the thousand-seed weight (TSW). The variations in yield among the treatments ranged between 1.374 and 1.637 Mg·ha−1, with the YM11, YM12, and YM13 treatments experiencing yield reductions of 16%, 7%, and 2%, respectively, compared to the CK1 group. The difference between the YM11 group and CK was significant (p < 0.05). That year, the HI and WP values peaked under the YM12 treatment; however, there were no significant differences compared to other treatments. In contrast with 2020, Bole quinoa experienced severe lodging due to strong winds (reaching speeds of 11.3 m/s) mid-growth, which, coupled with poor ventilation leading to downy mildew, collectively hindered yield improvement for the Bole quinoa.
These data not only reflect the direct impact of irrigation on quinoa yield, but they also highlight the combined effects of the growth environment and natural disasters. Furthermore, by comparing the harvest index and water use between the two regions, it is evident that the quinoa yield improved more significantly with the rational use of limited water resources; this occurred regardless of the fact that Mulei County has more strained water resources and a less favorable geographical position compared to Bole City. These findings provide insight into the use of important agricultural management and environmental adaptation strategies in quinoa cultivation.

3.7. Relationship Between Yield, Water Consumption, and Water Productivity

In this experiment, a comprehensive analysis was conducted on the yield, water productivity, and biological yield of quinoa under different irrigation amounts. Using the water consumption throughout the entire growth period of quinoa as the independent variable and the yield, WP, and biological yield as dependent variables, regression analysis was performed using the least squares method in SPSS 19.0. The results are shown in Table 7. In 2020, in Mulei County, the yield and biological yield both reached a maximum at a water consumption of 549.81 mm, while the maximum WP occurred at a water consumption of 509.66 mm (Table 8).
The experimental results from 2021 in Bole indicate that the maximum yield and biological yield occurred at a water consumption of 566.89 mm, whereas the maximum WP occurred at 489.00 mm (Table 8). This suggests that it is challenging to simultaneously maximize the yield and WP under the same irrigation conditions. Improving the WP of quinoa is not only related to the amount of irrigation but is also influenced by various factors.
During the second sowing of quinoa in Mulei County (the first was in 2019) and the first sowing in Bole, despite us studying a large amount of studies and cultivation techniques from other regions, some unexpected issues still arose due to regional differences. For instance, during the sowing period in Bole, the mid-growth stage was affected by strong winds (with wind speeds reaching 11.3 m/s), rain showers, and downy mildew, and effective measures were not taken in time, leading to adverse effects.

4. Discussion

4.1. The Impact of Different Irrigation Amounts on Water Consumption in Quinoa

As the amount of irrigation increases, its proportion in the total water consumption gradually rises. In the northwest arid region, where rainfall is scarce and evaporation is high, the amount of water consumed is primarily determined by the amount of irrigation. The reasonableness of the irrigation amount depends on crop yields, and the initial purpose of field experiments is to enhance crop yields [38,39,40,41,42]. Field trials conducted by Kaya, Yazar [43,44,45,46,47], and others in the Tarsus region, which has a Mediterranean climate, showed that as the irrigation amount increased from 60 mm to 140 mm, the water consumption (ET) rose from 284 mm to 360 mm. Similarly, in the Mediterranean region, tests conducted by Lavini, Pulvento et al. [48] in Vitulazio, Italy, indicated that for the two treatments with irrigation amounts of 202 mm and 383 mm, the water consumption was 343 mm and 450 mm, respectively. These experimental results align with those of this study; in a 2020 trial in Mulei County under mulched drip irrigation conditions, when the irrigation amount increased from 225 mm to 367 mm, the water consumption rose from 428.01 mm to 549.81 mm. Likewise, in Bole City in the northwest arid region, a 2021 trial showed that when the irrigation amount increased from 225 mm to 367 mm, quinoa water consumption increased from 451.94 mm to 566.89 mm, demonstrating that different years and regions can exhibit varying water consumption with the same irrigation amounts.

4.2. The Impact of Different Irrigation Amounts on the Variation in Actual Crop Coefficients During the Growth Period in Quinoa

The K c a c t is an important indicator for assessing crop growth and provides an effective scientific basis for agricultural production [49]. In the early stages of crop growth, the K c a c t is usually relatively low, but as the crop gradually enters its rapid growth phase, the coefficient increases significantly and remains at a high level during the mid-growth stage [48]. However, as the crop begins to mature, with leaves turning yellow and falling off, the K c a c t decreases rapidly [48]. Wang Ruonan et al. [50] noted in their study on the optimization of irrigation systems for spring maize in Shanxi that the K c a c t for spring maize during the jointing stage ranges from 0.5 to 0.6; during the tasseling stage, the coefficient ranges from 0.8 to 1.2; and during the filling stage, it ranges from 0.8 to 1.3. Meanwhile, Zhu Yongjun [51] and his team, through experimental research on the K c a c t of cotton in the Xiaoye irrigation area, showed that cotton sown in mid-to-late April had the K c a c t generally exceeding 1.0 in July. Hirich’s research [15,18] indicated that the K c a c t for quinoa in the early growth stage is approximately 0.4, it is 1.1 in the mid-stage, and then it drops to 0.6 in the later stage, while its companion plant, chickpea, has coefficients of approximately 0.5, 1.15, and 0.3 at each growth stage, respectively. Additionally, research conducted in 2019 and 2020 on the membrane-free drip irrigation of quinoa in Mulei County [33] indicated that the K c a c t at various growth stages was 0.2–0.6, 0.6–1.3, and 0.5–0.8 [33], which aligns with the findings of this experiment; in this experiment, the K c a c t for quinoa during the early, middle, and late growth stages was also approximately 0.4, 0.8–1.3, and 0.45–0.65, respectively. Furthermore, by observing the K c a c t of quinoa in Mulei County and Bole City from 2020 to 2021, it was found that, during the key growth period in quinoa, the K c a c t increased with the amount of irrigation, indicating the significant impact of water management on quinoa growth.

4.3. The Impact of Different Irrigation Amounts on the Variation in Growth and Yield in Quinoa

Quinoa, as a highly ecologically adaptive crop, has demonstrated significant ecological and economic value in agricultural production in arid and extremely arid regions in recent years due to its remarkable drought resistance [51,52]. Although quinoa can grow in extremely dry environments relying on natural precipitation, such as sandy areas with an annual rainfall of only 200 mm, its traditional planting methods still limit yields, especially in its native Andean region [53,54]. According to FAOSTAT 2014 data, the average quinoa yields in Bolivia, Peru, and Ecuador are 570–642 kg·ha−1, 958–1163 kg·ha−1, and 630–848 kg·ha−1, respectively [55,56,57]. This situation has compelled researchers to prioritize increasing quinoa yields as a primary breeding objective. Research conducted in various regions has shown that moderate irrigation and scientific management can significantly improve quinoa yields. For instance, a study by Lavini et al. [48] found that in Italy, under irrigation levels of 202 mm and 383 mm, quinoa yields reached 1690 kg/ha and 2120 kg/ha, respectively, with biomass at 3502.5 kg/ha and 4052.5 kg/ha, and the harvest index increased from 0.482 to 0.523. In the Agadir region of Morocco [15,18], under fully irrigated conditions, quinoa yields reached 2900 kg/ha; even with a 50% deficit in irrigation, yields could be maintained at 1700 kg/ha. Furthermore, in the extremely arid Atacama Desert [15,18], only 50 mm of irrigation is required for quinoa yields to exceed 1000 kg·ha−1. These data not only demonstrate the crucial role of adequate irrigation in enhancing quinoa yields but also emphasize its immense potential under extreme climatic conditions. Further research in Morocco’s Agadir region [15,18] indicated that when the irrigation amount increased from 83 mm to 335 mm, quinoa yields rose from 2000 kg/ha to 3400 kg/ha, illustrating a strong positive correlation between irrigation levels and yields. In the high-altitude desert region of Qinghai Province, China, a study by Malili and others [58] explored the yield and water use efficiency of intercropped quinoa and hairy vetch, establishing different water stress gradient settings for moderate, light, and full irrigation. Their results indicated that under light stress irrigation, yields could reach up to 11,030.48 kg/ha, with a water use efficiency of 0.56.
This study aligns with results from an experiment conducted in 2021 in Bole, which compared the water-rich Bole experimental area (2021) with the relatively water-scarce Mulei County (2020). Theoretically, quinoa yields in Bole City should be higher than in Mulei County; however, actual test results showed that quinoa could absorb enough moisture during the early and middle growth stages, with plant heights ranging from 1.4 to 2.0 m during flowering. Figure 5 illustrates a significant difference in the growth conditions of Bole quinoa and Mulei quinoa. Mulei quinoa exhibited robust growth during its maturation period, with vibrant red seed heads. In contrast, Bole quinoa experienced severe lodging due to strong winds (reaching speeds of 11.3 m/s) mid-growth, which, leading to downy mildew, collectively hindered yield improvement for the Bole quinoa. Even when irrigation levels increased from 225 mm to 367 mm, the yield increase did not meet expectations, with yields under the CK treatment declining by 25% compared to in Mulei County. Reducing or not supplying water application during the early growth stages to control plant height can help to reduce lodging rates later in the growth period. According to Kaya’s research [43,44], the thousand-grain weight of quinoa under different irrigation levels ranged from 2.5 g to 3.1 g, while research by Geerts et al. [59,60,61,62] revealed that under rain-fed conditions, deficit irrigation conditions, and sufficient irrigation conditions, the thousand-seed weights were 4.2 g, 5.5 g, and 5.6 g, respectively. Similarly, in the current experiment, it was found that as irrigation levels increased, the thousand-seed weight of quinoa ranged between 2.16 g and 2.41 g, with minimal impacts on the thousand-seed weight once irrigation levels reached 330 mm.

4.4. The Impact of Different Irrigation Amounts on Water Productivity

Improving water productivity can significantly reduce water resource waste and ensure that the needs of crop growth are met even in water-scarce environments [1,35,63,64]. In the Xinjiang region, due to climate and water resource limitations, the WP of crops is generally low, despite researchers having made efforts to improve this indicator over the last several decades [4,12]. Since the introduction of drip irrigation technology in the 1990s, although crop yields have increased, the WP levels in Xinjiang have not yet reached the national average standard [4,7]. For instance, research conducted by Zhang Zhao et al. [65] at the Bole Agricultural Experiment Station showed that when the irrigation amount varied between 240 mm and 540 mm, the WP of wheat fluctuated between 0.99 and 1.53 kg/m3, peaking at an irrigation amount of 420 mm. However, studies by Kaya and Yazar [43,44,45,46,47] indicated that increasing the irrigation amount does not necessarily lead to improved WP for quinoa and may negatively impact quinoa growth after reaching a certain irrigation threshold. In field trials in the Tarsus region, it was found that as the irrigation amount increased from 60 mm to 140 mm, the WP of quinoa dropped from 0.58 to 0.54. Meanwhile, in the Vitulazio area of Italy, Pulvento and others [48] found that under two irrigation treatments (202 mm and 383 mm), the WP of quinoa was 0.49 and 0.47 kg/m3, respectively, showing that a higher irrigation amount did not improve water productivity. Additionally, research by Geerts et al. [60,61,62,63] in the highlands of Bolivia also revealed significant differences in quinoa yield and water productivity under varying irrigation conditions. For example, in the Irpani area [61,63], under rainfed conditions with an effective rainfall of 385 mm and under deficit irrigation conditions with an irrigation amount of 28 mm, the quinoa yield was 2160 kg/ha and 2400 kg/ha, respectively, with WP at 0.50 kg/m3 and 0.52 kg/m3. In Mejillones, the yields under these two treatments (effective rainfall of 107 mm and irrigation of 41 mm) were only 340 kg/ha and 420 kg/ha, with WP dropping to 0.32 kg/m3 and 0.28 kg/m3. The results of this study are consistent with the observations mentioned above; in an experiment conducted in 2020 in Mulei County, under plastic film drip irrigation conditions, as the irrigation quota increased from 330 mm to 367 mm, the WP decreased from 0.398 to 0.396. In a 2021 experiment in Bole, when the irrigation amount increased from 292 mm to 330 mm, the WP of quinoa also fell from 0.309 to 0.304. These results clearly demonstrate the growth performance of quinoa in different environments, soils, and climatic conditions, as well as its sensitivity to irrigation amounts, emphasizing the need for the precise adjustment of irrigation amounts in water resource management and crop cultivation to achieve the effective utilization of resources and to maximize outputs.

5. Conclusions

Through studying the water consumption, yield, biological yield, water productivity, and various growth indicators of quinoa at different growth stages, we could draw a series of important conclusions. Firstly, the irrigation treatment started approximately 40 days after sowing, marking the onset of the quinoa rapid growth phase. At this time, the plant height, stem thickness, and leaf area significantly increased. Proper water management notably enhanced the growth performance of quinoa, especially in the early stages of growth when the distribution of dry matter in the leaves was higher compared to that in the stems and roots; this indicated a high level of dependence on photosynthesis. However, excessive water application can adversely affect the growth of quinoa seedlings. By the maturity stage, the yellowing and shedding of leaves led to a sharp decline in their proportion, affecting the total accumulation of dry matter. Secondly, there were differences in the change in WP in response to water stress in quinoa. Water stress during the seedling to branching stages significantly affects the growth indicators of quinoa but has little impact on its WP. In the experiments, the highest WP was observed in the YM3 treatment in 2020 and the YM12 treatment in 2021, while the water consumption in these treatments was not the highest observed in the experiment. Furthermore, quinoa’s water consumption has a significant impact on yield, indicating that moisture is one of the key factors affecting quinoa yield. In particular, the irrigation amount from flowering to grain filling significantly influences quinoa yield. In this experiment, under a fixed irrigation quota of 367 mm in two different experimental areas, the water consumption reached its maximum, with yields of 2.178 Mg·ha−1 and 1.631 Mg·ha−1, respectively. This result suggests that it is difficult for quinoa to achieve maximum WP and yield simultaneously. Finally, the growth performance of quinoa under film mulching and drip irrigation in 2021 was similar to that in 2020; however, strong winds during the mid-growth period caused severe lodging and breakage of the quinoa plants. This not only affected ventilation between the plants but also increased the risk of downy mildew, ultimately having adverse effects on quinoa yield. These findings provide a scientific basis for water management in quinoa, highlighting the importance of controlling irrigation amounts during the early growth stages to reduce excessive height growth, which plays a crucial role in improving quinoa yield.

Author Contributions

Conceptualization, M.A. and A.Y.; methodology, M.A. and A.Y.; software, M.A.; validation, M.A., A.Y. and J.Z.; formal analysis, M.A.; investigation, M.A.; resources, M.A. and A.Y.; data curation, M.A., H.T. and A.Y.; writing—original draft preparation, M.A.; writing—review and editing, M.A., H.T. and J.Z.; visualization, M.A.; supervision, H.T. and J.Z.; project administration, H.T. and J.Z.; funding acquisition, J.Z. All authors have read and agreed to the published version of the manuscript.

Funding

This study was supported by the National Natural Science Foundation of China (52169013).

Data Availability Statement

The datasets used and analyzed in the current study are available from the corresponding author upon reasonable request.

Conflicts of Interest

The authors declare no conflicts of interest.

Abbreviations

WSwind speed (m·s−1)
Tmaxmaximum temperature (°C)
Tminminimum temperature (°C)
HRhumidity (%)
E T O reference crop evapotranspiration (mm·day−1);
slope of the saturation vapor pressure curve (kPa·°C−1)
R n radiation (MJ·m²·day−1)
G soil heat flux density (MJ·m²·day−1)
T mean daily air temperature (°C)
U 2 wind speed at 2 m height (m·s−1)
e a saturation vapor pressure (kPa)
e d actual vapor pressure (kPa)
γ psychrometric constant (kPa·°C−1)
ETc1–2evapotranspiration during the growth stage (mm·day−1)
ntotal number of soil layers
γ i bulk density of the ith soil layer (g·cm−3)
H i thickness of the ith soil layer (cm)
W i 1 moisture content at the beginning of the period in the ith soil layer (percentage of dry soil weight)
W i 2 moisture content at the end of the period in the ith soil layer (percentage of dry soil weight)
M irrigation amount during the period (mm)
P precipitation amount during the period (mm)
K groundwater recharge amount during the period (mm);
C drainage amount during the period (sum of surface- and lower-layer drainage; mm)
E T o reference crop evapotranspiration (mm·day−1)
E T c crop water consumption in each growth stage (mm·day−1)
K c a c t related to factors such as the crop type, variety, crop population, and leaf area index
HIharvest index
Yaseed yield of quinoa (Mg·day−1)
WPwater productivity (kg·m−3)

References

  1. Pereira, L.S.; Cordery, I.; Iacovides, I. Improved indicators of water use performance and productivity for sustainable water conservation and saving. Agric. Water Manag. 2012, 108, 39–51. [Google Scholar] [CrossRef]
  2. Williams, W.D. Salinisation: A major threat to water resources in the arid and semi-arid regions of the world. Lakes Reserv. Res. Manag. 2010, 4, 85–91. [Google Scholar] [CrossRef]
  3. Paredes, P.; D’Agostino, D.; Assif, M.; Todorovic, M.; Pereira, L.S. Assessing potato transpiration, yield and water productivity under various water regimes and planting dates using the FAO dual Kc approach. Agric. Water Manag. 2018, 195, 11–24. [Google Scholar] [CrossRef]
  4. Li, J.; Luo, G.; Shaibu, A.S.; Li, B.; Zhang, S.; Sun, J. Optimal fertilization level for yield, biological and quality traits of soybean under drip irrigation system in the arid region of Northwest China. Agronomy 2022, 12, 291. [Google Scholar] [CrossRef]
  5. Yang, P.; Wu, L.; Cheng, M.; Fan, J.; Li, S.; Wang, H.; Qian, L. Review on drip irrigation: Impact on crop yield, quality, and water productivity in China. Water 2023, 15, 1733. [Google Scholar] [CrossRef]
  6. Ni, S.; Lyu, J.; Liu, J. Analysis on the evolution trend of drought disaster in China under changing environment. China Flood Drought Manag. 2022, 32, 1–7. [Google Scholar]
  7. Liu, J. Study on Long-Term Utilization of Agricultural High-Efficiency Water-Saving Irrigation Technology in Xinjiang; Xinjiang Agricultural University: Urumqi, China, 2016. [Google Scholar]
  8. Ramos, T.B.; Darouich, H.; Pereira, L.S. Mulching effects on soil evaporation, crop evapotranspiration and crop coefficients: A review aimed at improved irrigation management. Irrig. Sci. 2024, 42, 525–539. [Google Scholar] [CrossRef]
  9. Liu, M.; Wang, G.; Liang, F.; Li, Q.; Tian, Y.; Jia, H. Optimal irrigation levels can improve Maize growth, yield, and water use efficiency under drip irrigation in Northwest China. Water 2022, 14, 3822. [Google Scholar] [CrossRef]
  10. Wang, J. The distribution and evolution of Xinjiang’s Arid Zone under climate warming and humidification. Arid. Environ. Monit. 2023, 37, 15–21. [Google Scholar]
  11. Terán-Chaves, C.A.; Montejo-Nuñez, L.; Cordero-Cordero, C.; Polo-Murcia, S.M. Water productivity indices of onion (Allium cepa) under drip irrigation and mulching in a Semi-Srid Tropical Region of Colombia. Horticulturae 2023, 9, 632. [Google Scholar] [CrossRef]
  12. Wu, F.; Wang, L.; Lin, T.; Wang, J.; Guo, R.; Yue, L.; Tang, Q. Effect of plastic film on evapotranspiration and evaporation of cottons under drip irrigation in Southern Xinjiang. Acta Agric. Boreali-Occident. Sin. 2016, 25, 1636–1642. [Google Scholar]
  13. Wen, R.; Liu, J.; Zhang, Z. Effects of drought stress on germination and physiological characteristics of different quinoa seeds. Crops 2019, 1, 121–126. [Google Scholar]
  14. Qureshi, A.S.; Daba, A.W. Differential analysis of five quinoa (Chenopodium quinoa W.) genotypes under different salt stresses in a controlled environment. Am.-Eurasian J. Sustain. Agric. 2020, 14, 14–21. [Google Scholar]
  15. Hirich, A.; Omari, H.E.; Youssfi, L.E.; Jacobsen, S.E.; Choukr-Allah, R. The combined effect of organic matter amendment and deficit irrigation with treated wastewater on quinoa and pea. In Proceedings of the International Conference on Sustainable Water Use for Securing Food Production in the Mediterranean Region under Changing Climate, Agadir, Morocco, 10–15 March 2013. [Google Scholar]
  16. Jacobsen, S.E. The Worldwide Potential for Quinoa (Chenopodium quinoa Willd). Food Rev. Int. 2003, 19, 167–177. [Google Scholar] [CrossRef]
  17. Singh, R.K.; Tutundjin, S.; Rodriguez, J.P. Quinoa: An underutilized crop for nutritional food security from the marginal lands. In Proceedings of the International Workshop on “Plant Stress Biology and Food Security”, ICGEB, New Delhi, India, 18–20 April 2019. [Google Scholar] [CrossRef]
  18. Hirich, A.; Rafik, S.; Rahmani, M.; Amira, F.; Choukr-Allah, R. Development of quinoa value chain to improve food and nutritional security in rural communities in Rehamna, Morocco: Lessons learned and perspectives. Plants 2021, 10, 301. [Google Scholar] [CrossRef]
  19. Al-Naggar, A.M.M.; Abd El-Salam, R.M.; Badran, A.E.E.; Boulos, S.T.; El-Moghazi, M.M. Leaf amino acids and anatomical traits of drought tolerant vs sensitive genotypes of quinoa (Chenopodium quinoa Willd.) under elevated Levels of water stress. Annu. Res. Rev. Biol. 2018, 22, 46. [Google Scholar] [CrossRef]
  20. Geerts, S.; Raes, D.; Garcia, M.; Vacher, J.; Mamani, R.; Mendoza, J.; Huanca, R.; Morales, B.; Miranda, R.; Cusicanqui, J.; et al. Introducing deficit irrigation to stabilize yields of quinoa (Chenopodium quinoa Willd.). Eur. Agron. 2008, 28, 427–436. [Google Scholar] [CrossRef]
  21. Alizadeh-Zoaj, F.; Sepaskhah, A.R.; Talebnejad, R. Nitrogen application rates influence on yield and water productivity of quinoa under saline irrigation water regimes and saline water table. Plant Nutr. 2023, 46, 3273–3291. [Google Scholar] [CrossRef]
  22. Aziz, A.; Akram, N.A.; Ashraf, M. Influence of natural and synthetic vitamin C (ascorbic acid) on primary and secondary metabolites and associated metabolism in quinoa (Chenopodium quinoa Willd.) plants under water deficit regimes. Plant Physiol. Biochem. 2018, 123, 192–203. [Google Scholar] [CrossRef]
  23. Murphy, K.S.; Matanguihan, J. Quinoa: Improvement and Sustainable Production; John Wiley & Sons: Hoboken, NJ, USA, 2015. [Google Scholar]
  24. Qi, T.M.; Li, Z.J.; Qin, P.Y.; Ren, G.X.; Zhou, B.W. Research and application prospect of quinoa cultivation technology. Agric. Sci. Technol. 2022, 24, 157–165. [Google Scholar]
  25. Gongbu, T.; Wang, M.; Zhang, C. Preliminary study of biological characters of quinoa in Tibet. Acta Agric. Boreali-Occident. Sin. 1994, 4, 81–86. [Google Scholar]
  26. Gongbu, T.; Wang, M. Quinoa nutritional character in Tibet. Acta Agric. Boreali-Occident. Sin. 1995, 3, 85–88. [Google Scholar] [CrossRef]
  27. Liu, S.; Fan, W. Suggestion to promote scale cultivation and formation of production chain of quinoa in Shanxi. Shanxi Agric. Sci. 2011, 39, 767–769. [Google Scholar]
  28. Wang, N.; Wang, F.; Shock, C.C.; Gao, L.; Meng, C.; Huang, Z.; Zhao, J. Evaluating quinoa lodging risk and yield under different irrigation thresholds, nitrogen rates and planting densities in north-western china. Front. Agric. Sci. Eng. 2022, 9, 614–626. [Google Scholar]
  29. Huang, J. The inaugural Western China quinoa industry summit and the 2015 annual meeting of the chinese crop science society quinoa branch. Agric. Sci. Technol. 2015, 17, 141. [Google Scholar]
  30. Tian, J.; Tang, Y.; Dong, Y. Effect of water stress on physiology of quinoa in different developmental stages. J. Biol. 2020, 37, 73–76. [Google Scholar]
  31. Garcia, M.; Raes, D.; Jacobsen, S.E. Evapotranspiration analysis and irrigation requirements of quinoa (Chenopodium quinoa) in the Bolivian highlands. Agric. Water Manag. 2003, 60, 119–134. [Google Scholar] [CrossRef]
  32. Algosaibi, A.M.; Badran, A.E.; Almadini, A.M.; El-Garawany, M.M. Research on the Effect of Irrigation Intervals on the Growth and Yield of Quinoa Crop and Its Components. Cut.-Edge Res. Agric. Sci. 2021, 7, 144–154. [Google Scholar] [CrossRef]
  33. Awa, M.; Zhao, J.; Tumaerbai, H. Deficit irrigation-based improvement in growth and yield of quinoa in the northwestern arid region in China. Sustainability 2024, 16, 4136. [Google Scholar] [CrossRef]
  34. Wang, T.; Xu, M. Analysis of water resource supply and demand balance in the Mulei Kazakh Autonomous County. Groundwater 2016, 38, 168–170. [Google Scholar]
  35. Yerkekjiang, H.; Apalar, R.; Liu, H. Analysis of meteorological drought characteristics in spring and summer over the past 51 years in Mulei County, Xinjiang. Hubei Agric. Sci. 2021, 60, 57–63. [Google Scholar] [CrossRef]
  36. Allen, R.; Pereira, L.; Raes, D.; Smith, M.; Allen, R.G.; Pereira, L.S.; Martin, S. Crop Evapotranspiration: Guidelines for Computing Crop Water Requirements; FAO Irrigation and Drainage Paper 56; FAO: Quebec City, QC, Canada, 1998; p. 56. [Google Scholar]
  37. Allen, R.G.; Pereira, L.S.; Howell, T.A.; Jensen, M.E. Evapotranspiration information reporting: I. Factors governing measurement accuracy. Agric. Water Manag. 2011, 98, 899–920. [Google Scholar] [CrossRef]
  38. Yu, Z. Study on Water-Saving Effect of Irrigation Methods and Farmers’ Technology Choice in Northwest China. Ph.D. Thesis, Chinese Academy of Agricultural Sciences, Beijing, China, 2018. [Google Scholar]
  39. Jia, Y.; Huang, W.; Yang, B. A meta-analysis of yield and irrigation water productivity of cotton under dificit irrigation in China. Cotton Sci. 2023, 35, 195–210. [Google Scholar]
  40. Bai, Y.; Jia, S.; Luo, T. Effect of irrigation on root distribution characteristics of maize under film drip irrigation. Water-Sav. Irrig. 2016, 11, 19–22+27. [Google Scholar]
  41. Duan, W. Dynamic Response of Root-Shoot Growth of Summer Maize to Soil Moisture Under Deficit Irrigation; Northwest A&F University: Xianyang, China, 2022. [Google Scholar] [CrossRef]
  42. Liang, Y. Effects of Different Plant Densities and Nitrogen Fertilizer Rate on Stem Morphology Characteristic and Lodging Resistance in Winter Wheat Under Drip Irrigation; Xinjiang Agricultural University: Urumqi, China, 2018. [Google Scholar]
  43. Kaya, Ç.I.; Yazar, A.; Sezen, S.M. SALTMED model performance on simulation of soil moisture and crop yield for quinoa irrigated using different irrigation systems, irrigation strategies and water qualities in Turkey. In Proceedings of the International Symposium on Efficient Irrigation Management and Its Effects in Urban and Rural Landscapes, Patras, Greece, 26–28 November 2014; pp. 108–118. [Google Scholar]
  44. Ince Kaya, C.A. Saltmed model performance for quinoa irrigated with fresh and saline water in a Mediterranean environment. Irrig. Drain. 2016, 65, 37–39. [Google Scholar] [CrossRef]
  45. Yazar, A.; Sezen, S.M.; Olak, Y.B. Yield response of quinoa to irrigation with drainage water and planting times in the Mediterranean Region. In Proceedings of the Irrimed 2015: Modern technologies, strategies and tools for sustainable irrigation management and governance in Mediterranean agriculture, Bari, Italy, 23–25 September 2015. [Google Scholar]
  46. Yazar, A.; Incekaya, I.; Sezen, M.S.; Jacobsen, S.E. Saline water irrigation of quinoa (Chenopodium quinoa) under Mediterranean conditions. Crop Pasture Sci. 2015, 66, 37–39. [Google Scholar] [CrossRef]
  47. Yazar, A.; Sezen IN, S.M.; Tekin, S. Quinoa Experimentation and Production in Turkey; FAO: Adana, Turkey, 2015. [Google Scholar]
  48. Pulvento, C.; Riccardi, M.; Lavini, A.; d’Andria, R.; Iafelice, G.; Marconi, E. Field trial evaluation of two chenopodium quinoa genotypes grown under rain-fed conditions in a typical mediterranean environment in South Italy. Agron. Crop Sci. 2010, 196, 407–411. [Google Scholar] [CrossRef]
  49. Adusumilli, R.; Laxmi, S.B. Potential of the system of rice intensification for systemic improvement in rice production and water use: The case of Andhra Pradesh, India. Paddy Water Environ. 2011, 9, 89–97. [Google Scholar] [CrossRef]
  50. Wang, R. Research on the Optimization of Irrigation Systems for Spring Maize in Shaanxi Province Based on Key Water Security; Xi’an University of Technology: Xi’an, China, 2024. [Google Scholar] [CrossRef]
  51. Zhu, Y.; Bai, X.; Wang, Y. Experimental study on the crop coefficient (Kc) of cotton in the Xiaoyezi irrigation district. Xinjiang Agric. Reclam. Sci. Technol. 2019, 42, 25–28. [Google Scholar]
  52. Algosaibi, A.M.; Badran, A.E.; Almadini, A.M.; El-Garawany, M.M. The effect of irrigation intervals on the growth and yield of quinoa crop and Its Components. J. Agric. Sci. 2017, 9, 182–191. [Google Scholar] [CrossRef]
  53. Kaoutar, F.; Abdelaziz, H.; Ouafae, B.; Redouane, C.A.; Ragab, R. Yield and dry matter simulation using the saltmed model for five quinoa (Chenopodium quinoa) accessions under deficit irrigation in South Morocco. Irrig. Drain. 2017, 66, 340–350. [Google Scholar] [CrossRef]
  54. González, J.A.; Gallardo, M.; Hilal, M.B.; Rosa, M.D.; Prado, F.E. Physiological responses of quinoa (Chenopodium quinoa Willd.) to drought and waterlogging stresses: Dry matter partitioning. Bot. Stud. 2009, 50, 35–42. [Google Scholar]
  55. Jensen, C.R.; Jacobsen, S.E.; Andersen, M.N.; Nunez, N.; Andersen, S.D.; Rasmussen, L.; Mogensen, V.O. Leaf gas exchange and water relation characteristics of field quinoa (Chenopodium quinoa Willd.) during soil drying. Eur. Agron. 2000, 13, 11–25. [Google Scholar]
  56. Fghire, R.; Wahbi, S.; Anaya, F.; Issa Ali, O.; Benlhabib, O.; Ragab, R. Response of quinoa to different water management strategies: Field experiments and saltmed model application results. Irrig. Drain. 2015, 64, 232–238. [Google Scholar]
  57. Talebnejad, R.; Sepaskhah, A.R. Effect of deficit irrigation and different saline groundwater depths on yield and water productivity of quinoa. Agric. Water Manag. 2015, 159, 225–238. [Google Scholar]
  58. Ma, L.; Zhang, Y.; Li, Z.; Han, M.; Jiang, F. Effects and comprehensive evaluation of regulated deficit irrigation on mixed seeding of Chenopodium quinoa Willd. and Vicia villosa in alpine desert area. J. Qinghait Univ. 2022, 40, 18–24. [Google Scholar] [CrossRef]
  59. Geerts, S.; Raes, D. Deficit irrigation as an on-farm strategy to maximize crop water productivity in dry areas. Agric. Water Manag. 2009, 96, 1275–1284. [Google Scholar] [CrossRef]
  60. Geerts, S.; Raes, D.; Garcia, M.; Condori, O.; Mamani, J.; Miranda, R.; Cusicanqui, J.; Taboada, C.; Yucra, E.; Vacher, J. Could deficit irrigation be a sustainable practice for quinoa (Chenopodium quinoa Willd.) in the Southern Bolivian Altiplano? Agric. Water Manag. 2008, 95, 909–917. [Google Scholar]
  61. Geerts, S.; Raes, D.; Garcia, M.; Miranda, R.; Cusicanqui, J.A.; Taboada, C.; Mendoza, J.; Huanca, R.; Mamani, A.; Condori, O. Simulating yield response of quinoa to water availability with AquaCrop. Agron. J. 2009, 101, 37–39. [Google Scholar]
  62. Geerts, S.; Raes, D.; Garcia, M.; Taboada, C.; Miranda, R.; Cusicanqui, J.; Mohizha, T.; Vacher, J. Modeling the potential for closing quinoa yield gaps under varying water availability in the Bolivian Altiplano. Agric. Water Manag. 2009, 96, 77–89. [Google Scholar]
  63. Zhao, H.; Cai, D.; Wang, H.; Yang, Y.; Wang, Y.; Zhang, K.; Qi, Y.; Zhao, F.; Chen, F.; Yue, P. Progress and prospect on impact of drought disaster on food security and its countermeasures. Arid. Meteorol. 2023, 41, 187–206. [Google Scholar]
  64. Yang, L. 2019 water resource situation and Its development and utilization in bortala mongol autonomous prefecture. Energy Conserv. 2021, 10, 113–114. [Google Scholar] [CrossRef]
  65. Zhang, Z.; Huang, C.; Fan, Y. The effect of drip irrigation volume on the growth, development, yield, and water use efficiency of spring wheat in Northern Xinjiang. J. Irrig. Drain. 2024, 43, 22–27. [Google Scholar] [CrossRef]
Figure 1. Quinoa test site.
Water 17 00917 g001
Figure 2. Maximum temperature (Tmax), minimum temperature (Tmin), wind speed (WS), and rainfall during the growth period of quinoa in the experimental area.
Water 17 00917 g002aWater 17 00917 g002b
Figure 3. Reference crop evapotranspiration ( E T O ), net radiation at the crop surface (Rn), and humidity (HR) during the growing stage.
Water 17 00917 g003
Figure 4. Plant height, stem diameter, and leaf area in quinoa during different growth stages. Different letters (a, b, and c) in the columns indicate significant differences among the treatments (p < 0.05).
Water 17 00917 g004aWater 17 00917 g004b
Figure 5. Growth conditions for quinoa in Mulei and Bole.
Water 17 00917 g005
Table 1. Initial soil parameter analysis.
Test StationTopsoil, cmOrganic Matter, g·kg−1Available Nitrogen, mg·kg−1Available Phosphorus, mg·kg−1Available Potassium, mg·kg−1PHTotal Salts, mg·g−1Field Capacity,
%
Wilting Point,
%
Soil Bulk Density, g·cm−3
Mulei 0–2017.48 69.50 45.25 384.00 7.84 0.65 21.73 10.12 1.64
20–4012.80 52.75 14.55 269.15 7.78 0.50 21.34 9.76 1.62
40–607.00 36.25 6.85 151.30 7.15 0.31 21.12 9.54 1.59
60–804.90 25.38 4.80 105.91 5.01 0.21 20.75 9.21 1.58
Bole 0–203.43 94.31 27.72 304.85 8.40 0.36 21.75 9.75 1.60
20–403.23 82.12 21.97 253.43 8.32 0.32 22.77 9.84 1.60
40–603.17 75.31 18.34 185.24 8.23 0.25 22.67 10.34 1.59
60–802.92 65.32 11.21 132.54 8.32 0.15 21.90 9.54 1.57
Table 2. Irrigation depths during quinoa growth stages (mm).
Growth StageDateDays of Growth2020/2021
YM1/YM11YM2/YM12YM3/YM13CK/CK1
Germination24 April–2 May90000
Seedling3 May–25 May2330 30 30 30
Branching26 May–19 June250 0 0 0
Heading 20 June–6 July1945 52 60 67
Flowering7 July–22 July1545 52 60 67
Grain filling23 July–3 September42135 157 180 202
Ripening4 September–15 September120 0 0 0
Irrigation Depth145255 292 330 367
Table 3. Water consumption at different quinoa growth stages (mm).
YearTreatmentGrowth Stages E T c
SeedlingBranchingHeadingFloweringGrain FillingRipening
2020
Mulei
YM145.80 a51.22 a54.34 c71.87 c182.89 d21.89 b428.01 c
YM245.28 a51.46 a60.09 c78.23 bc207.45 c24.42 a466.94 bc
YM346.47 a51.36 a68.56 b85.63 ab232.76 b24.88 a509.66 ab
CK46.69 a51.78 a75.87 a92.68 a256.30 a26.50 a549.81 a
2021
Bole
YM1141.49 a54.90 a58.71 c73.85 c192.83 c30.17 a451.94 c
YM1241.86 a54.43 a64.74 c81.26 bc216.30 b30.41 a489.00 bc
YM1341.77 a54.82 a72.32 b87.88 ab236.79 b31.13 a524.71 ab
CK141.68 a55.81 a80.24 a95.21 a261.93 a32.02 a566.89 a
Note: Different letters (a, b, c, and d) in the columns indicate significant differences among the treatments (p < 0.05).
Table 4. Actual crop coefficients at different quinoa growth stages.
YearTreatmentGrowth Stages
SeedlingBranchingHeadingFloweringGrain FillingRipening
2020
Mulei
YM10.41 a0.37 a0.61 c0.86 c0.89 d0.56 b
YM20.41 a0.37 a0.67 c0.94 bc1.01 c0.62 a
YM30.42 a0.37 a0.77 b1.03 ab1.13 b0.64 a
CK0.42 a0.38 a0.85 a1.11 a1.25 a0.68 a
2021
Bole
YM110.38 a0.38 a0.62 c0.88 c0.93 c0.61 a
YM120.38 a0.37 a0.68 c0.97 bc1.04 b0.62 a
YM130.38 a0.38 a0.76 b1.04 ab1.14 b0.63 a
CK10.38 a0.38 a0.84 a1.13 a1.26 a0.65 a
Note: Different letters (a, b, c, and d) in the columns indicate significant differences among the treatments (p < 0.05).
Table 5. Changes in the dry matter of quinoa at different growth stages (g·plant).
YearTreatmentGrowth Stages
SeedlingBranchingHeading FloweringGrain FillingRipening
2020
Mulei
YM11.100 a20.040 a61.920 c108.620 d296.010 c306.860 b
YM21.120 a19.020 a65.530 bc131.800 c331.440 b328.360 b
YM31.120 a18.690 a69.290 ab154.020 b369.170 a365.600 a
CK1.130 a20.460 a73.450 a173.000 a394.360 a386.430 a
2021
Bole
YM111.080 a17.900 a73.660 b167.900 c328.840 c312.960 c
YM121.120 a17.720 a79.600 ab196.540 b351.880 bc336.410 bc
YM131.110 a18.030 a83.000 a227.570 a385.230 ab365.200 ab
CK11.110 a18.770 a87.450 a244.443 a405.980 a382.970 a
Note: Different letters (a, b, c, and d) in the columns indicate significant differences among the treatments (p < 0.05).
Table 6. Pearson correlation coefficients between the growth indicators of quinoa and water consumption during different growth stages.
YearGrowth ParameterGrowth Stage
SeedlingBranchingHeadingFloweringGrain FillingRipening
2020
Mulei
Plant height0.940 **0.783 **0.866 **0.970 **0.959 **0.986 **
Stem diameter0.746 **0.911 **0.959 **0.973 **0.985 **0.952 **
Leaf area0.623 *0.976 **0.961 **0.973 **0.979 **0.974 **
Root dry mass0.919 **0.796 **0.938 **0.971 **0.982 **0.919 **
Stem dry mass0.845 **0.577 *0.988 **0.984 **0.992 **0.916 **
Leaf dry mass0.976 **0.991 **0.889 **0.986 **0.997 **0.969 **
Fruit dry mass--0.808 **0.968 **0.989 **0.944 **
Biological yield0.964 **0.766 **0.965 **0.984 **0.997 **0.943 **
2021
Bole
Plant height0.977 **0.832 **0.862 **0.974 **0.948 **0.755 **
Stem diameter0.891 **0.990 **0.979 **0.978 **0.992 **0.817 **
Leaf area0.669 *0.960 **0.918 **0.997 **0.973 **0.801 **
Root dry mass0.953 **0.804 **0.959 **0.972 **0.993 **0.909 **
Stem dry mass0.833 **0.901 **0.933 **0.970 **0.994 **0.772 **
Leaf dry mass0.974 **0.806 **0.943 **0.976 **0.966 **0.873 **
Fruit dry mass--0.989 **0.997 **0.971 **0.833 **
Biological yield0.970 **0.960 **0.959 **0.984 **0.986 **0.828 **
Note: * and ** indicate significance at the 0.05 and 0.01 probability levels, respectively.
Table 7. Yield, TSW, HI, WP, and biological yield of quinoa.
YearTreatmentTSW (g)Yield (Mg·ha−1)Biological Yield (Mg·ha−1)HIWP (kg·m−3)
2020
Mulei
YM12.226 a1.364 b5.47 b0.249 b0.318 b
YM22.390 a1.509 b5.91 b0.255 b0.323 b
YM32.410 a2.030 a6.63 a0.306 a0.398 a
CK2.389 a2.178 a7.00 a0.311 a0.396 a
2021
Bole
YM112.160 b1.374 b5.59 c0.246 a0.304 a
YM122.274 ab1.512 ab6.04 bc0.250 a0.309 a
YM132.380 ab1.594 a6.58 ab0.242 a0.304 a
CK12.410 a1.631 a6.90 a0.236 a0.288 a
Note: TSW, thousand-seed weight; HI, harvest index; WP, water productivity. Different letters (a, b, and c) in the columns indicate significant differences among the treatments (p < 0.05).
Table 8. Regression equations between E T c and quinoa yield, biological yield, and water productivity.
AreaDependent VariableRegression EquationR2Combination of Treatment for Max y
x/mmymax
2020 MuleiYield (Mg·ha−1)y = 7.29x − 1791.7330.95 549.81 2.18
Biological yield (Mg·ha−1)y = 13.05x − 123.900.99 549.81 7.00
Water productivity (kg·m−3)y = 0.001x − 0.0140.83 509.66 0.40
2021 BoleYield (Mg·ha−1)y = 2.22x + 398.210.92 566.89 1.63
Biological yield (Mg·ha−1)y = 11.73x + 321.840.98 566.89 6.90
Water productivity (kg·m−3)y = 0.00x + 0.3740.59 489.00 0.31
Disclaimer/Publisher’s Note: The statements, opinions and data contained in all publications are solely those of the individual author(s) and contributor(s) and not of MDPI and/or the editor(s). MDPI and/or the editor(s) disclaim responsibility for any injury to people or property resulting from any ideas, methods, instructions or products referred to in the content.

