Article

Enhanced Three-Dimensional (3D) Drought Tracking for Future Migration Patterns in China Under CMIP6 Projections

School of Resource and Environmental Engineering, Wuhan University of Technology, Wuhan 430070, China
*
Authors to whom correspondence should be addressed.
Water 2025, 17(7), 1099; https://doi.org/10.3390/w17071099
Submission received: 5 March 2025 / Revised: 30 March 2025 / Accepted: 4 April 2025 / Published: 7 April 2025
(This article belongs to the Section Water and Climate Change)

Abstract

:
Analyzing drought evolution requires dynamic three-dimensional methods to capture spatiotemporal continuity. Existing approaches oversimplify drought patch connectivity by relying on overlapping logic, thereby neglecting dynamic evolution. We propose a novel three-dimensional identification method incorporating spatial autocorrelation and anisotropy. Using the ERA5 dataset and the multi-model ensemble mean (MEM) of CMIP6, we investigate meteorological drought characteristics and migration patterns in China during 1961–2010 (historical) and 2031–2080 (future, SSP2-4.5/SSP5-8.5). Results indicate future drought frequency may decline by over 70% compared to historical levels, but severity, duration, affected area, and migration distance could increase significantly. Most future droughts (96.3% for SSP2-4.5; 95.0% for SSP5-8.5) are projected in spring and summer. Drought trajectories may predominantly shift northeastward (33% for SSP2-4.5; 38% for SSP5-8.5), with migration hotspots transitioning from the upper Yangtze River Basin to the upper Yellow River Basin. These findings enhance the understanding of drought dynamics and support the development of improved drought monitoring frameworks. The methodology and projections provide critical insights for drought risk management and adaptive water resource planning under climate change.

1. Introduction

As one of the world’s most destructive natural disasters, drought, especially persistent major drought events, poses serious challenges to the human living environment and socio-economic development [1,2,3]. In the context of global warming, the duration, severity, and extent of drought have increased, contributing to the whole society’s concerns about future drought [4,5,6]. Therefore, exploring the characteristics and migration patterns of drought is crucial to enhance the ability to detect and prevent drought. At present, more and more scholars have carried out extensive and profound studies on the characteristics and evolutionary patterns of drought events in historical as well as future periods from different spatiotemporal scales [7,8,9,10,11,12,13,14,15]. However, these studies focus on analyzing the characteristics of drought in a single dimension (time or space). They are limited to analyzing the characteristics of drought over time in a specific region or the spatial distribution patterns of drought on a specific time scale, ignoring the spatiotemporal continuity of drought events [16,17,18]. This makes it impossible to objectively reveal the nature of the drought and accurately grasp the trend of drought development.
Drought evolution is a dynamic process with spatiotemporal continuity, necessitating comprehensive analytical methods for assessing its multidimensional characteristics [19,20,21]. Various drought identification approaches have been developed in recent years, such as the Severity-Area-Duration (SAD) and 3D clustering algorithms. Notably, the SAD method, pioneered by Andreadis et al. [22], effectively reveals the complex attributes of drought events by integrating spatial, temporal, and severity dimensions, which has been extensively applied across diverse climatic regions, including the United States, China, and Turkey [23,24,25,26,27,28]. Lloyd-Hughes [18] advanced drought analysis by establishing a three-dimensional coordinate system incorporating longitude, latitude, and temporal dimensions, which facilitates spatial clustering. This method has become the mainstream approach for studying the multidimensional characteristics of drought [19,20,21]. Following the development of 3D clustering algorithms, Cammalleri et al. [29] and Liu et al. [30] independently constructed meteorological drought event databases in Europe and China using the 3D-DBSCAN algorithm, laying a foundation for subsequent research.
The 3D drought identification framework generally consists of two core modules: spatial clustering of drought patches and spatiotemporal correlation of drought events [30,31,32,33,34,35,36]. Current spatial clustering methodologies mainly use window filtering techniques with predefined spatial neighborhood parameters to initially aggregate drought patches. For spatiotemporal correlation, overlapping area thresholds remain the predominant criterion. Subsequently, numerous scholars have proposed various improvements from multiple dimensions. For example, Nie et al. [37] introduced an optimized spatiotemporal correlation criterion based on overlap area ratio; Diaz et al. [38] innovatively combined cluster size and centroid distance as joint discrimination metrics; and Zhang et al. [39] enhanced the identification of small-scale drought patches through integrated run theory and DBSCAN algorithms. While these studies have greatly expanded the methodological system of three-dimensional drought identification, existing approaches still require optimization in capturing the spatial heterogeneity characteristics of droughts.
This study proposes a three-dimensional drought identification method considering spatial autocorrelation and anisotropy, which optimizes the spatiotemporal continuity characterization of drought events through dynamic multi-directional distance thresholds. Employing monthly precipitation data from ERA5 reanalysis and the CMIP6 multi-model ensemble mean (MEM), we employ the Standardized Precipitation Index (SPI) to identify large-scale drought events across historical (1961–2010) and future periods (2031–2080, encompassing SSP2-4.5 medium- and SSP5-8.5 high-emission scenarios), and analyze their spatiotemporal characteristics and migration patterns.
The structure of this paper is organized as follows: Section 2 presents the study area and datasets, including ERA5 and CMIP6. Section 3 details the 3D drought identification method with refinements and the framework for constructing drought characterization indices. Section 4 analyzes the spatiotemporal evolution and propagation patterns of drought characteristics under multiple scenarios, comparing historical and future trends. Section 5 discusses methodological sensitivity, result validity, and critically examines limitations and optimization strategies. Section 6 summarizes core findings, highlights scientific contributions and practical implications, and outlines future research directions.

2. Materials

2.1. Study Area

The study area is 18–54° N and 73–136° E, including mainland China. China can be divided into nine major watershed areas, mainly including the SongLiao River Basin, the Haihe River Basin, the Huaihe River Basin, the Yellow River Basin, the Yangtze River Basin, the Pearl River Basin, the Southeast Basin, the Southwest Basin, and the Continental Basin (Figure 1). These cover most of the geographic regions of China, with rich natural resources and diverse climatic characteristics, and are of great significance to China’s economic and social development. Watershed zoning data of China were obtained from the Resource and Environmental Science and Data Platform (https://www.resdc.cn/Default.aspx) (accessed on 10 October 2024).

2.2. Data Resources

This study employs the precipitation dataset from the ECMWF’s ERA5 (European Centre for Medium-Range Weather Forecasts, Reading, UK) (https://cds.climate.copernicus.eu) (accessed on 20 October 2024) reanalysis product (0.25° resolution, 1961–2010), which is generated through a 4D-Var data assimilation system that integrates satellite remote sensing, ground observations, and numerical model outputs [40]. The applicability of ERA5 data in China has been evaluated by Jiao et al. [41] using national gridded ground meteorological station observations, revealing that ERA5 effectively captures the observed annual and seasonal precipitation patterns in China. Similar conclusions regarding ERA5’s ability to reproduce observed precipitation variability were reached by Lei et al. [42] and Huang et al. [43].
This study is based on climate simulation data from the Sixth Coupled Model Intercomparison Project (CMIP6) to predict large-scale meteorological drought events in the future period of 2031–2080. We conducted experiments using the global climate model (GCM) dataset released by Thrasher et al. [44], with a resolution of 0.25° × 0.25° (available at https://github.com/bthrasher/daily_BCSD) (accessed on 20 October 2024). The dataset employs bias correction methods such as quantile mapping and distribution adjustment to optimize the outputs of raw climate models. Through grid-based and seasonal statistical adjustments, the dataset effectively reduces multi-model ensemble uncertainties, providing a technical foundation for high-resolution climate risk assessments.
Our research focuses on two emission scenarios: the intermediate scenario (SSP2-4.5) and the high-emission scenario (SSP5-8.5). These scenarios utilize 34 GCMs (numbered 1 to 34) and 35 GCMs (numbered 1 to 35), respectively. Detailed information about the models used is provided in Table S1 of Supporting Information S1. To ensure the accuracy and fairness of our study, an equal-weight arithmetic mean was applied to the drought indices of each model.

3. Methods

3.1. Drought Index

The Standardized Precipitation Index (SPI) is a widely recognized and utilized metric in the field of meteorological research, particularly for monitoring and analyzing meteorological droughts. Meteorological drought is defined by a significant reduction in precipitation levels, which aligns perfectly with the original conceptual framework of the SPI.
SPI was proposed by Mckee et al. [45] in the analysis of the Colorado drought in the U.S.A. Because of its practicality, it is recommended by the World Meteorological Organization as a standard indicator for tracking meteorological droughts. The main idea of calculating SPI is to regard the precipitation obeying the skew distribution as obeying some probability density function distribution (e.g., gamma distribution), and then derive the corresponding cumulative probability function and convert the cumulative probability function to a standard normal distribution. The z-value of the standard normal distribution corresponding to the cumulative probability of the precipitation after the conversion is the value of SPI. Zhou and Liu [46] introduced the detailed calculation steps of SPI.
In mainland China, precipitation exhibits distinct seasonal characteristics [47,48], particularly in the eastern monsoon region where the alternation between rainy and dry seasons is pronounced. Therefore, the 3-month scale SPI (SPI-3) was used to characterize meteorological droughts in this study, which can well reflect the seasonal changes in meteorological droughts.

3.2. The Improved Three-Dimensional Drought Identification Method

In this study, a multi-directional dynamic threshold (C) considering spatial autocorrelation and anisotropy is adopted as the identification basis to improve two key steps in the three-dimensional drought identification method, which are two-dimensional drought patch identification and three-dimensional drought event spatiotemporal coupling. The specific procedure is as follows.

3.2.1. Two-Dimensional Drought Patch Identification

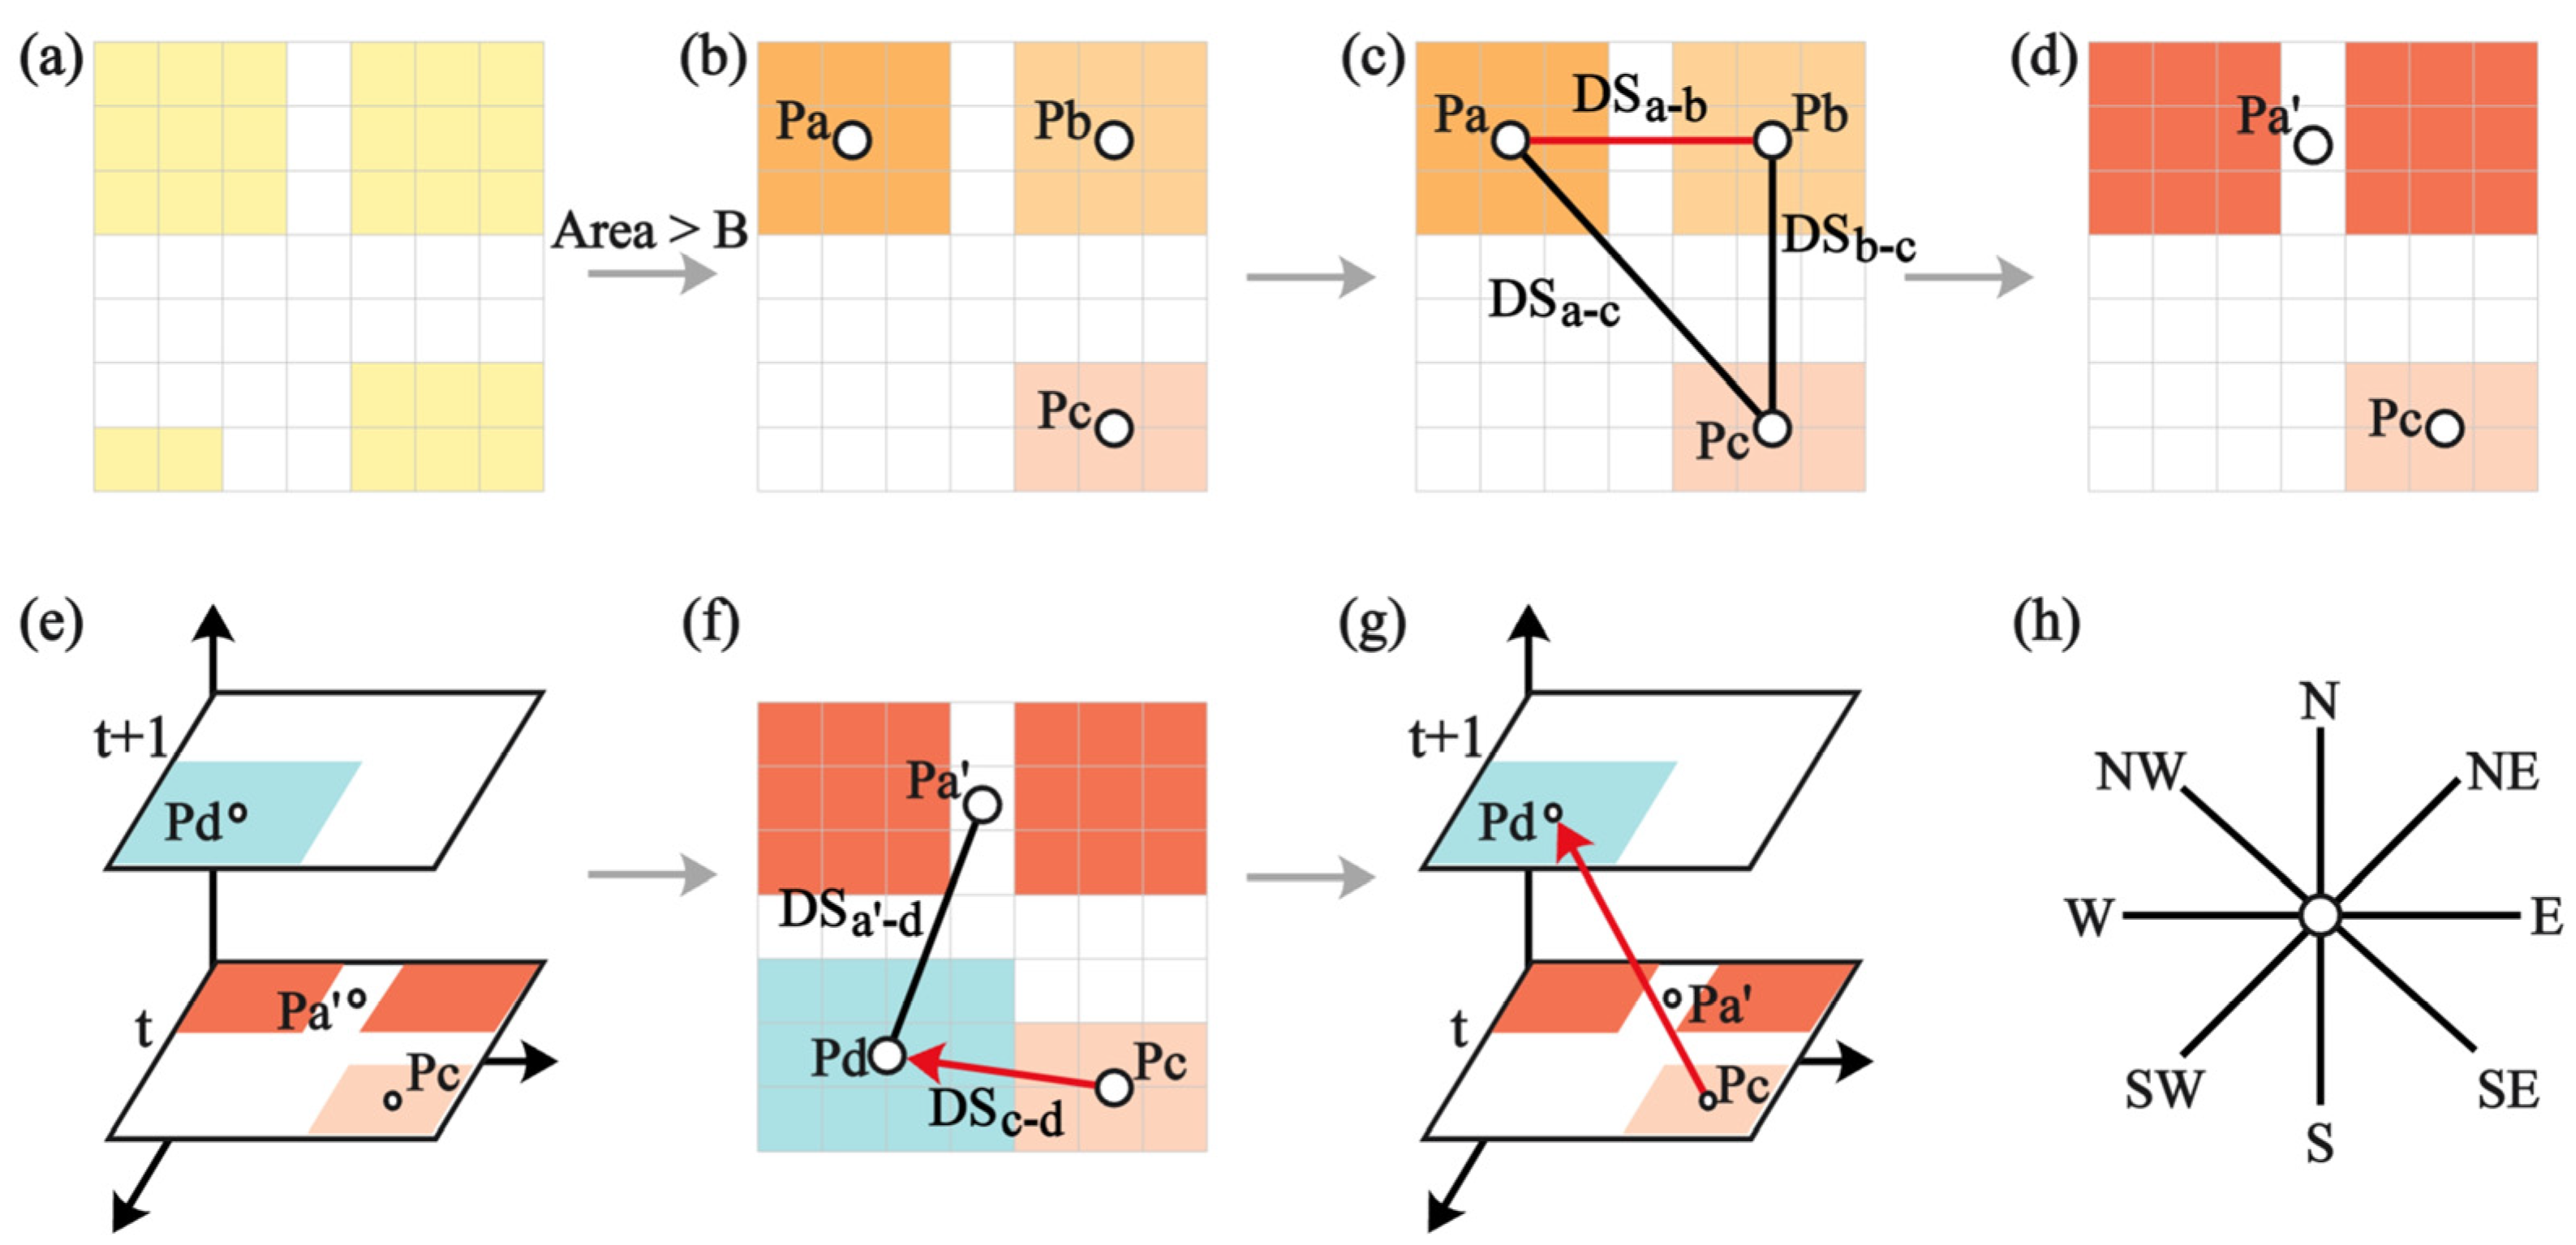
  • Drought Grid Screening: Grid cells meeting predefined drought criteria (threshold A) are extracted as initial drought regions. These regions are visually represented as yellow grids in Figure 2a.
  • Neighborhood Clustering and Area Filtering: Subsequently, adjacent drought grids are clustered through neighborhood connectivity analysis to form preliminary drought patches. Patches smaller than the area threshold (threshold B) are discarded, retaining only large-scale drought patches for subsequent processing (Figure 2b).
  • Centroid Calculation: The centroid of each retained drought patch is computed to quantify its positional characteristics. For a patch k containing γ grids, the centroid coordinates (Pa, Pb, Pc) are derived using Equations (1) and (2):
P k l o n = i = 1 γ I n d e x k i l o n i i = 1 γ I n d e x k i
  • P k l a t = i = 1 γ I n d e x k i l a t i i = 1 γ I n d e x k i
    where γ represents the grid count within the drought patch, Index(k)i denotes the drought index value of the i-th grid in patch k, with loni and lati being the respective longitude and latitude coordinates.
4.
Spatial Relationship Evaluation and Patch Merging: In this final step, the relative positions of drought patches are analyzed using predefined directional sectors (Figure 2h). Two patches are merged if their centroid distance ( D S i j ) satisfies bidirectional dynamic thresholds ( C i / j α ) for their respective directional sectors. For instance, merging patches a and b requires the following:
D S a b C a E   and   D S a b C b W
Merged patches are assigned updated centroids, resulting in the final two-dimensional drought patches (Figure 2d).
Figure 2. Schematic diagram of the three-dimensional drought identification method. Figures (ad) show the process of two-dimensional drought patch identification, figures (eg) show the process of three-dimensional event spatiotemporal coupling, and figure (h) shows the threshold (C) of the patch center (Pi) in a certain direction (α).
Water 17 01099 g002

3.2.2. Three-Dimensional Drought Event Spatiotemporal Coupling

1.
Cross-Temporal Patch Association: Drought patches from consecutive time steps (t and t + 1) are loaded (Figure 2e), and centroid distances (e.g., D S c d ) between patches at t and t + 1 are calculated.
2.
Directional Threshold Validation: A pair of patches is assigned to the same drought event if their distance meets both directional dynamic thresholds. For instance (Figure 2f):
D S c d C c W   and   D S c d C d E
3.
Event Propagation and Termination: Qualified patches are connected via centroid trajectories (Figure 2g). The process iterates for subsequent time steps (t + 2, t + 3, etc.) until no valid connections remain, marking the end of the drought event.

3.2.3. Dynamic Threshold Configuration

This study employs the multi-directional spatial correlation length (CL) of drought calculated by Zhou et al. [49] as a dynamic distance threshold (C) to identify drought patches and events. The CL is defined as the distance at which meteorological drought significantly weakens spatially in a given direction and at a specific timescale. The calculation procedure involves the following steps (Figure 3): (1) a sliding window is iteratively applied across grid cells to quantify the number of 1–1 and 1–0 point pairs within each window; (2) spatial autocorrelation is analyzed using a semi-variogram, and the average semi-variance within each window is computed; (3) an exponential model is fitted to characterize the relationship between semi-variance and distance, with the CL corresponding to the distance at which spatial correlation exhibits significant attenuation. Subsequently, the climatological spatial scales (CSSs) are derived from the CL, with detailed methodologies provided by Zhou et al. [21]. Following the experimental findings of Zhou et al. [49], the fifth percentile CSSs value (approximated as 29.5 × 10⁴ km2) associated with the SPI-3 is adopted as the area threshold (B) in this study.

3.3. Drought Events Characterization

Large-scale meteorological drought events exhibit complex spatiotemporal evolution processes and contain rich spatiotemporal information. Referring to the basic parameters used in previous studies [34,50,51], the ones used in this paper to characterize meteorological drought events are shown below.
(1)
Duration (Dur) is the total number of months in which the drought event occurred.
(2)
Migration distance (Dis) is the sum of the distances (in degrees) of all centroids in the complete event, as shown in Equation (3).
D i s k = i = 1 d u r 1 P i + 1 P i
(3)
Displacement (Disp) is the distance between the centroid of the starting patch and the centroid of the ending patch in a drought event, as shown in Equation (4).
D i s p = P d u r P 1
(4)
Affected area (Area) is the projected area of the latitude and longitude surfaces of all patches for the complete event.
(5)
Event severity (Sev) is the sum of drought index values over all time steps divided by the product of duration and affected area, as shown in Equation (5).
S e v k = i = 1 l o n j = 1 l a t z = 1 d u r I n d e x k i , j , z A r e a × D u r
We propose a spatial migration index (SMI) to quantitatively describe the migration pattern of drought events, and the specific calculation formula is shown in Equation (6). The larger the SMI value, the more obvious the propagation characteristics of the event, namely the drought event migrates from one region to another; conversely, the smaller the SMI value is, the more obvious the characteristics of local development and evolution of the event are, namely the drought event is generated and eliminated in a certain region, and the migration range of the whole life cycle is relatively small.
S M I = 1 n k = 1 n P k P ¯ 2
where n is the number of patches in a drought event, Pk is the centroid of patch k, p ¯ is the centroid of the complete event, and the centroid calculation formula is shown in Equations (1) and (2).

4. Results

The historical and two future scenarios show large differences in the number and characteristics of large-scale meteorological drought events. A total of 218 drought events were identified in the historical period (1961–2010) based on the improved three-dimensional drought identification method, with the longest duration of 18 months. The MEM results of the two future scenarios showed that the medium emission scenario (SSP2-4.5) identified a total of 60 drought events, of which the longest duration was 8 months. The high-emission scenario (SSP5-8.5) identified a total of 68 drought events, of which the longest duration was 8 months. The number of drought events in each of the independent models ranged from 68 to 107 under the SSP2-4.5 (34 models) and SSP5-8.5 (35 models) scenarios (see Figures S1 and S2 in Supporting Information S1).

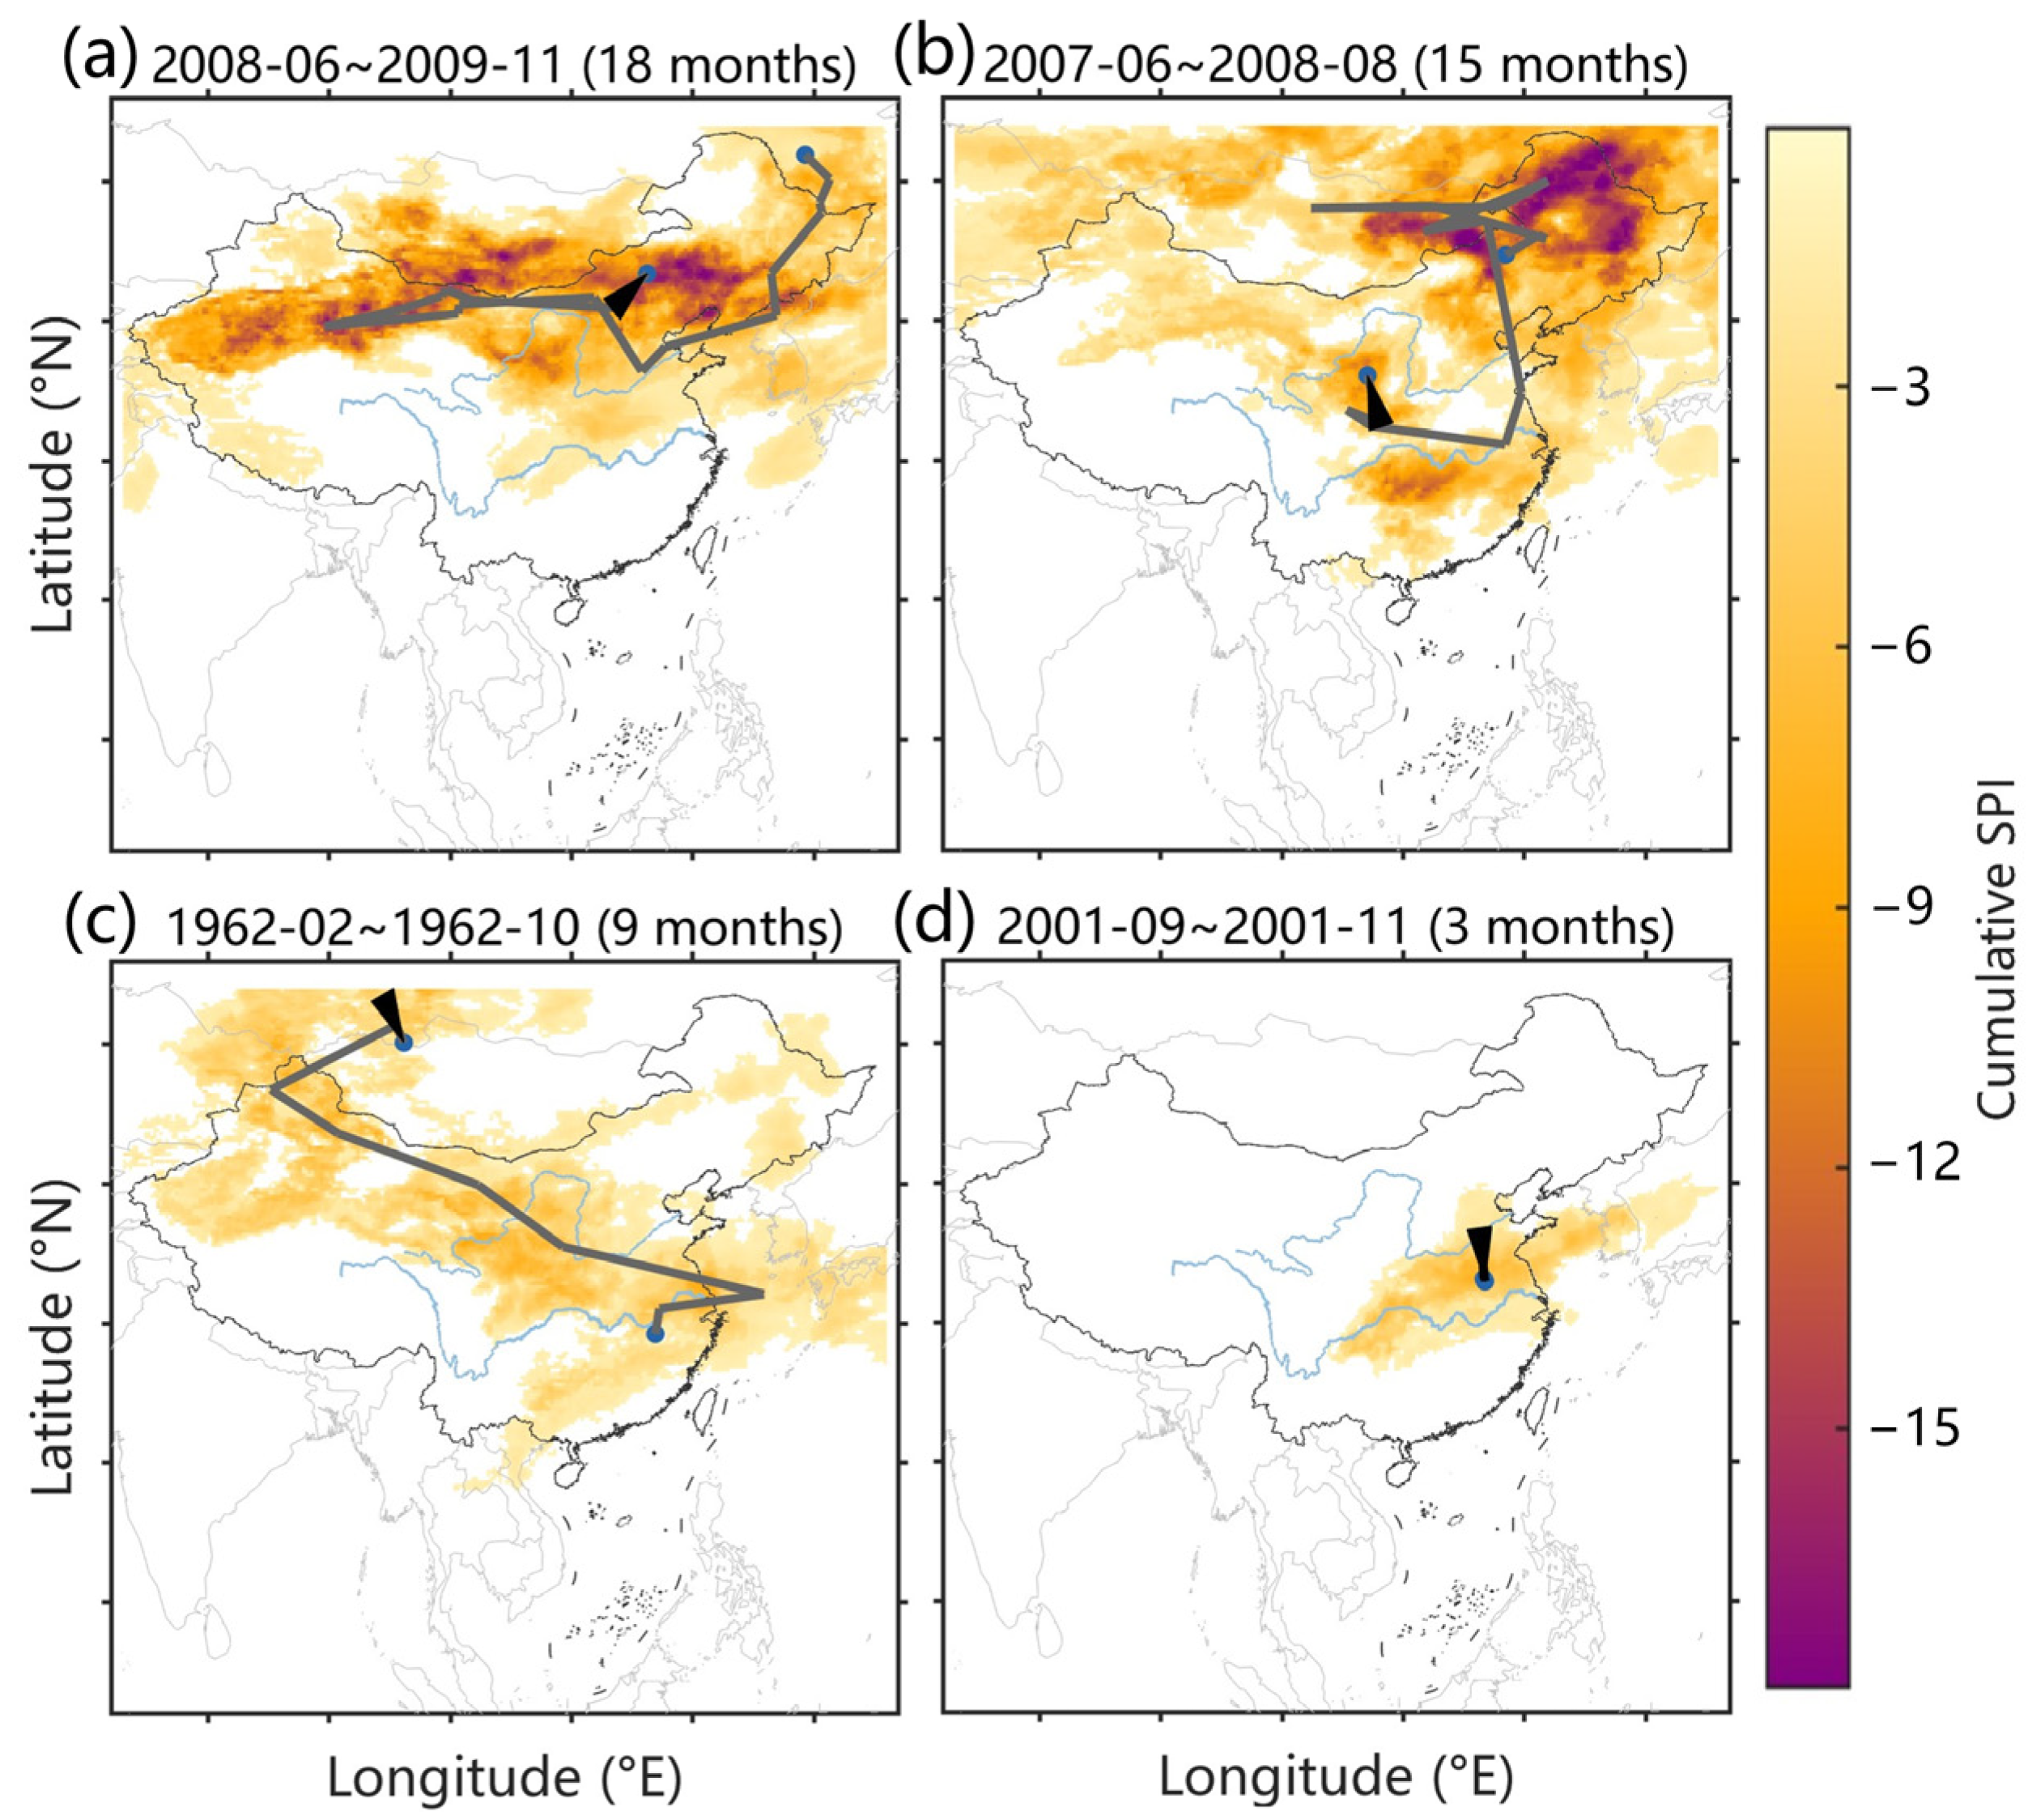
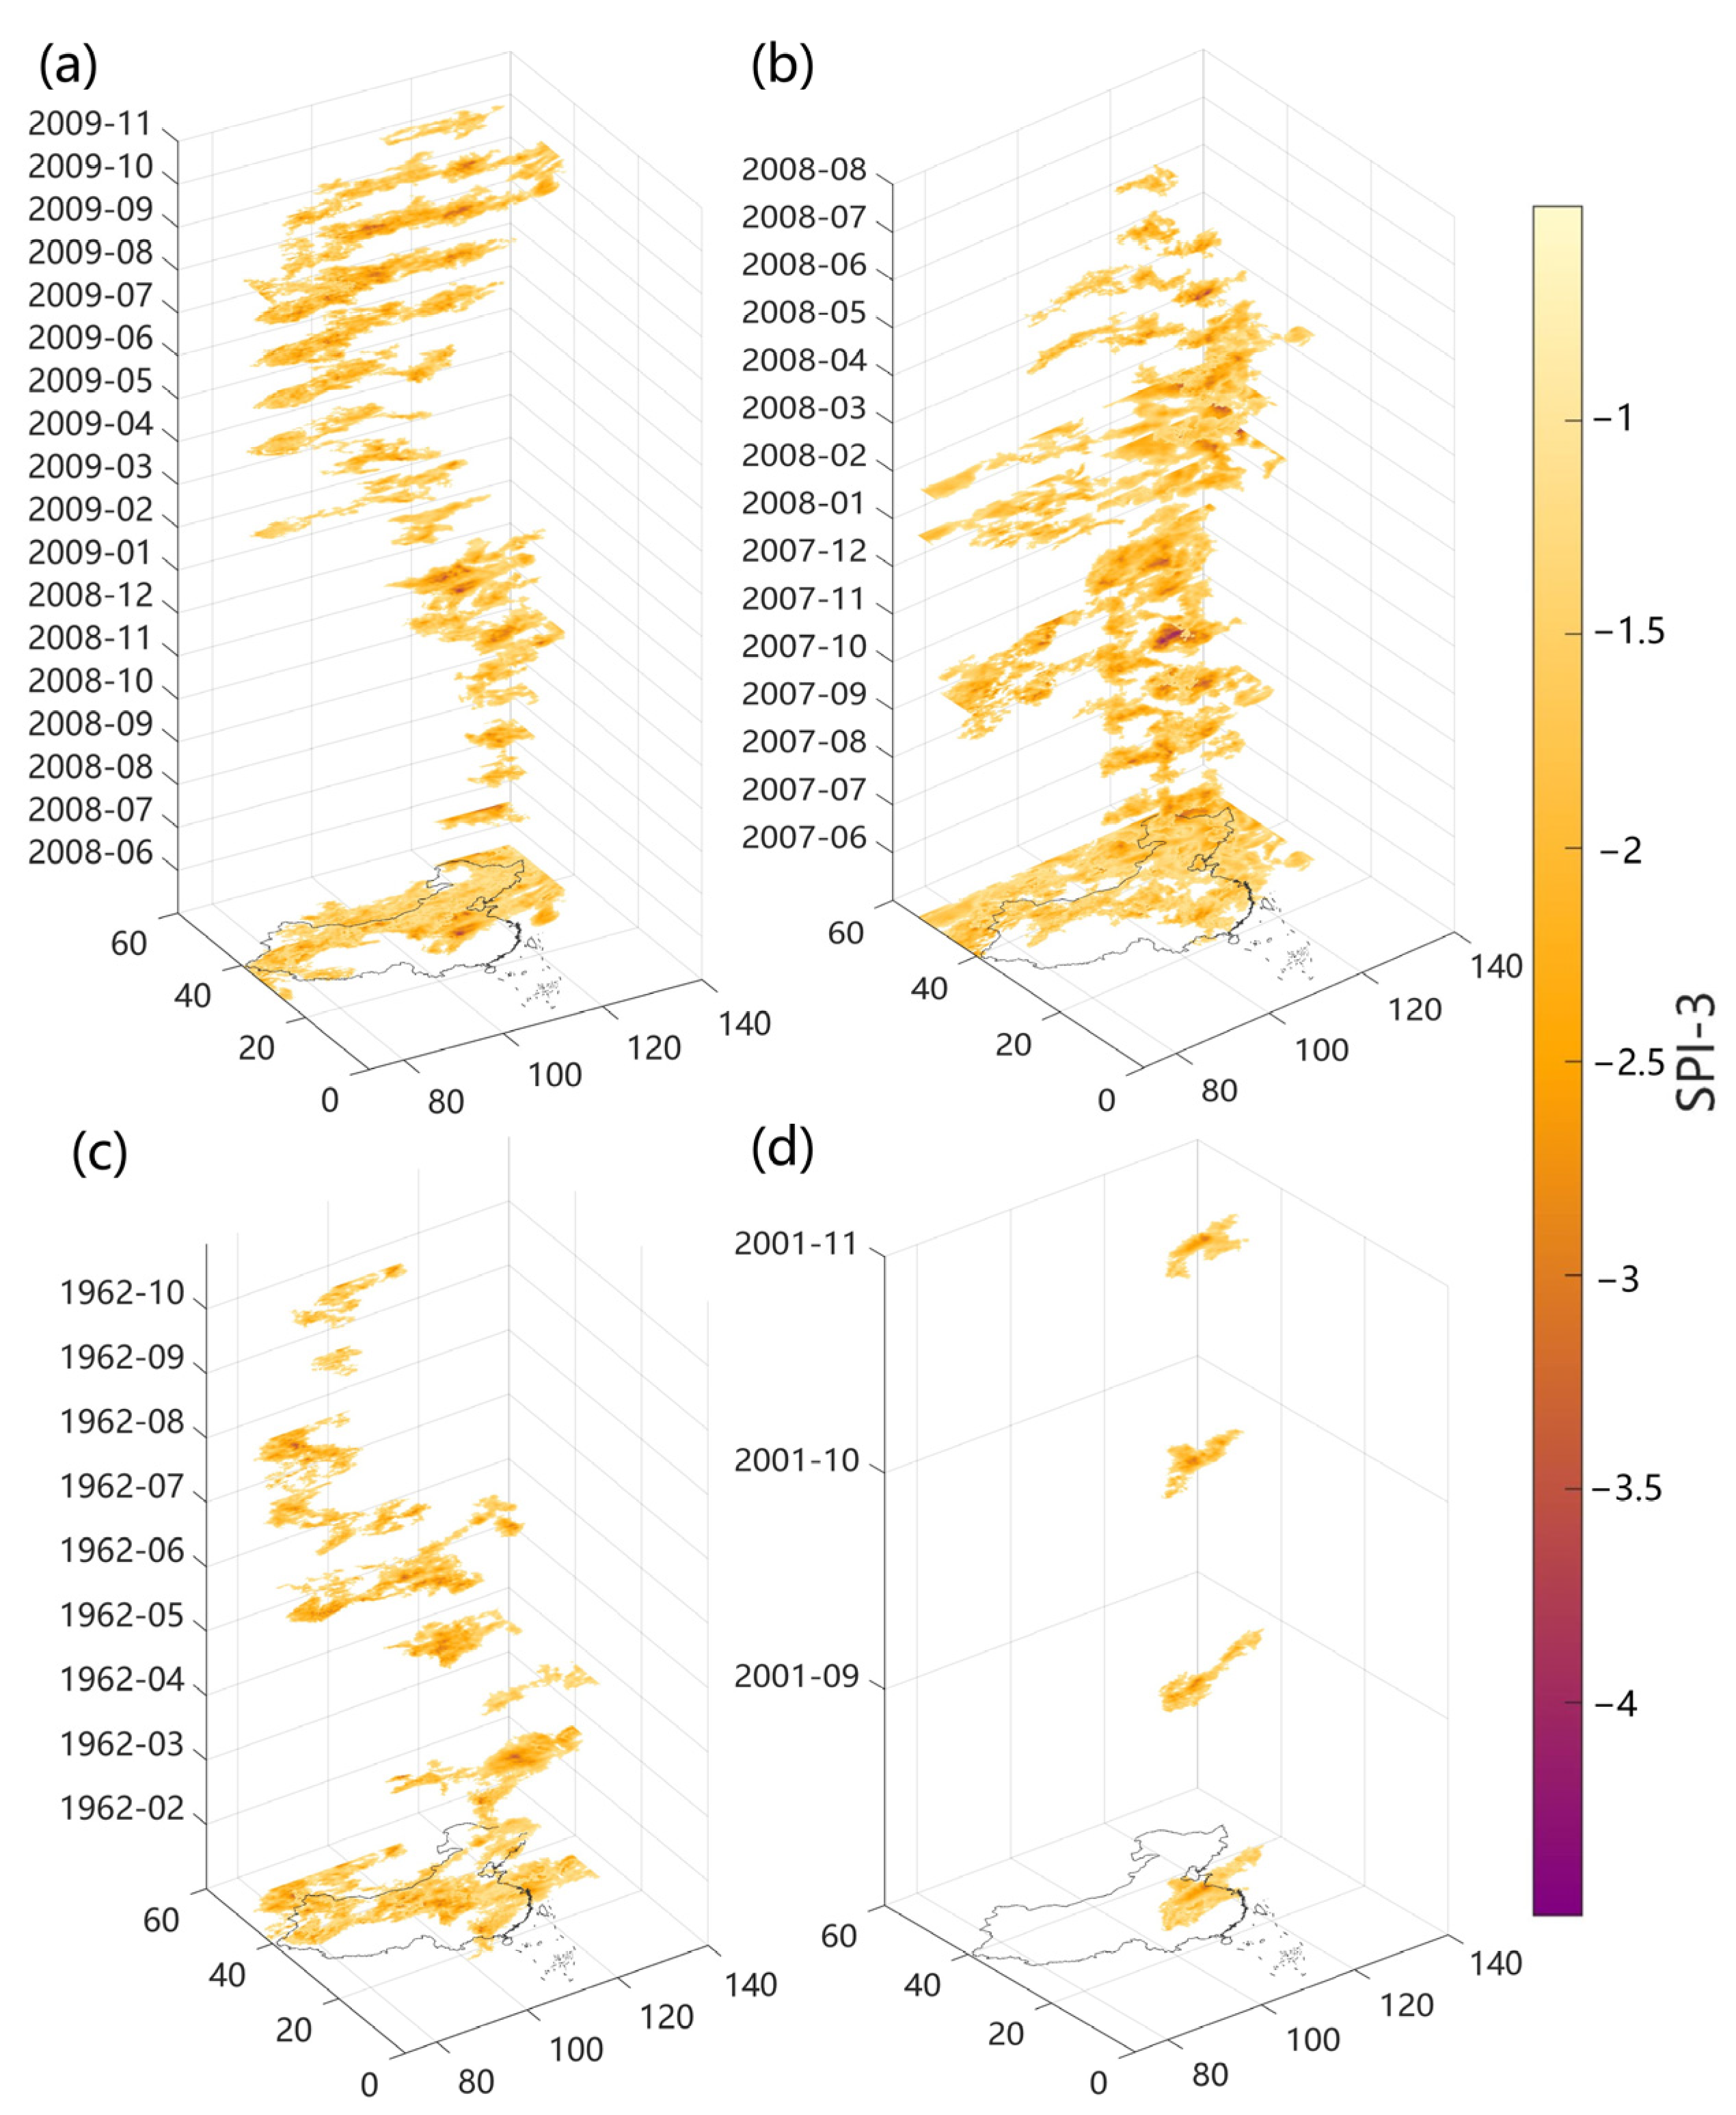
4.1. Analysis of Typical Drought Events in the Historical Period

The longest duration of the 218 drought events in the historical period was 18 months, which took place from June 2008 to November 2009 (Figure 4a and Figure 5a). This drought event migrated from the SongLiao River Basin to northern China, migrating southwards via the SongLiao River Basin to the Haihe River Basin in the early stage (8 months), then migrating continuously westwards via the Yellow River Basin to the Continental Basin (4 months), returning to migrate eastwards via the Continental Basin in the later stage (6 months), and finally ending up at the boundary between the Continental Basin and the Haihe River Basin (Figure 4a). The affected area of the whole drought event gradually grew from 63.1 × 10⁴ km2 at the beginning (1st month) to 410.9 × 10⁴ km2 (16th month), and finally shrank to 80.4 × 10⁴ km2 (Figure 5a). The drought patches showed a trend of increasing and then decreasing, with a greater impact on the eastern part of the Continental Basin and the SongLiao River Basin, and a smaller impact on the southern region.
The drought event with the largest affected area (about 1218.9 × 104 km2) of all events occurred between June 2007 and August 2008 (Figure 4b and Figure 5b). The drought event impacted all basins except the Southwest Basin. The event originated near the boundary between the Continental Basin and the SongLiao River Basin (Figure 4b), then hovered in the SongLiao River Basin for 9 months. It began to migrate southward (Yangtze River Basin, Southeast Basin, Pearl River Basin) at a later stage and finally ended in the middle reaches of the Yellow River Basin. The affected area in the whole event developed from 128.4 × 10⁴ km2 at the beginning to reach a maximum of 601.6× 10⁴ km2 in the middle period (8th month), and then gradually shrunk to 38.7 × 10⁴ km2. The drought patches roughly showed a trend of increasing and then decreasing (Figure 5b), with the greatest impact on the SongLiao River Basin.
The typical propagation event (with the maximum SMI value, SMI = 15.2) occurred from February 1962 to October 1962 (Figure 4c and Figure 5c). The drought event originated near the boundary between the Yangtze River Basin and the Southeast Basin (Figure 4c), hovered in the lower reaches of the Yangtze River Basin during the first three months and began to migrate northwestward through most of the Yellow River Basin and the Continental Basin in the fourth month, eventually ending near 96°E and 50°N, with a migration displacement of 29.4° (about 2903.8 km) for the whole event. The event reached a maximum value of 376.2 × 10⁴ km2 of affected area in the middle of its development (June 1962), mainly affecting the Yellow River Basin (Figure 5c).
The typical stationary event (with the minimum SMI value, SMI = 0.5) occurred from September 2001 to November 2001 (Figure 4d and Figure 5d). The drought event was short in duration (3 months) and occurred mainly in the Huaihe River Basin and the lower reaches of the Yangtze River Basin (Figure 4d). The displacement of the whole event was 0.79° (about 83.8 km). As shown in the three-dimensional stereogram of the event (Figure 5d), the spatial location of the drought patches within the whole event did not change significantly, and their affected areas were 31.8 × 10⁴ km2, 35.0 × 10⁴ km2, and 29.8 × 10⁴ km2, respectively.
This study conducted multi-source validation of identified typical drought events using official statistical records from the China Water and Drought Disaster Bulletin and the 3D DBSCAN detection method-based dataset of extreme meteorological droughts in China constructed by Liu, et al. [30]. The results demonstrate high spatiotemporal consistency between our identified drought events and those documented in both datasets. This also confirms that the proposed drought identification method exhibits high accuracy and reliability in reconstructing historical drought evolution patterns and spatial distribution characteristics across China.

4.2. Basic Characteristics of Meteorological Drought Events

We have presented the basic characteristics of meteorological drought events for the historical period and the two future scenarios (Figure 6 and Table 1). In summary, the duration, severity, migration distance, and impact area of meteorological drought events in the future period show a significant increase, which poses a serious threat to the ecosystem and human society. The results of the SMI index indicate that long-distance propagation meteorological drought events may decrease in the future. In terms of duration, the mean duration of drought events in the historical period was 4 ± 2.5 months, with most events (38.5%) lasting 3 months; the mean duration in the future period increased to 6 ± 0.5 months, with 78.3% and 72.1% of the events under the SSP2-4.5 and SSP5-8.5 scenarios, respectively, having a duration of 6 months. In terms of event severity, the severity of events in the historical period was concentrated between 0.2 and 1.4, while the percentage of events with a severity greater than 1.4 exceeded 95% in both future scenarios. In terms of migration distance, 57.8% of the drought events in the historical period had a migration distance of less than 15° (about 1500 km); in the future period, the migration distance of drought events was mainly concentrated in the range of 15–20° (about 1500–2000 km), and such events accounted for 55% and 61.8% of the events under the SSP2-4.5 and SSP5-8.5 scenarios, respectively. In terms of the affected area, drought events in the historical period had an affected area of less than 14 × 107 km2, while drought events in the future period had an affected area of more than 14 × 107 km2. In terms of the SMI index, the mean values of SMI in the historical and future periods are not significantly different, but there are propagation events with SMI > 8 in the historical period, and such events are not identified under both SSP2-4.5 and SSP5-8.5 scenarios.

4.3. Spatiotemporal Characteristics of Meteorological Drought Events

To better reflect the actual spatial distribution range and impact area of drought events, the trajectory results are recorded on a grid of 1° × 1°. The migration trajectories of all drought events in the historical period and the two future scenarios were counted, and the results are shown in Figure 7. In the historical period (Figure 7a), the hotspot areas of the migration trajectories of drought events are mainly concentrated in the middle and upper reaches of the Yangtze River Basin. Overall, more drought events occur in the Yangtze River Basin than in the Yellow River Basin, and more drought events occur in southern China than in northern China. Under the SSP2-4.5 and SSP5-8.5 scenarios (Figure 7b,c), the hotspot areas of the migration trajectories of drought events are mainly concentrated in the upper reaches of the Yellow River Basin, and a few migration trajectories of drought events pass through the Pearl River Basin, Yangtze River Basin, and Continental Basin.
Figure 8 illustrates the temporal pattern of the evolution of drought events in the historical and future periods, and Figure 8a shows the seasonal division. In particular, meteorological drought events in the historical period were distributed more evenly in the interdecadal (Figure 8b), with 89.4% of the events having a severity below 1.0. Additionally, a slightly larger number of meteorological drought events occurred in the summer and autumn, accounting for approximately 56.9% of the total. However, 90% (SSP2-4.5) and 94.1% (SSP5-8.5) of the events under the two future scenarios were mainly concentrated in the range of 1.5–2.0, and a small proportion of drought events under the SSP2-4.5 scenario even exceeded the severity of 2.0. The interdecadal distribution of meteorological drought events for the future period was relatively even (Figure 8c,d), but there were significant seasonal differences, with 96.3% and 95.0% of meteorological drought events occurring in spring and summer under the SSP2-4.5 and SSP5-8.5 scenarios, respectively.
Furthermore, the meteorological drought events under the SSP2-4.5 (34 models) and SSP5-8.5 (35 models) scenarios were calculated individually for each independent model in this paper, and the temporal characteristics were characterized (see Figures S1 and S2 in Supporting Information S1). Among the 34 GCMs under the SSP2-4.5 scenario, 33 models show that more than 50% of meteorological drought events occur in spring and summer, and the results of 29 models indicate that the proportion of drought events in spring and summer is more than 70%. In the SSP5-8.5 scenario (35 GCMs), 34 models showed that more than 50% of meteorological drought events occurred in spring and summer, and 31 models accounted for more than 70% of such events. More than 90% of the GCMs demonstrate good agreement in the temporal characteristics of large-scale meteorological drought events. (Figures S1 and S2 in Supporting Information S1).

4.4. Migration Characteristics of Meteorological Drought Events

We categorize events into immigration events and emigration events from a basin perspective. To illustrate, for basin A, a drought event that ends within basin A is called an immigration event, which consists of both migration from other basins and its self-migration; a drought event that occurs in basin A but ends in other basins is called an emigration drought event.
Regarding the spatial migration patterns of large-scale meteorological droughts, the historical period and the two future scenarios show large differences in the type and proportion of migration patterns. In the historical period, the Continental, SongLiao, Southwest, and Yellow River Basins were mainly dominated by immigration events (Figure 9a), accounting for 71.4%, 83.3%, 75%, and 71.4%, respectively. In the other basins, the proportion of the two types of drought events was relatively balanced. Under the SSP2-4.5 scenario (Figure 9b), 98.1% of the meteorological drought events in the Yellow River Basin were immigration events, with the largest number of events coming from the Yangtze River Basin, accounting for about 60%. The Yangtze River Basin, the Southwest Basin, and the Continental Basin are mainly dominated by emigration events, of which 88.6%, 83.3%, and 71.4%, respectively, emigrate to the Yellow River Basin. Under the SSP5-8.5 scenario (Figure 9c), similar to the SSP2-4.5 scenario, the Yellow River Basin is dominated by immigration events, with the proportion of events from the Yangtze River Basin, the Southwest Basin, and the Continental Basin being 44.4%, 35.2%, and 13.0%, respectively.
Figure 9d–f shows the frequency and duration distribution of meteorological drought events migrating in eight directions. About 39.9% of the meteorological drought events migrated east–west during the historical period (Figure 9d), with more events migrating west than east, and the duration of meteorological drought events migrating southwest was longer. Under the SSP2-4.5 scenario (Figure 9e), meteorological drought events are dominated by northeastward migration, accounting for about 33% of the total. Under the SSP5-8.5 scenario (Figure 9f), the northeastward migration is more pronounced, with this type of event increasing to 38%. The duration of meteorological drought events does not differ significantly in direction under the two future scenarios, both being around 6 to 8 months.

5. Discussion

5.1. Sensitivity of the Methodology

This paper improves two key issues in the three-dimensional drought identification method by comparing the distances between the centroid of patches with the CL. It ensures that a unified approach is adopted in dealing with the core issues, and avoids the accumulation of errors due to the differences between different methods. In addition, the use of CL as the identification basis takes into account both spatial autocorrelation and anisotropy. Compared with traditional methods that use only the size of the overlapping area as the identification basis [31,32,33,37], the dependence on the uncertainty of the area of the drought patches is reduced, and the meteorological drought events in different climate zones are given an appropriate identification criterion.
When determining spatiotemporal continuity, the “strong constraint” condition (requiring centroid distances between two drought patches to be smaller than both directional CLs) effectively prevents extreme cases that may occur under “weak constraint” conditions. As shown in Figure 10, although the centroid distance between drought patches P1 (plateau mountain climate zone) and P2 (temperate continental climate zone) is smaller than the northeast-direction CL of P1 (8.7445°), it far exceeds the southwest-direction CL of P2 (1.1841°). Weak constraints would erroneously merge these patches, whereas strong constraints successfully distinguish such uncorrelated patches. Therefore, considering potential extreme cases, this study ultimately adopts strong constraints. The identification results show strong agreement with historical large-scale meteorological drought events reported by Spinoni et al. [52], Liu et al. [30], Wen et al. [36], and Zhang et al. [20], demonstrating the method’s robustness.

5.2. Reasonableness of Identification Results

This study shows that the number of meteorological drought events in the future period may be reduced by more than 70% compared to the historical period, but their characteristics such as severity, duration, and the affected area may be significantly enhanced, leading to a further increase in drought risk. This finding is consistent with previous studies [27,53,54,55] suggesting that climate change has a profound impact on the nature of drought events. Under the SSP2-4.5 and SSP5-8.5 scenarios, the hotspots of meteorological drought events shift from the middle and upper reaches of the Yangtze River Basin to the upper reaches of the Yellow River Basin, and the Yangtze River Basin is expected to receive more precipitation. This result is consistent with the findings of Yue et al. [56] and Liu, et al. [17], and further confirms the changes in regional climate patterns. It is worth noting that the analysis based on the MEM identification results indicates that meteorological drought events in the future period may occur mainly in spring and summer. This phenomenon may be related to the differences in future precipitation projections by different GCMs, and some of the droughts in autumn and winter may be offset by the overestimation of precipitation by some models [55]. Notably, future drought events exhibit a distinct northeastward migration pattern, which may be linked to the directions of water vapor sources and the northward shift of the Western Pacific Subtropical High (WPSH) [57,58].

5.3. Limitations

Although the identification results based on the CMIP6 multi-model ensemble mean (MEM) in this study show good consistency with independent models (see Tables S2 and S3 in Supporting Information S1), uncertainties remain in characterizing the evolution of future meteorological drought events: (1) Significant disparities in model structures, parameter configurations, and boundary conditions among different global climate models (GCMs) lead to substantial divergence in precipitation projections [59,60,61]. Notably, no single model has demonstrated reliable capability in simulating the spatiotemporal patterns of future precipitation over China [56,62]. (2) This study innovatively introduced the drought spatial correlation length (CL) to establish a spatiotemporal continuity framework for drought characterization. However, the CL calculation relies on historical precipitation data [49], disregarding significant changes in precipitation regimes over China under global warming [48,63]. The value of historical CL under future scenarios may therefore be constrained. Moreover, the current CL computation method employs a 0–1 binarization process that fails to capture drought intensity dynamics, potentially compromising identification accuracy.
To address these limitations, future studies should prioritize: (1) reducing climate model uncertainties through dynamic multi-model ensemble methods with varying weights and quantifying precipitation projection uncertainties based on multi-source data; (2) systematically evaluating the spatiotemporal evolution of drought correlation length (CL) under climate change scenarios and developing an intensity-integrated CL framework to enhance drought identification reliability.

6. Conclusions

This study proposes an improved 3D drought identification method based on multi-directional dynamic threshold CL to identify large-scale meteorological droughts in China during both the historical (1961–2010) and future (2031–2080, SSP2-4.5/SSP5-8.5) periods. The main conclusions are as follows:
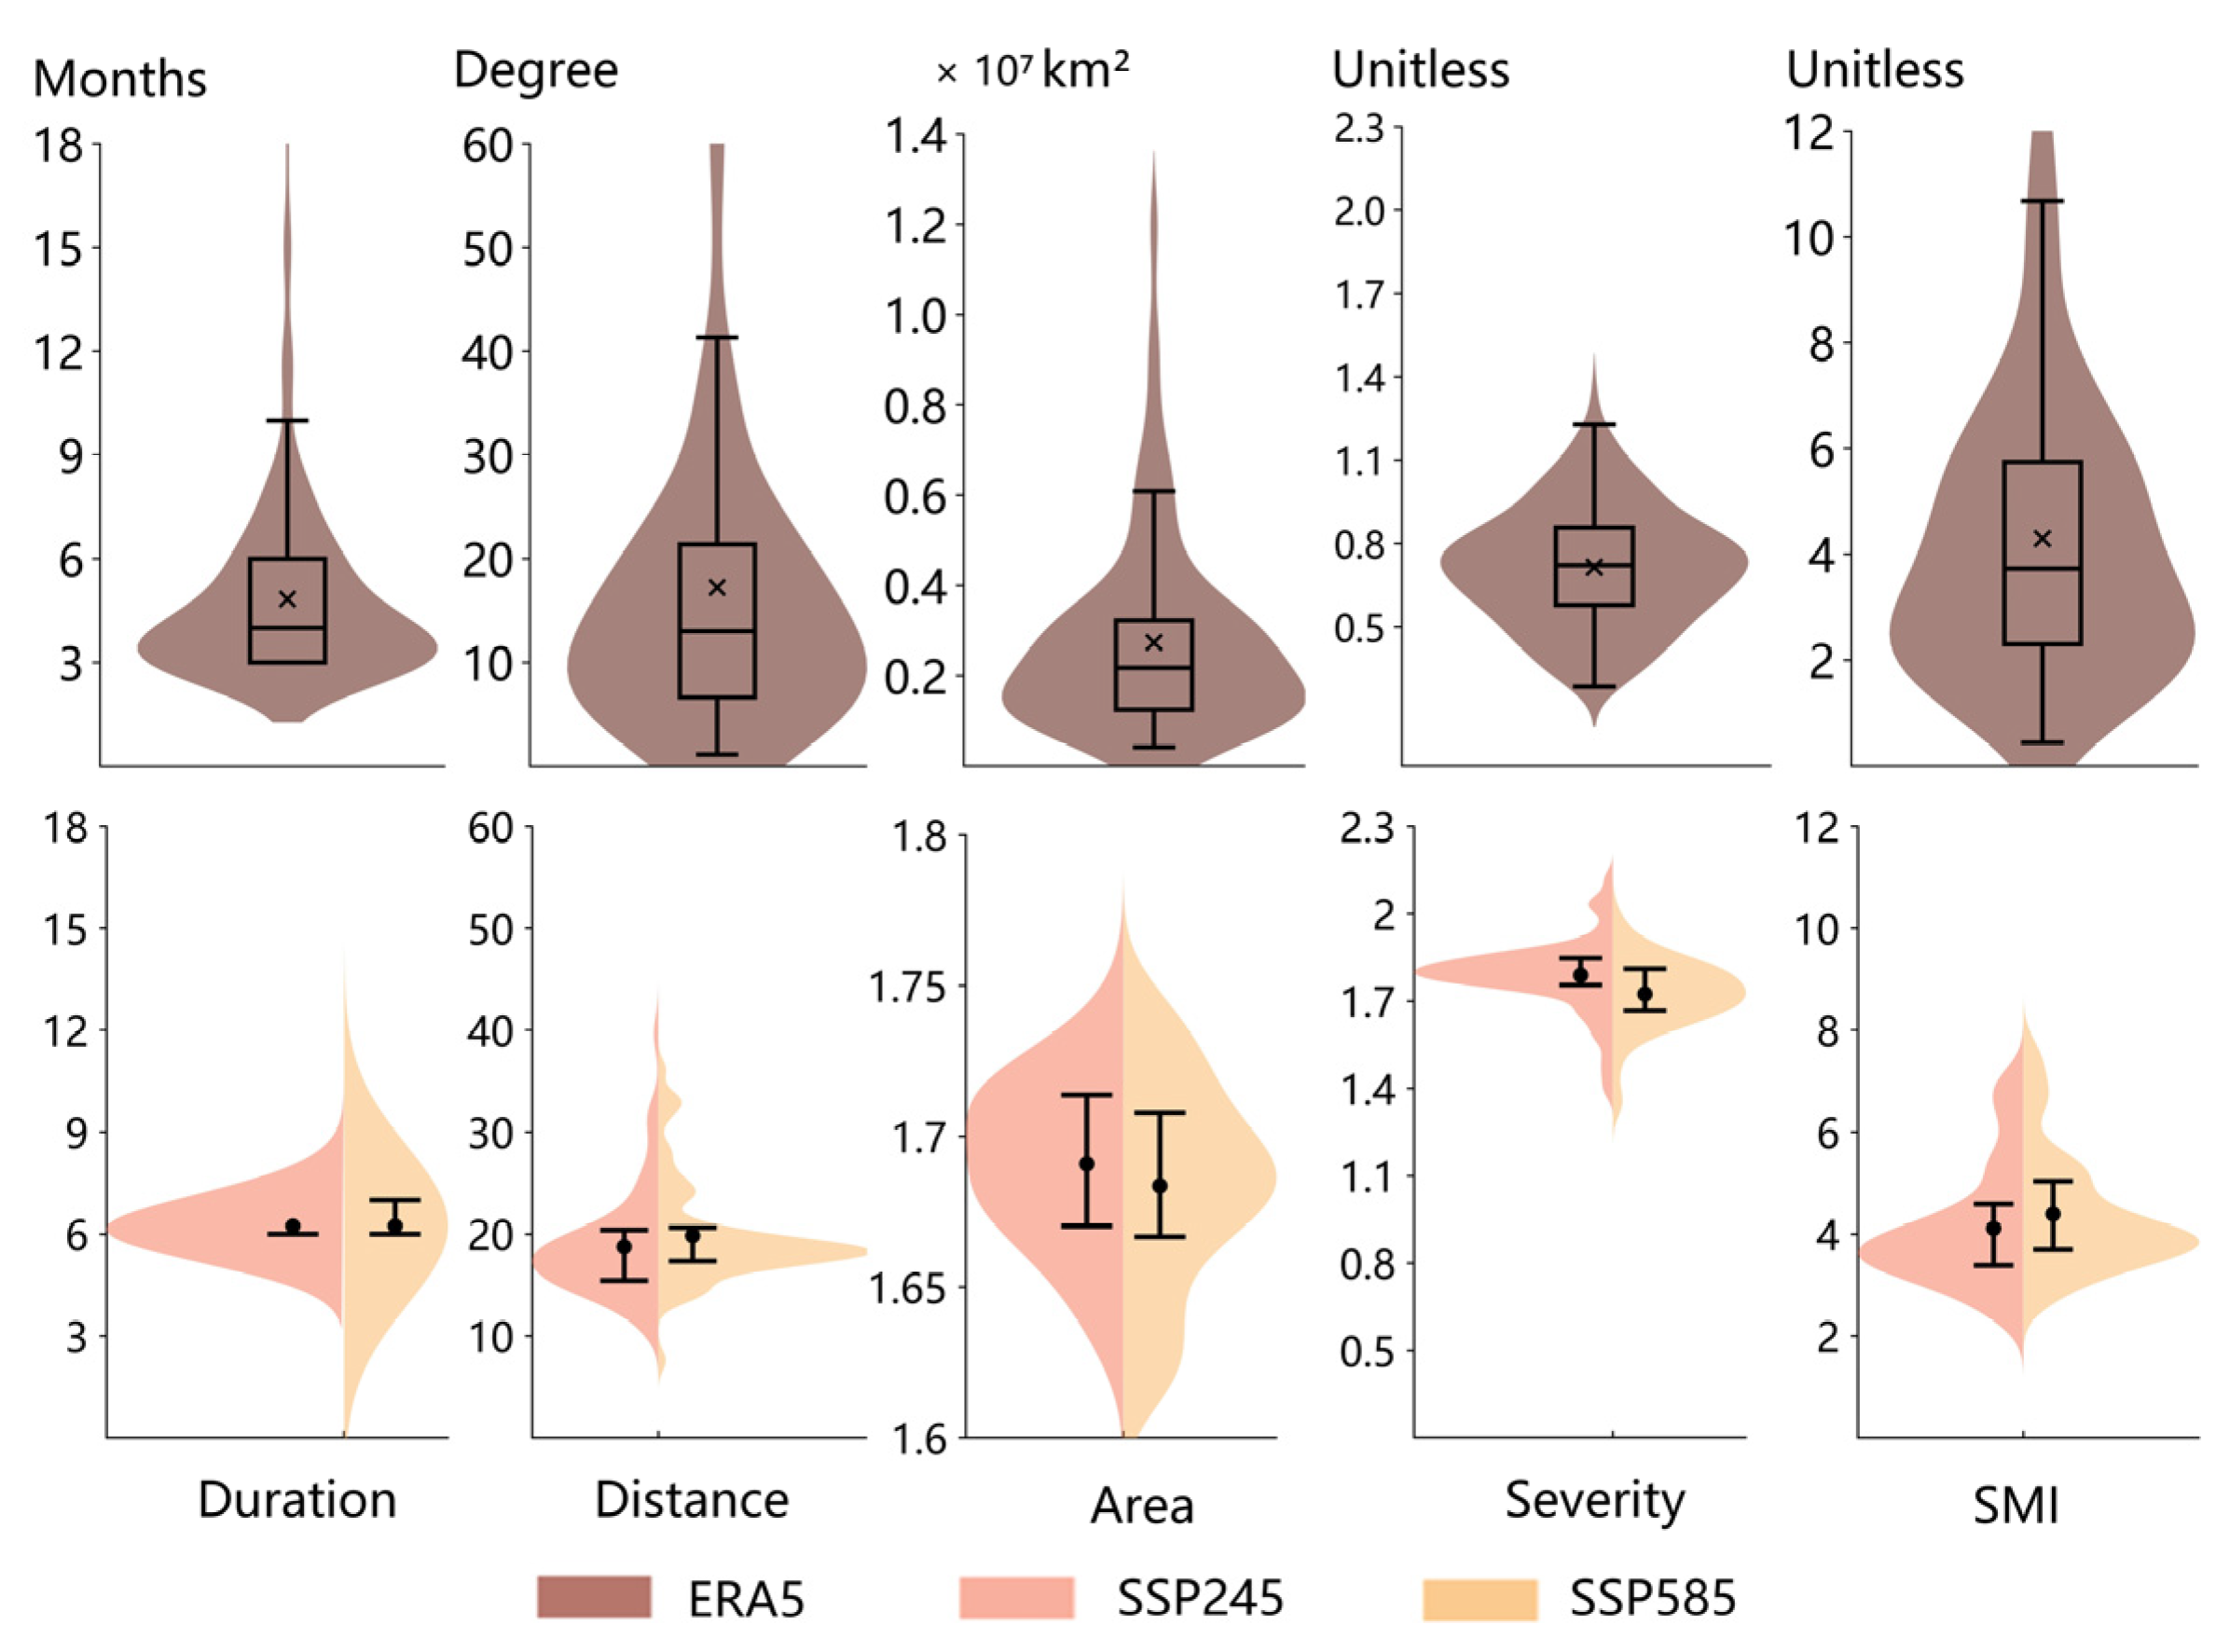
  • Future meteorological drought events may occur less frequently but have a greater impact. Historically, 218 drought events occurred, with an average duration of 4 ± 2.5 months. Most events had a severity between 0.2 and 1.4. Under the SSP2-4.5 and SSP5-8.5 scenarios, the number of drought events is expected to be 60 and 68, respectively. Their duration may increase to about 6 ± 0.5 months, and over 95% of the events will have a severity greater than 1.4.
  • Meteorological drought events in the future will mainly occur in spring and summer. Historically, drought events were evenly distributed across seasons. However, under both SSP2-4.5 and SSP5-8.5 scenarios, more than 95% of events are projected to occur in spring and summer. This pattern is strongly supported by 85.3% of GCMs under SSP2-4.5 and 88.6% under SSP5-8.5.
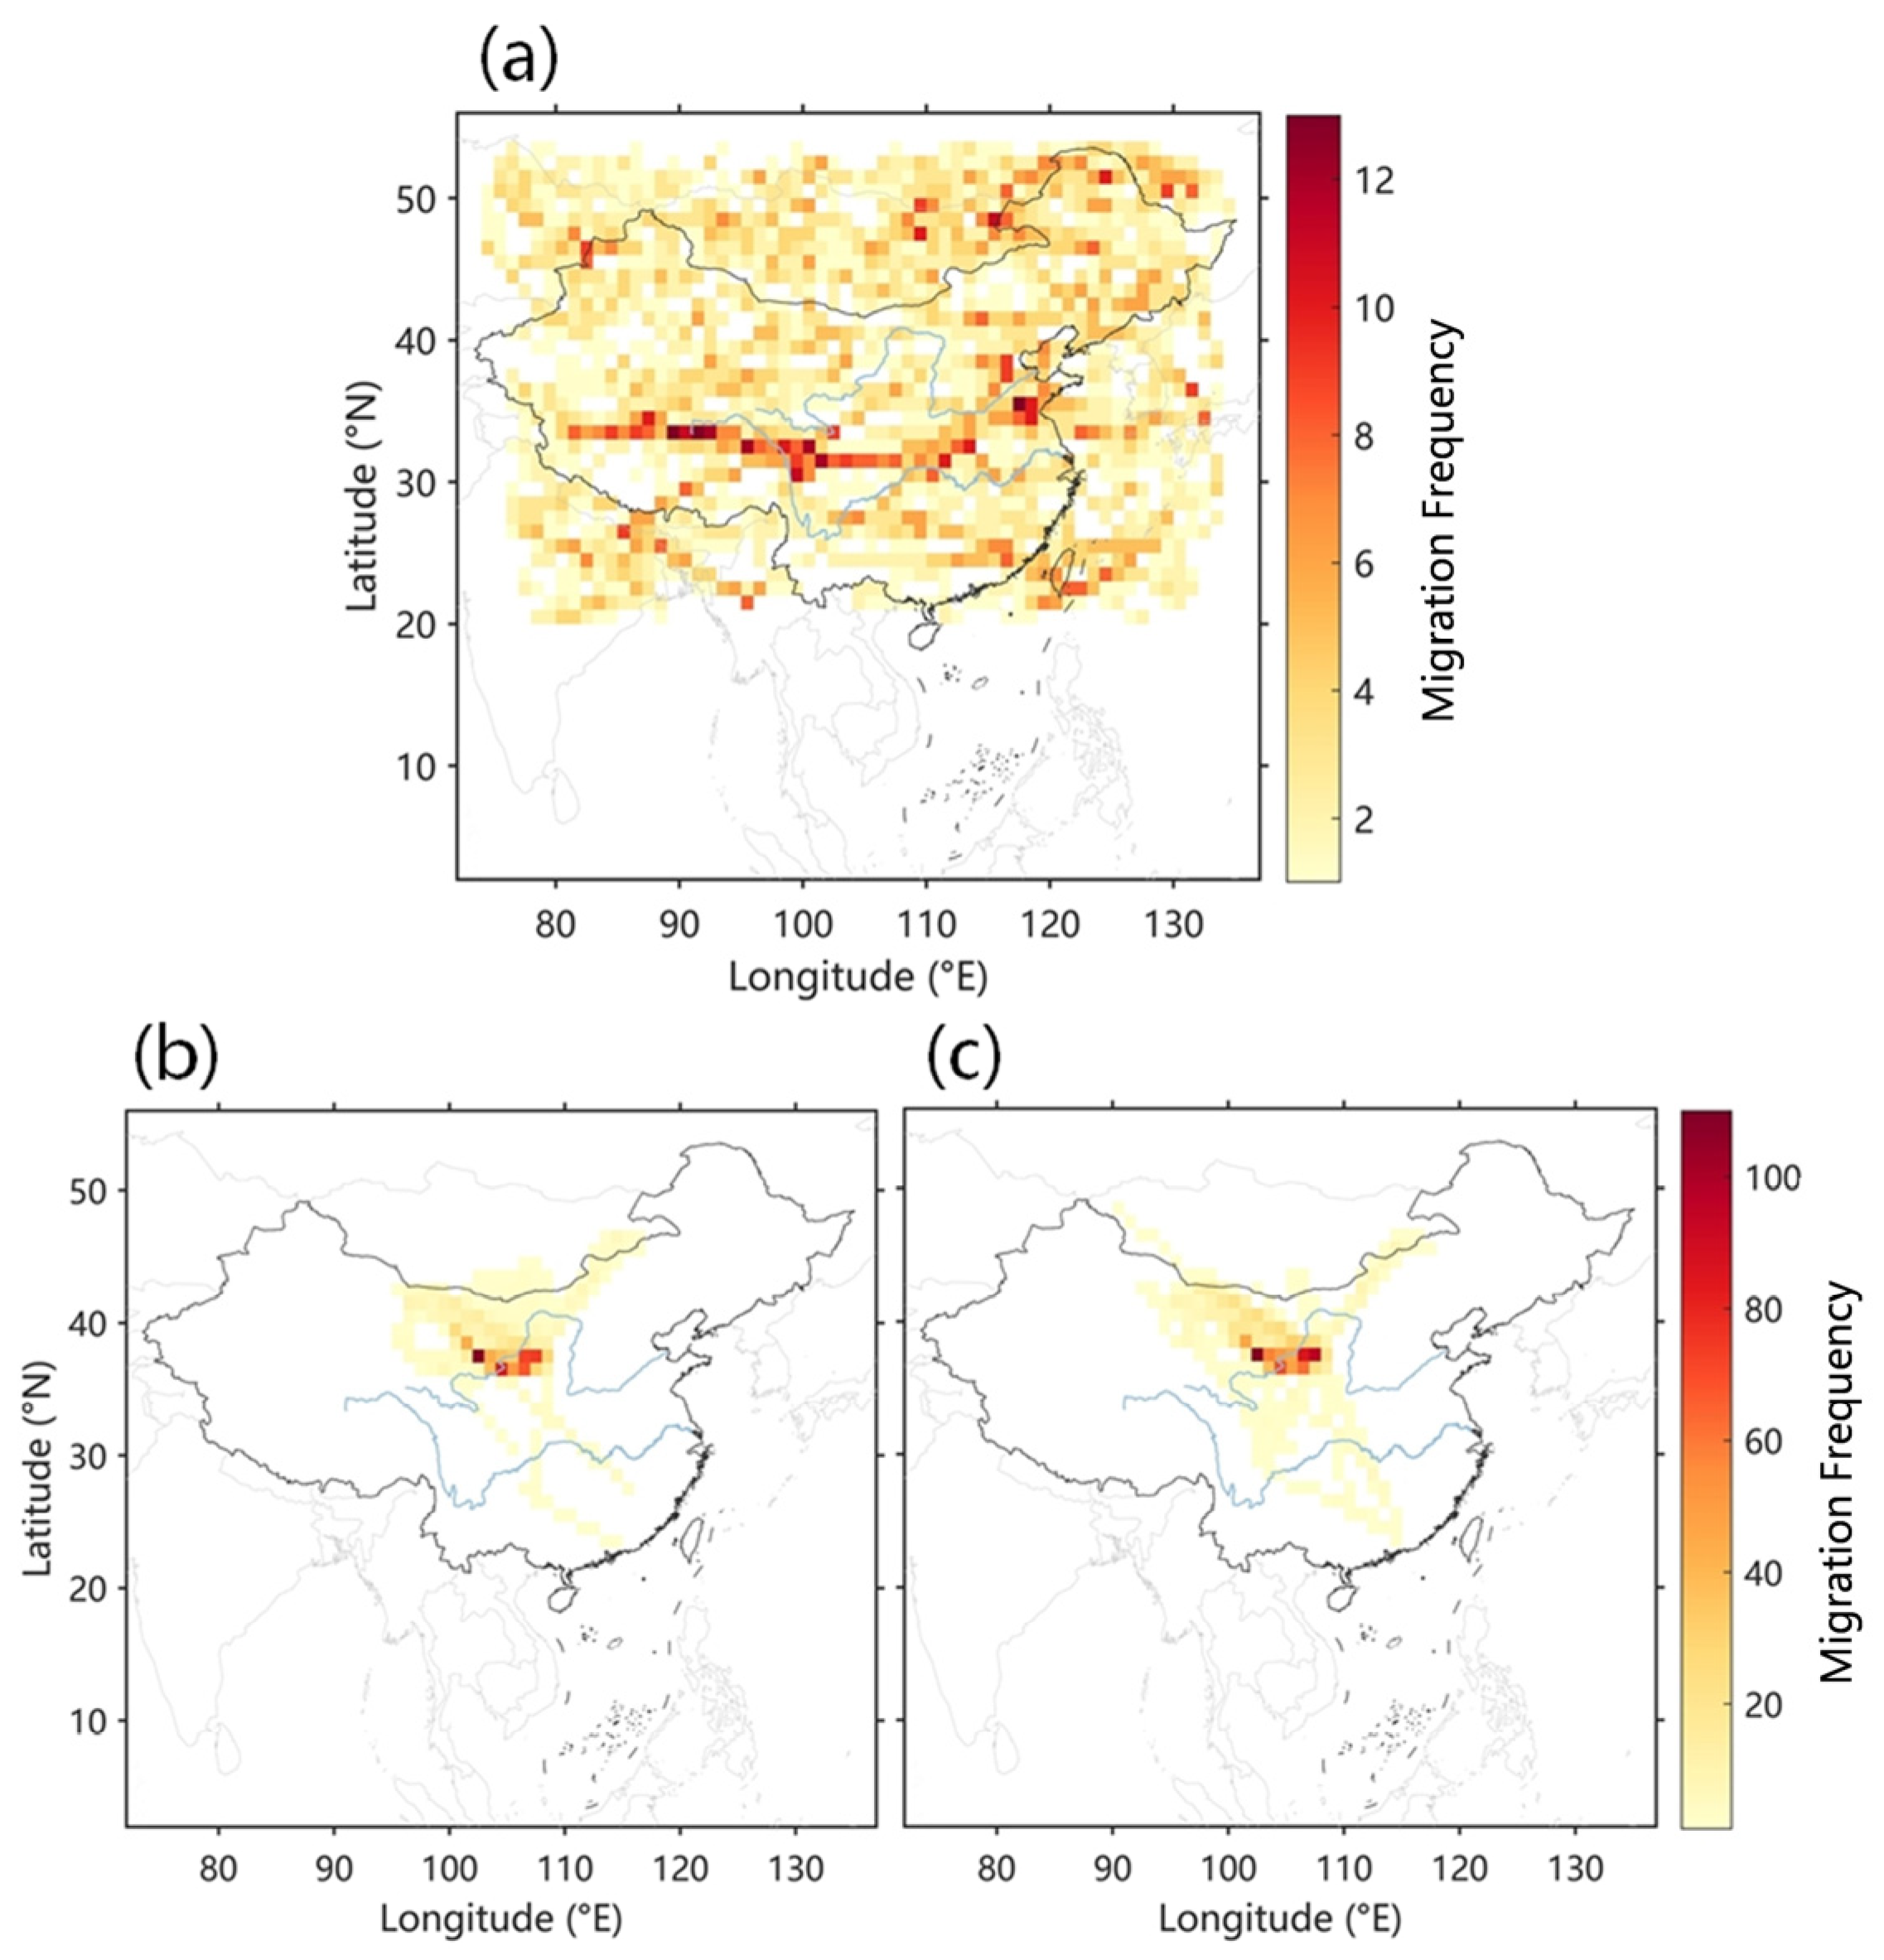
  • The upper reaches of the Yellow River Basin are likely to face an increased risk of drought in the future. Historically, drought hotspots were concentrated in the middle and upper reaches of the Yangtze River Basin. In the future, these hotspots may shift to the upper Yellow River Basin, increasing the drought risk in this region.
  • The migration of meteorological drought events is expected to shift significantly towards the northeast. Historically, 39.9% of events migrated east–west, with over 20% moving westward. Under SSP2-4.5 and SSP5-8.5, northeastward migration will become more dominant, accounting for 33% and 38% of total events, respectively.
The increasing severity of droughts urgently necessitates the development of adaptive water resource management systems. Enhancing cross-regional coordination mechanisms within the Yellow River Basin and incorporating drought migration patterns into resilient infrastructure planning must be prioritized. This study establishes the groundwork for understanding drought spatiotemporal characteristics. Future research will focus on investigating drought propagation mechanisms and their interactions with land–atmosphere feedback processes.

Supplementary Materials

The following supporting information can be downloaded at: https://www.mdpi.com/article/10.3390/w17071099/s1, Table S1: List of the CMIP6 models used; Figure S1: Temporal characteristics of individual model identification results under the SSP2-4.5 scenario; Figure S2: Temporal characteristics of individual model identification results under the SSP5-8.5 scenario; Table S2: Characteristic Values of Drought Events Identified by All Models Under the SSP2-4.5 Scenario; Table S3: Characteristic Values of Drought Events Identified by All Models Under the SSP5-8.5 Scenario.

Author Contributions

Conceptualization, H.Z. and S.W.; methodology, S.W. and H.Z.; software, S.W. and X.C.; validation, J.H., Y.Y. and L.J.; writing—original draft preparation, S.W.; writing—review and editing, S.W. and H.Z.; supervision, H.Z. and J.H.; funding acquisition, H.Z. All authors have read and agreed to the published version of the manuscript.

Funding

This research was funded by the National Natural Science Foundation of China (Nos. 42001018, 52079101, and 42171415) and the Science and Technology Department of Hubei Province (2024AFB741).

Data Availability Statement

The ERA5 and CMIP6 model data used in this paper are publicly available. The ERA5 data were obtained from the online website https://cds.climate.copernicus.eu (accessed on 20 October 2024). The CMIP6 model data can be downloaded from https://github.com/bthrasher/daily_BCSD ( accessed on 20 October 2024), and specific model information is listed in Table S1 in Supporting Information S1.

Acknowledgments

We thank the free open-access datasets used in this study. ERA5 reanalysis data from the European Center for Medium-Range Weather Forecasts (ECMWF). CMIP6 global climate model data from Thrasher, et al.

Conflicts of Interest

The authors declare no conflicts of interest.

References

  1. Hasegawa, T.; Sakurai, G.; Fujimori, S.; Takahashi, K.; Hijioka, Y.; Masui, T. Extreme climate events increase risk of global food insecurity and adaptation needs. Nat. Food 2021, 2, 587–595. [Google Scholar] [CrossRef] [PubMed]
  2. Hoegh-Guldberg, O.; Jacob, D.; Taylor, M.; Bolaos, T.G.; Bindi, M.; Brown, S.; Camilloni, I.A.; Diedhiou, A.; Djalante, R.; Ebi, K. The human imperative of stabilizing global climate change at 1.5°C. Science 2019, 365, eaaw6974. [Google Scholar] [CrossRef] [PubMed]
  3. Yuan, X.; Wang, Y.; Ji, P.; Wu, P.; Sheffield, J.; Otkin, J.A. A global transition to flash droughts under climate change. Science 2023, 380, 187–191. [Google Scholar] [CrossRef] [PubMed]
  4. Deng, S.; Zhao, D.; Chen, Z.; Liu, L.; Zhu, Y.; Wang, K.; Gao, X.; Wu, H.; Zheng, D. Global distribution and projected variations of compound drought-extreme precipitation events. Earth’s Future 2024, 12, e2024EF004809. [Google Scholar] [CrossRef]
  5. Herrera-Estrada, J.E.; Diffenbaugh, N.S. Landfalling Droughts: Global Tracking of Moisture Deficits From the Oceans Onto Land. Water Resour. Res. 2020, 56, e2019WR026877. [Google Scholar] [CrossRef]
  6. Su, B.; Huang, J.; Fischer, T.; Wang, Y.; Kundzewicz, Z.W.; Zhai, J.; Sun, H.; Wang, A.; Zeng, X.; Wang, G. Drought losses in China might double between the 1.5 C and 2.0 C warming. Proc. Natl. Acad. Sci. USA 2018, 115, 10600–10605. [Google Scholar] [CrossRef]
  7. Dong, Z.; Liu, H.; Baiyinbaoligao; Hu, H.; Khan, M.Y.A.; Wen, J.; Chen, L.; Tian, F. Future projection of seasonal drought characteristics using CMIP6 in the Lancang-Mekong River Basin. J. Hydrol. 2022, 610, 127815. [Google Scholar] [CrossRef]
  8. Hao, Z.; Singh, V.P.; Xia, Y. Seasonal drought prediction: Advances, challenges, and future prospects. Rev. Geophys. 2018, 56, 108–141. [Google Scholar] [CrossRef]
  9. Hessl, A.E.; Anchukaitis, K.J.; Jelsema, C.; Cook, B.; Byambasuren, O.; Leland, C.; Nachin, B.; Pederson, N.; Tian, H.; Hayles, L.A. Past and future drought in Mongolia. Sci. Adv. 2018, 4, e1701832. [Google Scholar] [CrossRef]
  10. Miao, L.; Li, S.; Zhang, F.; Chen, T.; Zhang, Y. Future Drought in the Dry Lands of Asia Under the 1.5 and 2.0 °C Warming Scenarios. Earth’s Future 2020, 8, e2019EF001337. [Google Scholar] [CrossRef]
  11. Su, B.; Huang, J.; Mondal, S.K.; Zhai, J.; Wang, Y.; Wen, S.; Gao, M.; Lv, Y.; Jiang, S.; Jiang, T. Insight from CMIP6 SSP-RCP scenarios for future drought characteristics in China. Atmos. Res. 2021, 250, 105375. [Google Scholar] [CrossRef]
  12. Vicente-Serrano, S.M.; Peña-Angulo, D.; Beguería, S.; Domínguez-Castro, F.; Tomás-Burguera, M.; Noguera, I.; Gimeno-Sotelo, L.; El Kenawy, A. Global drought trends and future projections. Philos. Trans. R. Soc. A 2022, 380, 20210285. [Google Scholar] [CrossRef] [PubMed]
  13. Zhai, J.; Mondal, S.K.; Fischer, T.; Wang, Y.; Su, B.; Huang, J.; Tao, H.; Wang, G.; Ullah, W.; Uddin, M.J. Future drought characteristics through a multi-model ensemble from CMIP6 over South Asia. Atmos. Res. 2020, 246, 105111. [Google Scholar] [CrossRef]
  14. Zhang, Q.; Kong, D.; Singh, V.P.; Shi, P. Response of vegetation to different time-scales drought across China: Spatiotemporal patterns, causes and implications. Glob. Planet. Change 2017, 152, 1–11. [Google Scholar] [CrossRef]
  15. Zhao, X.; Li, Z.; Zhu, Q.; Zhu, D.; Liu, H. Climatic and drought characteristics in the loess hilly-gully region of China from 1957 to 2014. PLoS ONE 2017, 12, e0178701. [Google Scholar] [CrossRef]
  16. Guo, H.; Bao, A.; Ndayisaba, F.; Liu, T.; Jiapaer, G.; El-Tantawi, A.M.; De Maeyer, P. Space-time characterization of drought events and their impacts on vegetation in Central Asia. J. Hydrol. 2018, 564, 1165–1178. [Google Scholar] [CrossRef]
  17. Liu, B.; Liang, M.; Huang, Z.; Tan, X. Duration–severity–area characteristics of drought events in eastern China determined using a three-dimensional clustering method. Int. J. Climatol. 2021, 41, E3065–E3084. [Google Scholar] [CrossRef]
  18. Lloyd-Hughes, B. A spatio-temporal structure-based approach to drought characterisation. Int. J. Climatol. 2012, 32, 406–418. [Google Scholar] [CrossRef]
  19. Xu, K.; Yang, D.; Xu, X.; Lei, H. Copula based drought frequency analysis considering the spatio-temporal variability in Southwest China. J. Hydrol. 2015, 527, 630–640. [Google Scholar] [CrossRef]
  20. Zhang, Z.; Zhang, W.; Yang, B.; Xie, W.; Tao, C.; Hong, Z.; Xie, Y.; Li, J.; Li, L.; Meng, L. Long-term spatiotemporal characteristics of meteorological drought in China from a three-dimensional (longitude, latitude, time) perspective. Int. J. Appl. Earth Obs. Geoinf. 2024, 126, 103633. [Google Scholar] [CrossRef]
  21. Zhou, H.; Zhou, W.; Liu, Y.; Yuan, Y.; Huang, J.; Liu, Y. Identifying spatial extent of meteorological droughts: An examination over a humid region. J. Hydrol. 2020, 591, 125505. [Google Scholar] [CrossRef]
  22. Andreadis, K.M.; Clark, E.A.; Wood, A.W.; Hamlet, A.F.; Lettenmaier, D.P. Twentieth-century drought in the conterminous United States. J. Hydrometeorol. 2005, 6, 985–1001. [Google Scholar] [CrossRef]
  23. Cavus, Y.; Aksoy, H. Critical drought severity/intensity-duration-frequency curves based on precipitation deficit. J. Hydrol. 2020, 584, 124312. [Google Scholar] [CrossRef]
  24. Liu, J.; Wu, J.; Ali, S.A.; Linh, N.T.T.; Ren, Y.; Shalamzari, M.J. Unraveling Projected Changes in Spatiotemporal Patterns and Drought Events Across Mainland China Using CMIP6 Models and an Intensity–Area–Duration Algorithm. Land 2024, 13, 1571. [Google Scholar] [CrossRef]
  25. Ren, Y.; Liu, J.; Willems, P.; Liu, T.; Pham, Q.B. Detection and Assessment of Changing Drought Events in China in the Context of Climate Change Based on the Intensity–Area–Duration Algorithm. Land 2023, 12, 1820. [Google Scholar] [CrossRef]
  26. Sheffield, J.; Andreadis, K.; Wood, E.F.; Lettenmaier, D. Global and continental drought in the second half of the twentieth century: Severity–area–duration analysis and temporal variability of large-scale events. J. Clim. 2009, 22, 1962–1981. [Google Scholar] [CrossRef]
  27. Yang, X.; Zhang, L.; Wang, Y.; Singh, V.P.; Xu, C.-Y.; Ren, L.; Zhang, M.; Liu, Y.; Jiang, S.; Yuan, F. Spatial and Temporal Characterization of Drought Events in China Using the Severity-Area-Duration Method. Water 2020, 12, 230. [Google Scholar] [CrossRef]
  28. Zhai, J.; Huang, J.; Su, B.; Cao, L.; Wang, Y.; Jiang, T.; Fischer, T. Intensity–area–duration analysis of droughts in China 1960–2013. Clim. Dyn. 2017, 48, 151–168. [Google Scholar] [CrossRef]
  29. Cammalleri, C.; Acosta Navarro, J.C.; Bavera, D.; Diaz, V.; Di Ciollo, C.; Maetens, W.; Magni, D.; Masante, D.; Spinoni, J.; Toreti, A. An event-oriented database of meteorological droughts in Europe based on spatio-temporal clustering. Sci. Rep. 2023, 13, 3145. [Google Scholar] [CrossRef]
  30. Liu, Z.; Zhou, W.; Wang, X. Extreme Meteorological Drought Events over China (1951–2022): Migration Patterns, Diversity of Temperature Extremes, and Decadal Variations. Adv. Atmos. Sci. 2024, 41, 2313–2336. [Google Scholar] [CrossRef]
  31. Li, J.; Wang, Z.; Lai, C. Severe drought events inducing large decrease of net primary productivity in mainland China during 1982–2015. Sci. Total Environ. 2020, 703, 135541. [Google Scholar] [CrossRef] [PubMed]
  32. Wang, A.; Lettenmaier, D.P.; Sheffield, J. Soil Moisture Drought in China, 1950–2006. Am. Meteorol. Soc. 2011, 24, 3257–3271. [Google Scholar] [CrossRef]
  33. Xu, K.; Yang, D.; Yang, H.; Li, Z.; Qin, Y.; Shen, Y. Spatio-temporal variation of drought in China during 1961–2012: A climatic perspective. J. Hydrol. 2015, 526, 253–264. [Google Scholar] [CrossRef]
  34. Yoo, J.; Kim, J.; Kwon, H.-H.; Kim, T.-W. A new drought monitoring approach using three-dimensional drought properties based on a dynamic drought detection technique algorithm. J. Hydrol. Reg. Stud. 2022, 44, 101270. [Google Scholar] [CrossRef]
  35. Herrera-Estrada, J.E.; Satoh, Y.; Sheffield, J. Spatiotemporal dynamics of global drought. Geophys. Res. Lett. 2017, 44, 2254–2263. [Google Scholar] [CrossRef]
  36. Wen, X.; Tu, Y.H.; Tan, Q.F.; Li, W.Y.; Wang, Z.N. Construction of 3D drought structures of meteorological drought events and their spatio-temporal evolution characteristics. J. Hydrol. 2020, 590, 125539. [Google Scholar] [CrossRef]
  37. Nie, M.; Huang, S.; Duan, W.; Leng, G.; Bai, G.; Wang, Z.; Huang, Q.; Fang, W.; Peng, J. Meteorological drought migration characteristics based on an improved spatiotemporal structure approach in the Loess Plateau of China. Sci. Total Environ. 2024, 912, 168813. [Google Scholar] [CrossRef]
  38. Diaz, V.; Corzo Perez, G.A.; Van Lanen, H.A.J.; Solomatine, D.; Varouchakis, E.A. An approach to characterise spatio-temporal drought dynamics. Adv. Water Resour. 2020, 137, 103512. [Google Scholar] [CrossRef]
  39. Zhang, J.; Zhang, M.; Yu, Y.; Yu, R. An innovative method integrating run theory and DBSCAN for complete three-dimensional drought structures. Sci. Total Environ. 2024, 926, 171901. [Google Scholar] [CrossRef]
  40. Hersbach, H.; Bell, B.; Berrisford, P.; Hirahara, S.; Horányi, A.; Muñoz-Sabater, J.; Nicolas, J.; Peubey, C.; Radu, R.; Schepers, D. The ERA5 global reanalysis. Q. J. R. Meteorol. Soc. 2020, 146, 1999–2049. [Google Scholar] [CrossRef]
  41. Jiao, D.; Xu, N.; Yang, F.; Xu, K. Evaluation of spatial-temporal variation performance of ERA5 precipitation data in China. Sci. Rep. 2021, 11, 17956. [Google Scholar] [CrossRef] [PubMed]
  42. Lei, X.; Xu, W.; Chen, S.; Yu, T.; Hu, Z.; Zhang, M.; Jiang, L.; Bao, R.; Guan, X.; Ma, M. How well does the ERA5 reanalysis capture the extreme climate events over China? Part I: Extreme precipitation. Front. Environ. Sci. 2022, 10, 921658. [Google Scholar] [CrossRef]
  43. Huang, X.; Wei, W.; Jianhui, X.; Shiying, L.; Jiang, Y.; Bin, D.; Liwei, W. The applicability performance of the ERA5-Land precipitation datasets in Southwest China. Plateau Meteorol. 2023, 42, 1562–1575. [Google Scholar] [CrossRef]
  44. Thrasher, B.; Wang, W.; Michaelis, A.; Melton, F.; Lee, T.; Nemani, R. NASA global daily downscaled projections, CMIP6. Sci. Data 2022, 9, 262. [Google Scholar] [CrossRef]
  45. McKee, T.B.; Doesken, N.J.; Kleist, J. The relationship of drought frequency and duration to time scales. In Proceedings of the 8th Conference on Applied Climatology, Anaheim, CA, USA, 17–22 January 1993; pp. 179–183. [Google Scholar]
  46. Han, Z.; Yuanbo, L. SPI Based Meteorological Drought Assessment over a Humid Basin: Effects of Processing Schemes. Water 2016, 8, 373. [Google Scholar] [CrossRef]
  47. Sun, J.; Ao, J. Changes in precipitation and extreme precipitation in a warming environment in China. Chin. Sci. Bull. 2013, 58, 1395–1401. [Google Scholar] [CrossRef]
  48. Wu, S.Y.; Wu, Y.; Wen, J. Future changes in precipitation characteristics in China. Int. J. Climatol. 2019, 39, 3558–3573. [Google Scholar] [CrossRef]
  49. Zhou, H.; Zhou, W.; Liu, Y.; Huang, J.; Yuan, Y.; Liu, Y. Climatological spatial scales of meteorological droughts in China and associated climate variability. J. Hydrol. 2023, 617, 129056. [Google Scholar] [CrossRef]
  50. Liu, Z.; Zhou, W.; Yuan, Y. 3D DBSCAN detection and parameter sensitivity of the 2022 Yangtze river summertime heatwave and drought. Atmos. Ocean. Sci. Lett. 2023, 16, 100324. [Google Scholar] [CrossRef]
  51. Liu, Z.; Zhou, W. Global seasonal-scale meteorological droughts. Part I: Detection, metrics, and inland/coastal types. Ocean. Land Atmos. Res. 2023, 2, 0016. [Google Scholar] [CrossRef]
  52. Spinoni, J.; Barbosa, P.; De Jager, A.; McCormick, N.; Naumann, G.; Vogt, J.V.; Magni, D.; Masante, D.; Mazzeschi, M. A new global database of meteorological drought events from 1951 to 2016. J. Hydrol. Reg. Stud. 2019, 22, 100593. [Google Scholar] [CrossRef]
  53. Xu, Y.; Zhang, X.; Hao, Z.; Hao, F.; Li, C. Projections of future meteorological droughts in China under CMIP6 from a three-dimensional perspective. Agric. Water Manag. 2021, 252, 106849. [Google Scholar] [CrossRef]
  54. Zhao, R.; Sun, H.; Xing, L.; Li, R.; Li, M. Effects of anthropogenic climate change on the drought characteristics in China: From frequency, duration, intensity, and affected area. J. Hydrol. 2023, 617, 129008. [Google Scholar] [CrossRef]
  55. Zhang, J.; Sun, F.; Lai, W.; Lim, W.H.; Liu, W.; Wang, T.; Wang, P. Attributing changes in future extreme droughts based on PDSI in China. J. Hydrol. 2019, 573, 607–615. [Google Scholar] [CrossRef]
  56. Yue, Y.; Yan, D.; Yue, Q.; Ji, G.; Wang, Z. Future changes in precipitation and temperature over the Yangtze River Basin in China based on CMIP6 GCMs. Atmos. Res. 2021, 264, 105828. [Google Scholar] [CrossRef]
  57. Cherchi, A.; Ambrizzi, T.; Behera, S.; Freitas, A.C.V.; Morioka, Y.; Zhou, T. The Response of Subtropical Highs to Climate Change. Curr. Clim. Change Rep. 2018, 4, 371–382. [Google Scholar] [CrossRef]
  58. Matsumura, S.; Horinouchi, T. Pacific Ocean decadal forcing of long-term changes in the western Pacific subtropical high. Sci. Rep. 2016, 6, 37765. [Google Scholar] [CrossRef]
  59. Cook, B.I.; Mankin, J.S.; Marvel, K.; Williams, A.P.; Smerdon, J.E.; Anchukaitis, K.J. Twenty-first century drought projections in the CMIP6 forcing scenarios. Earth’s Future 2020, 8, e2019EF001461. [Google Scholar] [CrossRef]
  60. Ukkola, A.M.; De Kauwe, M.G.; Roderick, M.L.; Abramowitz, G.; Pitman, A.J. Robust future changes in meteorological drought in CMIP6 projections despite uncertainty in precipitation. Geophys. Res. Lett. 2020, 47, e2020GL087820. [Google Scholar] [CrossRef]
  61. Yang, X.; Zhou, B.; Xu, Y.; Han, Z. CMIP6 evaluation and projection of temperature and precipitation over China. Adv. Atmos. Sci. 2021, 38, 817–830. [Google Scholar] [CrossRef]
  62. Li, Y.; Yan, D.; Peng, H.; Xiao, S. Evaluation of precipitation in CMIP6 over the Yangtze River Basin. Atmos. Res. 2021, 253, 105406. [Google Scholar] [CrossRef]
  63. Tian, J.; Zhang, Z.; Ahmed, Z.; Zhang, L.; Su, B.; Tao, H.; Jiang, T. Projections of precipitation over China based on CMIP6 models. Stoch. Environ. Res. Risk Assess. 2021, 35, 831–848. [Google Scholar] [CrossRef]
Figure 1. Overview of the nine major watershed divisions in China.
Water 17 01099 g001
Figure 3. Flowchart of the core calculation process for spatial correlation length (CL).
Water 17 01099 g003
Figure 4. Spatiotemporal migration maps of typical drought events. The 2008/06–2009/11 event (a); the 2007/06–2008/05 event (b); the 1962/02–1962/10 event (c); and the 2001/09–2001/11 event (d). The blue dots indicate the event start/end positions, the black arrows indicate the direction of migration, and the grey lines are the event migration paths.
Water 17 01099 g004
Figure 5. Three-dimensional visualization of typical drought events. The 2008/06–2009/11 event (a); the 2007/06–2008/05 event (b); the 1962/02–1962/10 event (c); and the 2001/09–2001/11 event (d). The base map displays the two-dimensional projection of all drought patches across the study area throughout each event. The vertical axis represents time (months), while color intensity indicates drought severity.
Water 17 01099 g005
Figure 6. The characteristics of drought event duration, migration distance, the affected area, severity, and SMI for the historical period and the SSP2-4.5 and SSP5-8.5 scenarios.
Water 17 01099 g006
Figure 7. The spatial distribution of drought event migration trajectories for the historical period (a), SSP2-4.5 (b), and SSP5-8.5 (c) scenarios, respectively. The number of drought event migration trajectories passing through each grid was counted in a 1° × 1° grid.
Water 17 01099 g007
Figure 8. Temporal distribution of drought events. The concentric circles represent distinct decades, progressing outward from the center. Months are arranged sequentially in a clockwise direction from the top (January to December). Each arc corresponds to a drought event, with color denoting severity and position reflecting the decade and month of occurrence. Seasonal divisions (a); temporal distributions of drought events during the historical period (b), under the moderate-emission scenario (SSP2-4.5) (c), and under the high-emission scenario (SSP5-8.5) (d), respectively.
Water 17 01099 g008
Figure 9. (ac) shows the migration of drought events between nine major river basins in China, with directional lines pointing from the occurrence area of drought events to the end area, the color of the line is consistent with the color of the event occurrence area, and the thickness of the line indicates the number of migrating events of the same type. (df) are the statistics of the migration direction of drought events, and the color of the fan represents the distribution of the duration of events in that direction.
Water 17 01099 g009
Figure 10. Extreme case presentation. The distance between the centroids of the patches (Dis = 8.6936°) is much larger than the CL of P2 in the southwest direction (CL = 1.1841°), but slightly smaller than the CL of P1 in the northeast direction (CL = 8.7445°).
Water 17 01099 g010
Table 1. Characteristics of drought events under historical and future scenarios.
Historical PeriodSSP2-4.5SSP5-8.5
Number2186068
Mean duration (months)4.86.26.2
Mean drought severity0.71.81.7
Mean area (×104 km2)273.21690.81661.5
Mean migration distance (Degree)17.218.819.8
Mean migration displacement (Degree)8.67.17.6
Mean SMI4.34.14.4
Disclaimer/Publisher’s Note: The statements, opinions and data contained in all publications are solely those of the individual author(s) and contributor(s) and not of MDPI and/or the editor(s). MDPI and/or the editor(s) disclaim responsibility for any injury to people or property resulting from any ideas, methods, instructions or products referred to in the content.

