Article

Research on the Characteristics of Sediment Erosion in Pump-Turbine Runners Under Different Solid-Phase Conditions

1
Key Laboratory of Fluid and Power Machinery, Ministry of Education, Xihua University, Chengdu 610039, China
2
Key Laboratory of Fluid Machinery and Engineering, Sichuan Province, Xihua University, Chengdu 610039, China
3
School of Energy and Power Engineering, Xihua University, Chengdu 610039, China
*
Author to whom correspondence should be addressed.
Water 2025, 17(7), 1093; https://doi.org/10.3390/w17071093
Submission received: 2 February 2025 / Revised: 18 March 2025 / Accepted: 3 April 2025 / Published: 6 April 2025

Abstract

:
Sediment erosion in turbine components presents a major challenge to the reliable operation of pumped storage power plants, particularly in sediment-laden rivers. While extensive research has been conducted on hydraulic machinery erosion, studies focusing on the combined effects of sediment particle size and concentration on erosion within the runner region of pump turbines remain limited. To bridge this gap, this study investigates the influence of sediment characteristics on erosion patterns and deposition mechanisms in pump-turbine runners through a combination of numerical simulations and experimental validation. The results demonstrate that sediment concentration primarily governs the overall erosion intensity, while particle size significantly influences the spatial distribution of erosion zones. Higher sediment concentrations lead to intensified surface wear and broader erosion regions, whereas larger particles cause localized shifts in erosion-prone areas across different blade surfaces. Furthermore, a strong correlation is identified between erosion zones and sediment accretion regions, highlighting the interplay between material loss and deposition dynamics. By accurately predicting erosion trends, numerical simulations minimize the reliance on costly and time-consuming physical experiments, offering valuable insights for turbine optimization. This study enhances the understanding of sediment-induced erosion mechanisms in pump turbines and provides guidance for improving turbine design and operational strategies in sediment-laden environments.

1. Introduction

Early pumped storage power plants had stringent site selection requirements, necessitating the construction of two reservoirs upstream and downstream of the plant to provide a water supply and storage for power generation and pumping. Additionally, sand removal or sedimentation facilities were installed to ensure better water quality and reduce sediment erosion of the flow passage components in the pumped storage units [1,2,3]. However, with the large-scale development of pumped storage power plants in China, many plants now directly use natural river sections or reservoirs of existing upstream and downstream hydropower stations as upper and lower reservoirs. Under pumping conditions, water is directly sourced from the tailrace of downstream stations. This has led to an increase in the sediment content passing through the units, significantly increasing the risk of sediment erosion in the flow passage components of the pump turbines [4,5,6,7].
From an environmental perspective, the rivers in the mountainous regions of southwestern China are ecologically fragile and prone to frequent disasters. In recent years, geological issues such as earthquakes and mountain floods have occurred frequently in these high-altitude areas, resulting in high sediment contents and hard, sharp gravel in the water. Under high-velocity water flow, sediment frequently collides and rubs against runner surfaces, causing severe erosion [5,8]. The resulting damage reduces turbine efficiency, increases vibration and noise, and leads to high maintenance costs, posing significant threats to the safe and economic operation of hydropower plants [9,10].
Regarding the study of sediment erosion mechanisms through experimental and numerical simulations, domestic and international scholars have focused on the effects of flow field conditions (such as velocity and impact angle), sediment properties (including size, shape, and hardness), sediment concentration, and material wear characteristics. Liu Xiaobing [11] used the Euler–Lagrange turbulence model to simulate sediment erosion in turbines operating in low-concentration sandy water, accurately predicting the wear rate and primary wear areas of guide vanes, with results closely matching actual experimental data. Padh et al. [12,13] conducted sediment erosion studies on Francis turbines and reported that the relative velocity between the fluid and the runner had the greatest impact on sediment erosion. Guangjie P. [14] simulated solid–liquid two-phase flow in Francis turbines via the Euler–Lagrange model and the Finnie wear model to predict sediment erosion on runner blades and guide vanes, analyzing the relationship between the wear rate and sediment concentration. The results revealed a positive correlation between the wear rate and sediment concentration, with runner erosion being more severe than guide vane erosion. Lihao Li et al. [15] studied the impact of different sediment concentrations and sediment diameters on the wear of an impact-type water turbine under rated conditions through numerical simulations. They found that sediment concentration primarily affects the amount of wear on the flow passage surface, whereas the sediment particle diameter influences the distribution of the wear location. Jiayang Pang et al. [16] investigated the sediment wear phenomenon of high-head long/short-blade Kaplan turbines in the Min River Basin through a combination of experiments and simulations. They discovered that the outflow boundary at 10% of the blade height on the intake side of the long blade is a concentration zone for sediment particles, whereas the sediment concentration on the surface of the short blade is relatively low.
From the perspective of the key factors affecting sediment erosion in turbines, Zhang Lei [17,18] used the discrete phase method (DPM) model and the standard turbulence model to simulate four partial load conditions, revealing the flow characteristics and wear patterns in the guide vane region. Li Yanhao and colleagues [19], based on measured sediment data from a power plant, used the Oka model to predict the wear characteristics of high-head Francis turbine runners during the flood season. They reported that under partial load conditions with small guide vane openings, vortex formation inside the runner led to sediment accumulation and increased runner surface wear rates. Cristian Cruzatty [20] employed a numerical method combining solid–liquid two-phase flow simulation and erosion models to analyze erosion rates under different operating conditions, identifying wear patterns in turbine components. Erosion rates increase sharply when the turbine operates near full load, especially when the guide vane opening exceeds 90%. Tian Wenwen [21] used the standard k–ε turbulence model and the particle model to simulate solid–liquid two-phase flow in the guide vane domain under low-flow conditions, analyzing the internal flow characteristics. Combined with sediment wear tests on a turbine flow passage, the main erosion areas and severity of guide vane wear were determined. Min-Woo Kang [22] predicted sediment erosion in Francis turbine runners under different operating conditions and sediment concentrations via the DPM model. Erosion primarily occurred on the pressure side of the runner blades, with most erosion concentrated near the runner exit under optimal efficiency and full load conditions, and the erosion rates increased almost linearly with sediment inflow. Xin-Yu Wei et al. [23] explored sediment erosion from the perspective of flow structures, and their research revealed a significant correlation between the distribution of sediment wear locations and the distribution of vortices between blades. Jiale Pan et al. [24], through investigations into pump and turbine conditions, discovered that the impeller is the most vulnerable component and is associated with locally high flow velocities.
Previous studies have largely focused on the overall impact of sediment on hydraulic performance, with limited research on the specific effects of sediment particle size and concentration on erosion mechanisms. In this study, a model pump turbine is taken as the research object. Numerical simulations are employed to study the effects of different sediment particle sizes and concentrations on the flow field in the runner region of the pump turbine, and the mechanisms of sediment erosion in various runner components influenced by particle size and concentration are explored in detail. Erosion in pump turbine runners mainly occurs on the crown, band, and blade surfaces, where higher sediment concentrations intensify sediment erosion and larger particles alter erosion distribution. Additionally, erosion-prone areas often coincide with sediment deposition zones, highlighting the interaction between material loss and accretion, which affects turbine efficiency and longevity.

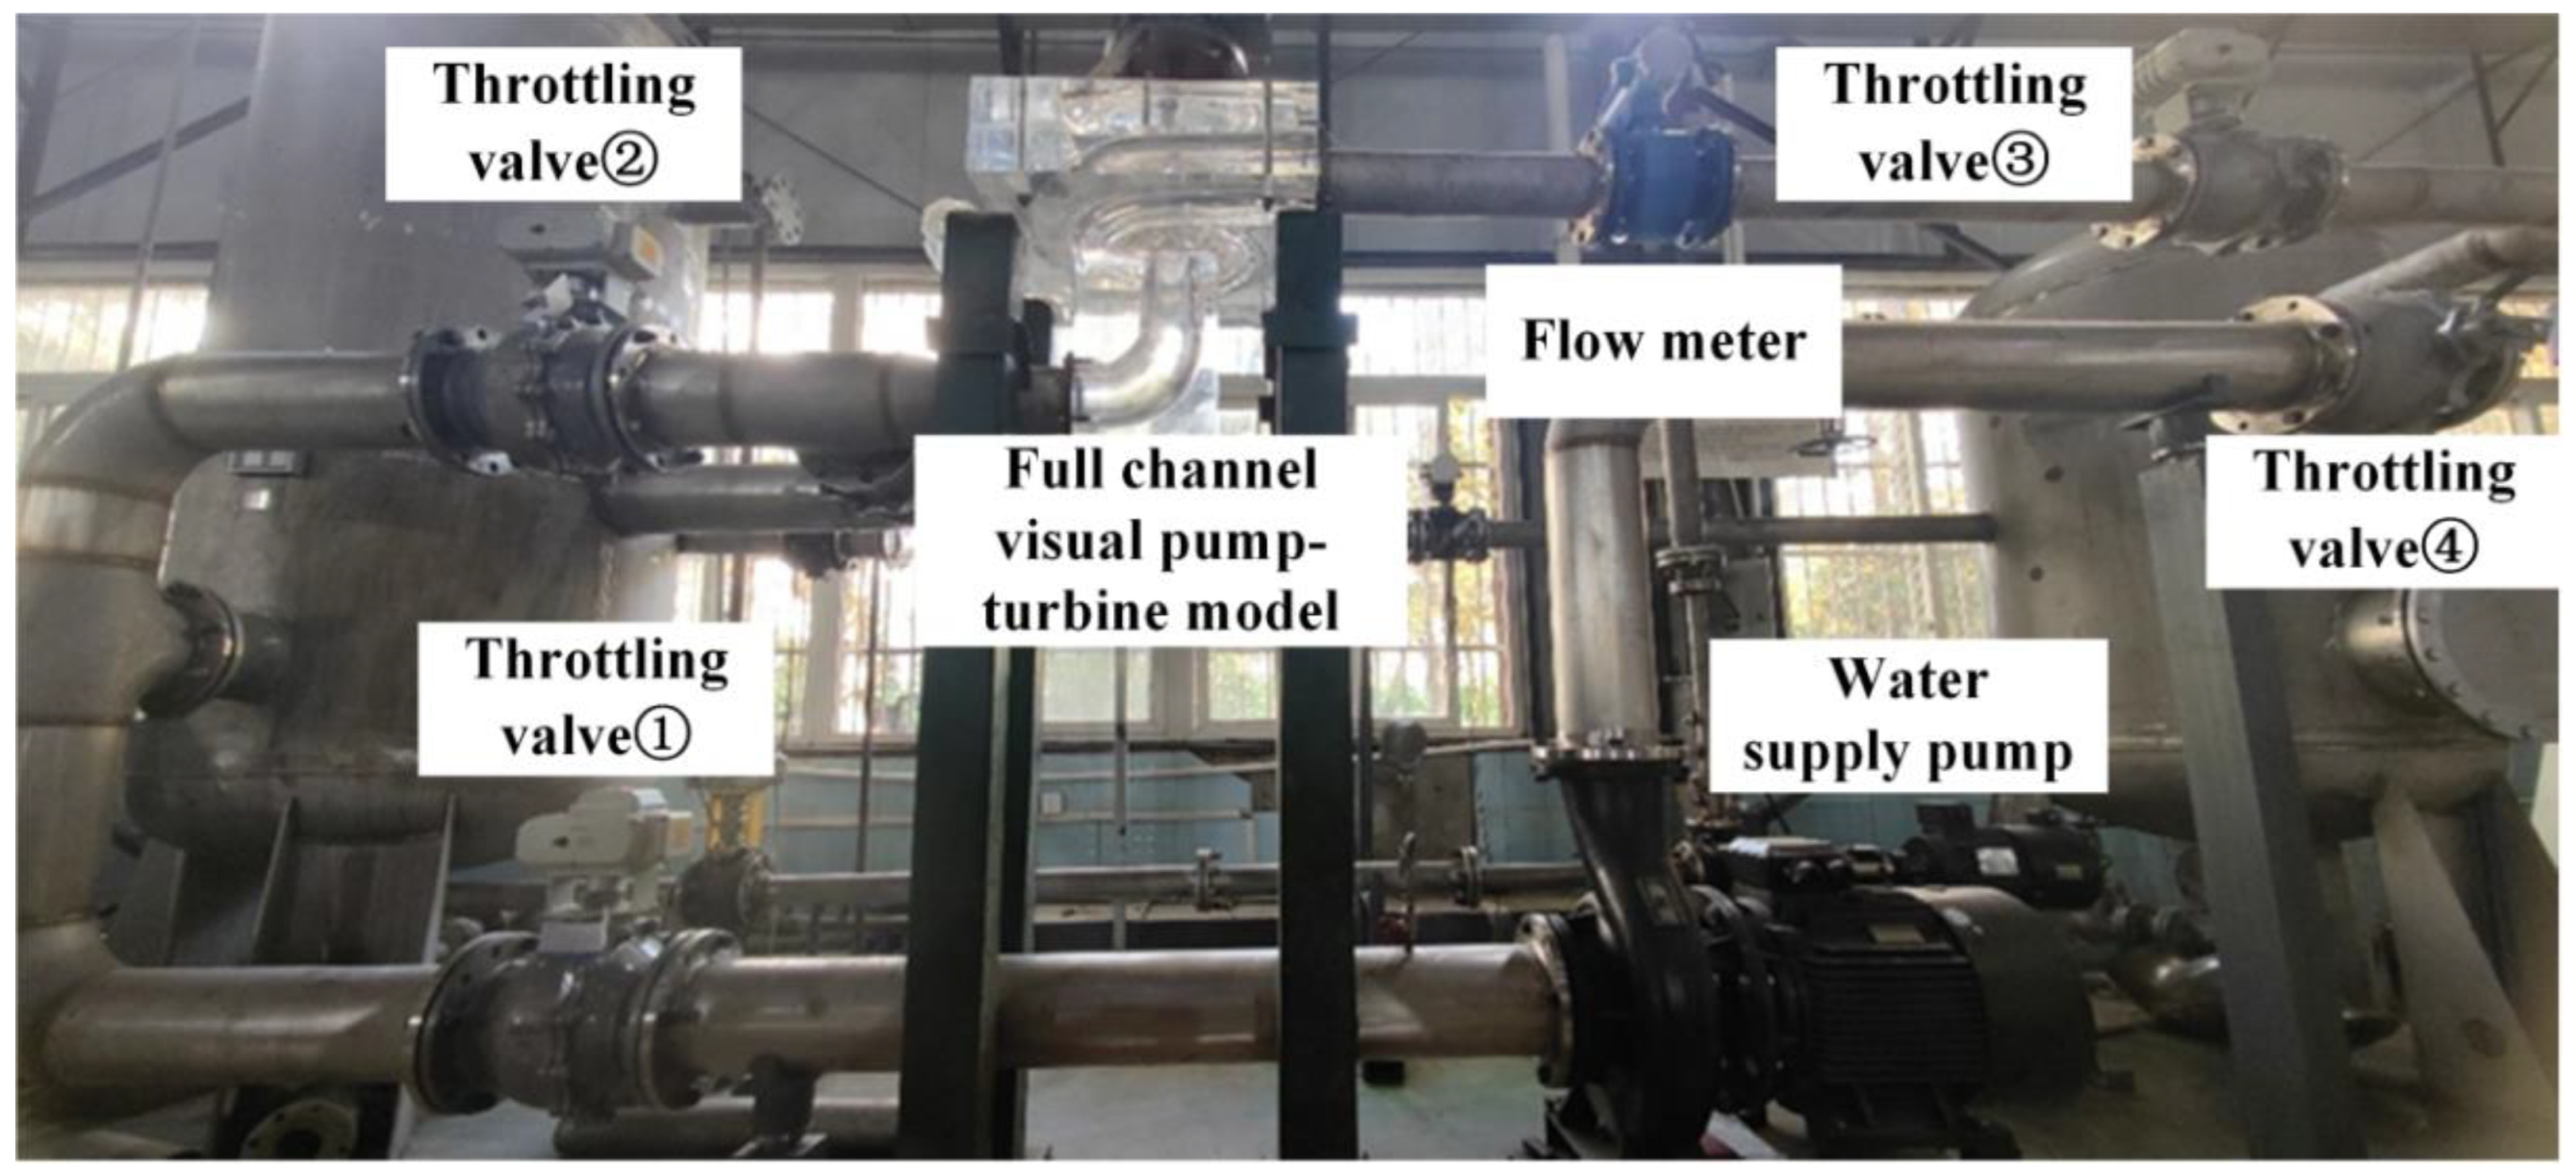
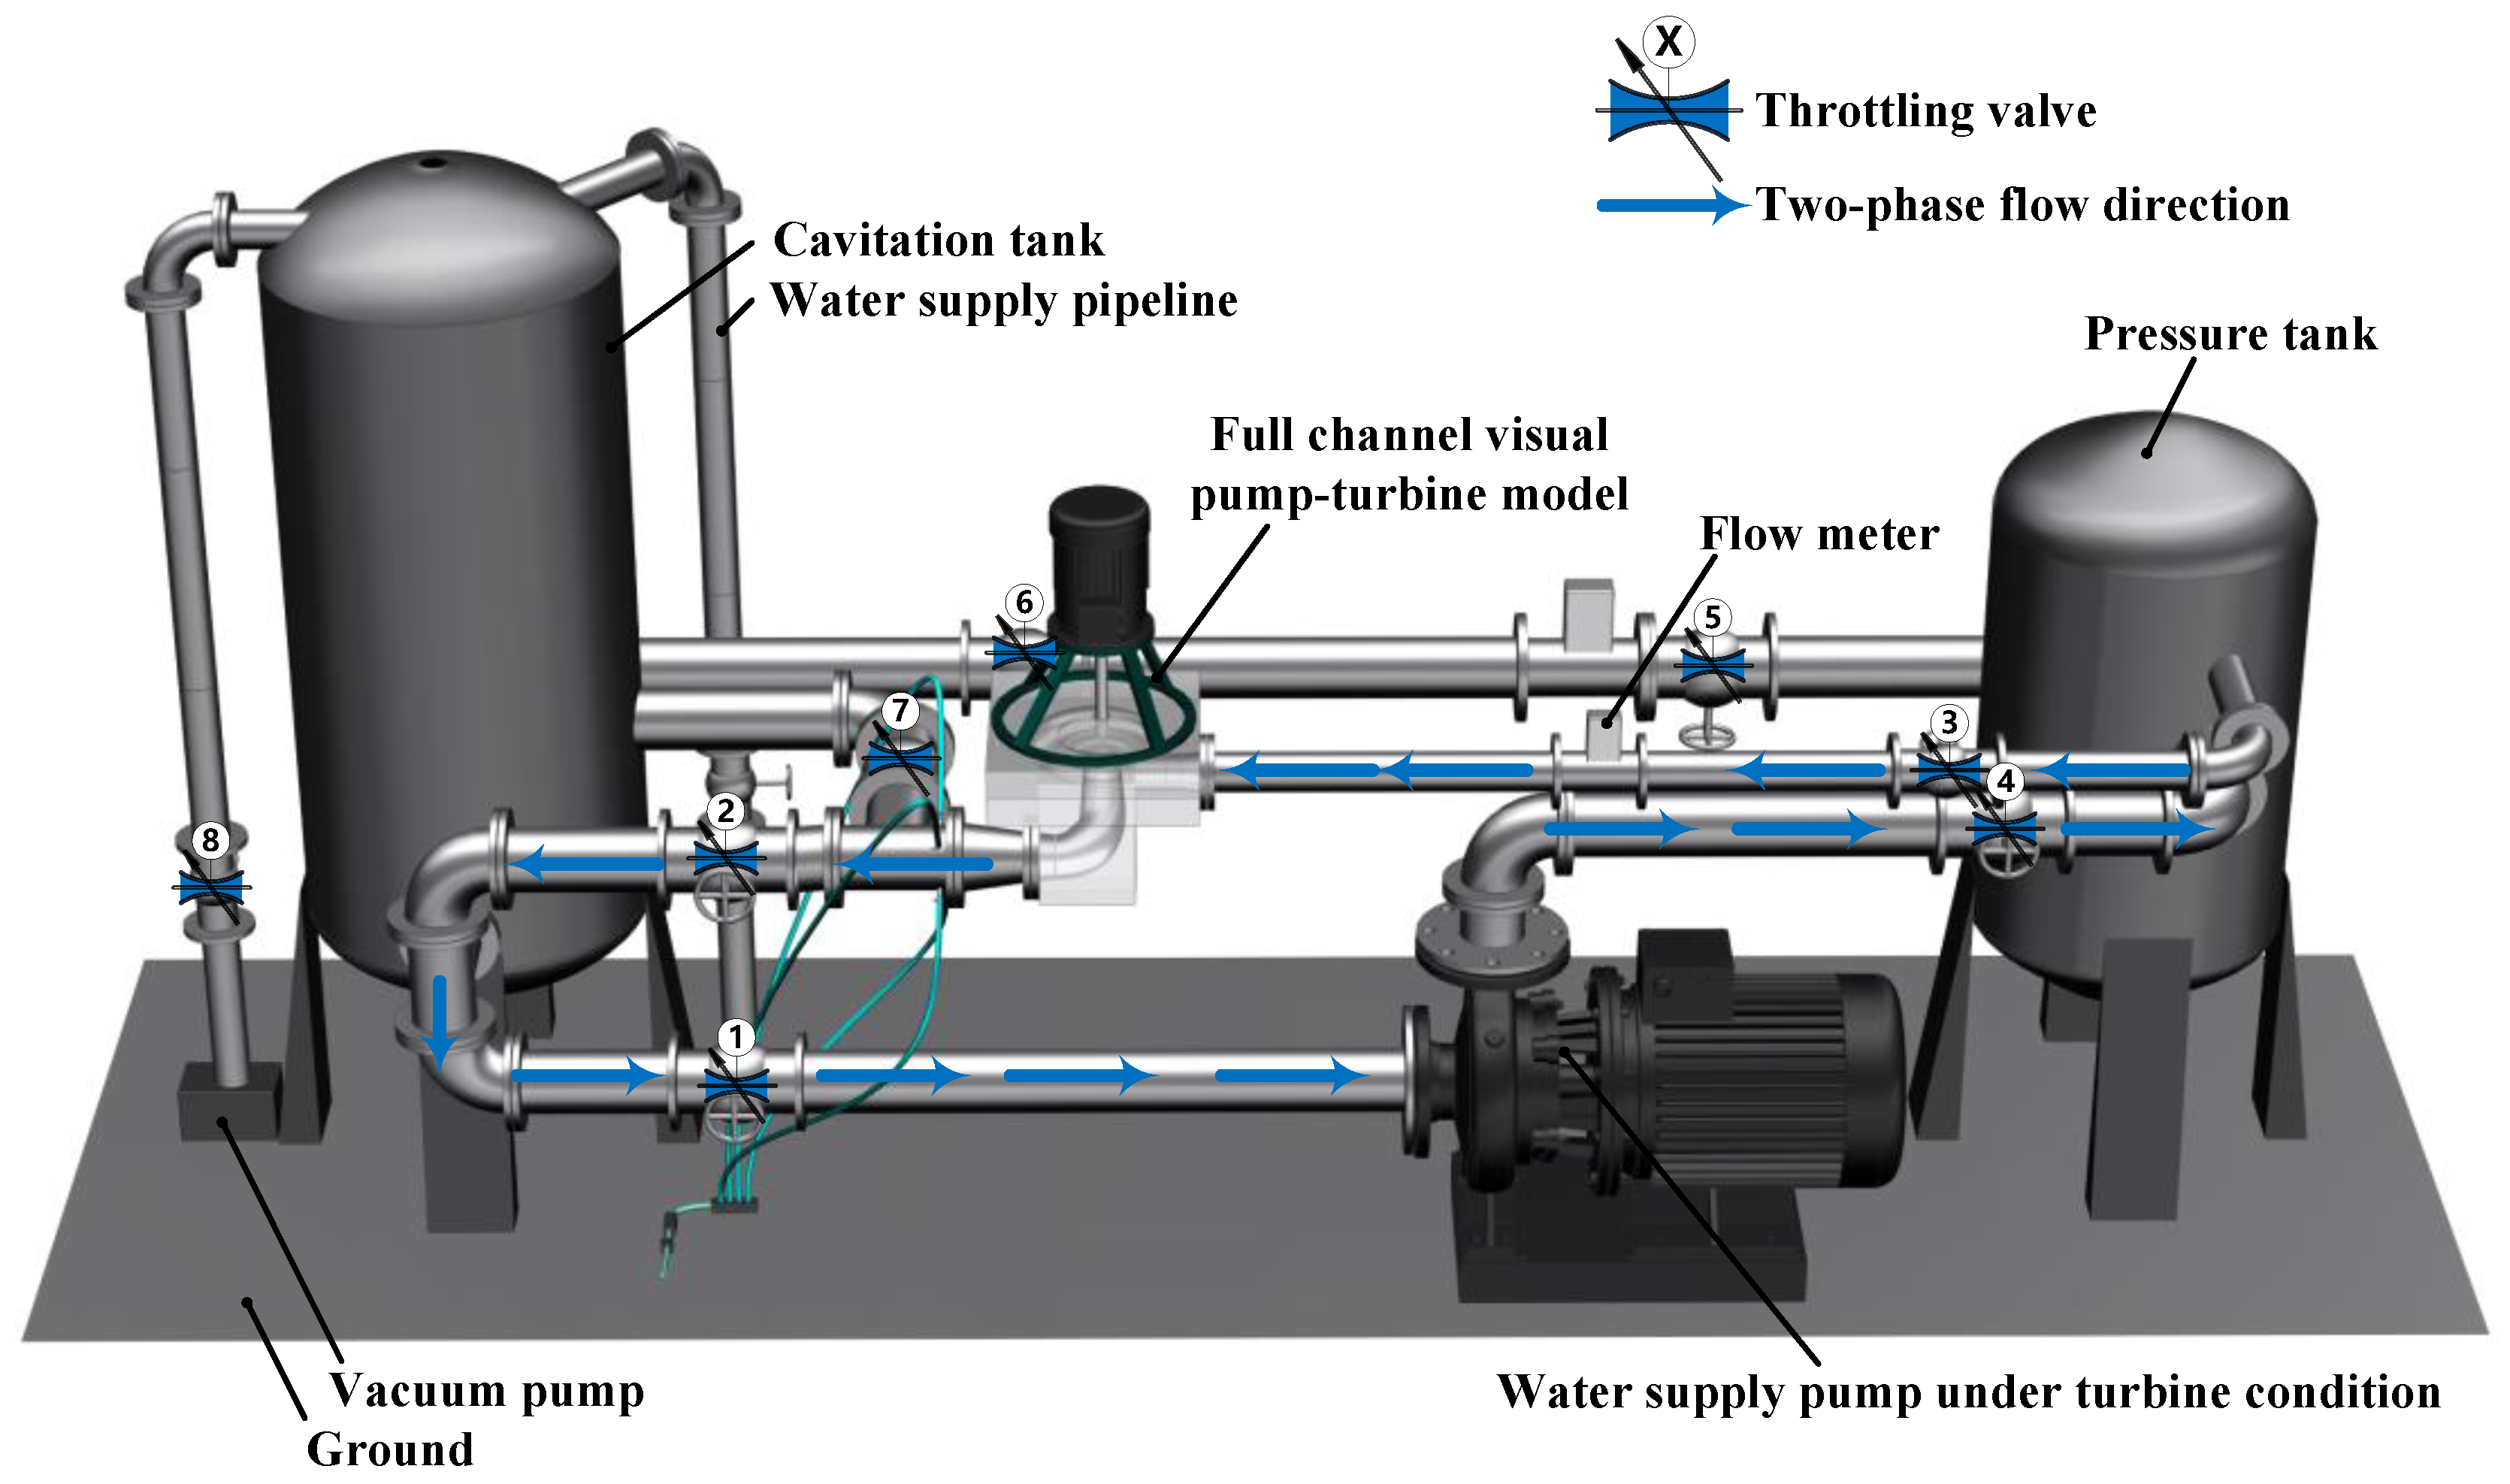
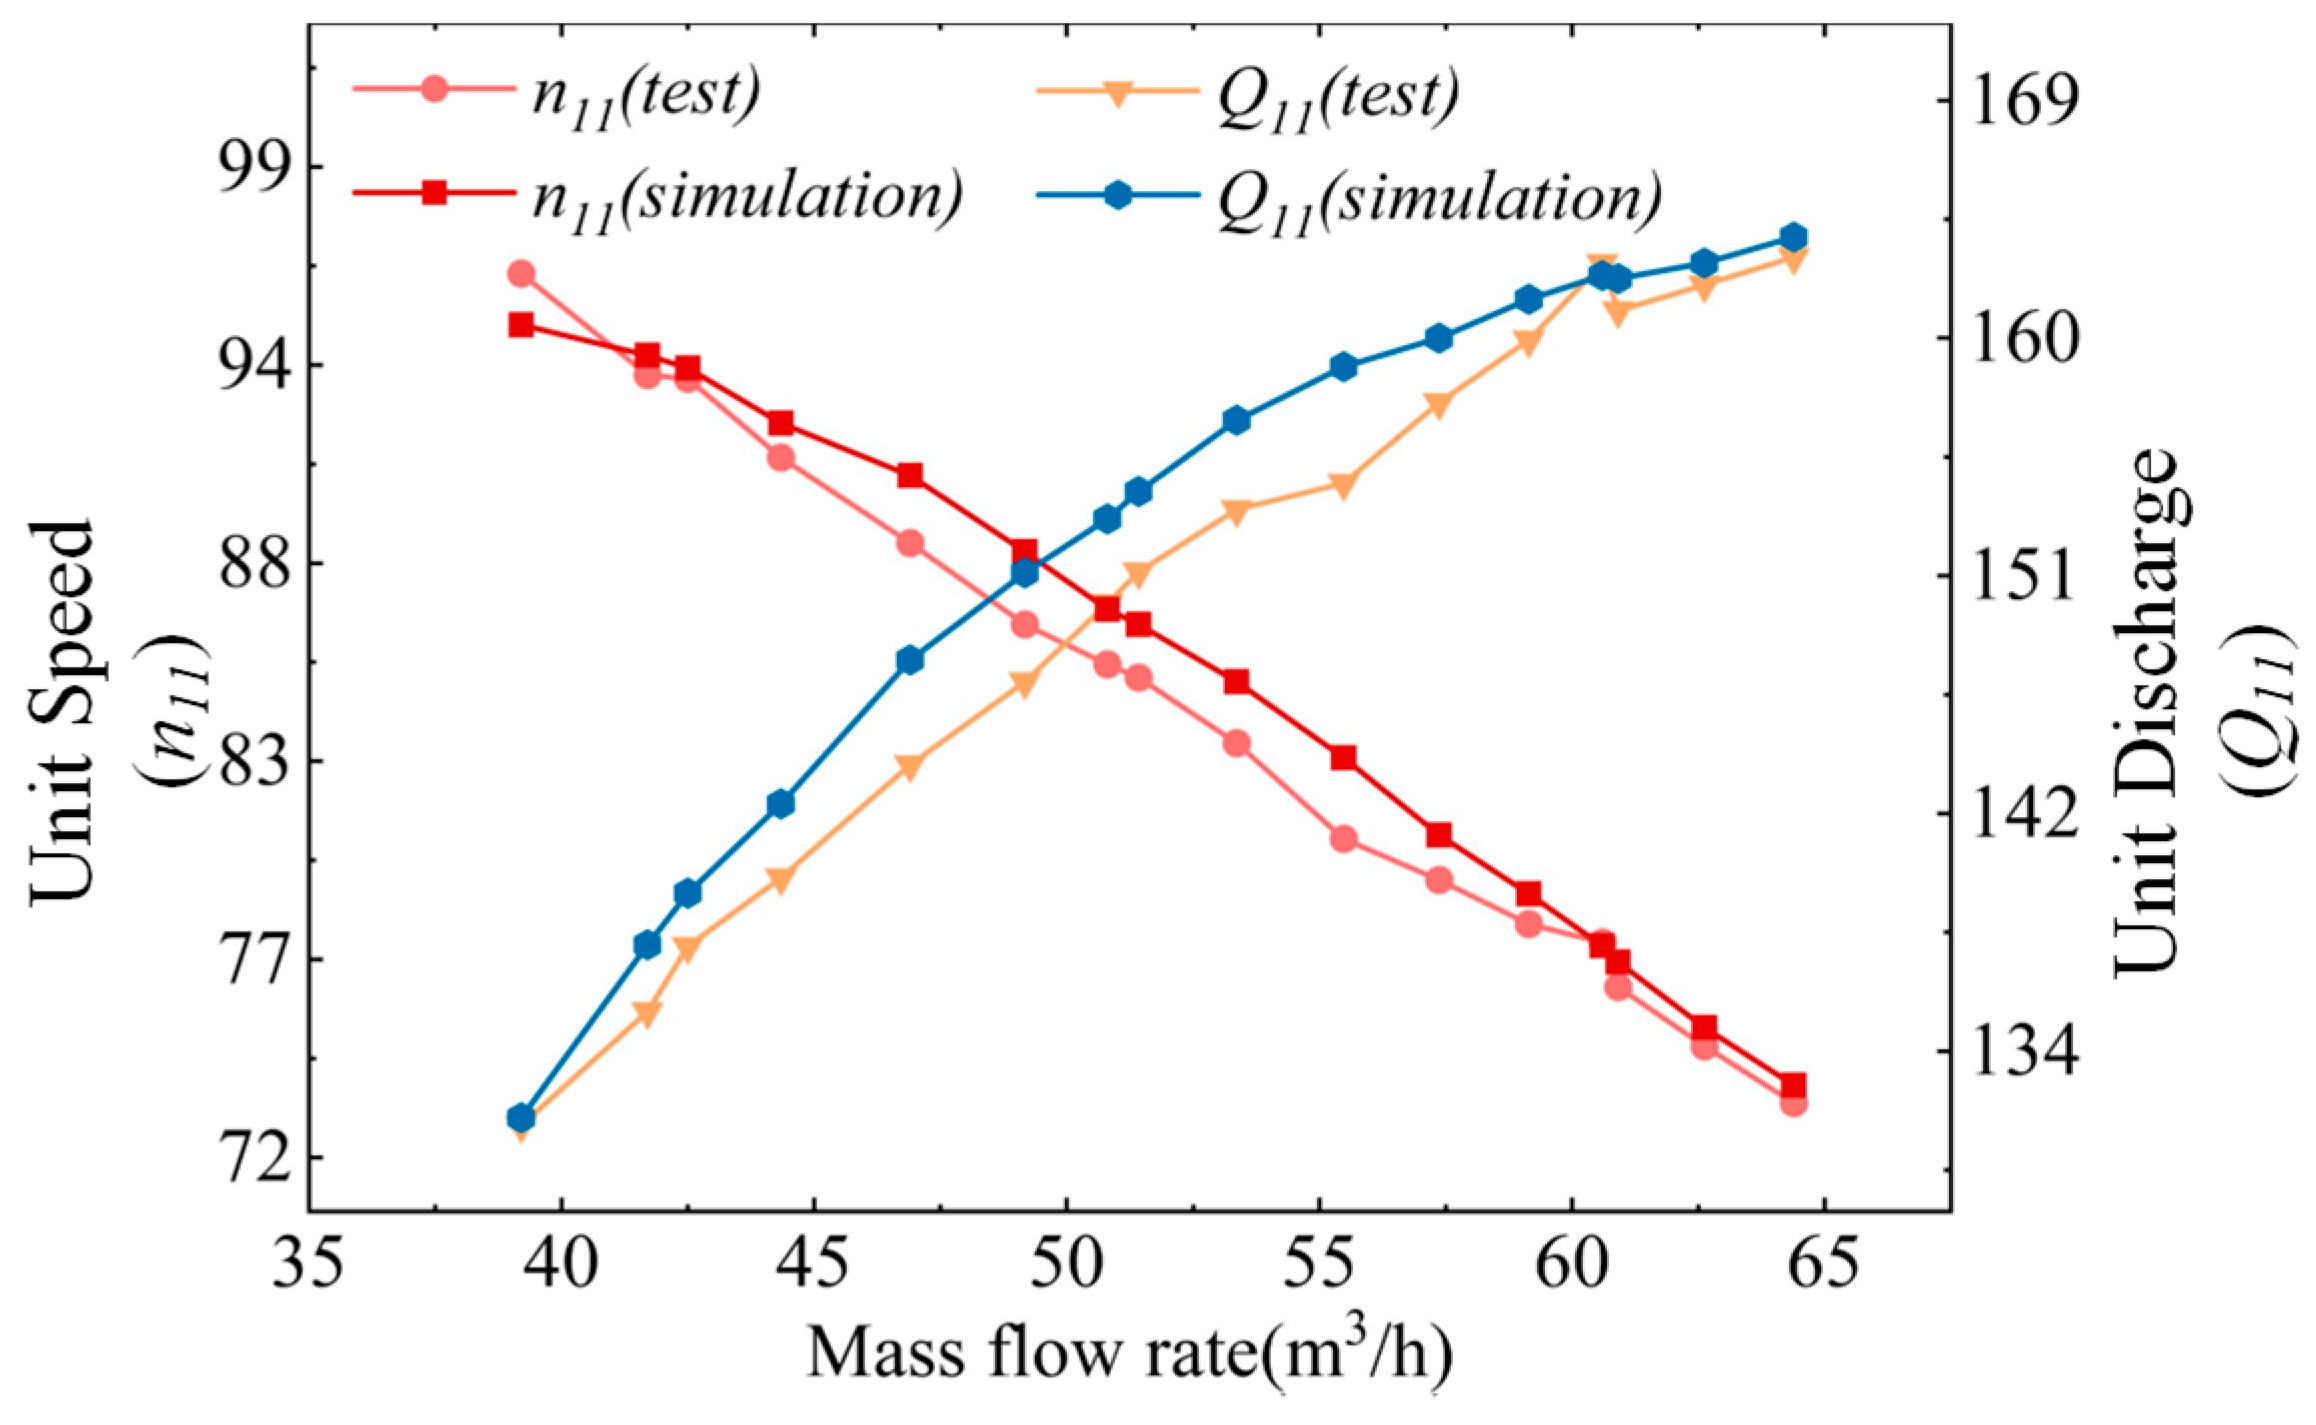
2. External Characteristic Test of the Pump Turbine

In this study, a combination of numerical simulation and experimental methods was employed. The experimental results were used to verify the numerical simulation results of the unit speed and unit flow rate, further confirming the accuracy of the numerical simulation calculations. The parameters of the pump turbine are described via the dimensionless quantities of unit speed n 11 and unit flow rate Q 11 [25]. The unit speed n 11 represents the rotational speed of a geometrically similar pump turbine with a runner diameter of 1 m and an effective head of 1 m. The unit flow rate indicates the effective flow rate under the same conditions. Therefore, these two unit quantities were used to intuitively verify the hydraulic characteristics of the pump turbine under turbine operating conditions.
n 11 = 2 n D 1 H
Q 11 = Q D 1 2 H
where n is the rotational speed of the runner (r/min), D 1 represents the characteristic diameter of the runner (mm), H is the head (m), and Q is the flow rate (m3/s).
The key parameters of the pump turbine were measured via the test bench and equipment shown in Figure 1 and Figure 2, with the results displayed in Figure 3. A comparison between the experimental and numerical simulation results of the unit speed and unit flow rate under different operating conditions was conducted. The simulation results agreed well with the experimental data, with a maximum error of less than 3%. Under the design conditions, the experimental unit speed and unit flow rate were 74.59 and 162.19, respectively, whereas the simulated unit speed and unit flow rate were 75.10 and 163.30, respectively, resulting in a final error of 0.69%. Under other conditions, the maximum error was 2.81%.
The calculation for Relative Error (RE) is as follows:
R E = V sim V exp V exp × 100 %
where V sim is the numerical simulation value and V exp is the experimental measurement.

3. Numerical Simulation

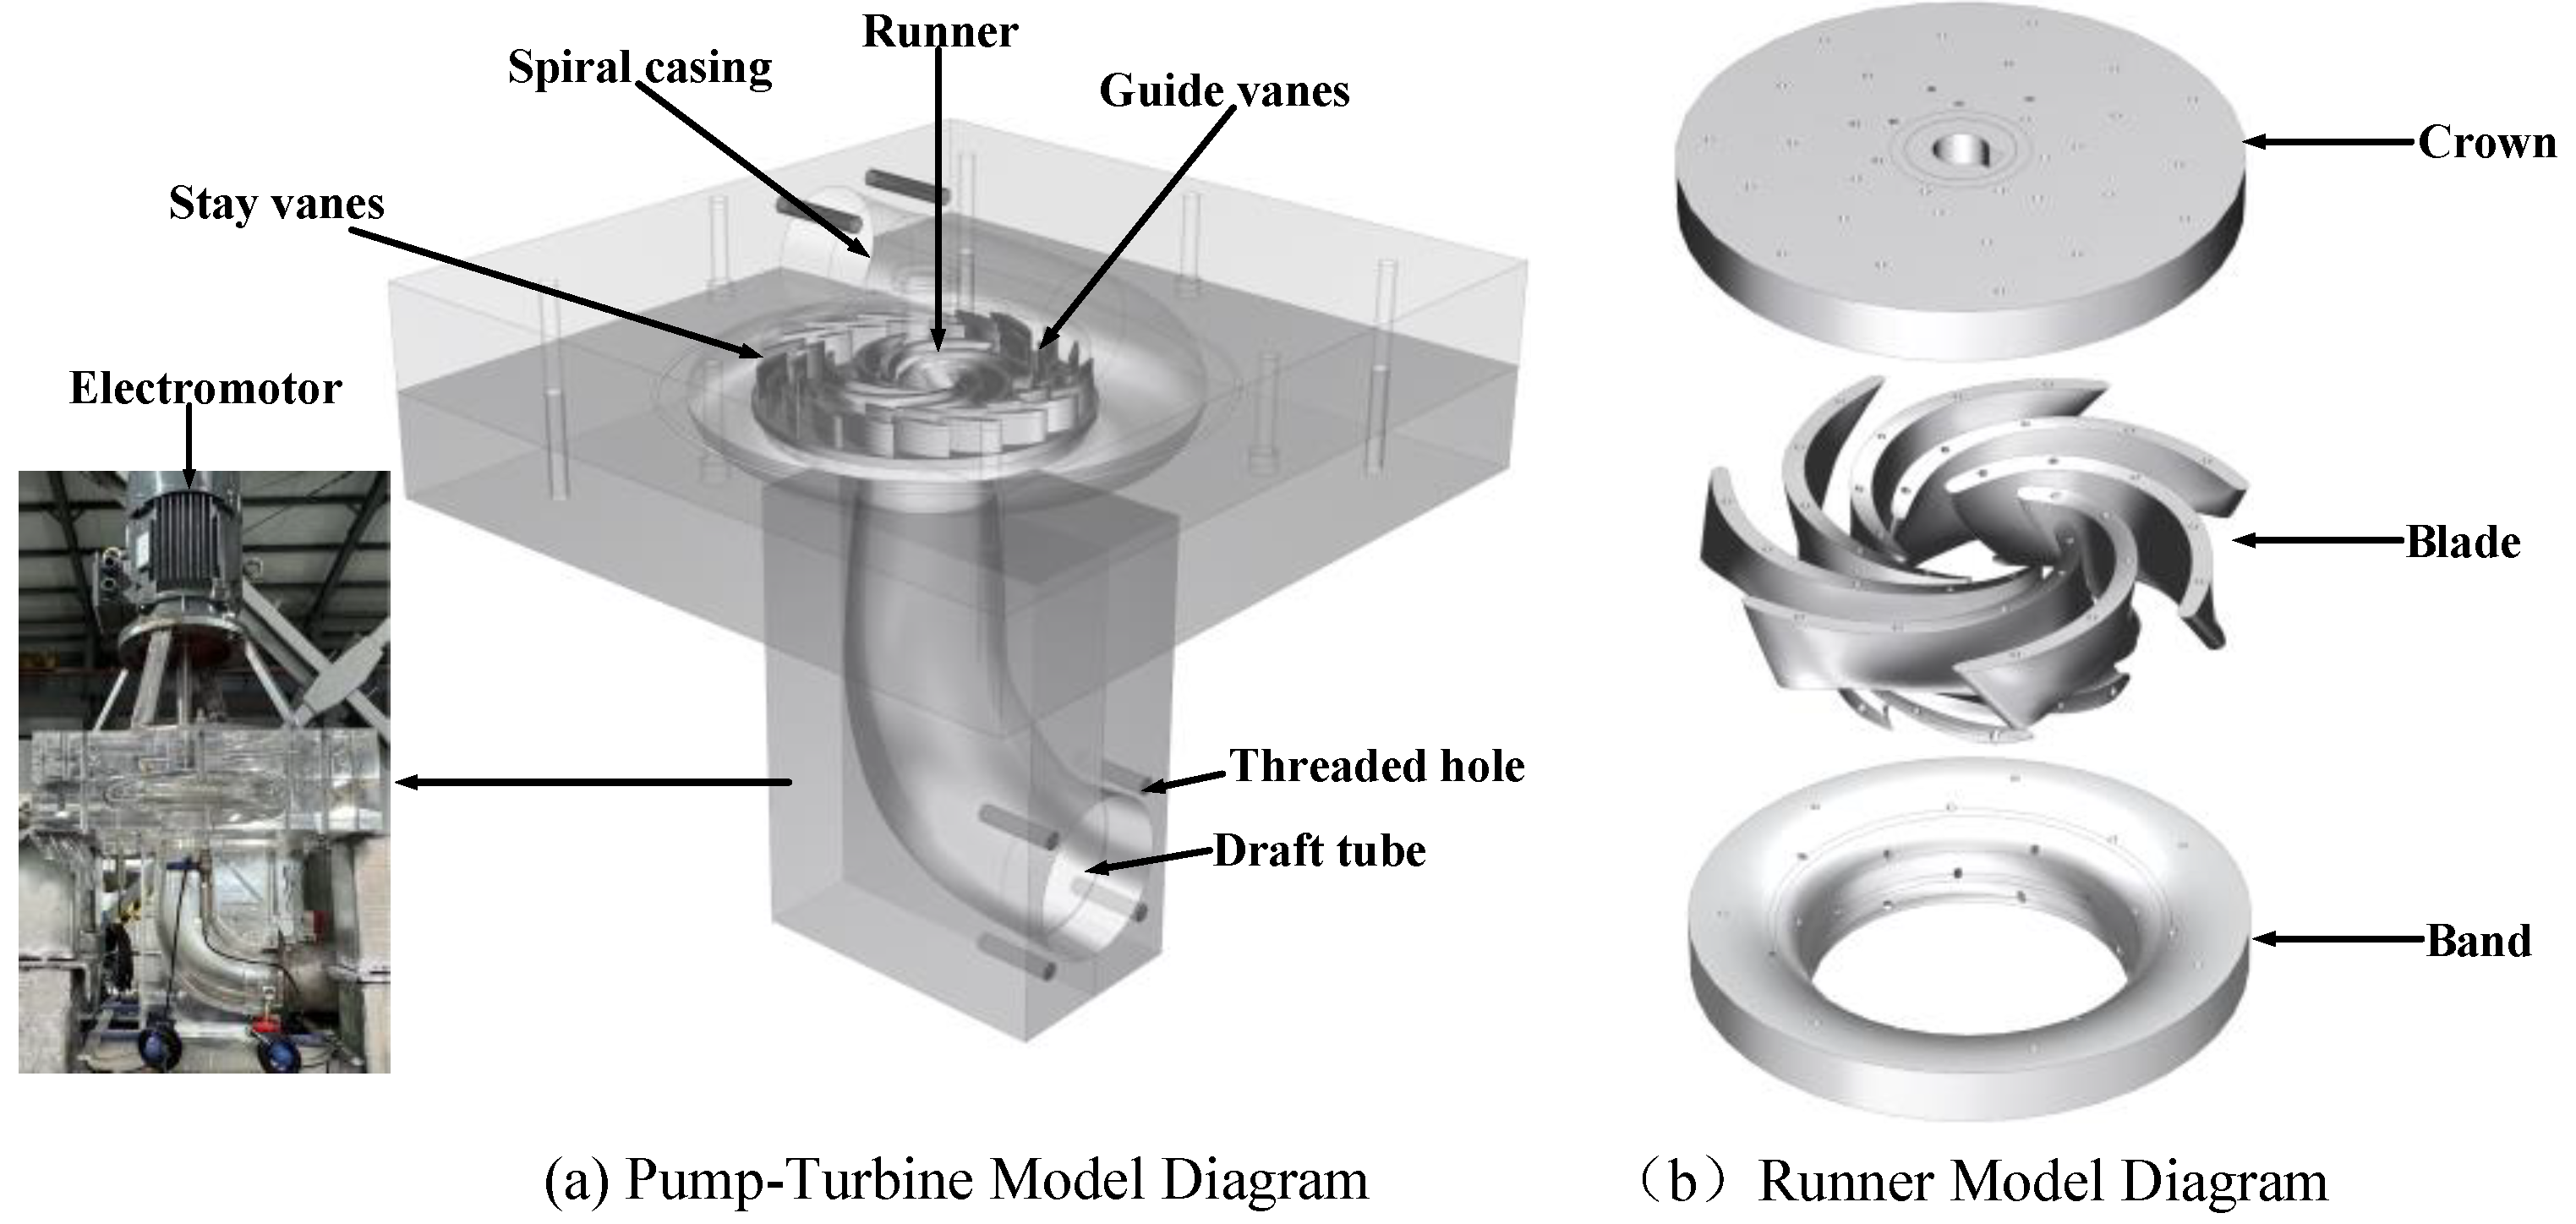
3.1. Construction of the 3D Model for Pump Turbine

The model used in this study was constructed based on the data from the pump-turbine model. Figure 4 shows the pump-turbine and runner model diagram. The main flow passage components of the turbine include five parts: the volute, runner, fixed guide vanes, adjustable guide vanes, and draft tube. The model consists of 19 adjustable guide vanes, 19 fixed guide vanes, and 7 runner blades. Other model parameters are listed in Table 1.

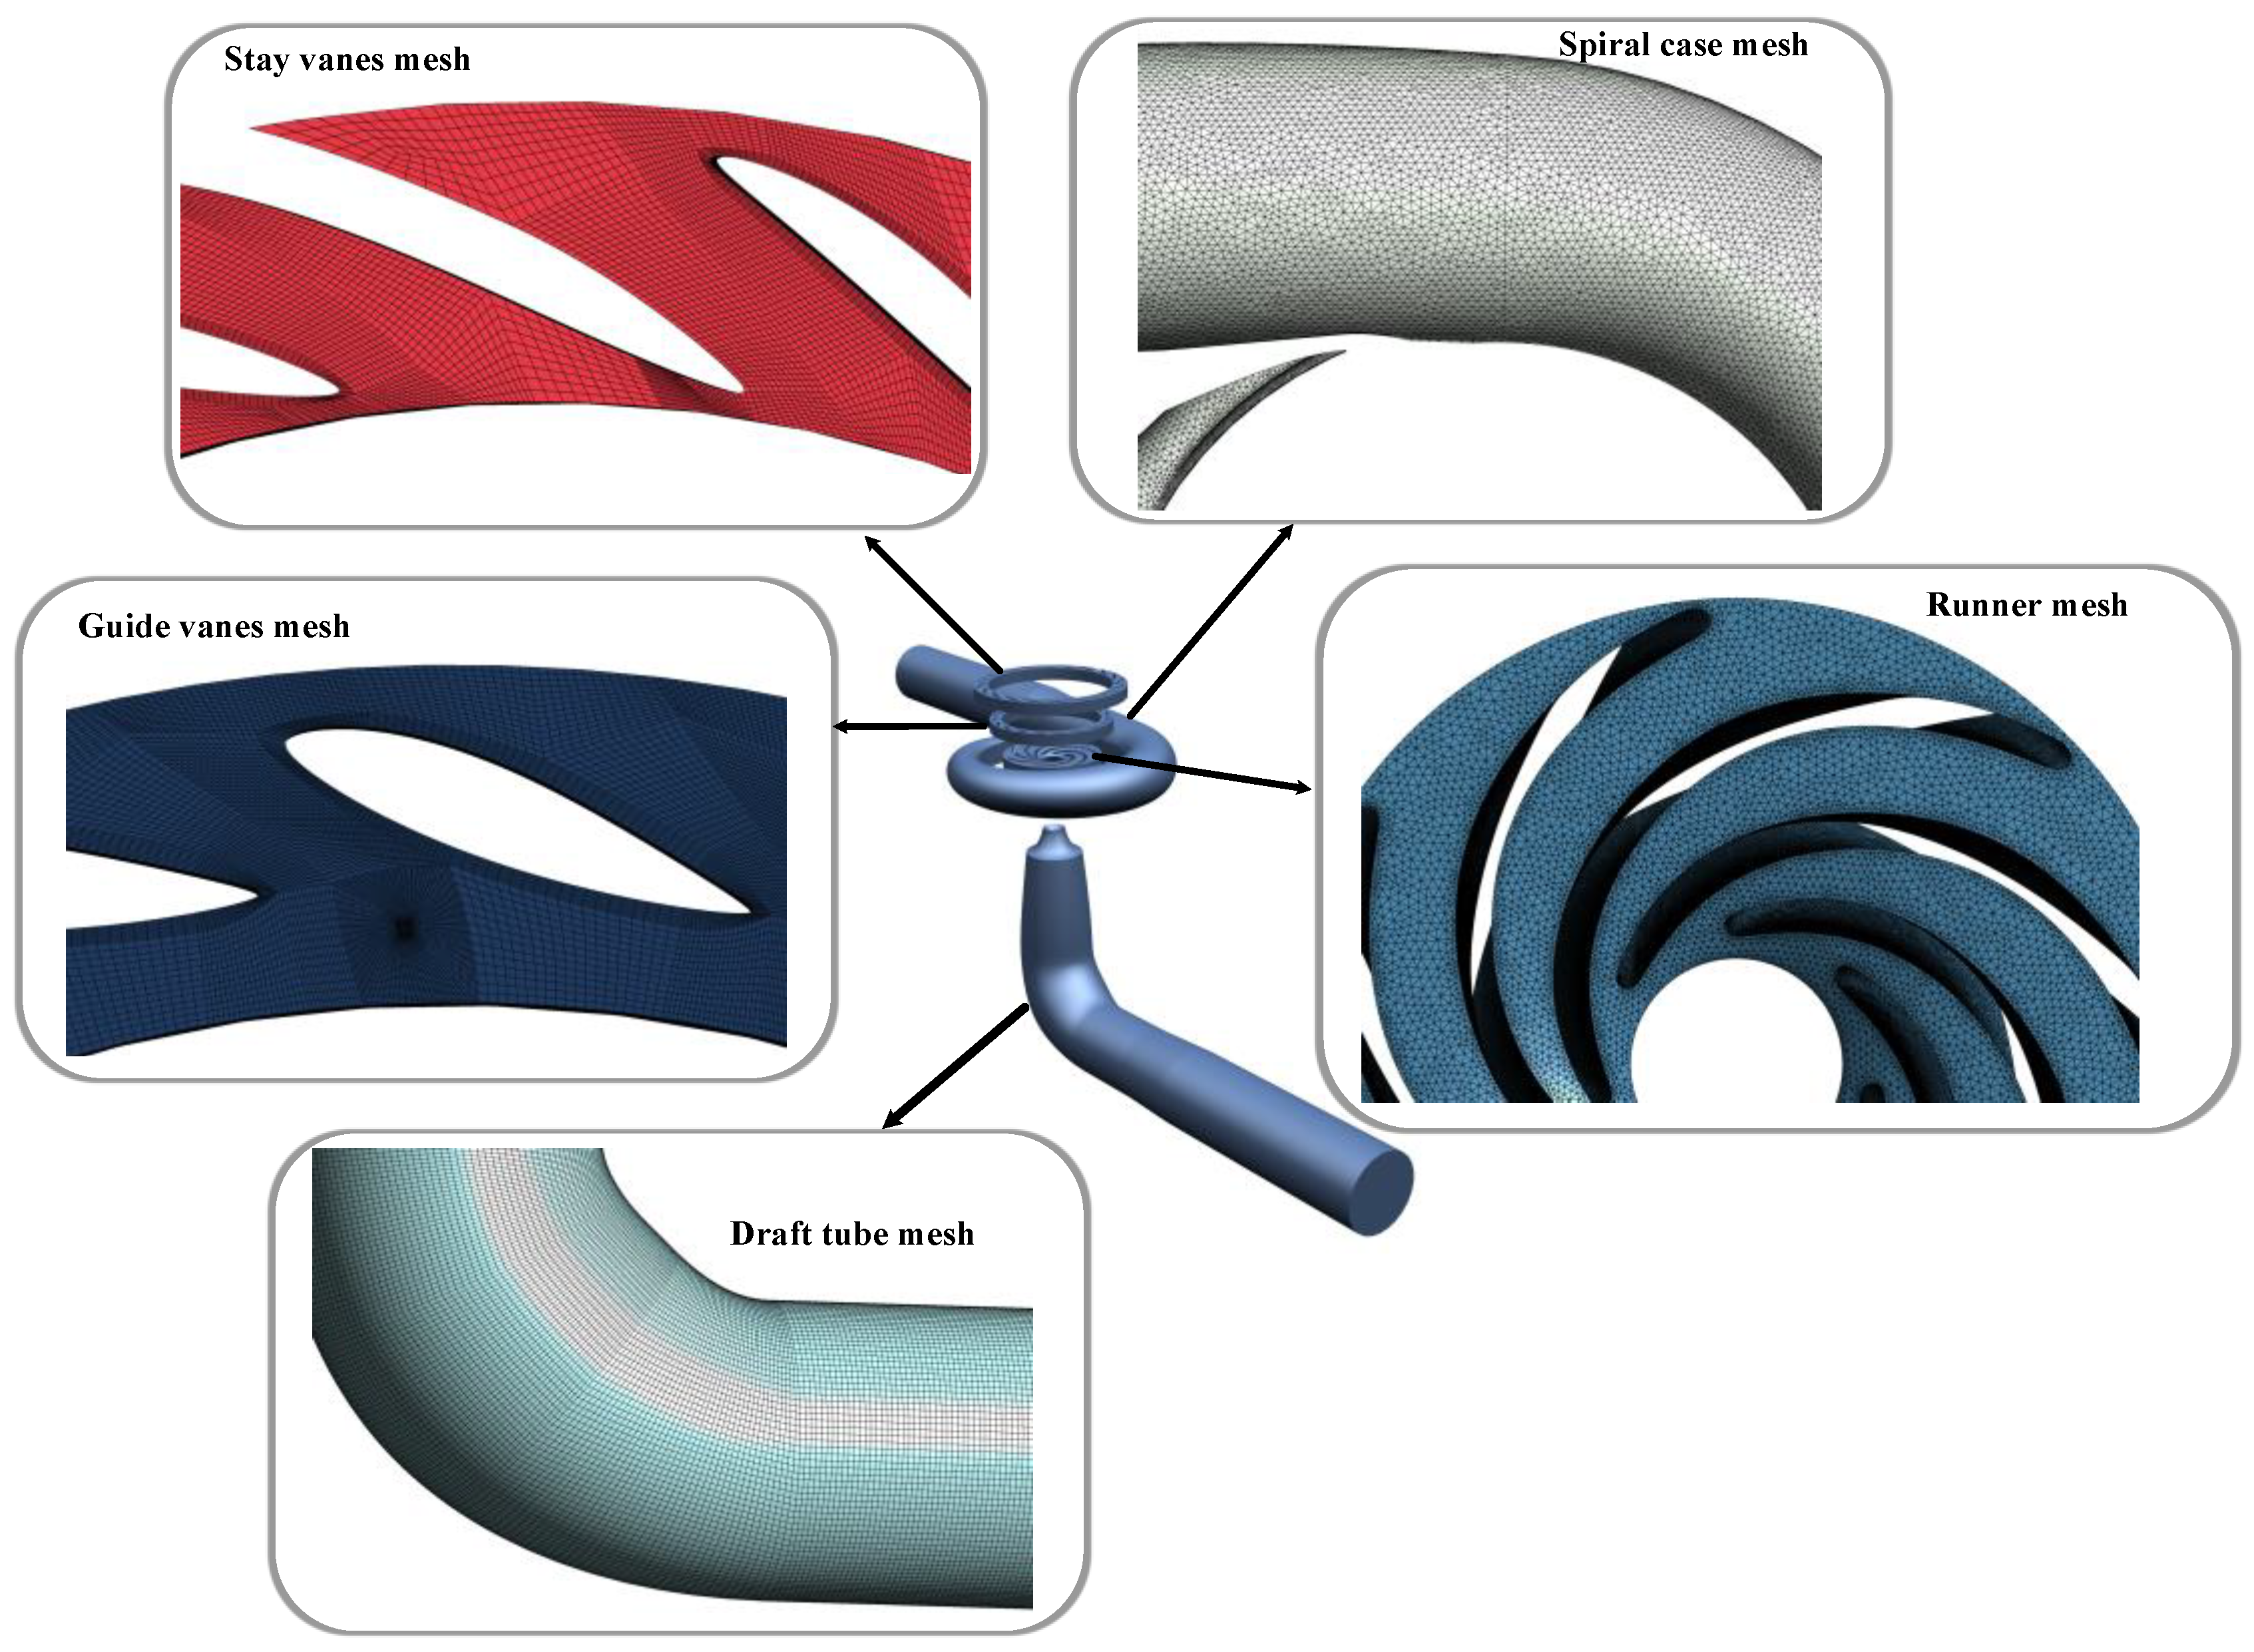
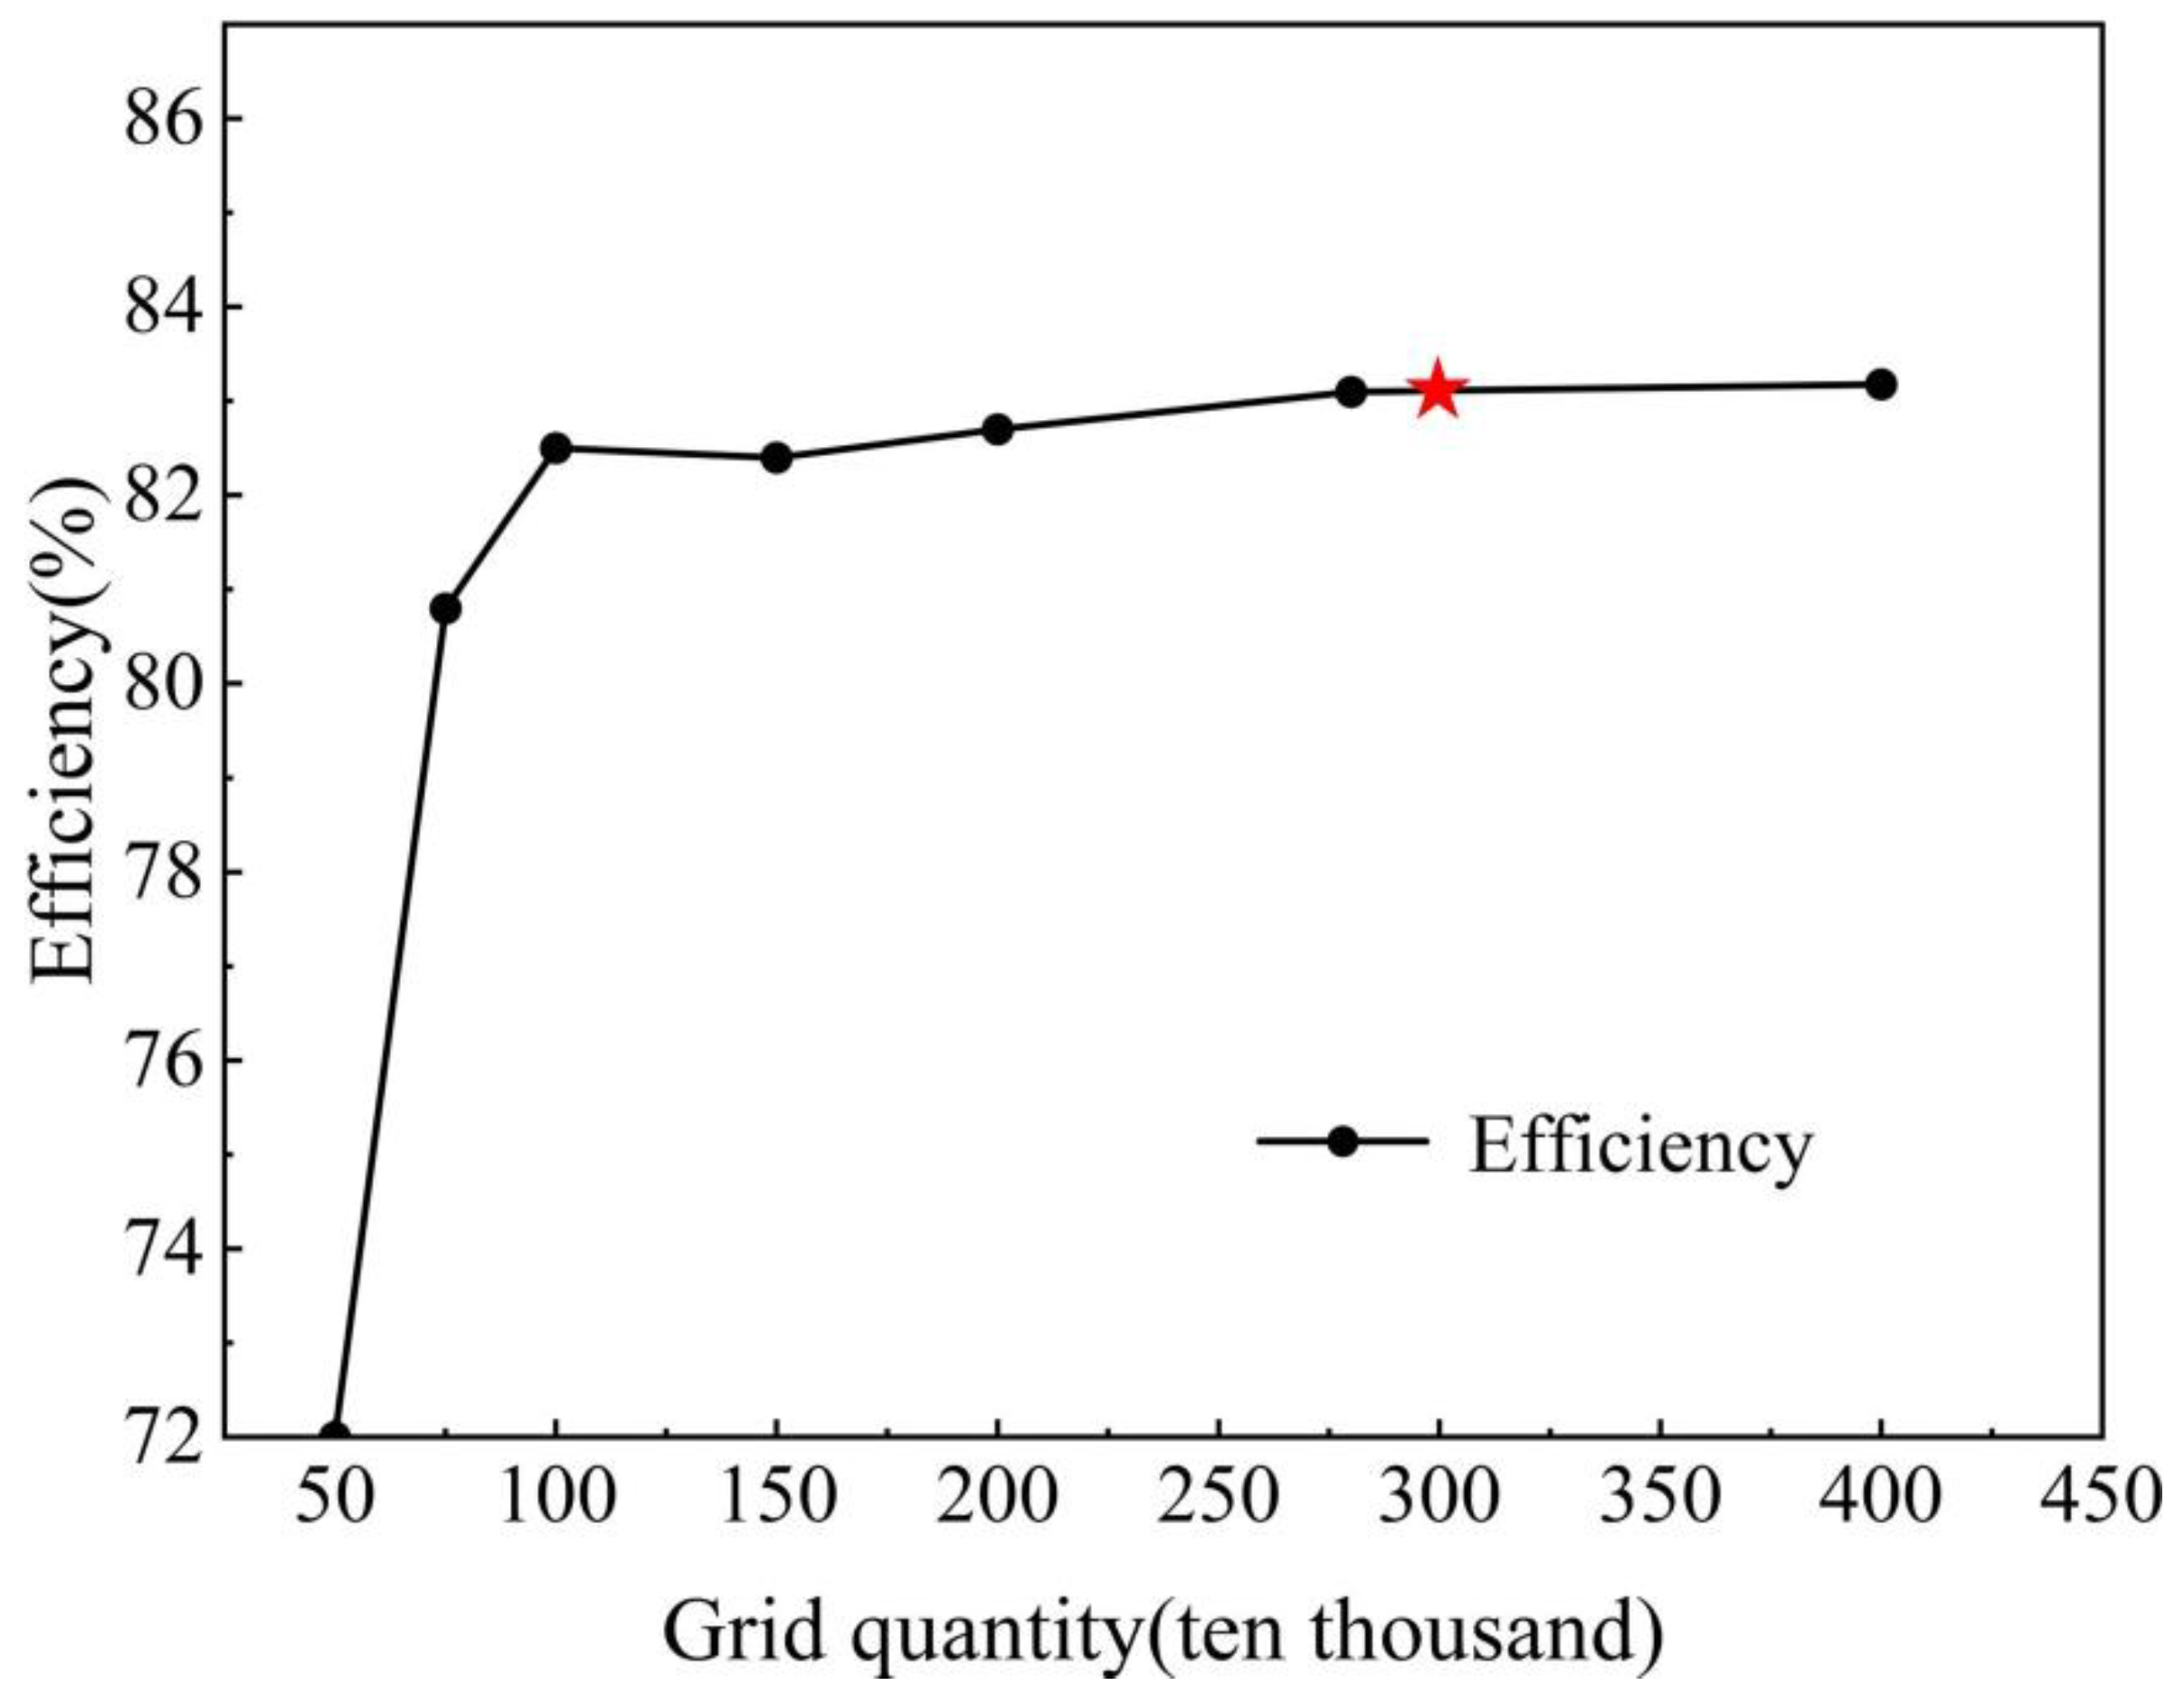
3.2. Mesh Generation

The quality of the mesh affects the accuracy and efficiency of the calculations. As a geometric representation of the model, the mesh also serves as a crucial component for computational fluid dynamics (CFD) numerical computations. The runner components are meshed via CFD ICEM software (2020 R2) with unstructured tetrahedral elements, and the boundary layers are refined appropriately to increase the computational accuracy, as shown in Figure 5.
To minimize the impact of the mesh density on the calculation results, six sets of meshes are generated, and a mesh independence test is conducted, as illustrated in Figure 6. The figure shows that as the number of mesh elements increases, the turbine efficiency improves. When the mesh density ranges between 3 million and 4 million elements, the efficiency of the turbine remains relatively stable, varying between 82.7% and 82.8%. To balance computational accuracy with resource efficiency, a final mesh of 3.01 million elements is selected.

3.3. Mathematical Models

3.3.1. Fundamental Equations

The flow within the turbine is simulated via the continuity equation for incompressible fluids and the Reynolds-averaged Navier–Stokes equations. Given that the working medium in the pump turbine is water and that minimal heat exchange occurs, only the continuity equation and the momentum equation are considered.
The continuity equation is as follows:
ρ t + ( ρ v ) = 0
where ρ is the fluid density and v is the velocity vector.
The momentum equation is as follows:
ρ t ρ v + ( ρ v v ) = p + τ ¯ ¯ + ρ F
where p is the pressure, τ ¯ ¯ represents the viscous stress tensor, and ρ F is the volumetric force.

3.3.2. Turbulence Model

The standard k ε turbulence model is employed, which involves solving two transport equations and provides reasonable accuracy across a broad range of turbulent conditions, thus demonstrating high convergence rates. The shear stress transport SST k ε model represents a numerically stable combination of two turbulence models. The k ε model is retained in the near-wall regions, whereas the k ε model is used in regions away from the walls. The accuracy of this model has been validated through studies of flow characteristics in turbines.
Consequently, the SST k ε model was selected as the turbulence model for transient numerical simulations [25,26,27]. Initially, a stable result was obtained from steady-state calculations, with a target residual convergence value set at 10−5. The stable result is used as the initial condition for unsteady calculations, with a time step of 2° and a maximum of 20 iterations per time step.
After achieving computational stability, sediment is introduced for unsteady calculations. The fluid is assumed to be an incompressible Newtonian fluid; therefore, the fluid flow satisfies the three fundamental equations of fluid dynamics: conservation of momentum, conservation of mass, and conservation of energy [28].
The SST k ε turbulence equations are as follows:
ρ k t + ρ k u i ¯ t = Γ k k x j x j + F k Y k
ρ ω t + ρ ω u j ¯ x i = Γ ω ω x i x i + F ω Y ω + D ω
where k represents the turbulent kinetic energy; t denotes time; ρ signifies density (kg/m3); u i ¯ indicates the mean turbulent velocity; x stands for coordinate components; ω denotes the turbulence dissipation rate; Γ k and Γ ω represent effective diffusion coefficients; F k and F ω are the turbulence production terms; Y k and Y ω signify the dissipation terms for k and ω ; and D ω represents the diffusion term.

3.3.3. Erosion Model

After accurate flow field information is obtained, the sediment is tracked individually to predict erosion. The DPM is employed to track sediment motion, considering the drag force, pressure gradient force, and virtual mass force. The erosion prediction models commonly used include those by Finnie, McLaury, and Oka. In this study, the generic model is utilized. This model offers high degrees of freedom and allows for adjustment of parameters to match actual conditions [29].
The generic erosion model average erosion rate ( E g ) and accretion rate ( R a c c r e t i o n ) calculated via the generic erosion model are as follows:
E g = p = 1 N p a r t i c l e s m ˙ p C d p f γ v b v A f a c e
C d p = 1.559 e 6 B 0.59 × ϕ
v b v = v 1.73
f γ = 0 + 22.7 γ 38.7 γ 2 2 + 6.8 γ 7.5 γ 2 + 2.25 γ 3 γ 0.267   rad γ > 0.267   rad
R a c c r e t i o n = p = 1 N p a r t i c l e s m ˙ p A f a c e
where E g represents the erosion rate, kg/m2s; R a c c r e t i o n represents the accretion rate, kg/m2s; d p represents a function of the particle diameter; γ denotes the particle impact angle (rad); f γ is the relative velocity of particles; v is the impact angle function; b v denotes the relative velocity function of the particles; A f a c e represents the area of the wall face where the particle strikes the boundary, m2; m ˙ p is the mass flow rate of particles colliding with the wall surface, kg/s; ϕ denotes the particle shape factor coefficient (1.0 for angular/angular sand, 0.53 for semicircular sand, and 0.2 for full circular sand, used in this study). In this work, fully circular sand grains are assumed, as they closely resemble the natural quartz sand typically found in southwest China’s rivers, and B represents the Brinell hardness of the material. For acrylic glass, a widely used material in sediment erosion studies due to its transparency and well-documented properties, B = 20.

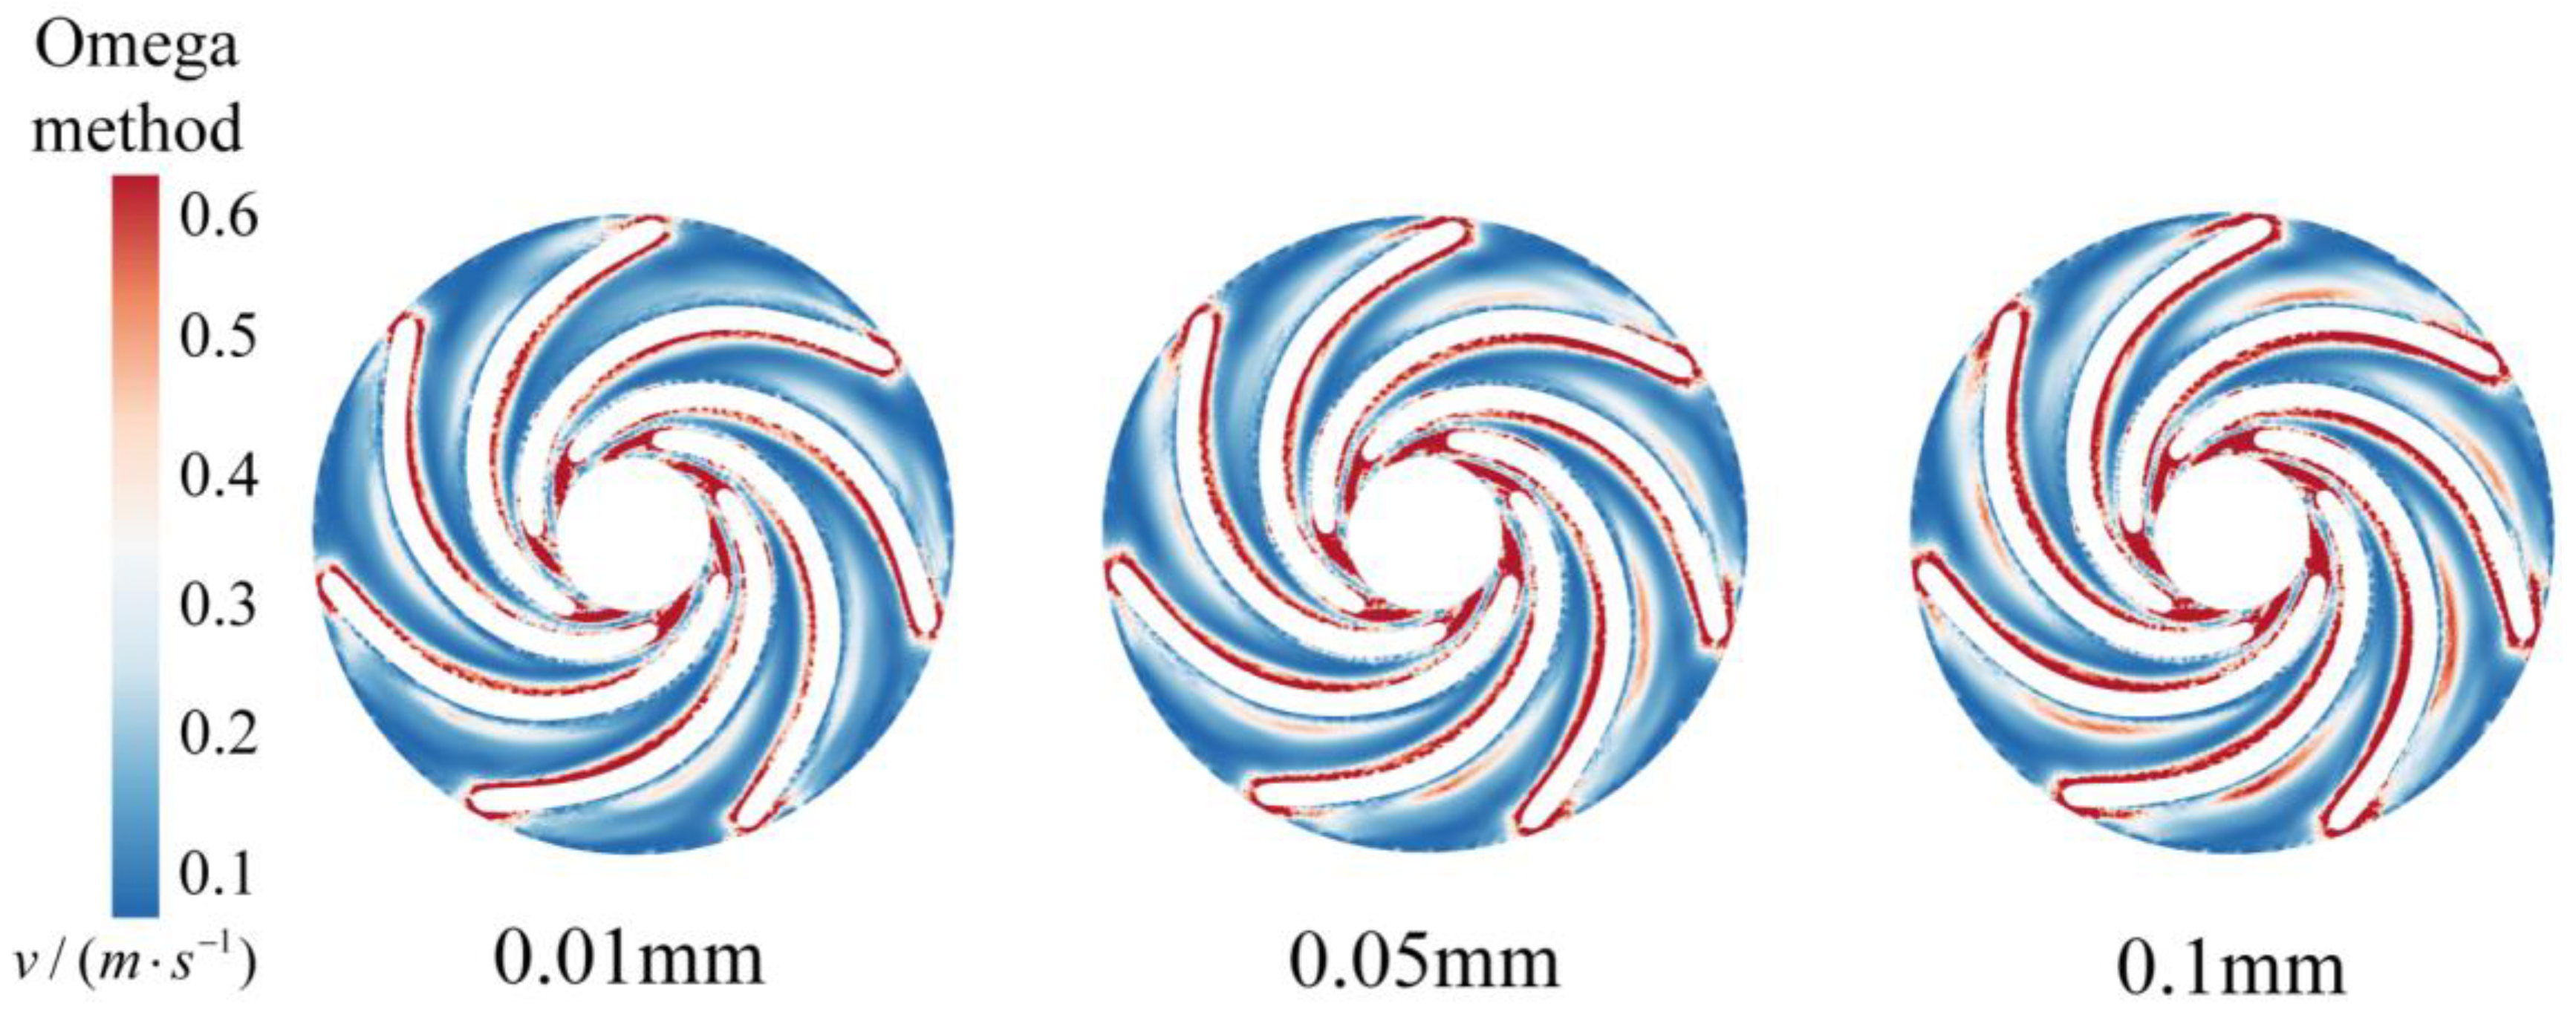
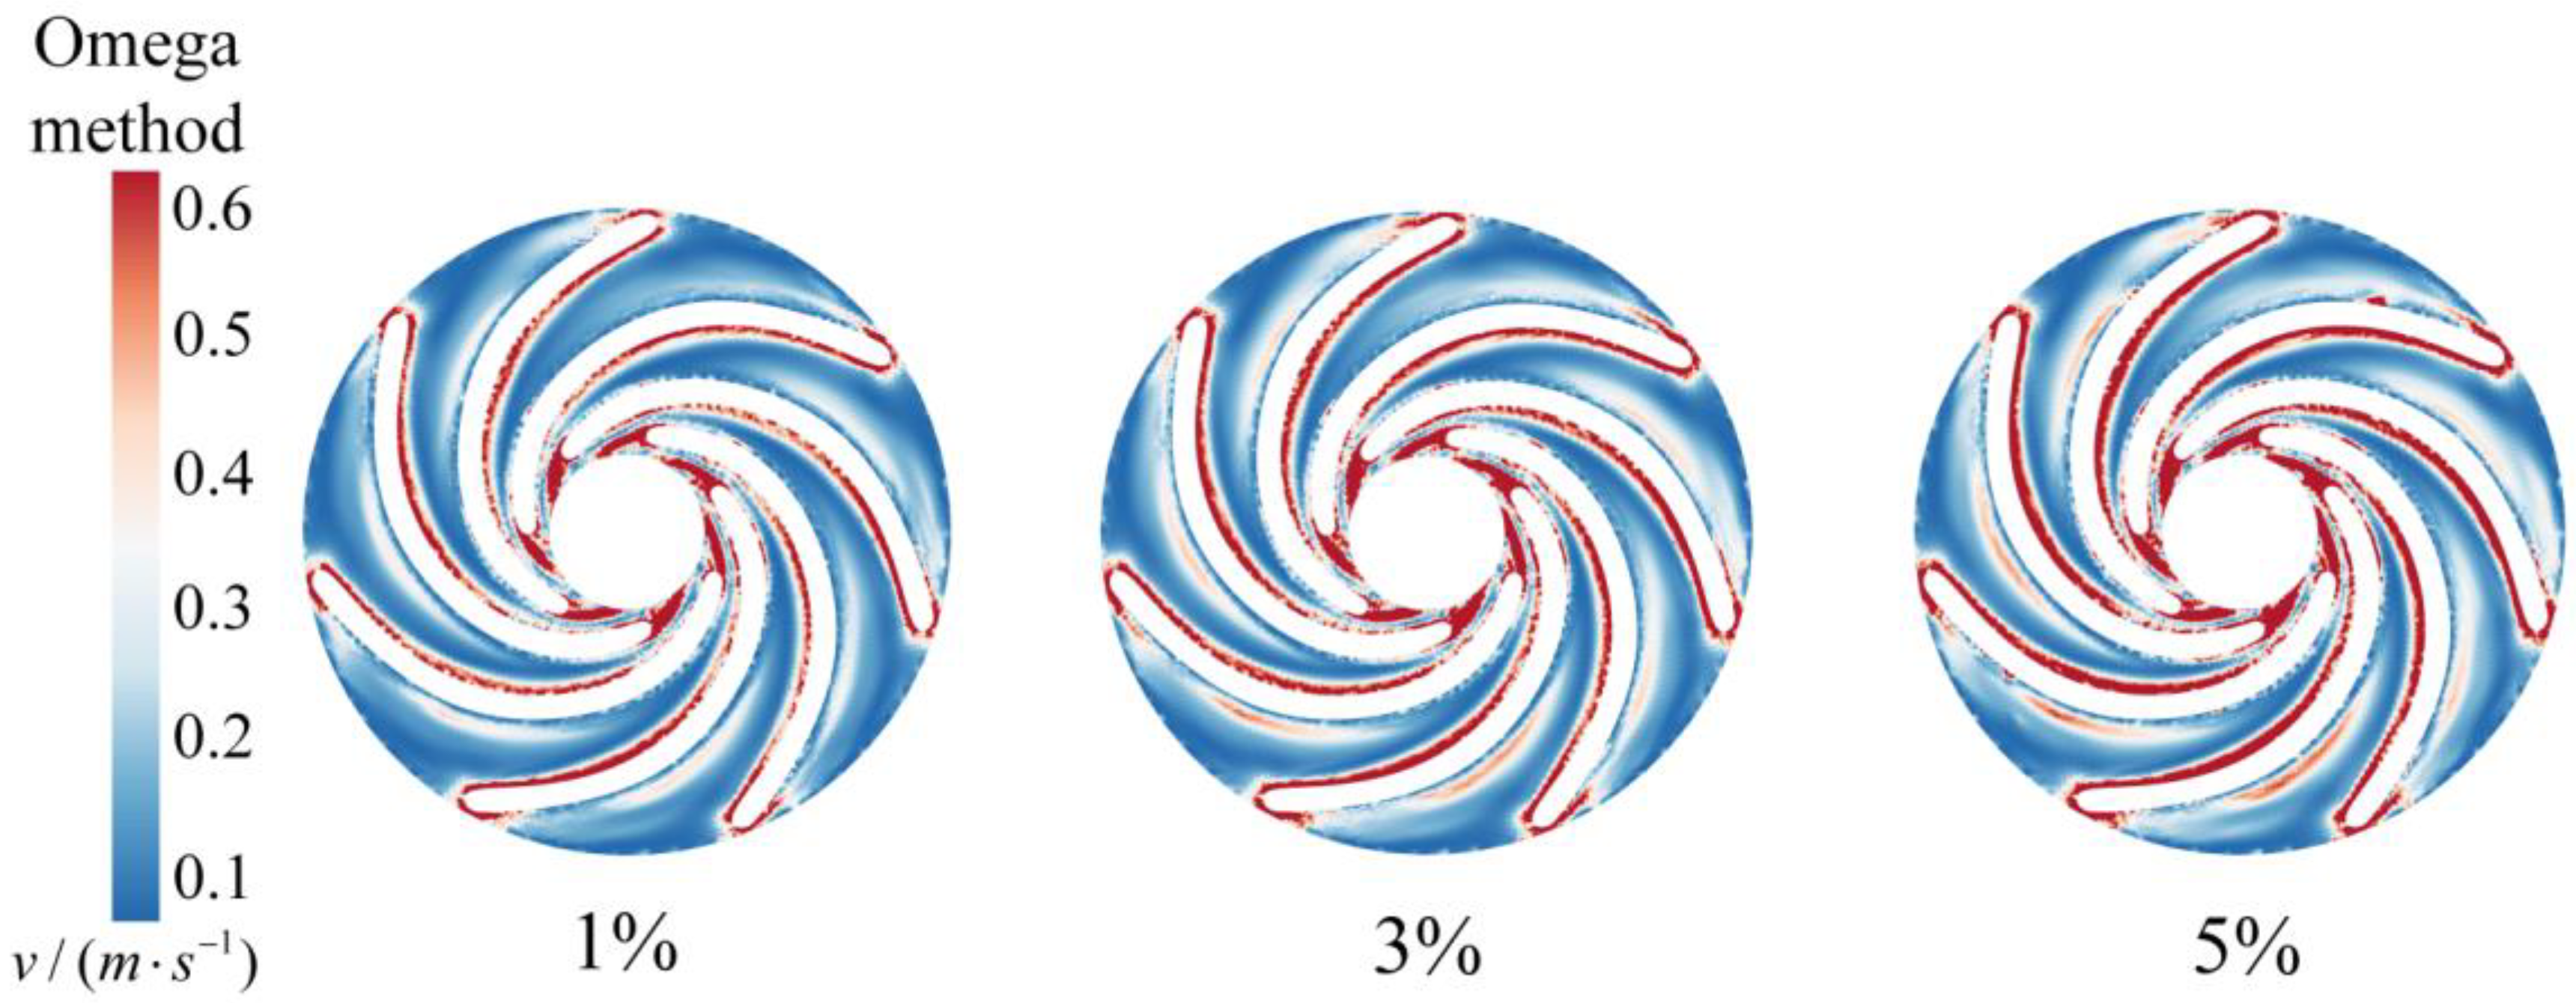
3.3.4. Omega Vortex Identification Theory

The Omega vortex identification method was proposed by Liu et al. [30], which decomposes vorticity into rotational and nonrotational components. The parameter Ω is introduced to represent the proportion of the rotational component of vorticity relative to the total vorticity. The calculation formula for Ω is given by
Ω = B F 2 A F 2 + B F 2 + ε
where A represents a symmetric tensor; B denotes an antisymmetric tensor; and ε is a positive constant introduced to prevent division by zero.
The value of Ω ranges from 0 ≤ Ω ≤ 1.00, which can be interpreted as the concentration of vorticity. Specifically, Ω represents the rigidity of the fluid motion. When Ω = 1.0, the fluid undergoes rigid body rotation. When Ω > 0.50, the antisymmetric tensor B is equivalent to the dominance of the symmetric tensor A.

3.4. Boundary Conditions and Computational Settings

(1)
Boundary conditions: This study investigates the operating conditions of turbines in a pump-turbine system, with calculations performed via FLUENT (Ansys Fluent 2020R2) software for solid–liquid two-phase flow. Initially, numerical simulations are conducted for clear water conditions, with the medium set to water at 25 °C (density of 998 kg/m3). The inlet of the computational domain is positioned at the volute inlet, whereas the outlet is set at the draft tube exit, with the boundary condition defined as a pressure outlet. The runner wall is modelled as a rotating wall with the same rotational speed as the runner, whereas the other walls are modelled as no-slip walls. The wall roughness is disregarded, and standard wall functions are applied near the wall. The SIMPLE algorithm is used to solve discretized equations with a second-order upwind scheme, enabling the separation of pressure and velocity variables. The residual convergence criterion is set to 10−6.
(2)
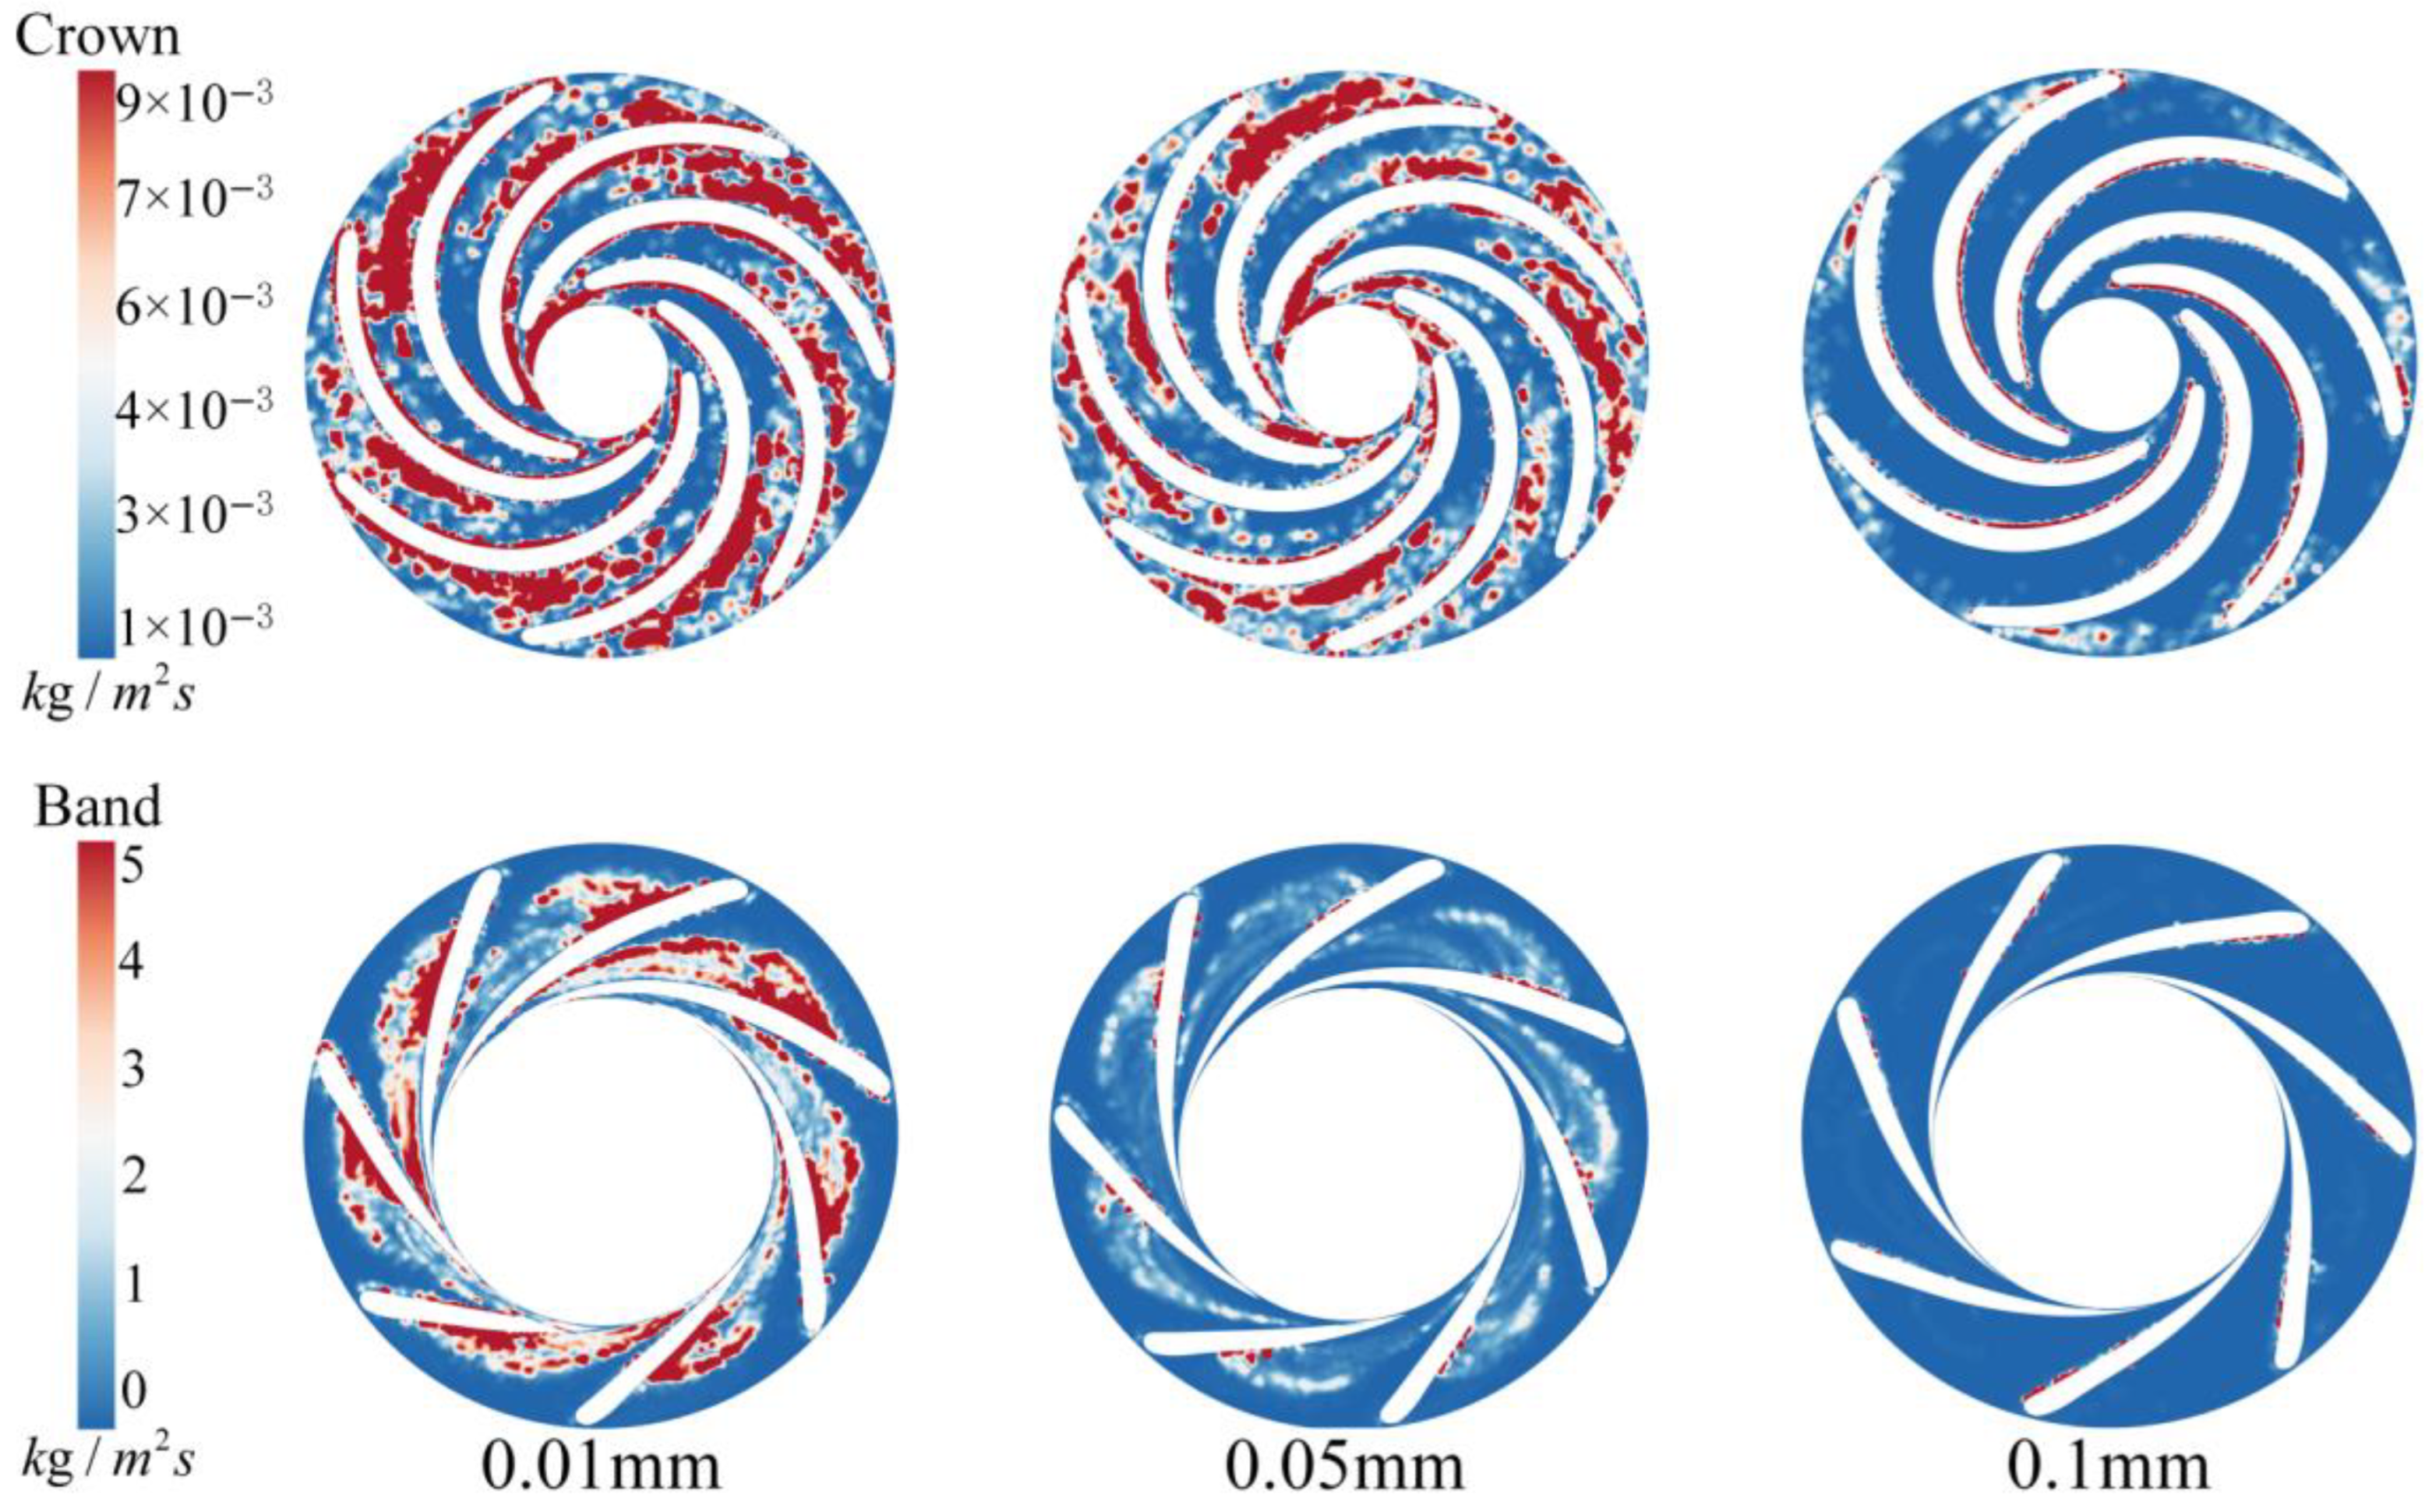
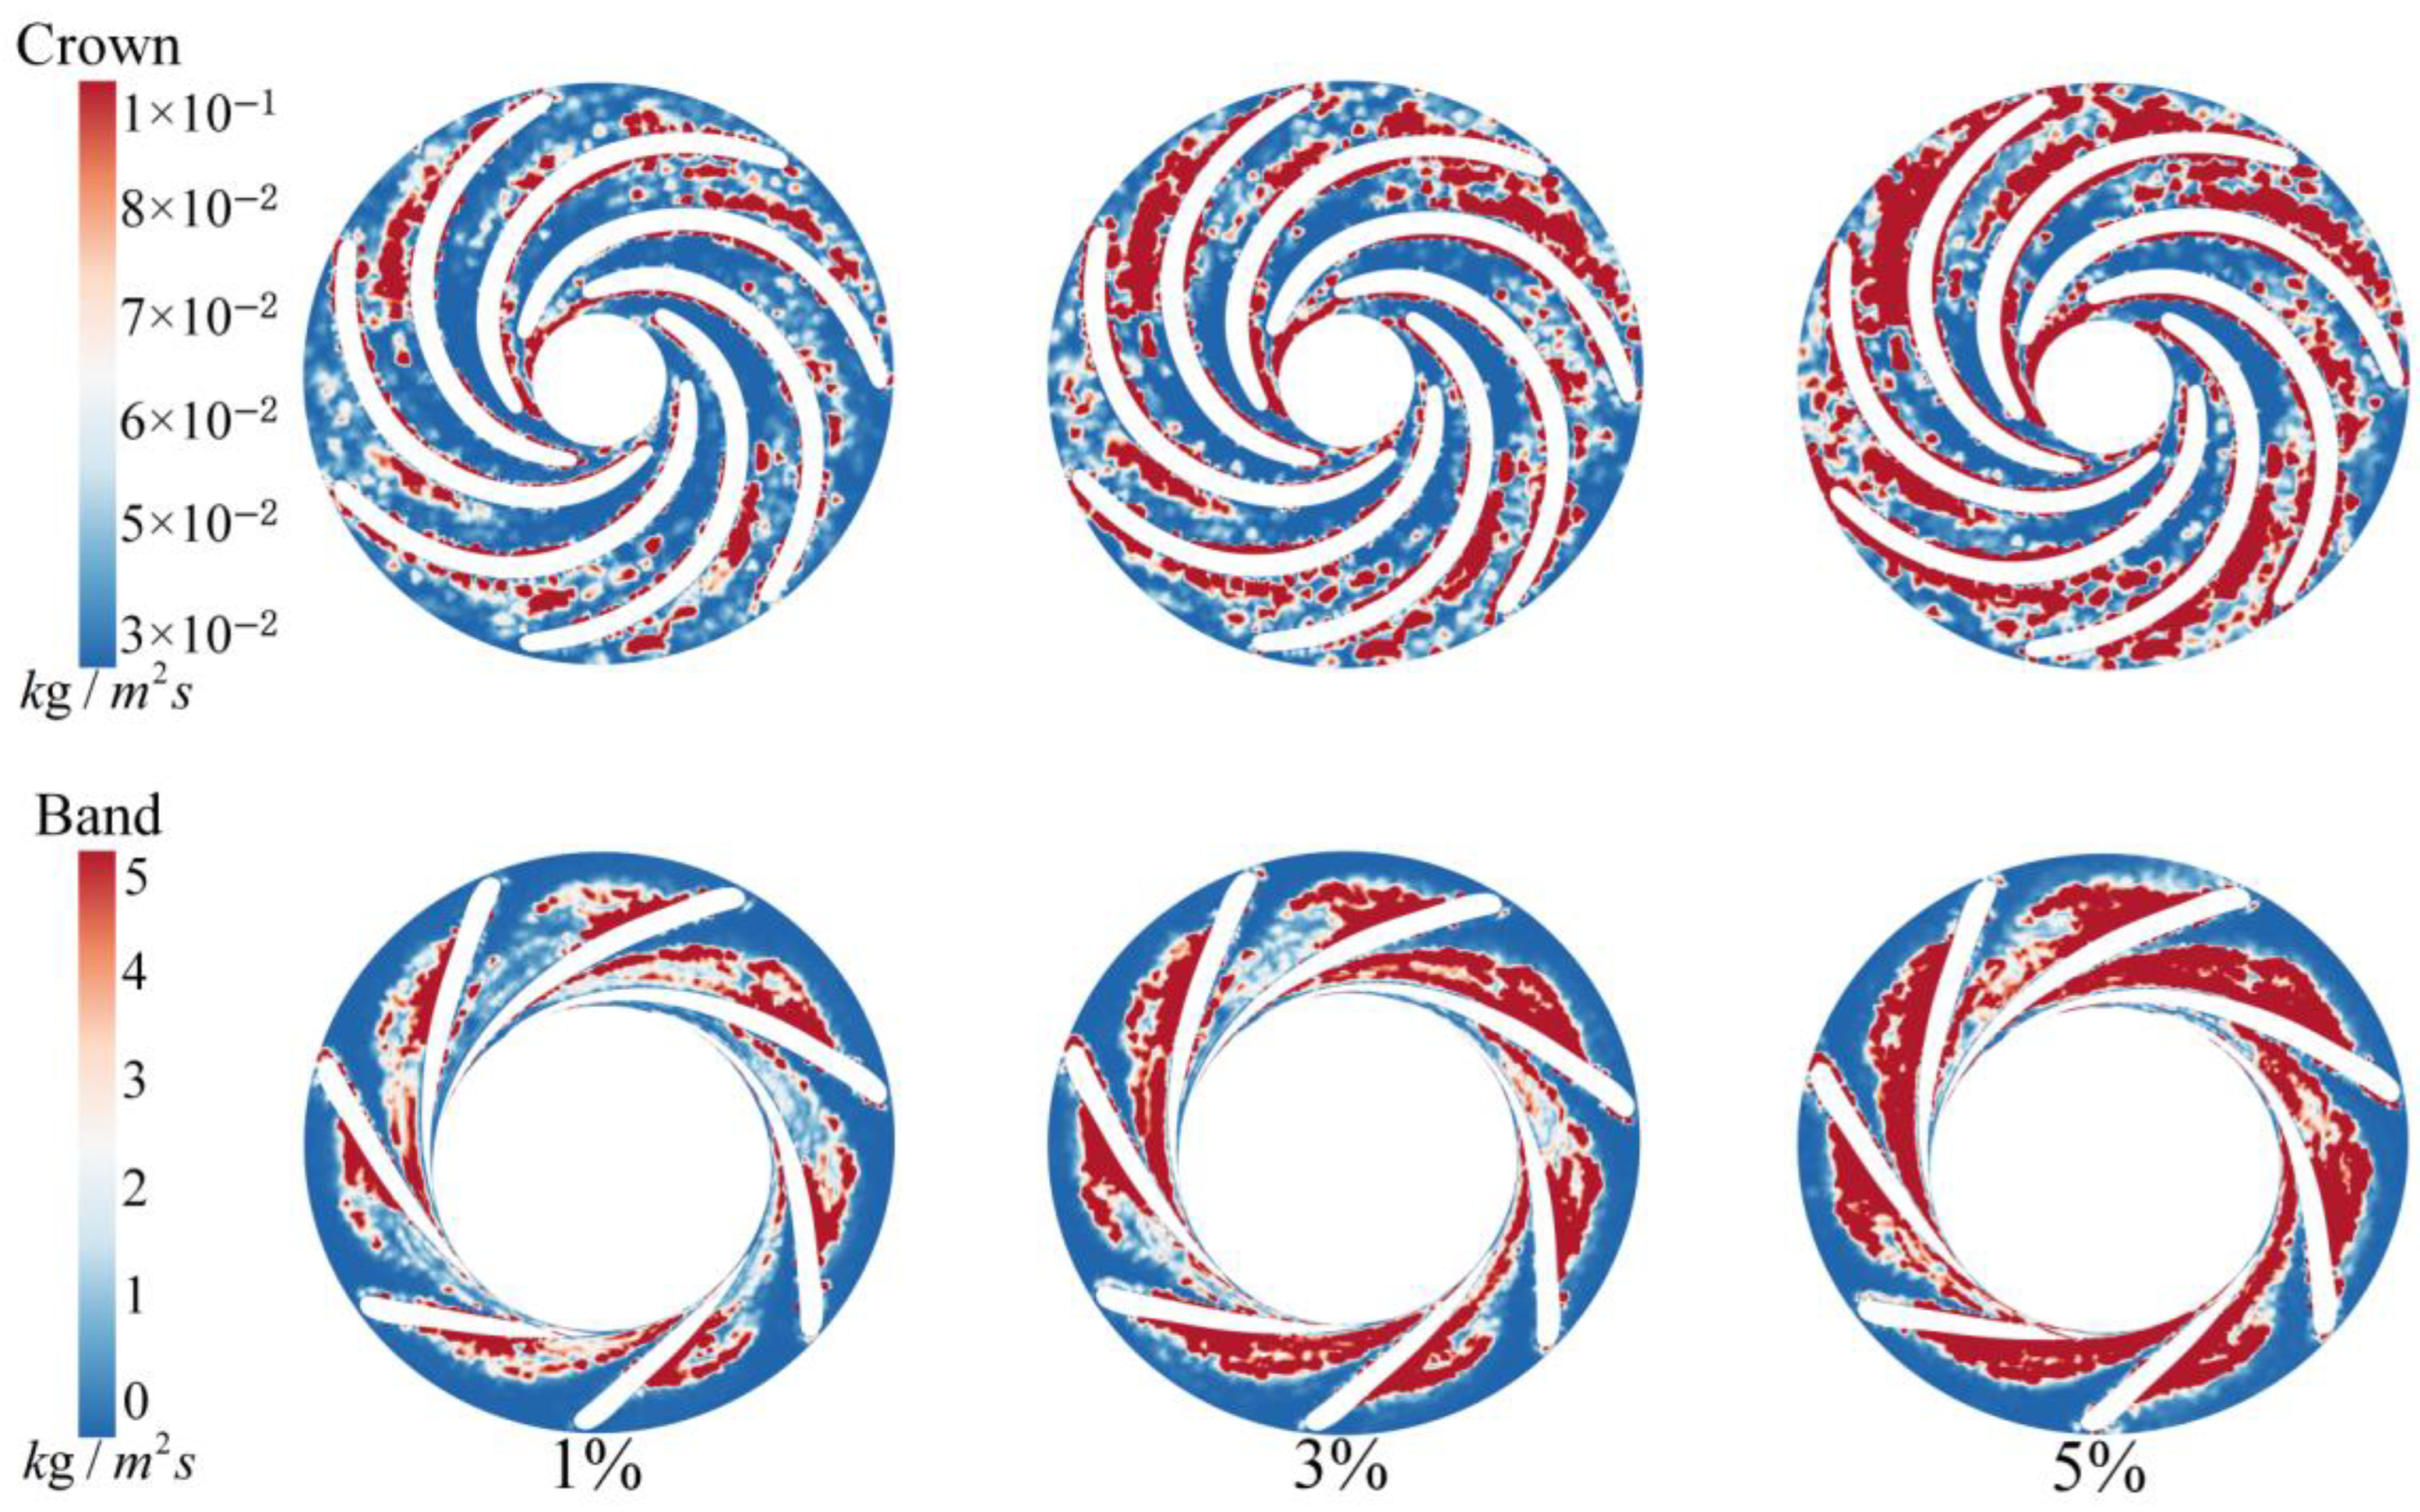
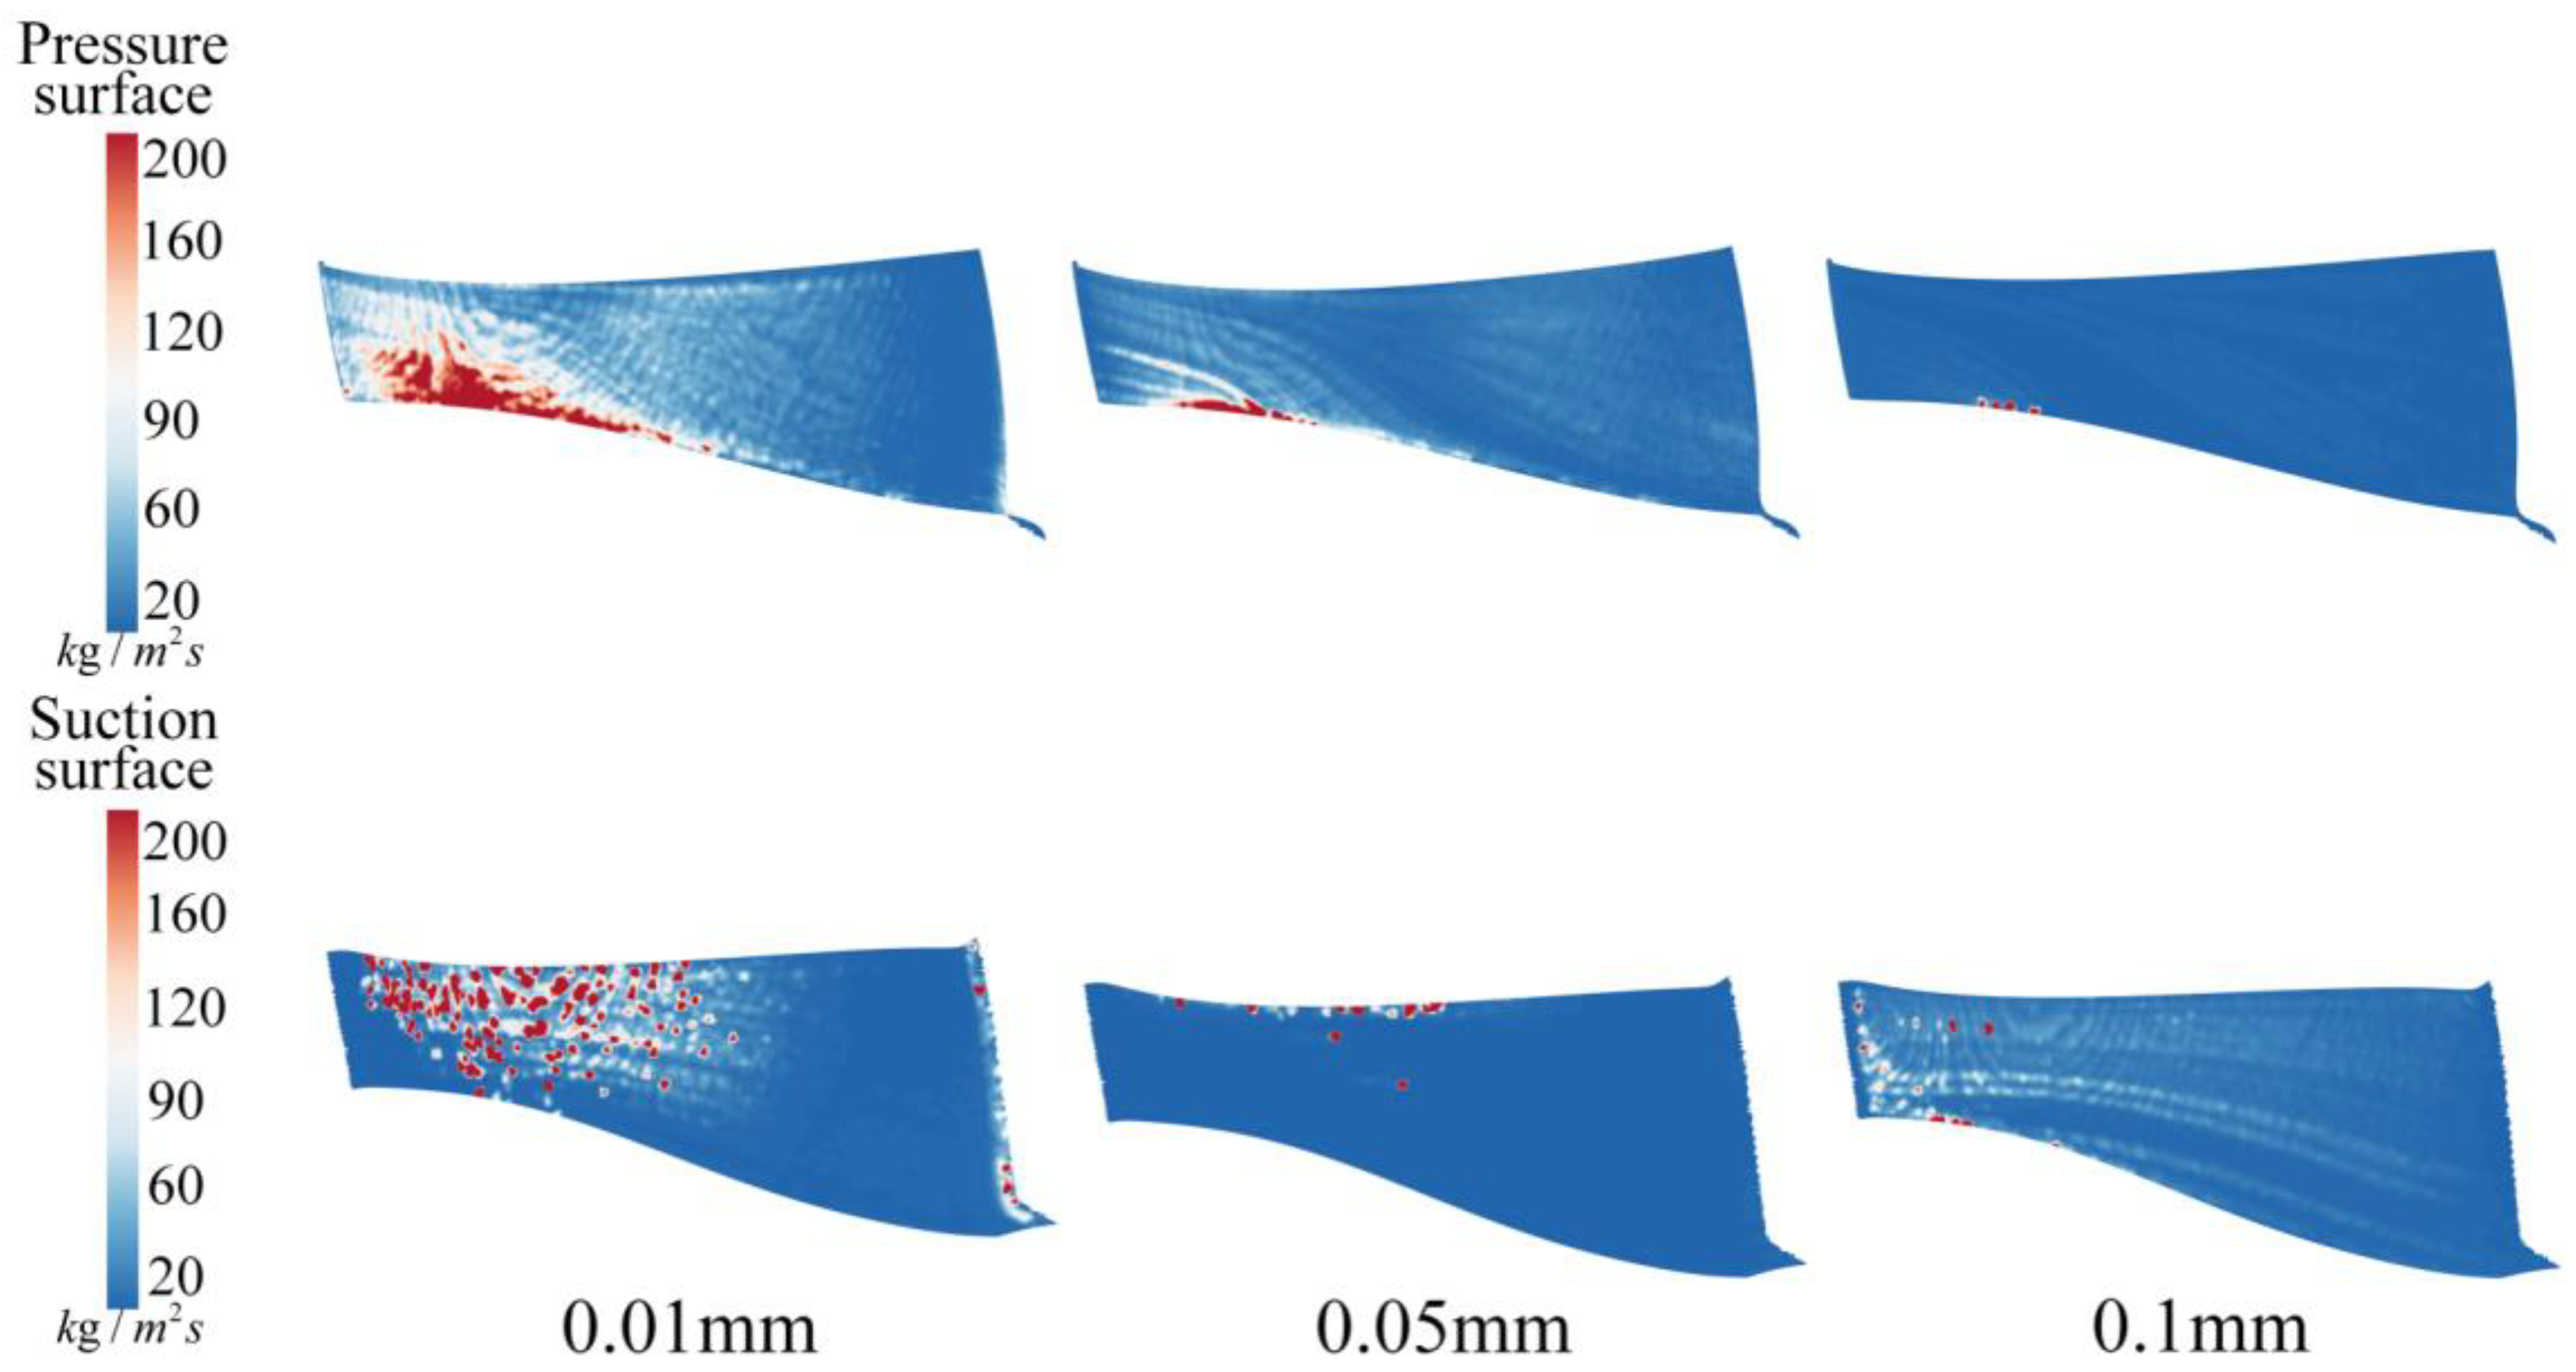
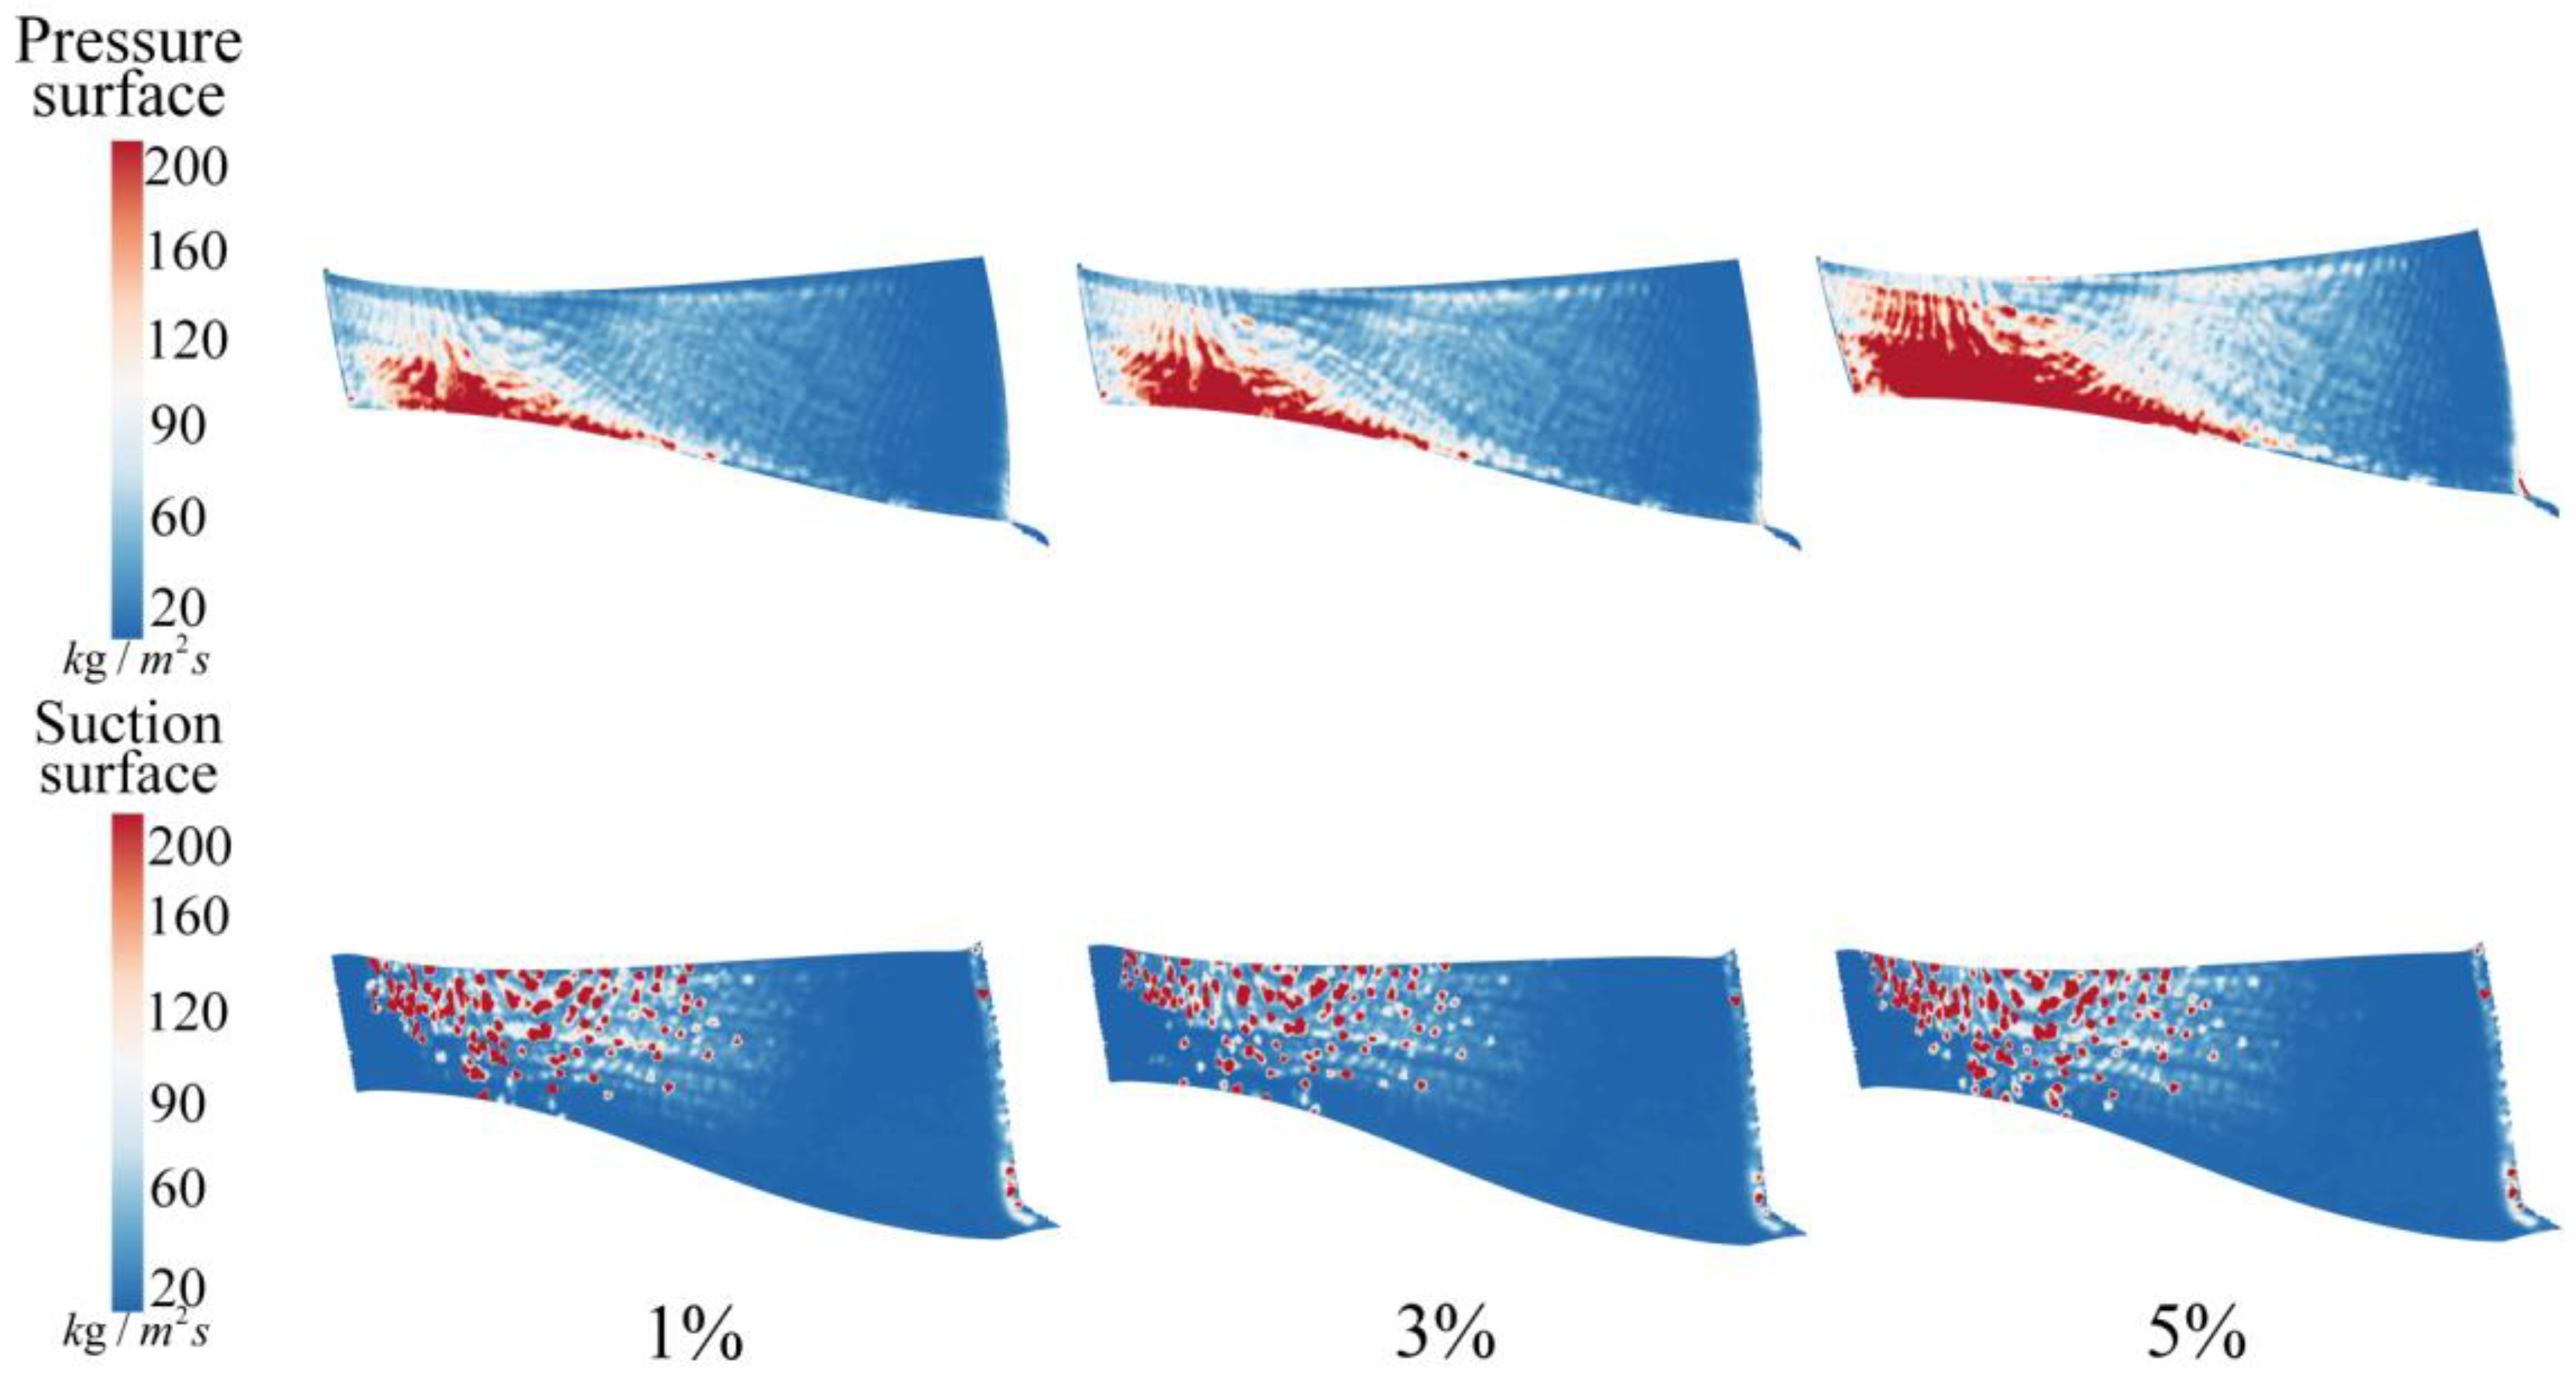
Computational procedure: Steady-state results are computed first to obtain a stable solution, which is then used as the initial condition for unsteady solid–liquid calculations. For the unsteady solid–liquid simulations, sediment is injected at the volute inlet via the DPM. A time step of 2° of runner rotation, equivalent to 3 × 10⁻⁴ s, is used, with a total simulation duration corresponding to 20 revolutions of the runner, or 1.2 s. According to the China River Sediment Bulletin, the typical sediment particle sizes range between 0.005 mm and 0.1 mm, while the sediment density varies from 2400 kg/m3 to 2700 kg/m3 [31]. Therefore, the sediment density is set to 2650 kg/m3; the sediment diameters are d = 0.01 mm, 0.05 mm, and 0.1 mm; and the sediment concentrations are 1%, 3%, and 5%, respectively.

4. Results and Discussion

The efficiency of the pump turbine under different solid-phase conditions is illustrated in Figure 7a. At a lower sediment concentration (1%), the impact of particle size on efficiency is relatively small. However, as the sediment concentration increases to 3% and 5%, the efficiency of the runner shows more pronounced changes with increasing particle size. This phenomenon can be attributed to the fact that, under low sediment concentration conditions (1%), the total number of sediment particles is relatively small, and the influence of particle size on the particle count is minimal. As the sediment concentration increases, the impact of particle size on the number of sediment particles becomes more significant, thereby affecting the variation in efficiency.
Figure 7b displays the change in turbine efficiency with sediment concentration at a constant particle size. When the sediment particle size is relatively small (d = 0.1 mm), the turbine efficiency gradually decreases as the sediment concentration increases. In contrast, when the sediment particle size is relatively large (d = 0.35, 0.45, 0.5 mm), the turbine efficiency initially increases within a certain concentration range but begins to decline as the sediment concentration further increases. This phenomenon can be attributed to the following reasons: under low sediment concentration conditions, large-diameter sediment particles help alleviate localized flow separation in the flow passage, optimizing the flow field distribution and improving efficiency. However, as the concentration of large-diameter sediment increases, the frequency of energy exchange between the sediment particles and the runner blades increases, resulting in significant energy losses. Additionally, the erosion and abrasion caused by sediment particles on the blade surfaces may deteriorate the original hydraulic performance design, ultimately reducing turbine efficiency. The sediment concentration has a greater effect on turbine efficiency than does sediment particle size because the effect of sediment concentration on turbine efficiency is more pronounced than that of sediment particle size.

4.1. Vortex Structure Characteristics in the Runner Region Under Different Solid-Phase Conditions

As presented in Figure 8 and Figure 9, the Omega vortex identification distribution maps at the runner Z = 0 interface are shown under different solid-phase conditions. Strong vortices are clearly concentrated in the inlet region of the pressure side of the blade, the entire suction side of the blade, and the outlet of the runner, which is a region of intense vortex activity. Even in the midsection of the pressure side of the blade, some vortices and unstable flow phenomena are still detectable.
Figure 8 shows that as the sediment particle diameter increases, the strong vortex structures in the inlet region of the pressure side of the blade begin to extend significantly backwards and gradually form strong vortex structures in the midsection of the blade’s working surface. As the sediment particle diameter continues to increase, this trend extends further until it covers the entire working surface of the blade. Larger sediment particles create stronger disturbances and wake effects in the fluid, enhancing local instability and turbulence intensity, thereby affecting the formation and evolution of vortex structures.
Figure 9 illustrates that as the sediment concentration increases, strong vortex structures still initially form in the midsection of the blade’s working surface, and the strong vortex structures in the inlet region of the blade’s pressure side tend to develop further backwards. The addition of sediment changes the viscosity and density of the fluid, which in turn affects the flow characteristics and the formation of vortex structures. Additionally, high sediment concentrations significantly increase the probability of collisions and interactions between sediment particles, leading to increased local flow instability.
For the local region of the blade’s working surface, larger sediment particles have a more direct and significant impact on the local vortex structure because of their inertia effects and stronger wake disturbances. High sediment concentrations, on the other hand, lead to the overall enhancement of vortex structures. However, the formation and diffusion of strong vortex structures over time can damage the blade surface, increasing surface roughness and reducing turbine efficiency. Moreover, vortex structures can create unstable flow fields on the blade surface, increasing noise and vibration during turbine operation, which further affects the turbine’s performance and lifespan.

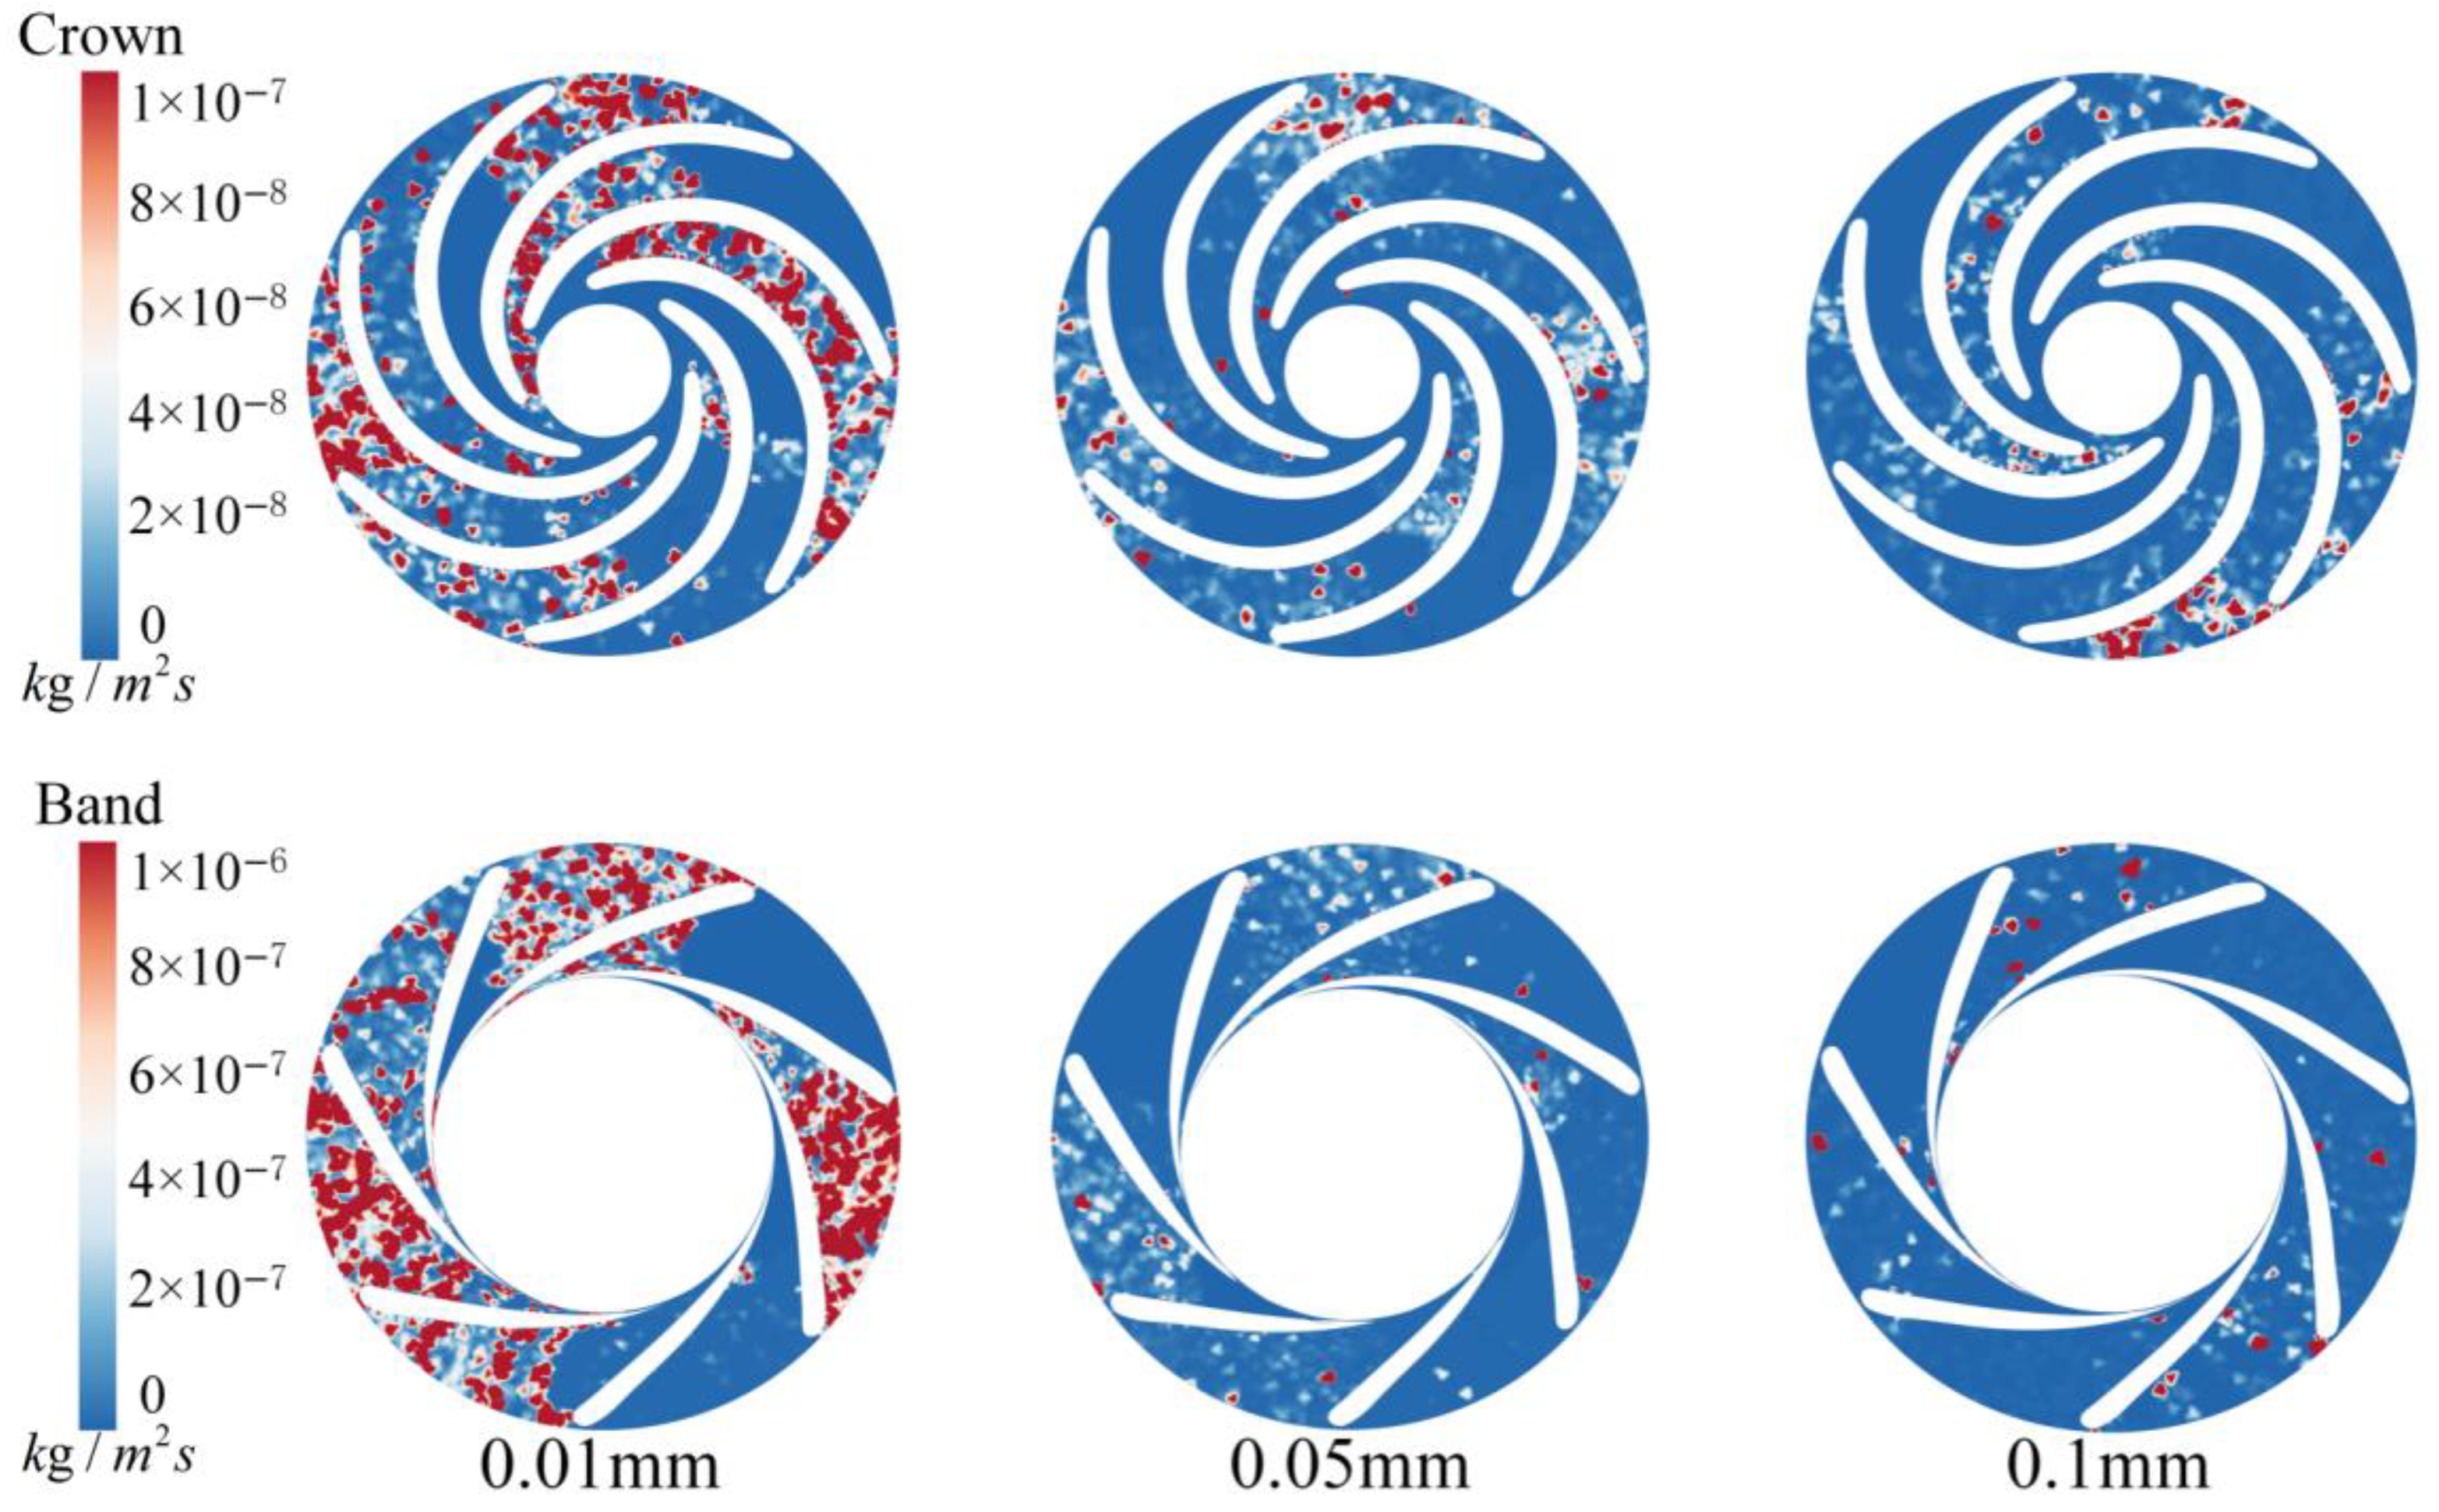
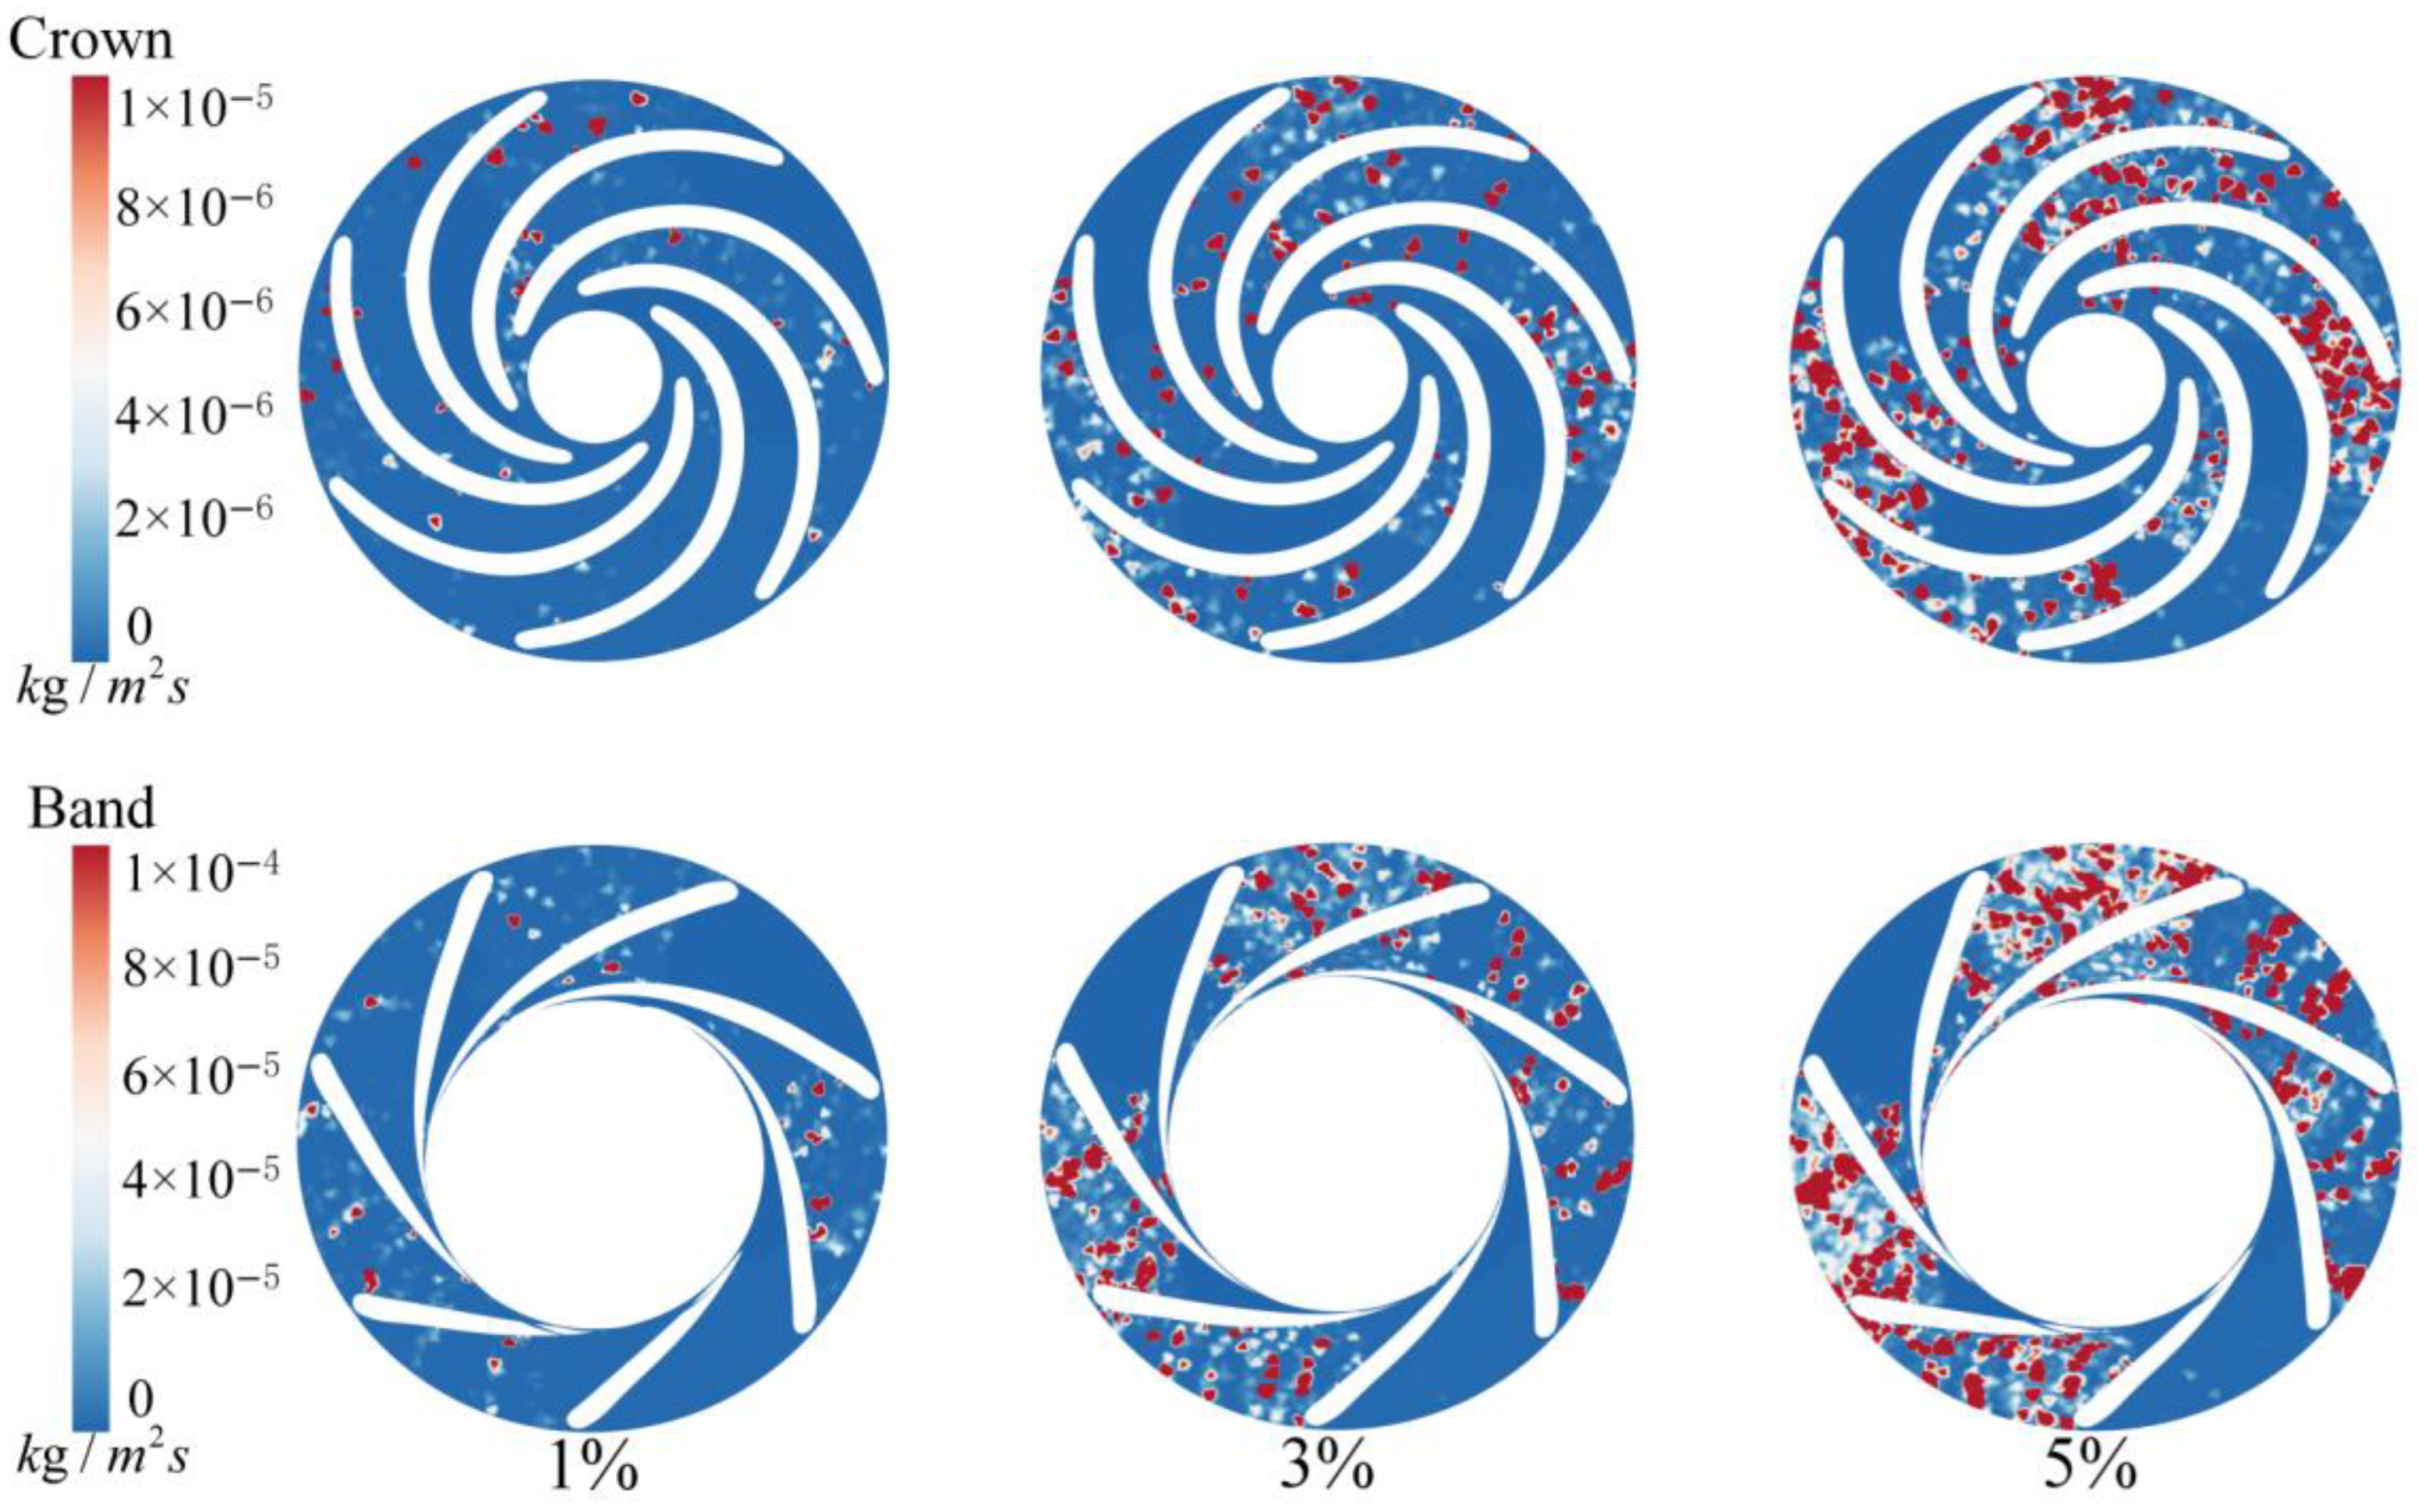
4.2. Sediment Accretion on the Runner Surface Under Different Solid-Phase Conditions

Figure 10 and Figure 11 show the distributions of sediment accretion on the upper cover and lower ring of the runner under different solid-phase conditions. Sediment accretion is particularly significant at the inlet of the runner blade working surface and the flow passage area at the runner outlet. These sediments not only accumulate in large quantities but are also noticeably more abundant than they are in other regions. Additionally, although less prevalent, some sediment remains firmly attached to the suction side of the blade, forming an accretion layer.
As shown in Figure 10, the attachment of sediment to the runner surface decreases significantly as the sediment diameter increases. This phenomenon can be attributed to two main reasons. First, the velocity gradient within the runner region is significant, and the flow field is complex and turbulent. In such an environment, smaller sediment particles, owing to their lower mass and higher fluid followability, are more susceptible to complex flow phenomena such as vortices and recirculation, leading them to adhere to the runner surface. In contrast, larger sediment particles have greater inertia, meaning that they are more likely to settle in the low-speed areas of the flow before entering the runner rather than following the high-speed flow lines into the runner region. This results in a reduced distribution of larger sediment particles on the runner lower cover and ring. Second, from a quantitative perspective, there are fewer larger sediment particles at the same concentration, leading to a more dispersed distribution in the flow field and a lower likelihood of accumulation, thereby reducing their accretion on the runner surface.
As illustrated in Figure 11, with increasing sediment concentration, the sediment accretion on the upper cover and lower ring of the runner becomes more severe. The accretion phenomenon starts at the blade working surface and gradually extends to the outlet end, with particularly significant accretion observed in the lower cover region of the runner. As the sediment concentration increases, the quantity of sediment per unit volume of water also increases. This change led to the aggregation of larger sediment particles, resulting in the formation of stable structures. The formation of these structures not only increases the viscosity of the water but also promotes the formation of viscous clumps between sediment particles, all of which increase the likelihood of sediment accretion on the runner surface.
Figure 12 and Figure 13 show the sediment accretion distributions on the pressure and suction sides of the runner blade under different solid-phase conditions. On the pressure side of the runner blade, sediment primarily accumulates in the inlet section of the pressure side, particularly in the lower part of this region, where it becomes a highly concentrated sediment area. On the suction side of the blade, sediment is dispersed, accumulating from the inlet section to the middle section of the blade.
As shown in Figure 12, with increasing sediment particle diameter, the amount of sediment accretion on the pressure side of the blade gradually decreases, whereas the amount of accretion on the suction side initially decreases but then increases. Owing to their tiny volume, smaller sediment particles are more susceptible to adverse flow conditions such as vortices and turbulence within the flow field, making it easier for them to deposit on the blade surface. In contrast, larger sediment particles have greater inertia, causing their velocity changes to lag behind the changes in fluid velocity and direction, resulting in lower fluid followability. This characteristic makes sediment accretion on the suction side of the blade more pronounced for larger particles.
Figure 13 shows that with increasing sediment concentration, the high sediment accretion area on the pressure side of the blade gradually extends from the lower part of the pressure side inlet towards the upper part, with a trend of covering the entire pressure side. Local sediment accretion on the suction side of the blade slowly accumulates, resulting in a tendency to form structures.

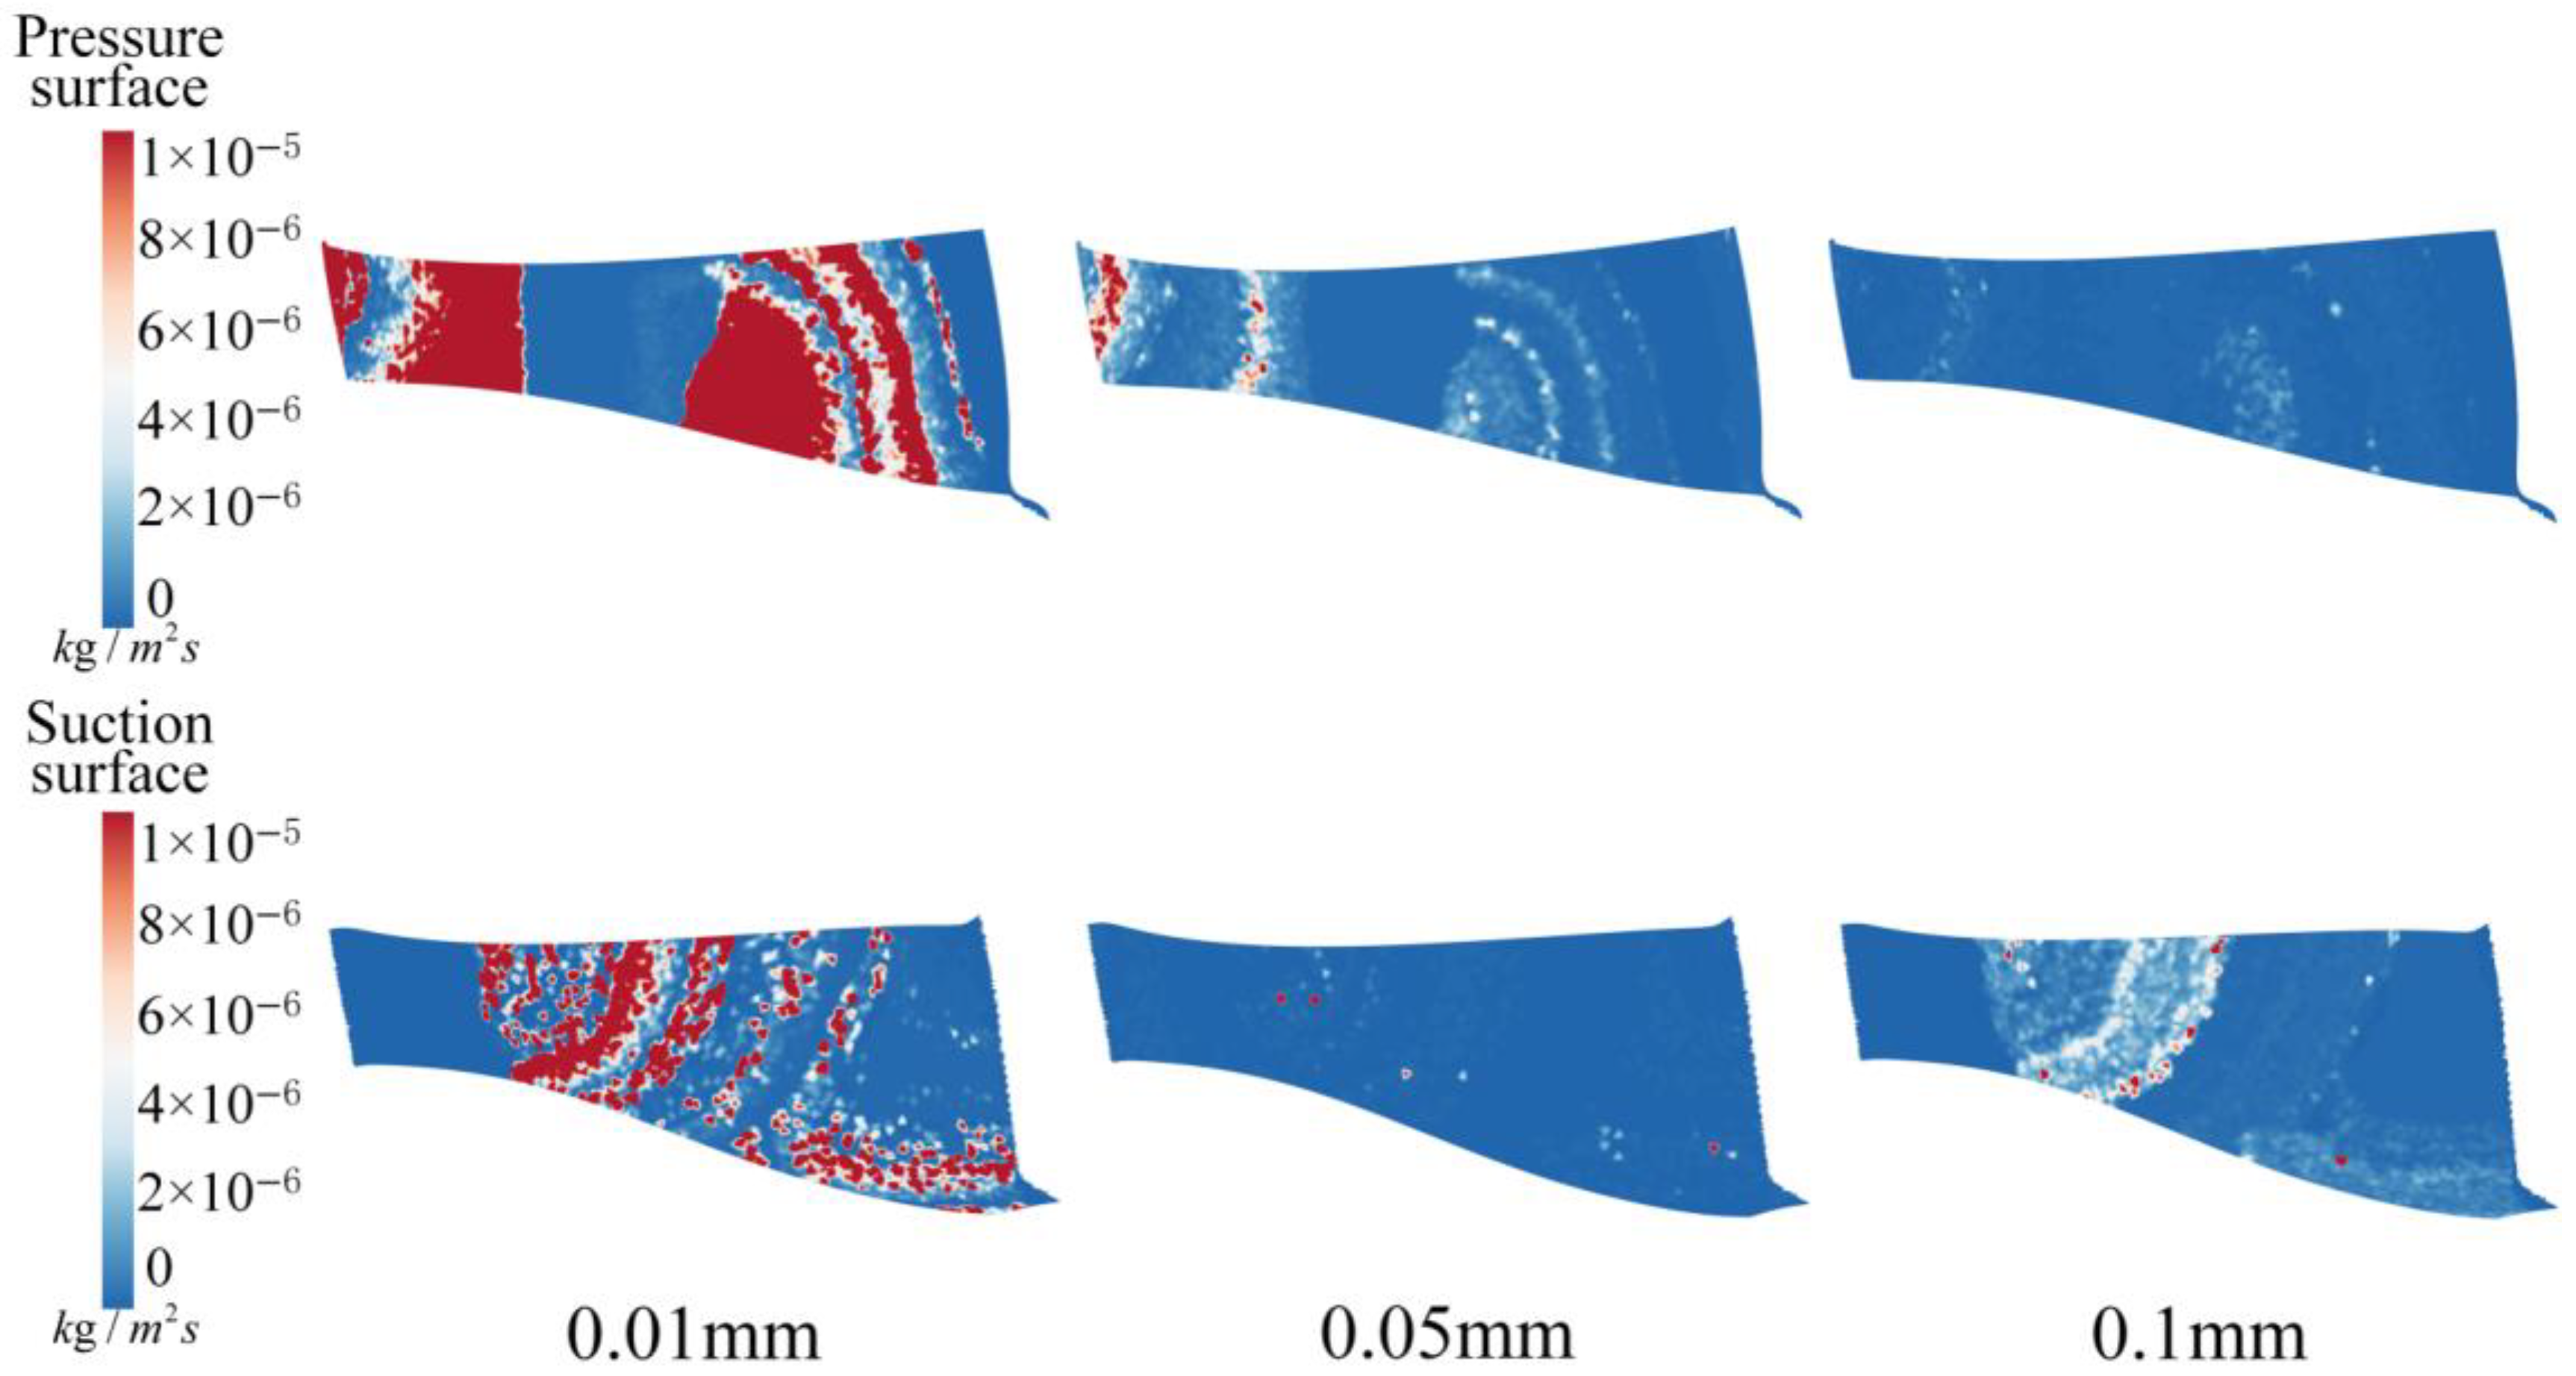
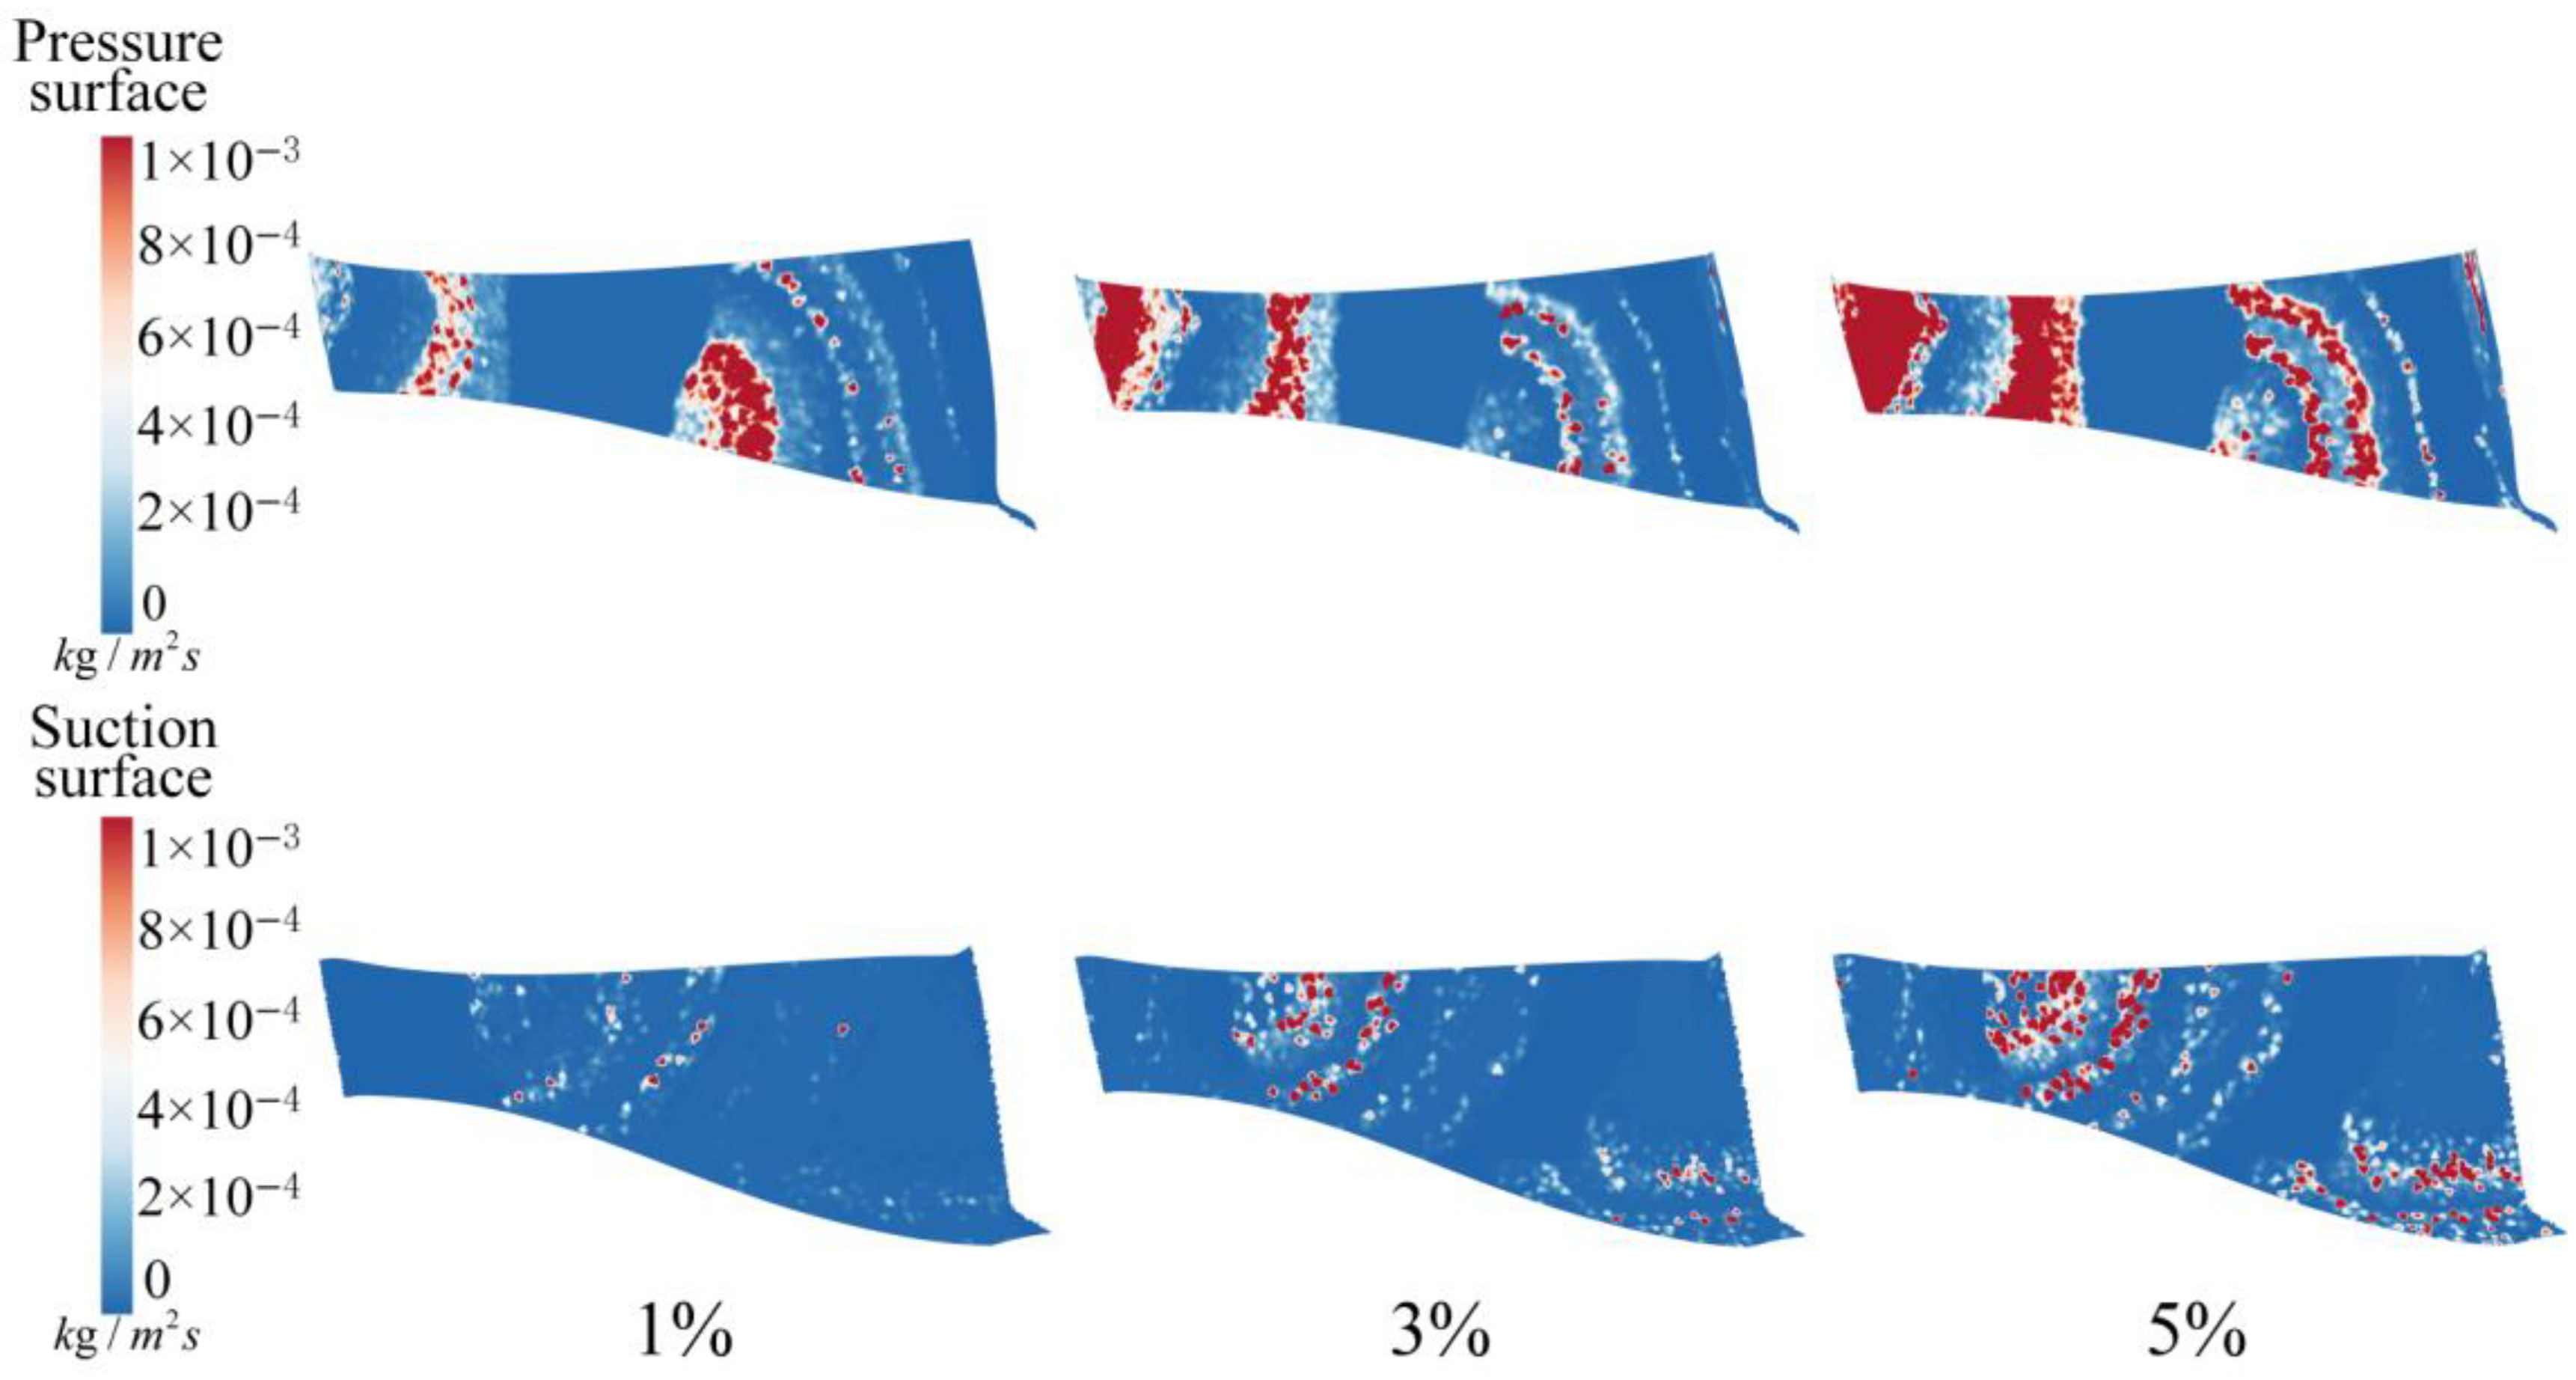
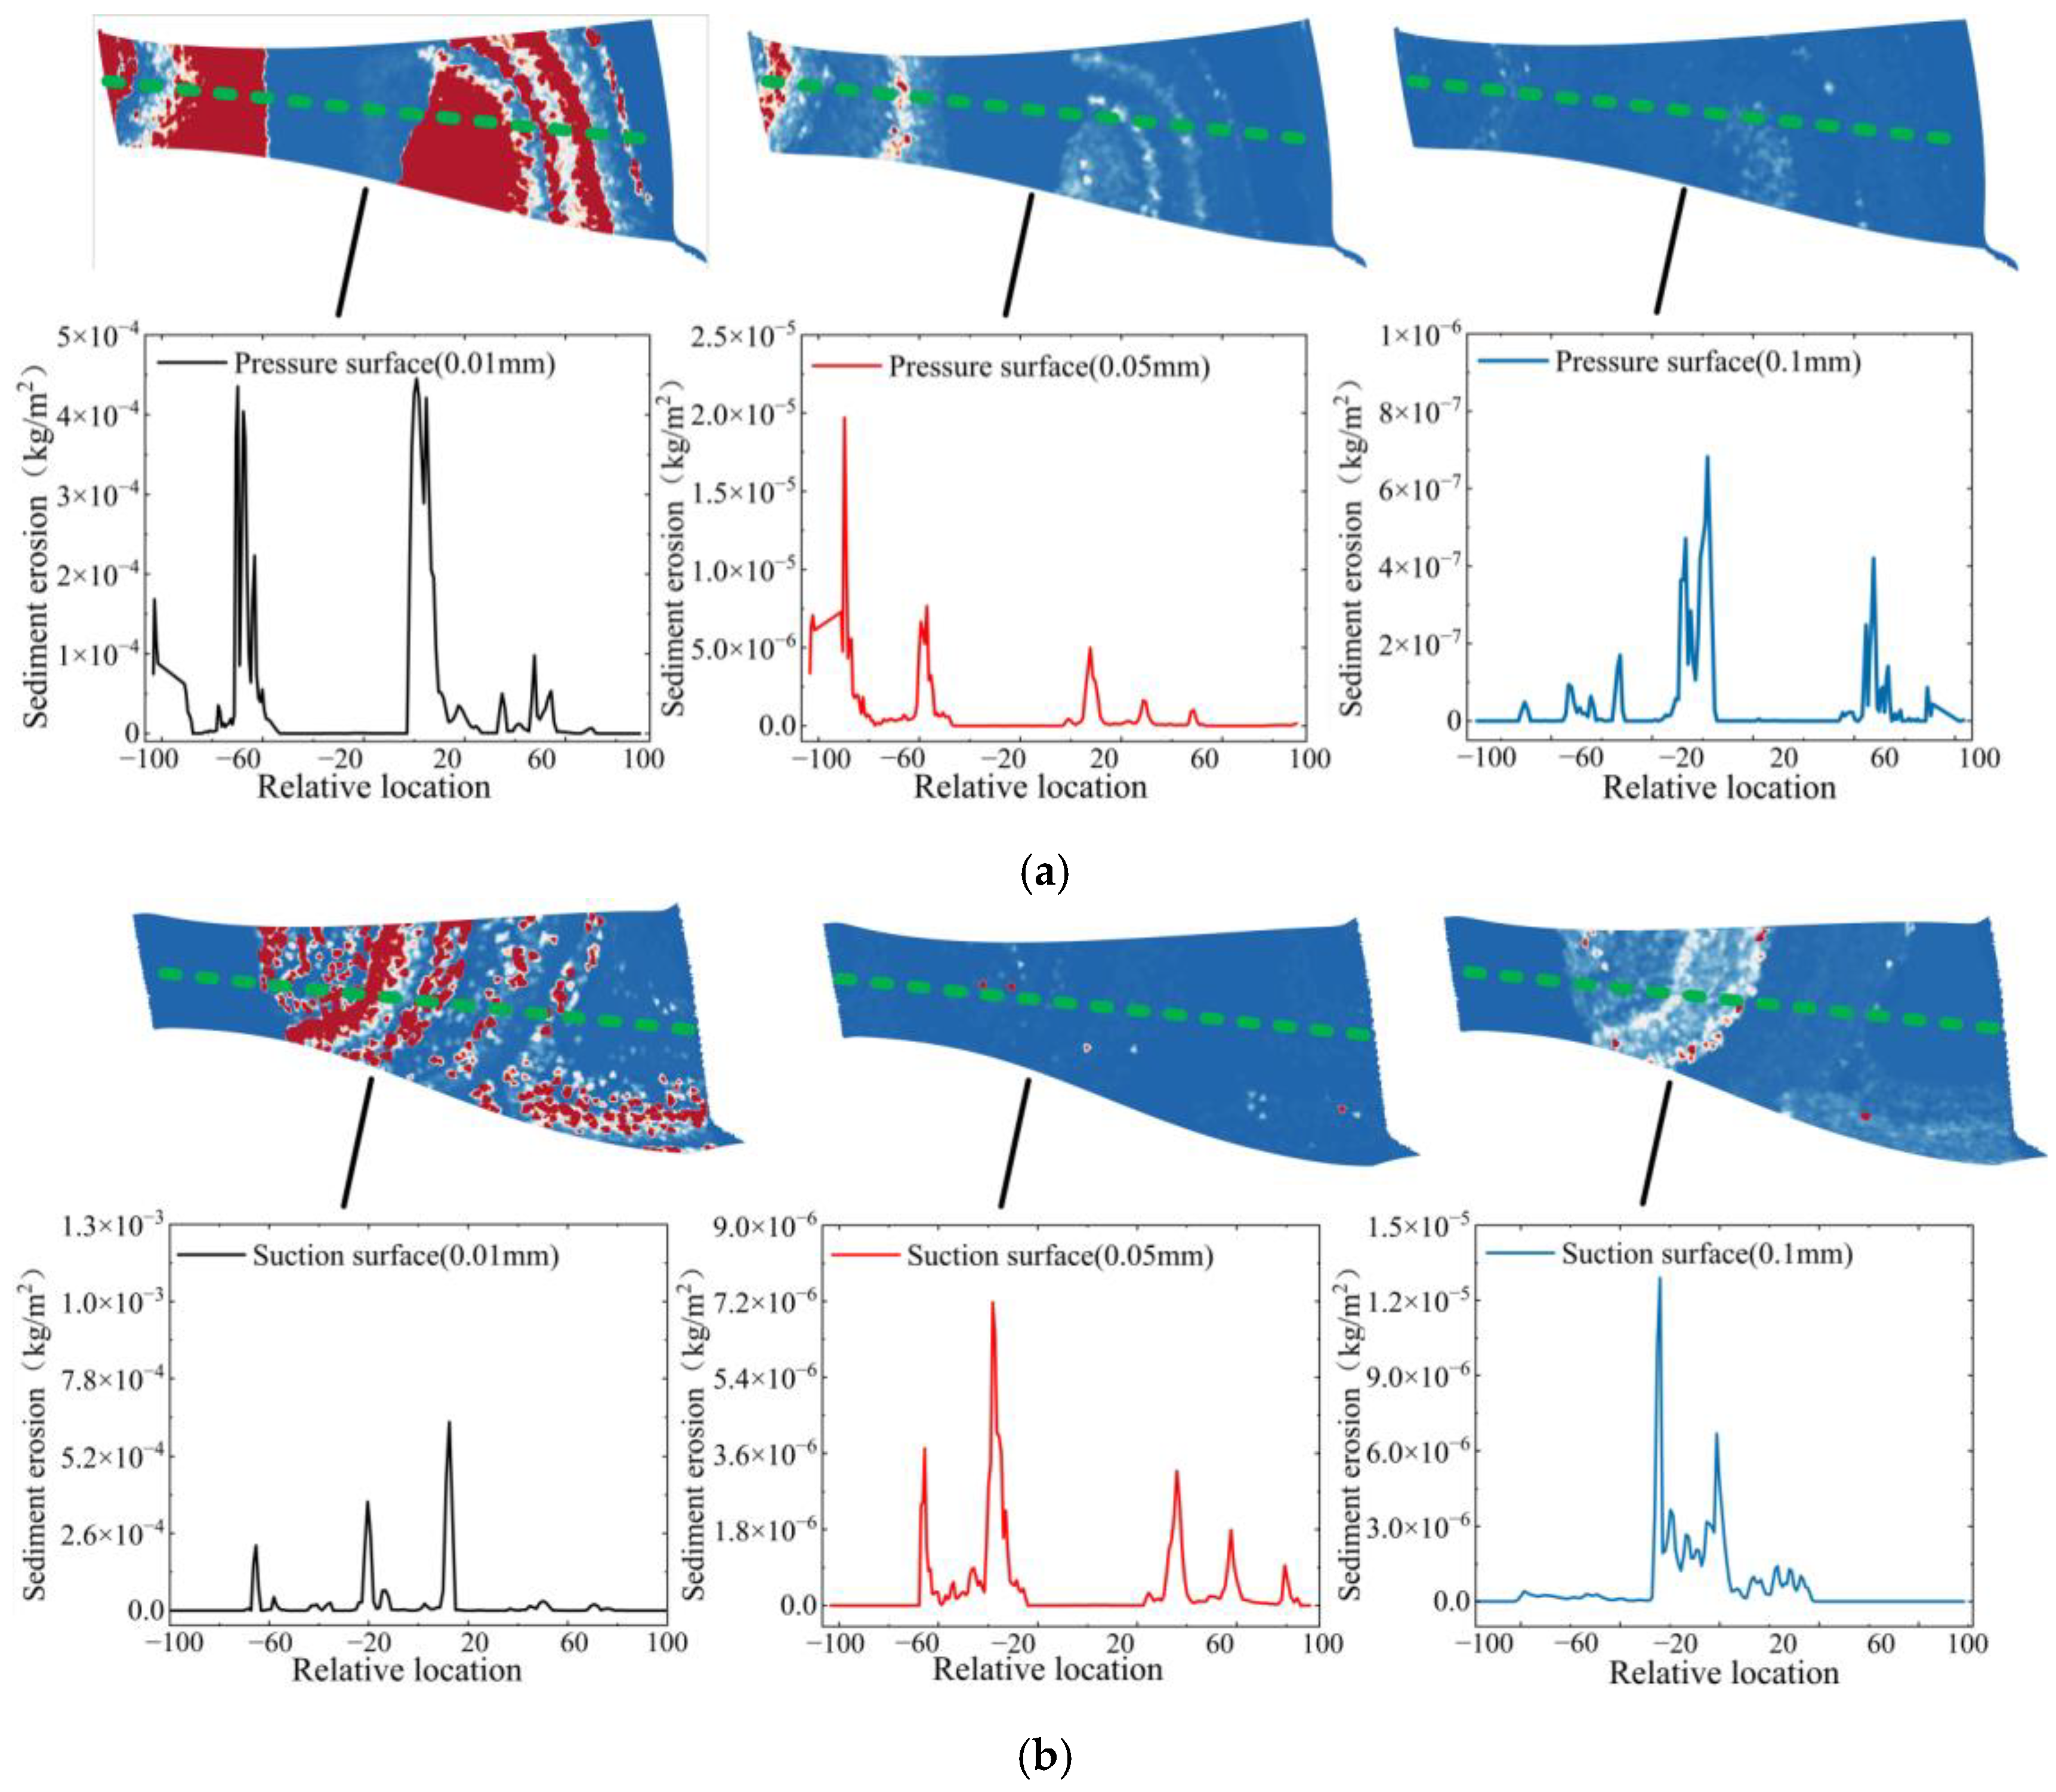
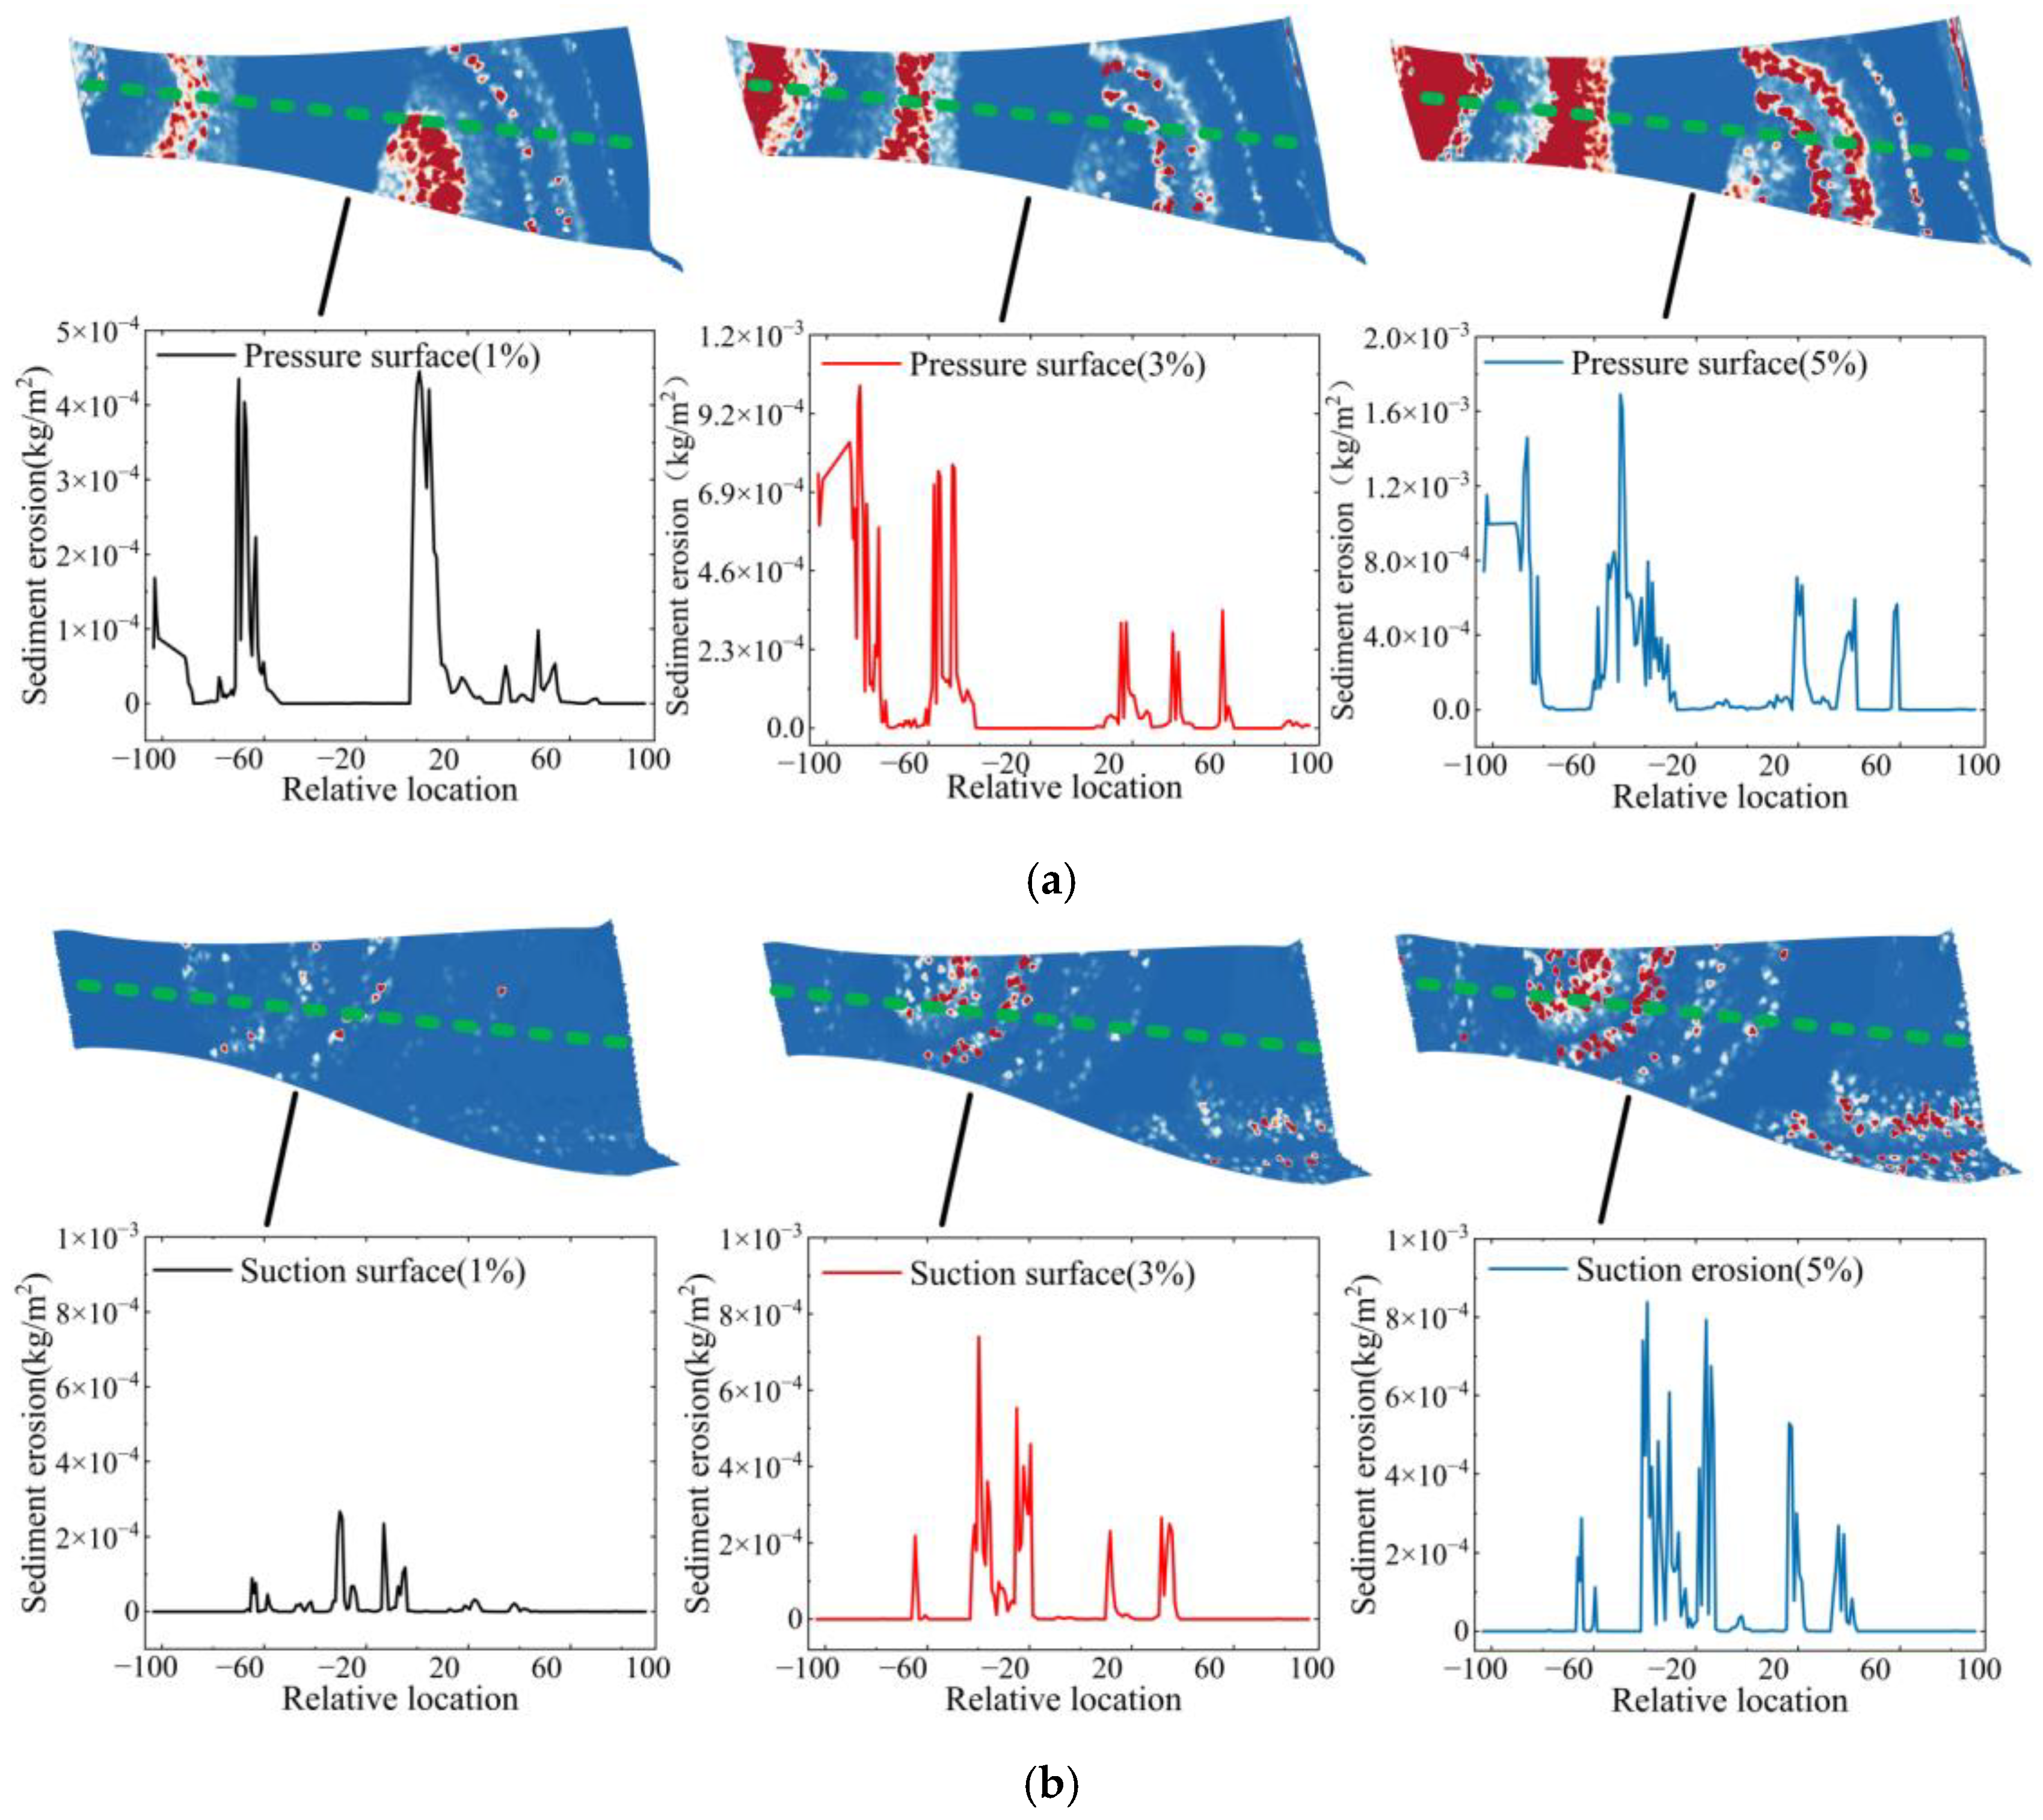
4.3. Wear Characteristics of the Runner Surface Under Different Solid-Phase Conditions

Figure 14 shows the wear distributions on the upper cover and lower ring of the runner for different sediment diameters. For the runner upper cover, sediment wear is particularly significant in the front–midsection area of the flow passage near the blade working surface, where the wear intensity is most concentrated. Wear is also present in the portion of the flow passage close to the nonworking surface and in the outlet area of the nonworking surface. For the runner lower ring, the wear pattern is like that of the upper cover and is primarily distributed at the inlet and outlet positions of the flow passage.
As shown, with increasing sediment diameter up to 0.05 mm, the amount of sediment worn on the runner upper cover and lower ring gradually decreases, and the wear distribution range does not significantly change. However, when the particle diameter reaches 0.1 mm, a notable change in the wear distribution occurs. Wear on the runner upper cover becomes concentrated in the flow passage inlet area near the blade working surface, whereas the wear on the runner lower ring becomes sparse, with some localized wear distributed randomly.
Figure 15 shows the sediment wear distribution on the runner upper cover and lower ring under different sediment concentrations. When the sediment concentration reaches 1%, wear is located primarily at the inlet of the flow passage on the runner upper cover and lower ring. This wear is sparse and randomly distributed with no apparent pattern. However, as the sediment concentration increases to 3%, the wear situation within the flow passage gradually worsens, with the wear areas starting to extend towards the outlet. Additionally, localized wear points significantly increase, particularly on the runner lower ring, where wear becomes notably prominent. When the sediment concentration increases further to 5%, wear on both the runner upper cover and the lower ring nearly covers the entire flow passage area. Localized wear at the flow passage inlet starts to show a tendency towards concentration and even evolves into more uniform wear patterns. Therefore, as the sediment concentration progressively increases, the degree of sediment wear on the runner upper cover and lower ring also intensifies.
Figure 16 shows the sediment wear distributions on the pressure and suction sides of the runner blade for different sediment diameters. Owing to the curvature of the runner blades, sediment wear predominantly occurs at the inlet section of the blade pressure side, from the 2/3 position to the outlet section and from the 1/3 position to the outlet section of the blade suction side.
When the sediment diameter reaches 0.01 mm, severe uniform wear is observed at the inlet section of the blade pressure side, which is characteristic of fine sediment wear. In the rear half of the blade, the wear condition becomes more complex, with both uniform wear and cutting wear coexisting. The cutting wear is distributed in linear and grooved forms. On the blade suction side, from the 1/3 position to the 2/3 position, grooved cutting wear dominated, whereas the lower part of the blade outlet area exhibited unevenly distributed localized wear. It is evident that as the sediment diameter decreases, the sediment wear on the runner blade becomes quite severe. When the sediment diameter is 0.05 mm, a significant reduction in wear on the runner blade surface is observed. The wear area on the pressure side of the blade remains relatively unchanged, but only a small amount of localized wear is present on the runner suction side. When the sediment diameter reaches 0.1 mm, the degree of wear on the pressure side of the blade significantly decreases. However, wear on the blade suction side shows an increasing trend, which is particularly severe starting from the 1/3 position along the blade length.
Figure 17 shows the distribution of wear on the pressure and suction sides of the runner blades under different sediment concentrations. As illustrated, sediment wear initially appears in the lower regions of the blade pressure side at the 1/3 and 2/3 positions, as well as in the midsection of the blade suction side. These are the areas where the blade first contacts the fluid.
As the sediment concentration increases, wear on the blade pressure side progressively extends towards the inlet, eventually covering the entire inlet section of the blade. Additionally, the wear pattern on the middle and rear sections of the pressure side also undergoes a significant change, evolving from initial flake-like wear to cutting wear that extends towards the blade outlet section. On the other hand, wear on the blade suction side shows a distinct trend. Wear begins in the midsection and gradually extends to the upper midsection and both sides of the blade outlet, with a particularly pronounced wear region forming in the lower part of the blade outlet.
Notably, the regions of high sediment wear observed above closely overlap with the areas of concentrated sediment accretion on the runner surface, further confirming the strong correlation between the distribution of sediment wear and the concentration of sediment accretion.
Figure 18 illustrates the extraction of sediment erosion values along the centerline of the runner blade to quantitatively analyze the sediment erosion distribution. For ease of interpretation, the relative position along the blade is normalized, with −100 representing the leading edge of the blade and 100 representing the trailing edge. This normalization allows for a clearer comparison of wear distribution across different conditions.
Figure 19a illustrates that, at a constant sediment concentration, when the sediment diameter is 0.01 mm, wear is primarily concentrated within the pressure side of the blade between −80 and −40 and 0 to 20 relative positions, with a maximum wear value of 4.45 × 10⁻⁴ kg/m2. As the diameter increases to 0.05 mm, there is no significant change in the wear distribution location, but the maximum wear value decreases to 1.97 × 10⁻⁵ kg/m2, indicating a significant reduction in wear. When the sediment diameter reaches 0.1 mm, the increase in diameter results in a greater mass of individual sediment particles, causing changes in the impact location on the blade. The wear region shifts closer to the blade’s middle and exit areas, with the maximum wear value decreasing to 6.82 × 10⁻⁷ kg/m2.
Figure 19b shows the wear distribution along the suction side centerline for different sediment diameters. When the sediment diameter is 0.01 mm, the wear distribution is relatively dispersed, with a maximum wear value of 6.63 × 10⁻⁴ kg/m2. As the sediment diameter increases to 0.05 mm, the wear distribution changes and becomes like the wear distribution on the pressure side for this sediment diameter, but the maximum wear value decreases to 7.17 × 10⁻⁶ kg/m2. When the sediment diameter increases to 0.1 mm, the wear pattern changes significantly, with wear mainly concentrated in the range of 0 to 50 relative positions, and the maximum wear value increases to 1.29 × 10⁻⁵ kg/m2.
As the sediment diameter increases, the amount of wear on the pressure side of the blade significantly decreases, whereas the amount of wear on the suction side first decreases but then increases. Therefore, when the amount of sediment is small, it is important to focus on protecting the pressure side of the runner blades. However, as the sediment size gradually increases and exceeds a certain critical value, the focus of protection should shift to the suction side of the runner blades.
As shown in Figure 20a, the wear areas on the pressure side of the runner blades are distributed within the relative ranges of −80~−60, −40~−20, and 20~60. When the sediment concentration increases to 3%, significant changes are observed in the wear area within the range of −80~−60, with the maximum wear value increasing from 4.45 × 10⁻⁴ kg/m2 to 1.01 × 10⁻³ kg/m2. As the concentration further increased to 5%, although the regions of concentrated wear did not markedly change, the distribution range gradually expanded, with the maximum wear value reaching 1.69 × 10⁻³ kg/m2.
Figure 20b shows that the wear distribution on the suction side of the runner blades exhibits a scattered and random pattern. When the sediment concentration increases to 3%, a concentrated wear area is formed within the relative range of −50~−20, with the maximum wear value increasing from 6.63 × 10⁻⁴ kg/m2 to 7.52 × 10⁻⁴ kg/m2. When the sediment concentration increases to 5%, the concentrated wear area further expands, and the maximum wear value increases to 8.38 × 10⁻⁴ kg/m2.
The results suggest that as the sediment concentration gradually increases, the concentrated wear areas on the runner blades do not shift significantly. The wear range tends to gradually expand, and the overall degree of wear also increases.
The findings of this study provide valuable insights for the design and maintenance of pump turbines operating in sediment-laden environments. The identified erosion-prone regions on the runner, particularly on the crown, band, and blade surfaces, suggest that optimizing blade geometry could effectively mitigate excessive material loss. Additionally, the observed relationship between sediment concentration, particle size, and erosion severity can inform operational strategies, such as adjusting guide vane angles or modifying flow conditions to reduce sediment impact. These insights are particularly relevant for hydropower plants in high-sediment rivers, such as those in southwest China, where optimizing turbine materials and coatings can significantly extend the operational lifespan and reduce maintenance costs. Furthermore, the methodology and findings of this study can be extended to other hydraulic machinery subjected to sediment erosion, such as axial-flow and Pelton turbines, providing a broader impact for erosion mitigation strategies in the hydropower industry.

5. Conclusions

This study investigated the impact of sediment characteristics, including concentration and particle size, on the wear patterns of pump-turbine runners under various solid-phase conditions. In addition, the findings provide valuable insights for optimizing pump-turbine designs, particularly in sediment-laden environments. Understanding the interplay between sediment properties and wear mechanisms will aid in mitigating erosion risks and improving the operational longevity of turbines. The results highlight the following key findings:
(1)
The sediment concentration has a greater effect on overall erosion efficiency than does the sediment particle size. An increased sediment concentration leads to expanded erosion regions and intensified surface wear on turbine components.
(2)
The sediment particle size primarily affects the distribution of erosion zones within the runner. Larger particles tend to concentrate wear in specific areas, particularly on the suction side of the blades.
(3)
The relationship between sediment accretion and erosion is evident, as regions of high sediment accretion correspond strongly with areas of concentrated wear. Sediment primarily accumulates at the inlet and outlet regions of the flow passages, with the pressure side and suction side of the blades showing distinct patterns of accretion and erosion.
(4)
This study confirms that vortex structure instability plays a crucial role in enhancing localized wear, with higher sediment concentrations leading to more pronounced vortex activity and wear intensity.
(5)
Modifying the blade geometry, such as adjusting the leading-edge curvature, can help reduce sediment erosion. Selecting erosion-resistant materials, such as advanced coatings or composite materials, is particularly beneficial for high-wear regions, including the inlet section of the blade pressure side, from the 2/3 position to the outlet section, and from the 1/3 position to the outlet section of the blade suction side, where sediment-induced damage is most severe.

Author Contributions

Conceptualization, J.L. (Jiaxing Lu) and Y.H.; methodology, Y.H.; software, Y.Z.; validation, J.L. (Jiaxing Lu), Y.H. and Y.Z.; formal analysis, C.Z.; investigation, Y.P.; resources, Y.P.; data curation, J.L. (Jiarui Li); writing—original draft preparation, Y.H.; writing—review and editing, J.L. (Jiaxing Lu); visualization, C.Z.; supervision, Y.Z.; project administration, J.L. (Jiaxing Lu); funding acquisition, J.L. (Jiaxing Lu). All authors have read and agreed to the published version of the manuscript.

Funding

This work was funded by the Research on Sediment Wear Mechanism and Control Strategy of Impact Turbine, Sichuan Province Natural Science Foundation 55 Project, the Joint Fund of the 552 National Natural Science Foundation and Supported by the Open Research Subject of Key Laboratory of Fluid and Power Machinery (Xihua University) (no. 52479089, no. 2024NSFSC0214, no. U23A20669 and szjj2024-LTDL-2024010).

Data Availability Statement

The data presented in this study are available in the main text of the article.

Conflicts of Interest

The authors declare no conflict of interest.

References

  1. Cheng, W.J.; Fan, H.Q.; Cheng, W.J.; Shao, C. Investigation on wear induced by solid-liquid two-phase flow in a centrifugal pump based on EDEM-Fluent coupling method. Flow Meas. Instrum. 2024, 96, 102542. [Google Scholar] [CrossRef]
  2. Ge, X.F.; Sun, J.; Chu, D.D.; Liu, J.; Zhou, Y.; Zhang, H.; Zhang, L.; Chen, H.; Kan, K.; Binama, M.; et al. Sediment Erosion on Pelton Turbines: A Review. Chin. J. Mech. Eng. 2023, 36, 64. [Google Scholar] [CrossRef]
  3. Pan, J.L.; Pan, Y.P.; Liu, Q.; Yang, S.; Tao, R.; Zhu, D.; Xiao, R. FED evaluation in a small double-suction reversible pump turbine considering sediment erosion. J. Energy Storage 2024, 76, 109549. [Google Scholar] [CrossRef]
  4. Gautam, S.; Neopane, H.P.; Acharya, N.; Chitrakar, S.; Thapa, B.S.; Zhu, B. Sediment erosion in low specific speed francis turbines: A case study on effects and causes. Wear 2020, 442, 203152. [Google Scholar] [CrossRef]
  5. Tandel, R.R.; Patel, R.N.; Jain, S.V. Correlation development of erosive wear and silt erosion failure mechanisms for pump as turbine. Eng. Fail. Anal. 2023, 153, 107610. [Google Scholar] [CrossRef]
  6. Song, X.J.; Luo, Y.Y.; Wang, Z.W. Mechanism of the influence of sand on the energy dissipation inside the hydraulic turbine under sediment erosion condition. Energy 2024, 294, 130794. [Google Scholar] [CrossRef]
  7. Kumar, R.; Sarkar, S. Erosion analysis of radial flow hydraulic turbine components through FLUENT-EDEM coupling. Powder Technol. 2023, 428, 118800. [Google Scholar] [CrossRef]
  8. Kapali, A.; Chitrakar, S.; Shrestha, O.; Neopane, H.P.; Thapa, B.S. A Review on Experimental Study of Sediment Erosion in Hydraulic Turbines at Laboratory Conditions. J. Phys. Conf. Ser. 2019, 1266, 012016. [Google Scholar] [CrossRef]
  9. Xue, W.; Zhao, Z.Y. Research on the Theory of Cavitation and Erosion in Turbines. Theor. Res. Cavitation Eros. Turbines 1999, 6, 44–48. [Google Scholar]
  10. Lu, J.X.; Zhou, Y.Z.; Ge, Y.L.; Liu, J.; Zhang, C. Research into Prediction Method for Pressure Pulsations in a Centrifugal Pump Based on Variational Mode Decomposition–Particle Swarm Optimization and Hybrid Deep Learning Models. Sensors 2024, 24, 4196. [Google Scholar] [CrossRef]
  11. Liu, X.B. Numerical Simulation of Sediment Erosion in Hydraulic Machinery. J. Sichuan Univ. Technol. 2000, 02, 79–84. [Google Scholar]
  12. Thapa, B.S.; Thapa, B.; Dahlhaug, O.G. Empirical modelling of sediment erosion in Francis turbines. Energy 2012, 41, 386–391. [Google Scholar] [CrossRef]
  13. Padhy, M.K.; Saini, R.P. A review on silt erosion in hydro turbines. Renew. Sustain. Energy Rev. 2008, 12, 1974–1987. [Google Scholar] [CrossRef]
  14. Peng, G.J.; Wang, Z.W.; Xiao, Y.X.; Luo, Y. Abrasion predictions for Francis turbines based on liquid-solid two-phase fluid simulations. Eng. Fail. Anal. 2013, 33, 327–335. [Google Scholar]
  15. Li, L.H.; Lu, J.X.; Gong, Y.; Zhao, H.; Liu, X.; Zhu, B. Sediment erosion characteristics of Pelton turbine runner: Effects of sediment concentration and diameter. Renew. Energy 2024, 220, 119679. [Google Scholar] [CrossRef]
  16. Pang, J.Y.; Liu, H.Z.; Liu, X.B.; Yang, H.; Peng, Y.; Zeng, Y.; Yu, Z. Study on sediment erosion of high head Francis turbine runner in Minjiang River basin. Renew. Energy 2022, 192, 849–858. [Google Scholar] [CrossRef]
  17. Zhang, L.; Wang, Z.Y.; Wang, J.L. Numerical Simulation Study of Sediment Erosion on Guide Vanes of Hydroturbines in Sandy Rivers. J. Hydraul. Eng. Constr. 2022, 20, 1–7. [Google Scholar]
  18. Zhang, L.; Cao, Z.Y.; Wang, J.L. Study on the Impact of Operating Conditions on Erosion in the Guide Vane Region of Hydroturbines in Sandy Rivers. Hydraul. Eng. Hydropower Technol. 2022, 53, 148–156. [Google Scholar]
  19. Li, Y.H.; Guo, B.; Xiao, Y.X. Simulation Study on the Erosion Characteristics of Runner in High-Head Mixed-Flow Hydroturbines. J. Hydropower Gener. 2020, 39, 112–120. [Google Scholar]
  20. Cruzatty, C.; Jimenez, D.; Valencia, E.; Zambrano, I.; Mora, C.; Luo, X.; Cando, E. A Case Study: Sediment Erosion in Francis Turbines Operated at the San Francisco Hydropower Plant in Ecuador. Energies 2022, 15, 8. [Google Scholar]
  21. Tian, W.W.; Liu, X.B.; Yuan, S. Numerical and Experimental Study of Sediment Erosion in Guide Vanes of Mixed-Flow Turbines at High-Head Hydropower Stations with High Sediment Loads. J. Eng. Therm. Energy Power 2019, 34, 57–62. [Google Scholar]
  22. Kang, M.; Park, N.; Suh, S. Numerical Study on Sediment Erosion of Francis Turbine with Different Operating Conditions and Sediment Inflow Rates. Procedia Eng. 2016, 157, 457–464. [Google Scholar]
  23. Wei, X.Y.; Pei, J.X.; Wang, W.Q.; Yu, Z.F. Numerical study on sediment erosion characteristics of Francis turbine runner. Eng. Fail. Anal. 2024, 161, 108270. [Google Scholar]
  24. Pan, J.I.; Liu, Q.; Pang, J.Y.; Zhang, F.; Tao, R.; Xiao, R.; Zhou, L.; Liu, W. Comparative evaluation of sand erosion in reversible turbine at pump mode and turbine mode. J. Energy Storage 2024, 79, 110185. [Google Scholar]
  25. Wang, Z.L.; Li, Y.Y.; Fan, H.G. Study on the sensitivity of “S” shape characteristic of low specific velocity pump turbine to the minimum pressure of draft pipe. Large Electr. Mach. Hydraul. Turbine 2024, 3983, 05808. [Google Scholar]
  26. Lu, G.C.; Zuo, Z.G.; Sun, Y.K.; Liu, D.; Tsujimoto, Y.; Liu, S. Experimental evidence of cavitation influences on the positive slope on the pump performance curve of a low specific speed model pump-turbine. Renew. Energy 2017, 113, 1539–1550. [Google Scholar] [CrossRef]
  27. Han, L.; Zhang, G.F.; Wang, Y.; Wei, X.Z. Investigation of erosion influence in distribution system and nozzle structure of pelton turbine. Renew. Energy 2021, 178, 1119–1128. [Google Scholar] [CrossRef]
  28. Tarodiya, R.; Khullar, S.; Levy, A. Particulate flow and erosion modeling of a Pelton turbine injector using CFD-DEM simulations. Powder Technol. 2022, 399, 117168. [Google Scholar] [CrossRef]
  29. Lu, J.X.; Liu, J.H.; Qian, L.Y.; Liu, X.; Yuan, S.; Zhu, B.; Dai, Y. Investigation of pressure pulsation induced by quasi-steady cavitation in a centrifugal pump. Phys. Fluids 2023, 35, 025119. [Google Scholar] [CrossRef]
  30. Liu, C.Q.; Wang, Y.Q.; Yang, Y.; Duan, Z. New omega vortex identification method. Sci. China Phys. Mech. Astron. 2016, 59, 684711. [Google Scholar] [CrossRef]
  31. Wu, J.J.; Tian, J.; Liu, J.; Feng, X.; Wang, Y.; Ya, Q.; Li, Z. Driving factors and trend prediction for annual sediment transport in the upper and middle reaches of the yellow river from 2001 to 2020. Water 2023, 15, 1107. [Google Scholar] [CrossRef]
Figure 1. Visualized pump–turbine model test bench system (physical setup).
Water 17 01093 g001
Figure 2. Visualized pump-turbine model test bench system (schematic diagram).
Water 17 01093 g002
Figure 3. Comparison of numerical simulation and experimental results for external turbine characteristics.
Water 17 01093 g003
Figure 4. Pump-turbine and runner model diagram: (a) pump-turbine model diagram; (b) runner model diagram.
Water 17 01093 g004
Figure 5. Computational domain mesh model.
Water 17 01093 g005
Figure 6. Mesh independence test for turbine hydraulic efficiency. (Red star represents the final number of grids selected).
Water 17 01093 g006
Figure 7. Efficiency of the pump turbine under different solid-phase condition: (a) efficiency with different sediment particle sizes; (b) efficiency with different sediment concentrations.
Water 17 01093 g007
Figure 8. Omega vortex identification distribution at the runner Z = 0 section for different sediment diameters.
Water 17 01093 g008
Figure 9. Omega vortex identification distributions at the Z = 0 section for different sediment concentrations.
Water 17 01093 g009
Figure 10. Sediment accretion distribution on the runner upper cover/lower ring for different sediment diameters.
Water 17 01093 g010
Figure 11. Distribution of sediment accretion on the upper cover/lower ring of the runner for different sediment concentrations.
Water 17 01093 g011
Figure 12. Sediment accretion distribution on the pressure and suction sides of the runner blade for different sediment diameters.
Water 17 01093 g012
Figure 13. Sediment accretion distributions on the pressure and suction sides of the runner blade for different sediment concentrations.
Water 17 01093 g013
Figure 14. Sediment wear distribution on the runner upper cover/lower ring for different sediment diameters.
Water 17 01093 g014
Figure 15. Sediment wear distribution on the runner upper cover/lower ring for different sediment concentrations.
Water 17 01093 g015
Figure 16. Sediment wear distributions on the runner pressure side/suction side for different sediment diameters.
Water 17 01093 g016
Figure 17. Sediment wear distributions on the pressure and suction sides of the runner blades at different sediment concentrations.
Water 17 01093 g017
Figure 18. Distribution line for extracting runner blade sediment erosion values.
Water 17 01093 g018
Figure 19. Distribution of wear values on the runner surface for different sediment diameters: (a) pressure side of the runner blade; (b) suction side of the runner blade. The depth of the color represents the intensity of wear, and the green dashed line represents the distribution line for extracting runner blade sediment erosion values.
Water 17 01093 g019
Figure 20. Distribution of wear values on runner surfaces at different sediment concentrations: (a) pressure side of the runner blade; (b) suction side of the runner blade. The depth of the color represents the intensity of wear, and the green dashed line represents the distribution line for extracting runner blade sediment erosion values.
Water 17 01093 g020
Table 1. Main geometric parameters of the pump-turbine model.
ParameterUnitValue
Number of Adjustable Guide Vanes-19
Number of Fixed Guide Vanes-19
Number of Runner Blades-7
Opening Angle of Adjustable Guide Vanesmm9.3
Runner Blade Thicknessmm8
Runner Inlet Diametermm200
Runner Outlet Diametermm115
Draft Tube Inlet Diametermm115
Draft Tube Outlet Diametermm163
Disclaimer/Publisher’s Note: The statements, opinions and data contained in all publications are solely those of the individual author(s) and contributor(s) and not of MDPI and/or the editor(s). MDPI and/or the editor(s) disclaim responsibility for any injury to people or property resulting from any ideas, methods, instructions or products referred to in the content.

