
Hydrochemistry and Evolutionary Processes During Saltwater Intrusion in the Saline–Fresh Groundwater Transition Zone in Southern Laizhou Bay, China

Abstract
1. Introduction
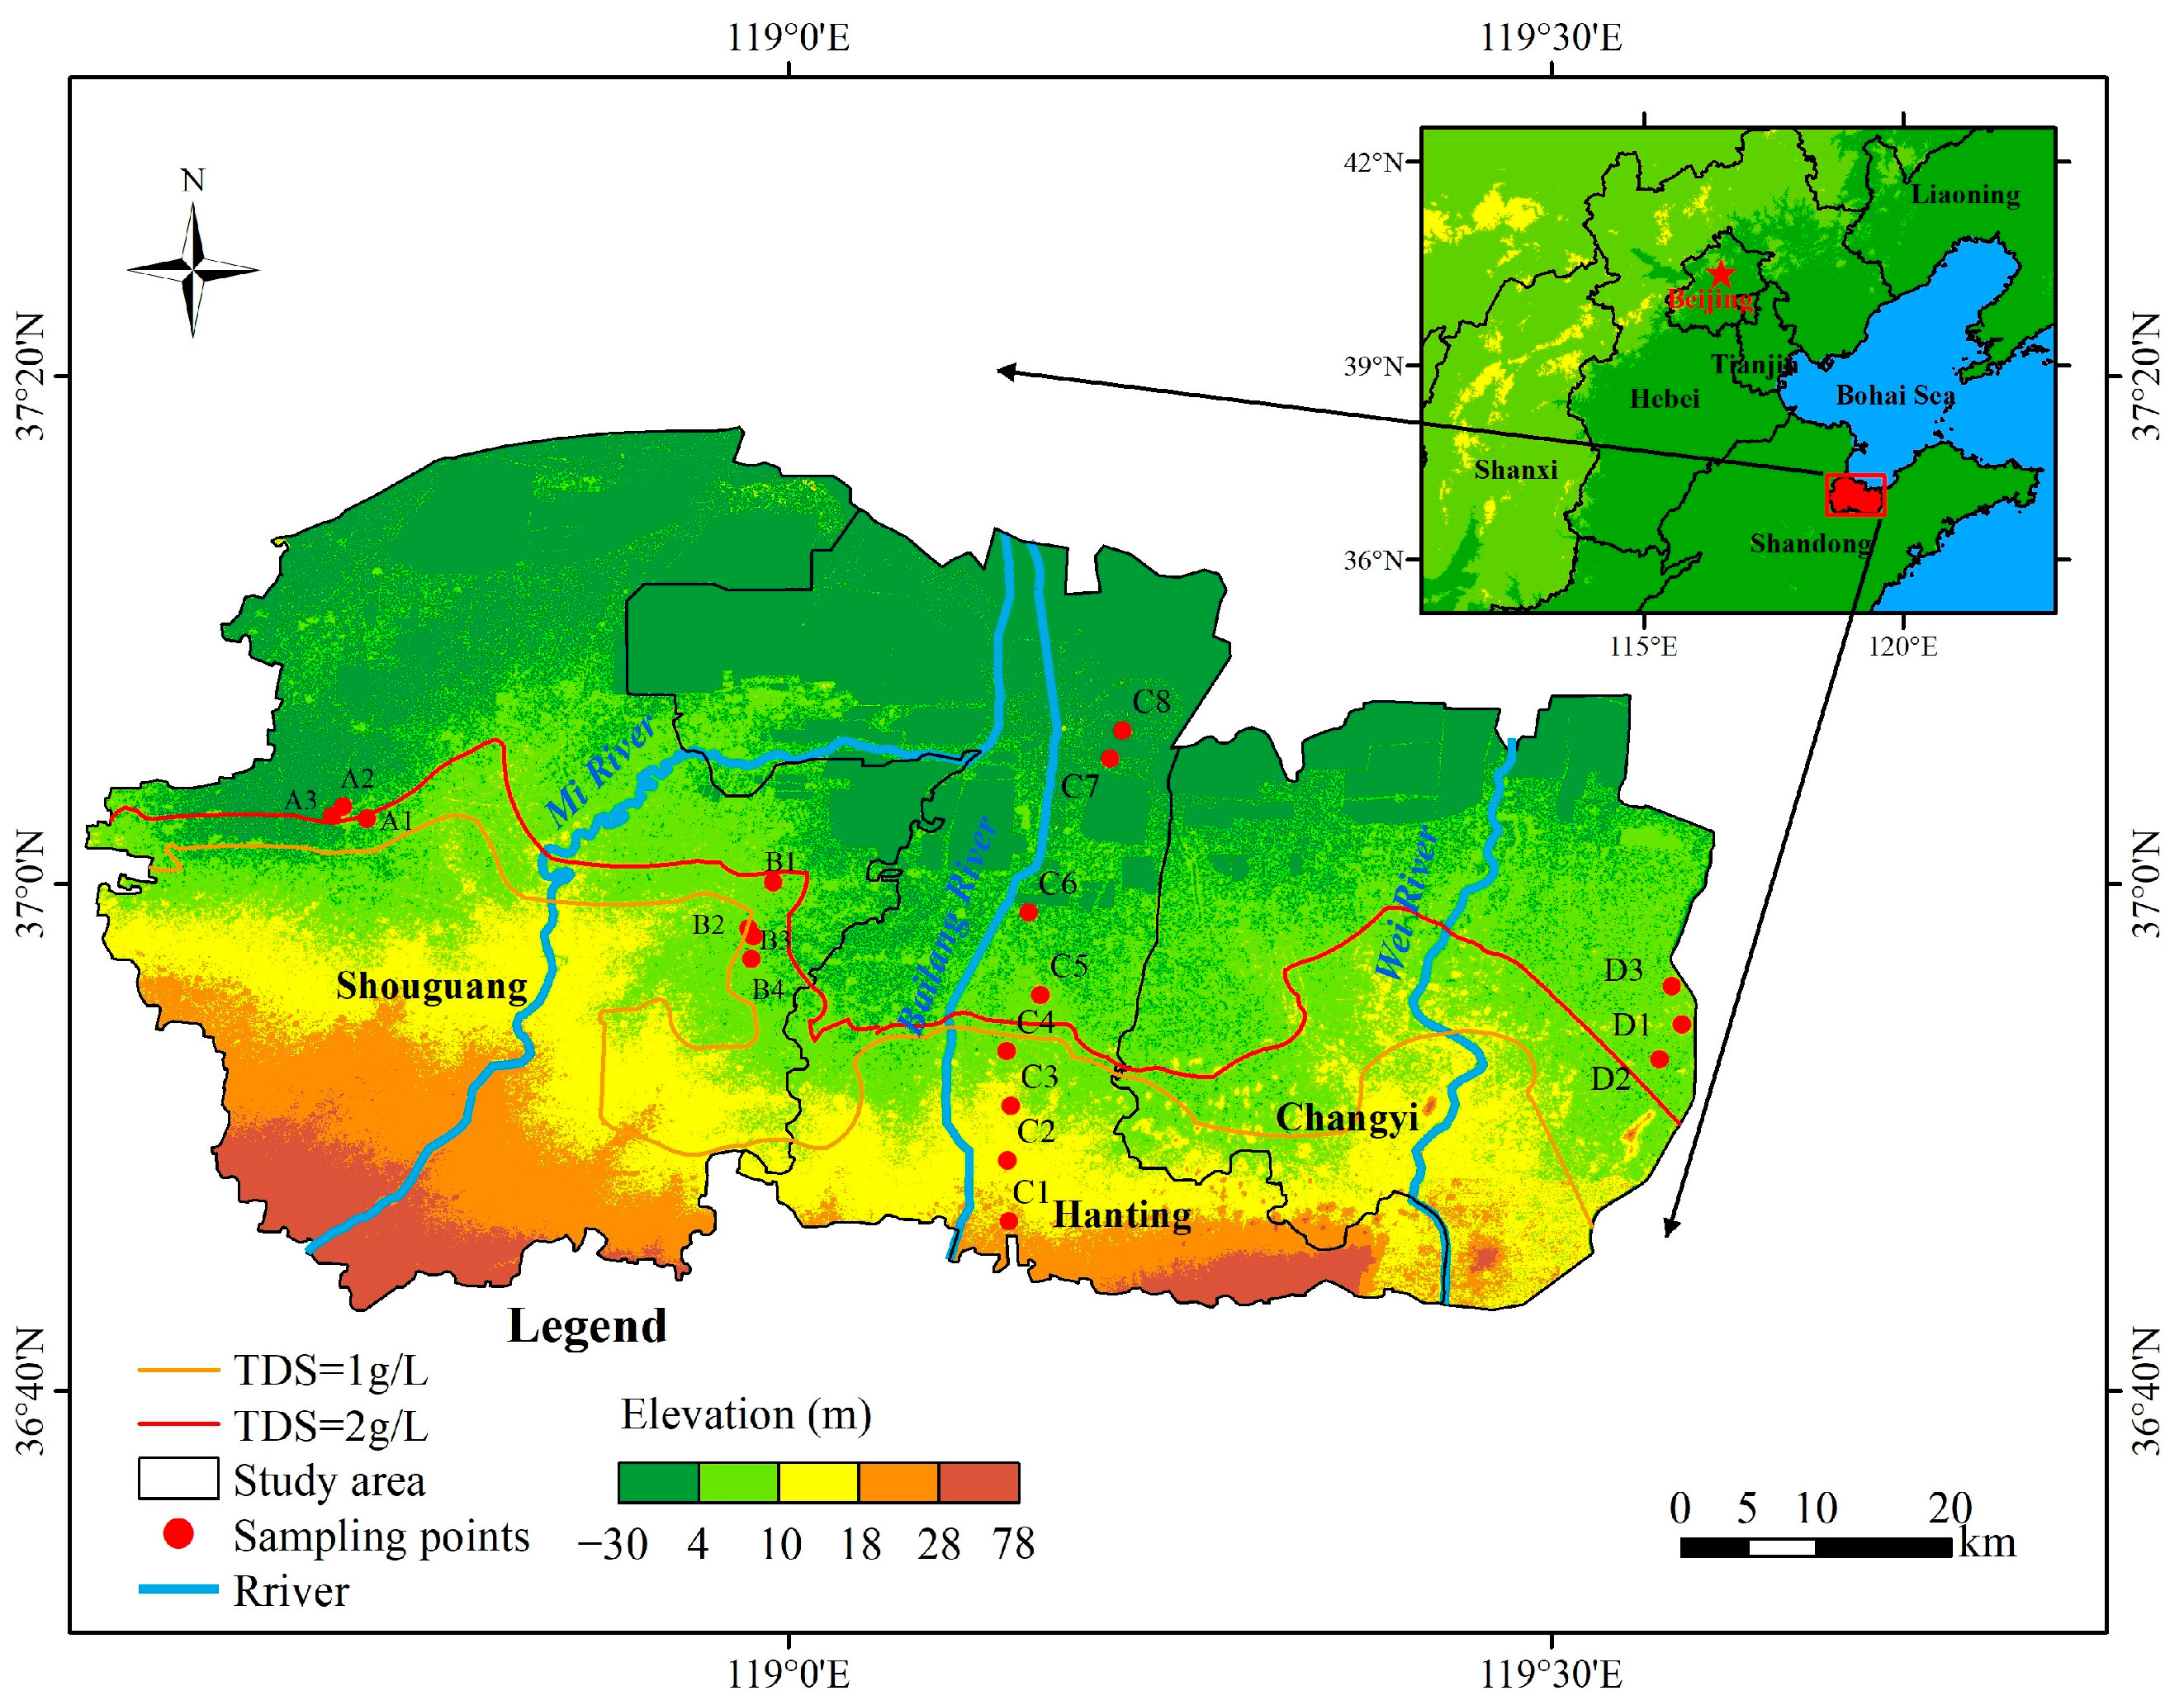
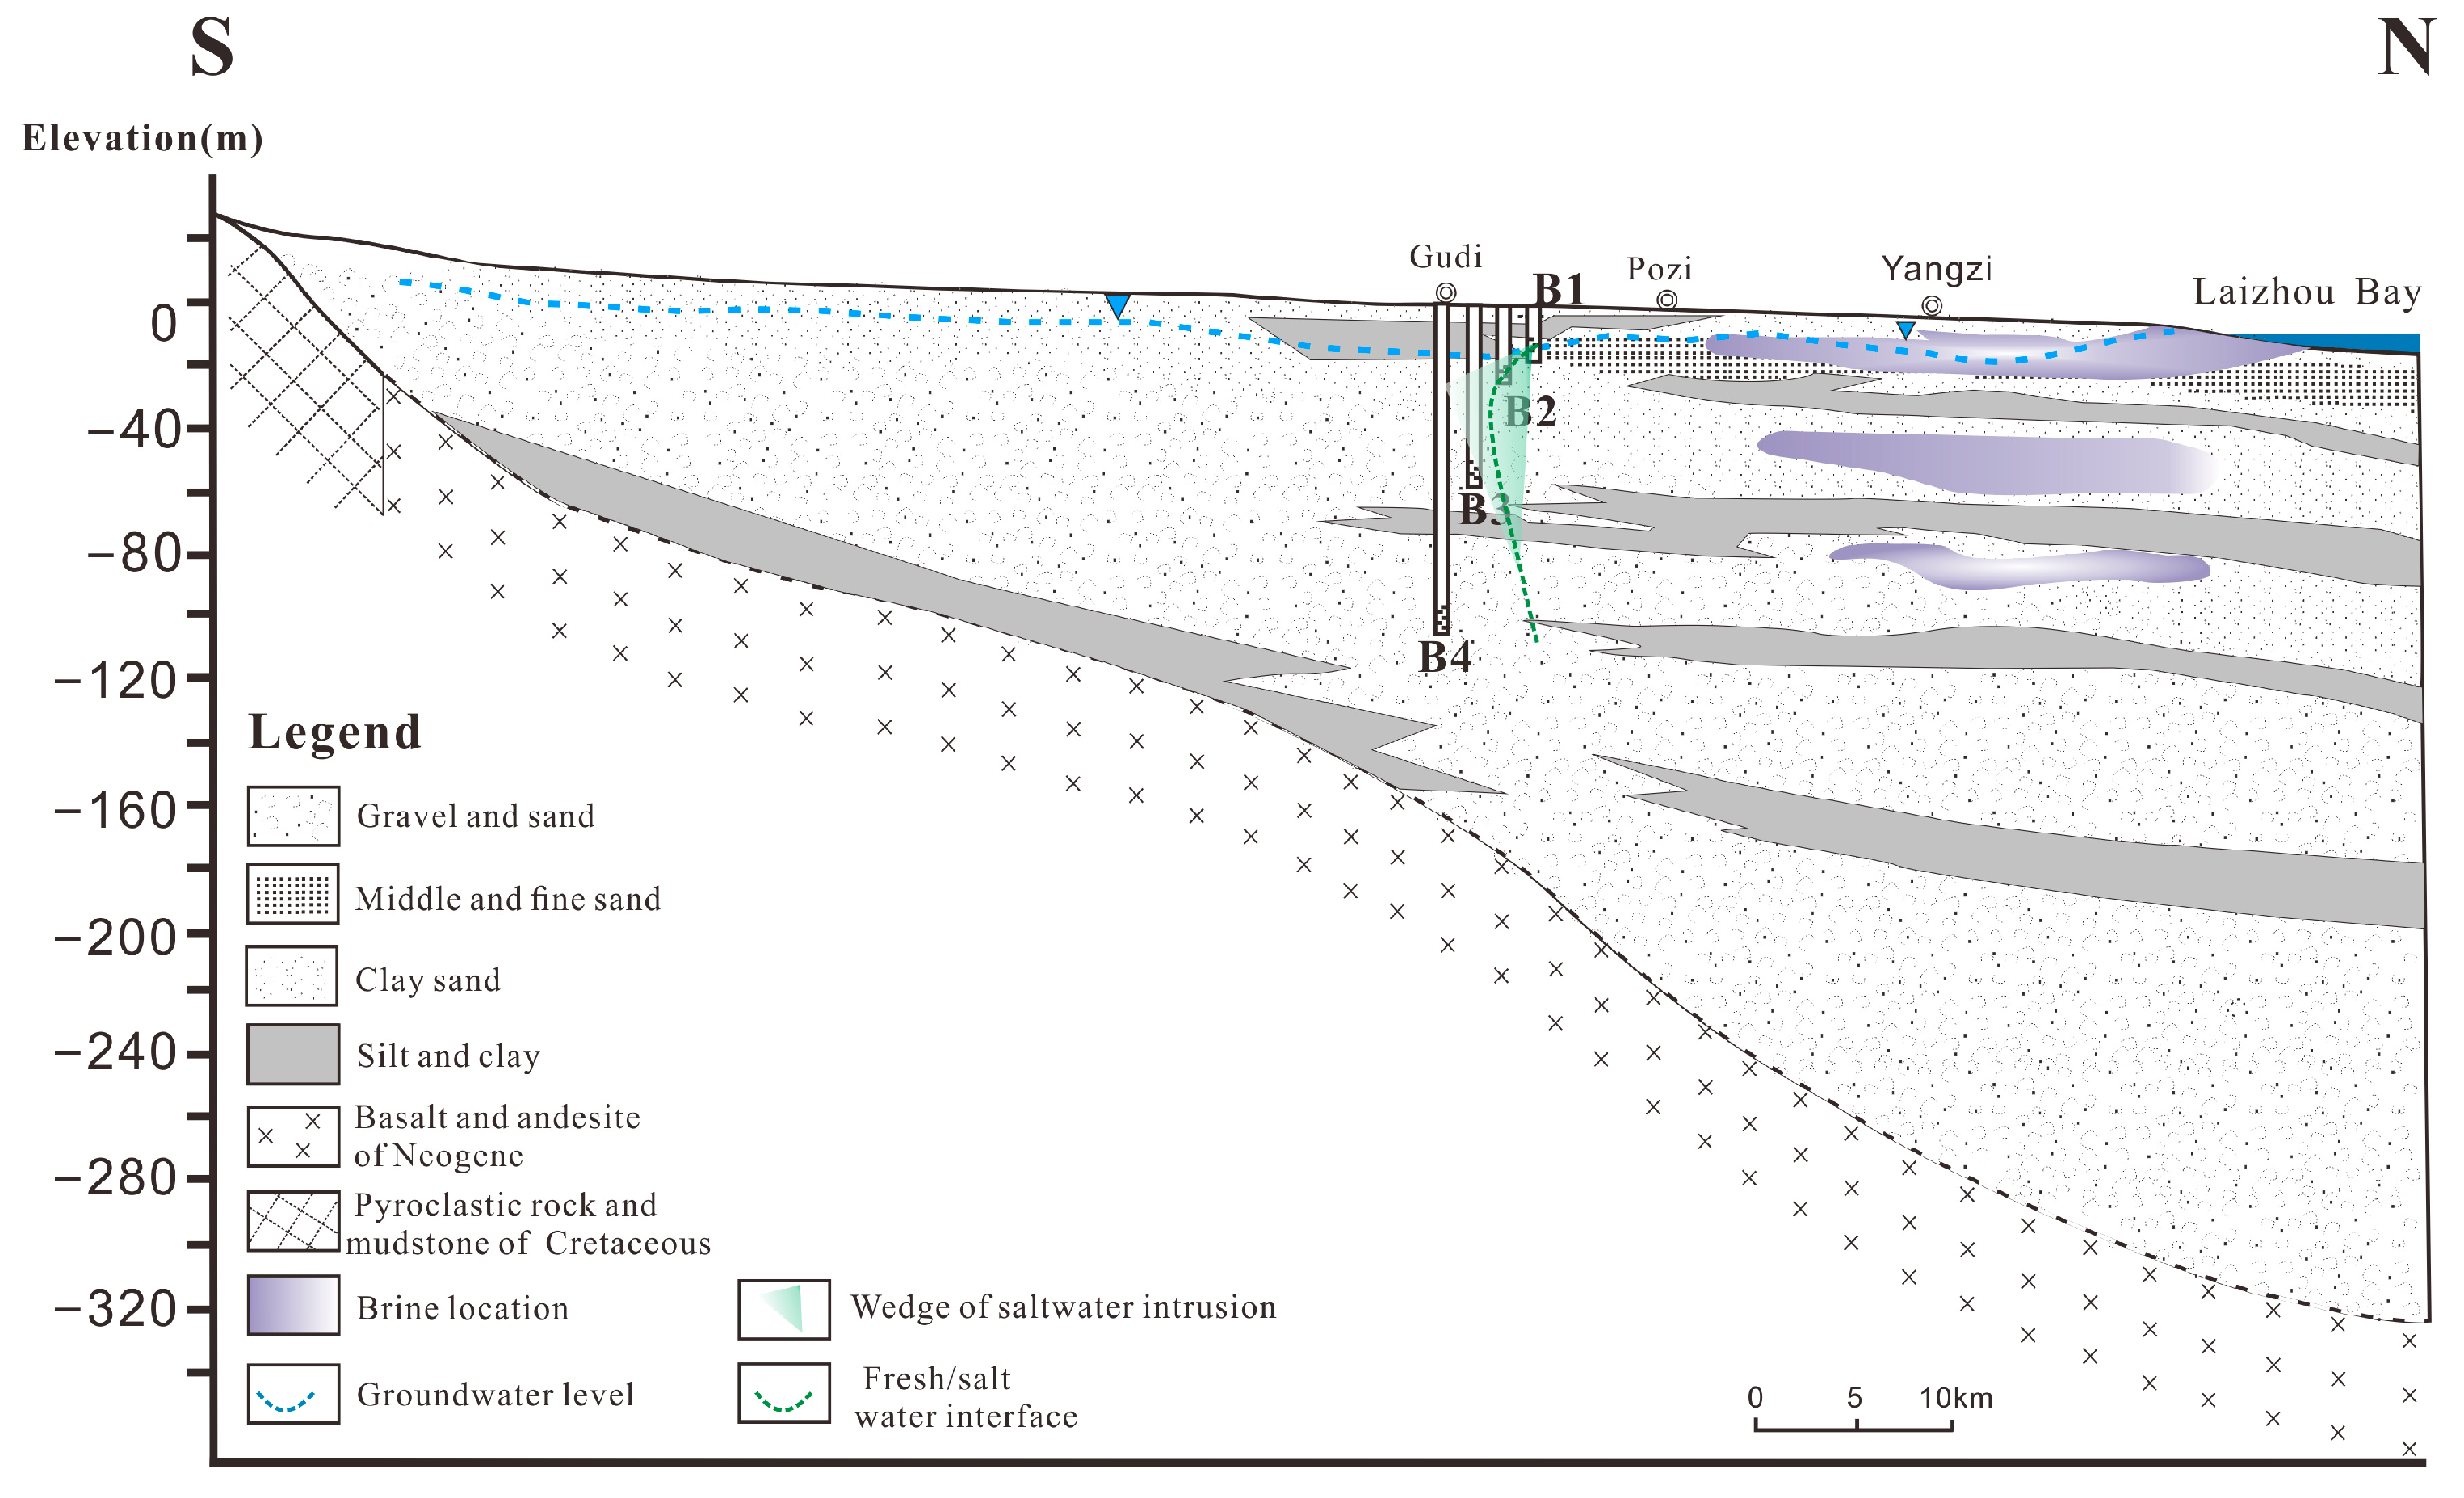
2. Study Area
3. Materials and Methods
3.1. Groundwater Sampling
3.2. Sample Analysis
4. Results
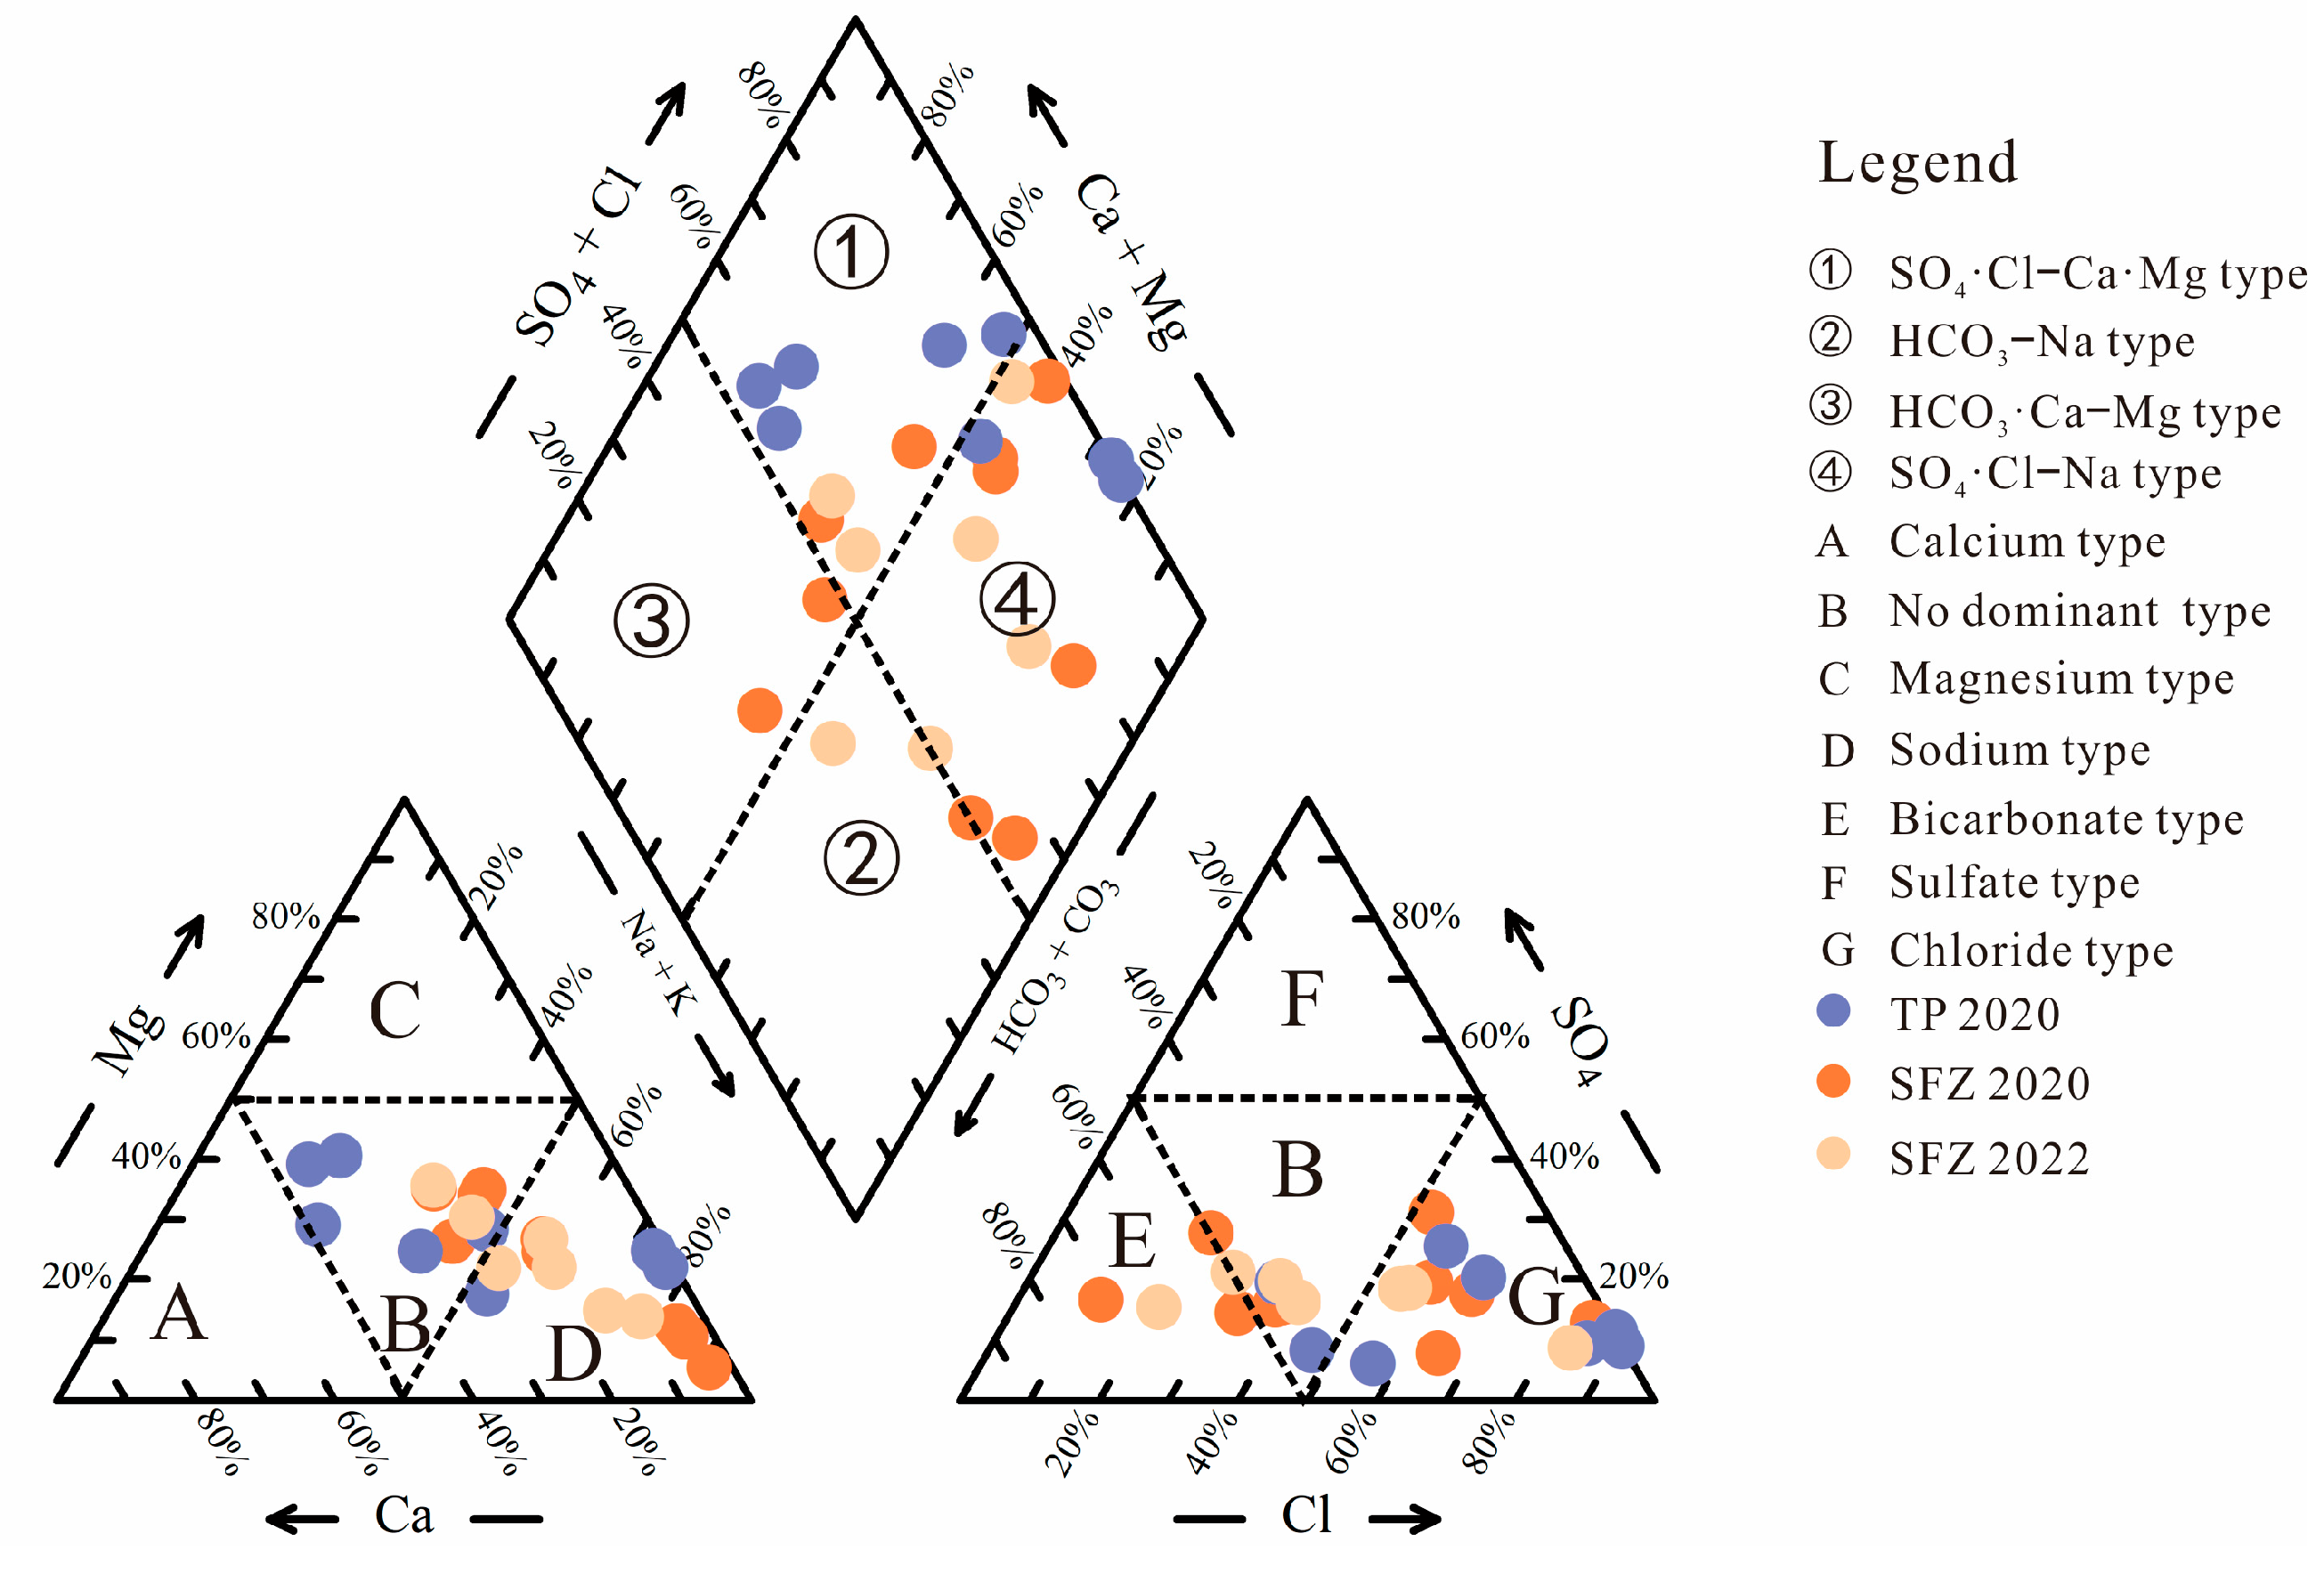
4.1. Hydrogeochemical Properties
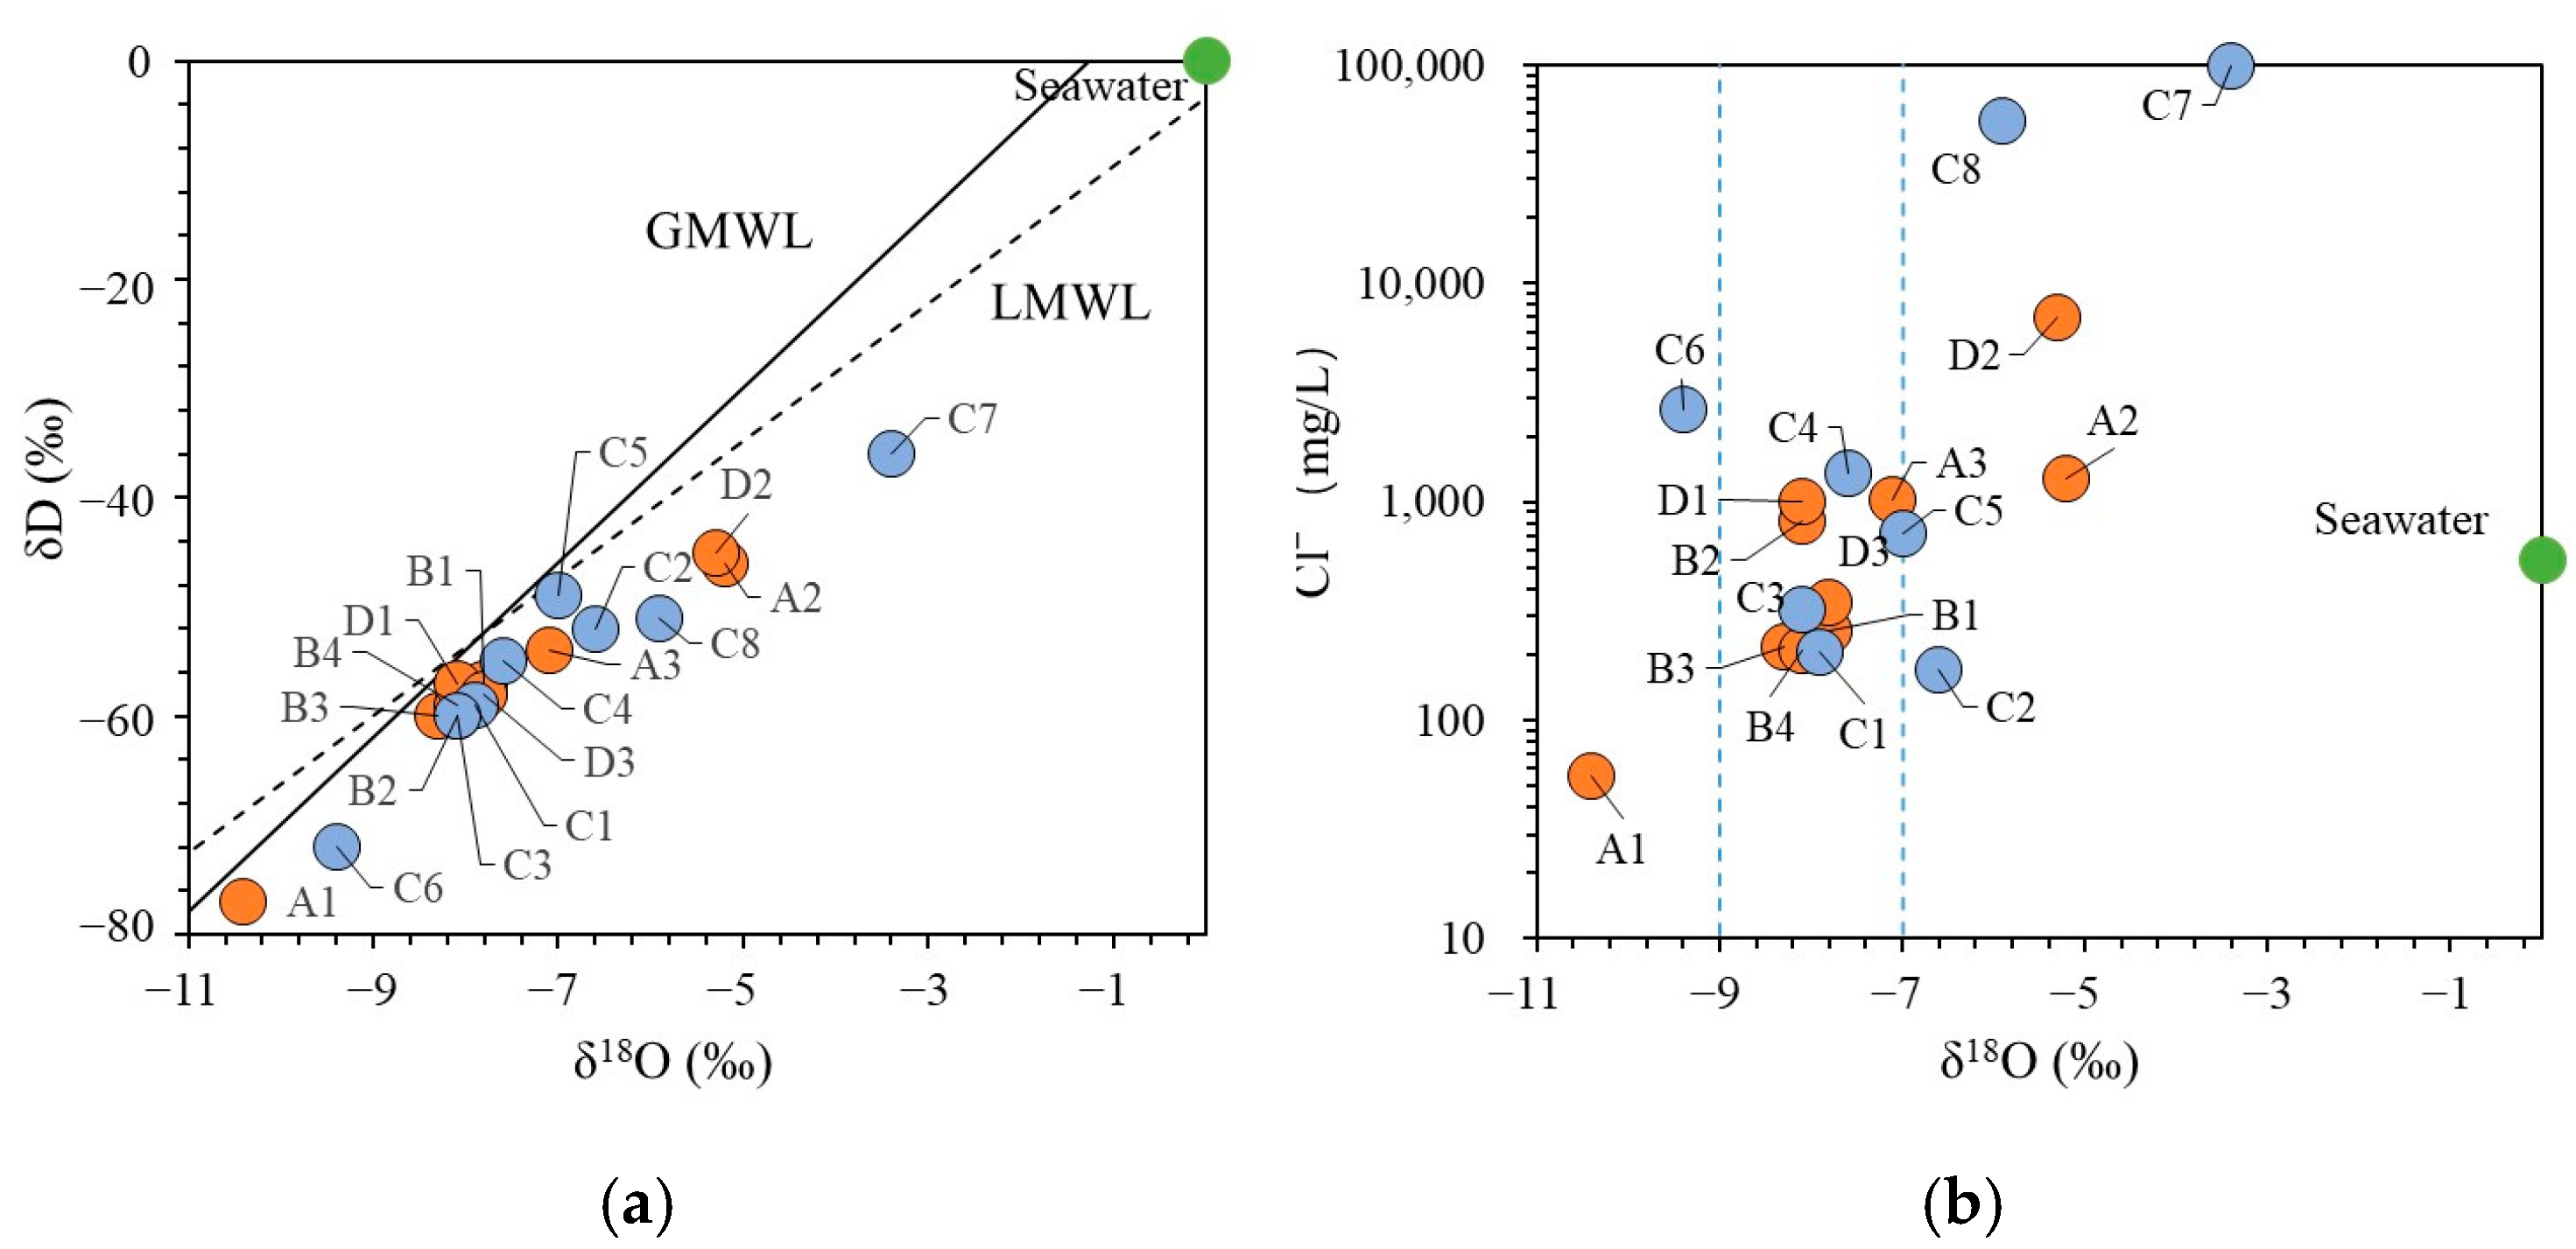
4.2. Origin of Groundwater and Salinity
5. Discussion
5.1. Saltwater Intrusion Processes
5.2. Environmental Management Implications
6. Conclusions
Author Contributions
Funding
Data Availability Statement
Conflicts of Interest
References
- Kumar, M.; Rao, M.S.; Deka, J.P.; Ramanathan, A.; Kumar, B. Integrated Hydrogeochemical, Isotopic and Geomorphological Depiction of the Groundwater Salinization in the Aquifer System of Delhi, India. J. Asian Earth Sci. 2015, 111, 936–947. [Google Scholar] [CrossRef]
- Chen, H.; Wu, M.; Duan, Z.; Zha, Y.; Wang, S.; Yang, L.; Zou, L.; Zheng, M.; Chen, P.; Cao, W.; et al. Forecasting the Human and Climate Impacts on Groundwater Resources in the Irrigated Agricultural Region of North China Plain. Hydrol. Process. 2023, 37, e14853. [Google Scholar] [CrossRef]
- Kuang, X.; Liu, J.; Scanlon, B.R.; Jiao, J.J.; Jasechko, S.; Lancia, M.; Biskaborn, B.K.; Wada, Y.; Li, H.; Zeng, Z.; et al. The Changing Nature of Groundwater in the Global Water Cycle. Science 2024, 383, eadf0630. [Google Scholar] [CrossRef] [PubMed]
- Shi, W.; Lu, C.; Ye, Y.; Wu, J.; Li, L.; Luo, J. Assessment of the Impact of Sea-Level Rise on Steady-State Seawater Intrusion in a Layered Coastal Aquifer. J. Hydrol. 2018, 563, 851–862. [Google Scholar] [CrossRef]
- Chang, S.W.; Clement, T.P.; Simpson, M.J.; Lee, K.-K. Does Sea-Level Rise Have an Impact on Saltwater Intrusion? Adv. Water Resour. 2011, 34, 1283–1291. [Google Scholar] [CrossRef]
- Chala, D.C.; Quiñones-Bolaños, E.; Mehrvar, M. An Integrated Framework to Model Salinity Intrusion in Coastal Unconfined Aquifers Considering Intrinsic Vulnerability Factors, Driving Forces, and Land Subsidence. J. Environ. Chem. Eng. 2022, 10, 106873. [Google Scholar] [CrossRef]
- Sun, Q.; Gao, M.; Wen, Z.; Guo, F.; Hou, G.; Liu, Z.; Cai, Z.; Chang, X.; Zheng, T.; Zhao, G. Reactive Transport Modeling for the Effect of Pumping Activities on the Groundwater Environment in Muddy Coasts. J. Hydrol. 2023, 621, 129614. [Google Scholar] [CrossRef]
- Liu, S.; Tang, Z.; Gao, M.; Hou, G. Evolutionary Process of Saline-Water Intrusion in Holocene and Late Pleistocene Groundwater in Southern Laizhou Bay. Sci. Total Environ. 2017, 607–608, 586–599. [Google Scholar] [CrossRef]
- Yang, F.; Liu, S.; Jia, C.; Gao, M.; Chang, W.; Wang, Y. Hydrochemical Characteristics and Functions of Groundwater in Southern Laizhou Bay Based on the Multivariate Statistical Analysis Approach. Estuarine. Coast. Shelf Sci. 2021, 250, 107153. [Google Scholar] [CrossRef]
- Herrera, C.; Godfrey, L.; Urrutia, J.; Custodio, E.; Gamboa, C.; Jódar, J.; Lam, E.; Fuentes, J. Origin of Old Saline Groundwater in the Deep Coastal Formations of the Atacama Desert Region: Consideration of Lithium, Boron, Strontium and Uranium Isotopes Contents. J. Hydrol. 2023, 624, 129919. [Google Scholar] [CrossRef]
- Christofi, C.; Bruggeman, A.; Kuells, C.; Constantinou, C. Isotope Hydrology and Hydrogeochemical Modeling of Troodos Fractured Aquifer, Cyprus: The Development of Hydrogeological Descriptions of Observed Water Types. Appl. Geochem. 2020, 123, 104780. [Google Scholar] [CrossRef]
- Herrera, C.; Custodio, E. Groundwater Flow in a Relatively Old Oceanic Volcanic Island: The Betancuria Area, Fuerteventura Island, Canary Islands, Spain. Sci. Total Environ. 2014, 496, 531–550. [Google Scholar] [CrossRef] [PubMed]
- Lee, S.; Currell, M.; Cendón, D.I. Marine Water from Mid-Holocene Sea Level Highstand Trapped in a Coastal Aquifer: Evidence from Groundwater Isotopes, and Environmental Significance. Sci. Total Environ. 2016, 544, 995–1007. [Google Scholar] [CrossRef] [PubMed]
- Su, Q.; Yu, Y.; Chen, M.; Fu, T.; Lyu, W.; Liu, W. Exploration of the Formation Mechanism of Underground Brine Based on Hydrodynamic Environment Analysis Using Grain-Size Data of One Drilling Core. J. Mar. Sci. Eng. 2024, 12, 2122. [Google Scholar] [CrossRef]
- Sun, Q.; Gao, M.; Wen, Z.; Hou, G.; Dang, X.; Liu, S.; Zhao, G. Hydrochemical Evolution Processes of Multiple-Water Quality Interfaces (Fresh/Saline Water, Saline Water/Brine) on Muddy Coast under Pumping Conditions. Sci. Total Environ. 2022, 857, 159297. [Google Scholar] [CrossRef]
- Jia, C.; Kong, K.; Yao, Y.; Yang, X.; Wang, D.; Shao, S. Combining Multi-Source Data to Identify the Paleochannel System in the Saltwater Intrusion Area. Mar. Georesources Geotechnol. 2024, 42, 562–576. [Google Scholar] [CrossRef]
- Mulligan, A.E.; Evans, R.L.; Lizarralde, D. The Role of Paleochannels in Groundwater/Seawater Exchange. J. Hydrol. 2007, 335, 313–329. [Google Scholar] [CrossRef]
- Chang, Y.; Hu, B.X.; Xu, Z.; Li, X.; Tong, J.; Chen, L.; Zhang, H.; Miao, J.; Liu, H.; Ma, Z. Numerical Simulation of Seawater Intrusion to Coastal Aquifers and Brine Water/Freshwater Interaction in South Coast of Laizhou Bay, China. J. Contam. Hydrol. 2018, 215, 1–10. [Google Scholar] [CrossRef]
- Han, D.M.; Song, X.F.; Currell, M.J.; Yang, J.L.; Xiao, G.Q. Chemical and Isotopic Constraints on Evolution of Groundwater Salinization in the Coastal Plain Aquifer of Laizhou Bay, China. J. Hydrol. 2014, 508, 12–27. [Google Scholar] [CrossRef]
- Du, Y.; Ma, T.; Chen, L.; Shan, H.; Xiao, C.; Lu, Y.; Liu, C.; Cai, H. Genesis of Salinized Groundwater in Quaternary Aquifer System of Coastal Plain, Laizhou Bay, China: Geochemical Evidences, Especially from Bromine Stable Isotope. Applied Geochemistry 2015, 59, 155–165. [Google Scholar] [CrossRef]
- Piper, A.M. A Graphic Procedure in the Geochemical Interpretation of Water-analyses. Eos Trans. Am. Geophys. Union 1944, 25, 914–928. [Google Scholar] [CrossRef]
- Zhi, C.; Hu, X.; Yang, F.; Huang, X.; Chen, H.; Chen, L.; Chen, G.; Wu, Z.; Wang, S. Unraveling Microbial Community Variation along a Salinity Gradient and Indicative Significance to Groundwater Salinization in the Coastal Aquifer. J. Hydrol. 2024, 642, 131893. [Google Scholar] [CrossRef]
- Craig, H. Isotopic Variations in Meteoric Waters. Science 1961, 133, 1702–1703. [Google Scholar] [CrossRef] [PubMed]
- Guo, S.; Wang, X.; Zhang, Q.; Wu, G.; Yang, P.; Chen, J. Recognition and Vertical Spatiotemporal Distribution of Brine Intrusion in the Weibei Plain. Coast. Eng. 2024, 43, 24–37. (In Chinese) [Google Scholar]
- Pang, Z.; Kong, Y.; Li, J.; Tian, J. An Isotopic Geoindicator in the Hydrological Cycle. Procedia Earth Planet. Sci. 2017, 17, 534–537. [Google Scholar] [CrossRef]
- Han, D.; Kohfahl, C.; Song, X.; Xiao, G.; Yang, J. Geochemical and Isotopic Evidence for Palaeo-Seawater Intrusion into the South Coast Aquifer of Laizhou Bay, China. Appl. Geochem. 2011, 26, 863–883. [Google Scholar] [CrossRef]
- Qi, H.; Ma, C.; He, Z.; Hu, X.; Gao, L. Lithium and Its Isotopes as Tracers of Groundwater Salinization: A Study in the Southern Coastal Plain of Laizhou Bay, China. Sci. Total Environ. 2019, 650, 878–890. [Google Scholar] [CrossRef]
- Gibbs, R.J. Mechanisms Controlling World Water Chemistry. Science 1970, 17, 1088–1090. [Google Scholar] [CrossRef]
- Giménez-Forcada, E. Dynamic of Sea Water Interface Using Hydrochemical Facies Evolution Diagram. Groundwater 2010, 48, 212–216. [Google Scholar] [CrossRef]
- Amiri, V.; Nakhaei, M.; Lak, R.; Kholghi, M. Assessment of Seasonal Groundwater Quality and Potential Saltwater Intrusion: A Study Case in Urmia Coastal Aquifer (NW Iran) Using the Groundwater Quality Index (GQI) and Hydrochemical Facies Evolution Diagram (HFE-D). Stoch. Environ. Res. Risk Assess. 2016, 30, 1473–1484. [Google Scholar] [CrossRef]
- Giménez-Forcada, E. Space/Time Development of Seawater Intrusion: A Study Case in Vinaroz Coastal Plain (Eastern Spain) Using HFE-Diagram, and Spatial Distribution of Hydrochemical Facies. J. Hydrol. 2014, 517, 617–627. [Google Scholar] [CrossRef]
- Han, D.; Currell, M.J. Review of Drivers and Threats to Coastal Groundwater Quality in China. Sci. Total Environ. 2022, 806, 150913. [Google Scholar] [CrossRef] [PubMed]
- Werner, A.D.; Bakker, M.; Post, V.E.A.; Vandenbohede, A.; Lu, C.; Ataie-Ashtiani, B.; Simmons, C.T.; Barry, D.A. Seawater Intrusion Processes, Investigation and Management: Recent Advances and Future Challenges. Adv. Water Resour. 2013, 51, 3–26. [Google Scholar] [CrossRef]
- Sawyer, A.H.; David, C.H.; Famiglietti, J.S. Continental Patterns of Submarine Groundwater Discharge Reveal Coastal Vulnerabilities. Science 2016, 353, 705–707. [Google Scholar] [CrossRef]
- Zheng, T.; Zheng, X.; Chang, Q.; Zhan, H.; Walther, M. Timescale and Effectiveness of Residual Saltwater Desalinization Behind Subsurface Dams in an Unconfined Aquifer. Water Resour. Res. 2021, 57, e2020WR028493. [Google Scholar] [CrossRef]
- Zhu, M.; Wang, S.; Kong, X.; Zheng, W.; Feng, W.; Zhang, X.; Yuan, R.; Song, X.; Sprenger, M. Interaction of Surface Water and Groundwater Influenced by Groundwater Over-Extraction, Waste Water Discharge and Water Transfer in Xiong’an New Area, China. Water 2019, 11, 539. [Google Scholar] [CrossRef]


| Location | Time | K+ | Na+ | Ca2+ | Mg2+ | SO42− | HCO3− | Cl− | TDS | |
|---|---|---|---|---|---|---|---|---|---|---|
| mg/L | mg/L | mg/L | mg/L | mg/L | mg/L | mg/L | mg/L | |||
| TP | 2020 | Max | 1479 | 53,800 | 850 | 8295 | 13,284 | 580.3 | 99,546 | 177,947 |
| Min | 0.7 | 63.54 | 127.3 | 46.72 | 46.88 | 288.3 | 170.8 | 907.1 | ||
| Average | 290.35 | 10,932 | 391.58 | 1844 | 3067.771 | 404.4143 | 20,101 | 37,199 | ||
| Median | 3.425 | 586.6 | 343.95 | 150.255 | 413.75 | 383.5 | 1036.25 | 3570 | ||
| SFZ | 2020 | Max | 188.8 | 3014 | 800.9 | 679 | 1418 | 1023 | 6933 | 13,285 |
| Min | 1.27 | 96.46 | 18.04 | 17.72 | 104.8 | 380.6 | 56.02 | 706.7 | ||
| Average | 28.876 | 763 | 172 | 154 | 430 | 643 | 1215 | 3530 | ||
| Median | 13.87 | 575.3 | 112.2 | 97.81 | 284.5 | 625.15 | 582 | 2456.5 | ||
| SFZ | 2022 | Max | 22.26 | 1341 | 569.02 | 295.32 | 446.55 | 857.83 | 3123 | 6352 |
| Min | 1.04 | 82.5 | 20.76 | 20.53 | 46.04 | 243.91 | 46.61 | 343 | ||
| Average | 9.72 | 523.24 | 159.03 | 102.81 | 262.26 | 577.3 | 801.88 | 2316.57 | ||
| Median | 10.08 | 454.22 | 98.82 | 83.09 | 277.55 | 539.33 | 279 | 1694 |
Disclaimer/Publisher’s Note: The statements, opinions and data contained in all publications are solely those of the individual author(s) and contributor(s) and not of MDPI and/or the editor(s). MDPI and/or the editor(s) disclaim responsibility for any injury to people or property resulting from any ideas, methods, instructions or products referred to in the content. |
© 2025 by the authors. Licensee MDPI, Basel, Switzerland. This article is an open access article distributed under the terms and conditions of the Creative Commons Attribution (CC BY) license (https://creativecommons.org/licenses/by/4.0/).
Share and Cite
Wang, X.; Dai, X.; Wu, G.; Yang, F.; Zhang, Y.; Hu, X.; Yao, Y.; Dong, Y. Hydrochemistry and Evolutionary Processes During Saltwater Intrusion in the Saline–Fresh Groundwater Transition Zone in Southern Laizhou Bay, China. Water 2025, 17, 1081. https://doi.org/10.3390/w17071081
Wang X, Dai X, Wu G, Yang F, Zhang Y, Hu X, Yao Y, Dong Y. Hydrochemistry and Evolutionary Processes During Saltwater Intrusion in the Saline–Fresh Groundwater Transition Zone in Southern Laizhou Bay, China. Water. 2025; 17(7):1081. https://doi.org/10.3390/w17071081
Chicago/Turabian StyleWang, Xiaowei, Xingwang Dai, Guangwei Wu, Fan Yang, Yongwei Zhang, Xiaonong Hu, Yingqiang Yao, and Yulong Dong. 2025. "Hydrochemistry and Evolutionary Processes During Saltwater Intrusion in the Saline–Fresh Groundwater Transition Zone in Southern Laizhou Bay, China" Water 17, no. 7: 1081. https://doi.org/10.3390/w17071081
APA StyleWang, X., Dai, X., Wu, G., Yang, F., Zhang, Y., Hu, X., Yao, Y., & Dong, Y. (2025). Hydrochemistry and Evolutionary Processes During Saltwater Intrusion in the Saline–Fresh Groundwater Transition Zone in Southern Laizhou Bay, China. Water, 17(7), 1081. https://doi.org/10.3390/w17071081