Article

The Impacts of Satellite Data Quality Control and Meteorological Forcings on Snow Data Assimilation over the Sanjiangyuan Region

1
School of Hydrology and Water Resources, Nanjing University of Information Science and Technology, Nanjing 210044, China
2
State Key Laboratory of Earth System Numerical Modeling and Application, Institute of Atmospheric Physics, Chinese Academy of Sciences, Beijing 100029, China
3
Key Laboratory of Hydrometeorological Disaster Mechanism and Warning of Ministry of Water Resources, Nanjing University of Information Science and Technology, Nanjing 210044, China
4
State Key Laboratory of Severe Weather and Institute of Artificial Intelligence for Meteorology, Chinese Academy of Meteorological Sciences, Beijing 100081, China
*
Author to whom correspondence should be addressed.
Water 2025, 17(7), 1078; https://doi.org/10.3390/w17071078
Submission received: 11 February 2025 / Revised: 19 March 2025 / Accepted: 2 April 2025 / Published: 4 April 2025
(This article belongs to the Section Hydrology)

Abstract

:
The effectiveness of snow data assimilation is closely related to the satellite data quality control that affects snow cover data used for assimilation and meteorological forcings that drive land surface model to estimate snow depth, especially over headwater regions where in situ measurements are sparse and land surface simulations are challenging. This study proposes a joint quality control scheme based on precipitation constraints and cloud thresholds, uses the Ensemble Square Root Filter to assimilate the controlled data to improve snow depth estimation from the Conjunctive Surface-Subsurface Process model version 2 (CSSPv2), and explores the impacts of different forcing data on the assimilation. The correlation between the assimilated monthly snow depth data and the in situ measurements averaged over 21 stations during November–February of 2000–2015 is 0.93, and the root mean square error is 0.22 cm. Compared with CSSPv2 model simulation, the correlation increased by 5.6%, and the error decreased by 18.5%. The joint quality control scheme has led to an average accuracy improvement of 47%, while the high-quality forcing data have resulted in an average enhancement of 58%. This study suggests that satellite data quality control and meteorological forcings are important for increasing correlation and decreasing error for snow depth assimilation, respectively.

1. Introduction

Snow, characterized by high albedo, low roughness, and high thermal conductivity, plays an important role in formulating and modulating climate [1,2,3]. Over the Qinghai-Tibet Plateau, the snow cover has a positive radiative forcing on regional climate [4], and the abnormal distribution of winter snowfall can influence the weather over East Asia by causing circulation anomalies in East Asian winter monsoon [5]. However, the snow depth data over mountainous and alpine regions (e.g., Qinghai-Tibet Plateau) still have large uncertainties due to the lack of sufficient in situ observations and difficulties in snow modeling [6]. The absence of high-quality snow depth data products impedes further applications in hydrological analysis and forecasting [7,8].
The main sources of snow products are from station observation, satellite retrieval, and model simulation [9]. The in situ station observation is the most accurate, but its spatial representation is limited and the cost is high [10]. While satellite retrieval has a wide spatial coverage, its accuracy is affected by the cloud cover and the data record is not long enough for climate research [4]. Snow simulation through land surface models (LSMs) can provide long-term snow depth products with spatio-temporal continuity [11,12,13]. However, the model simulation still has uncertainties influenced by the accuracy of surface and meteorological forcing data, together with the imperfect model parameterization schemes [14]. Meteorological forcings are essential inputs for land surface models, encompassing a variety of meteorological variables such as precipitation, air temperature, shortwave radiation, and longwave radiation. Therefore, numerous assimilation methods, including ensemble Kalman filter (EnKF) [15,16], Ensemble Square Root filter (EnSRF) [17], and three-dimensional/four-dimensional variational method [18], have been developed to assimilate in situ observation or remote sensing data into land surface simulation, so as to reduce the simulation error [19,20].
The performance of snow data assimilation is closely related to the selection of forcing data and quality control schemes [21]. Quality control methods intend to improve assimilation performance by removing erroneous and anomalous record [22,23]. However, the performance of quality control schemes can vary significantly between different regions [10]. On the one hand, assimilating observations that deviate significantly from the background state may lead to unfavorable analysis results, compromising the stability of the analysis system [24]. On the other hand, rejecting these observations could prevent the analysis from absorbing useful information, especially in areas with large variations [19]. The meteorological forcing data, especially the precipitation, are crucial for hydrological simulation [25], and may also indirectly affect the assimilation analysis field through the quality control scheme [26,27]. How much a high-resolution precipitation dataset contributes to the improvement of snow assimilation requires further investigation.
Located over the eastern part of Qinghai-Tibet Plateau (Figure 1), Sanjiangyuan, is one of the highest, largest, and most concentrated areas with extensive snow-capped mountains and glaciers in the world [28,29]. Sanjiangyuan is known as the “Water Tower of China” by suppling fresh water for hundreds of millions of people [30,31]. There are significant differences in the meteorological forcing data in the Sanjiangyuan region [32], and the quality control schemes employed in assimilation work also vary [33]. Taking the Sanjiangyuan region as an example, this study constructs a snow assimilation system based on the Conjunctive Surface-Subsurface Process model version 2 (CSSPv2) high-resolution land surface model and the EnSRF method, produces high-quality regional assimilated snow depth data, and explores the impact of different quality control schemes and different meteorological forcing on snow data assimilation. The focuses of this study are listed as follows: (1) What is the influence of different quality control schemes on the snow assimilation in the Sanjiangyuan region? (2) How does the selection of forcing data affect the simulation and assimilation?

2. Materials and Methods

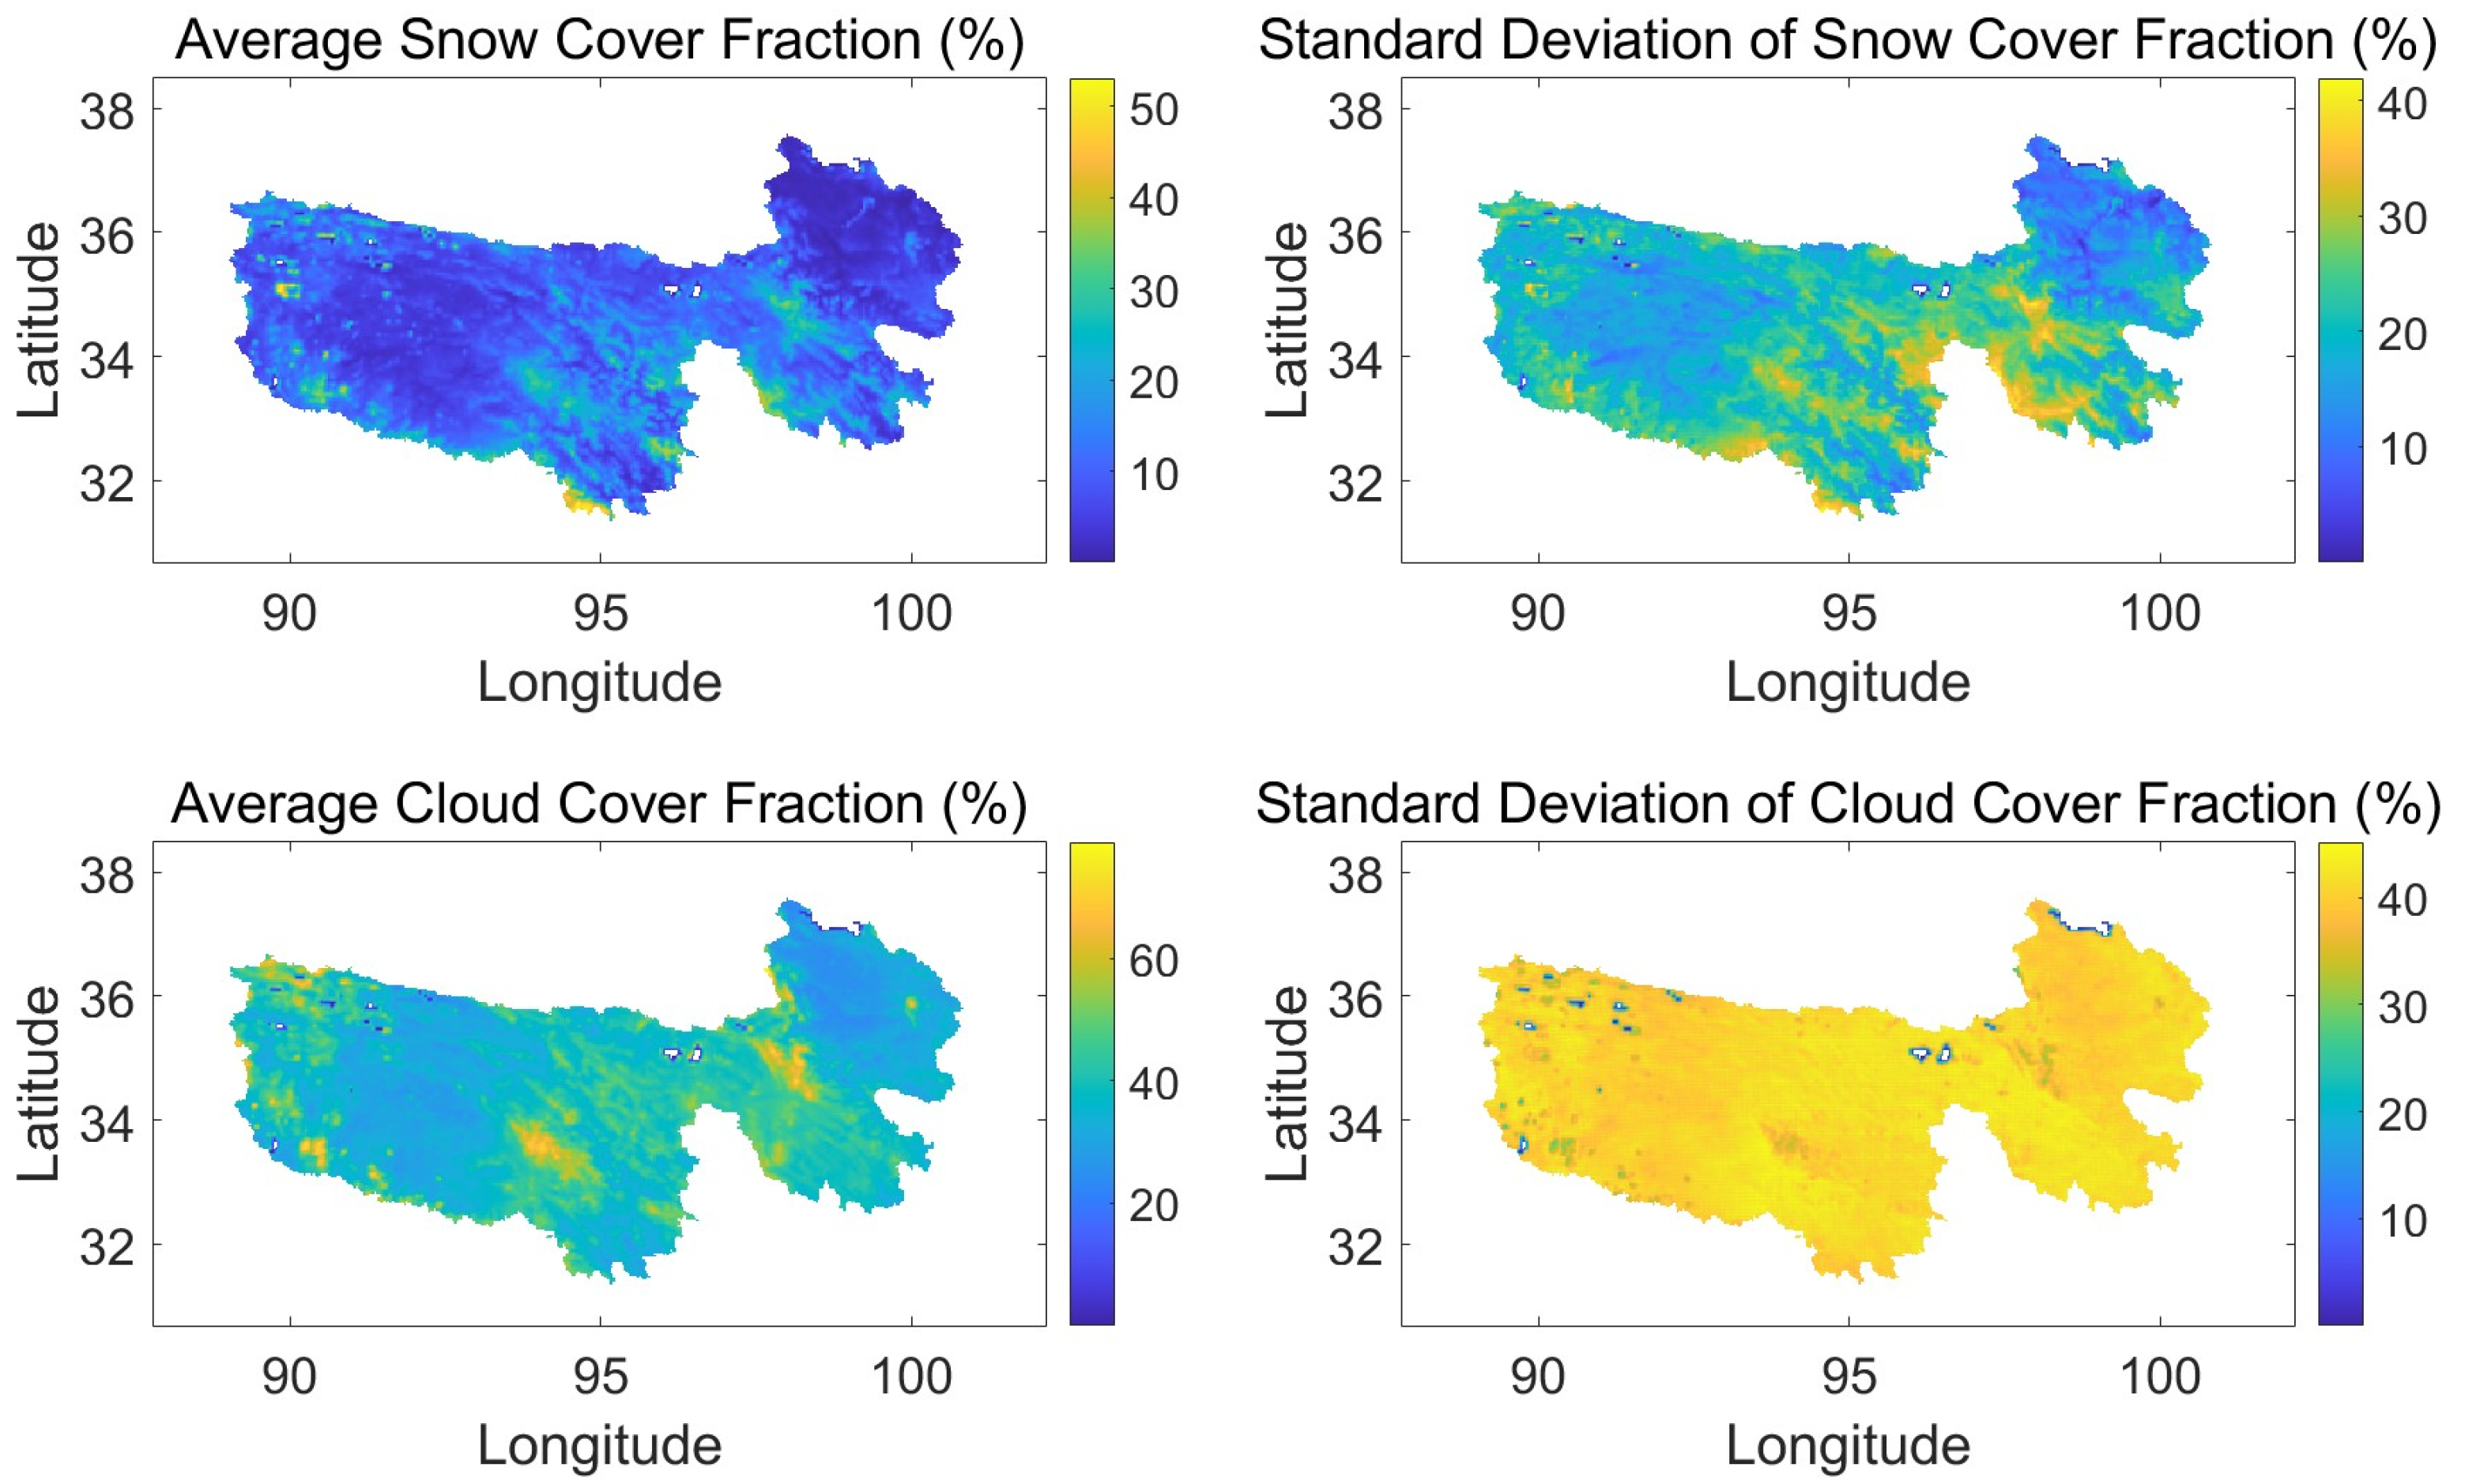
2.1. Study Area and Data

Daily snow depth observations over 21 national meteorological observation stations were collected from China Meteorological Administration (CMA; http://data.cma.cn/, accessed on 10 February 2025) (Figure 1). Table 1 shows the data, study period, and temporal and spatial resolution used in the experiments. The snow cover and cloud cover data, derived from the MODIS MOD10C1 product, have an original spatial resolution of 0.05° and a temporal resolution of daily. The data are interpolated to a 3 km simulation resolution. At moments when data are available, the pixel closest to the station is selected to represent the snow cover and cloud cover values for that station. The China meteorological forcing dataset (CMFD) [34] was used to drive CSSPv2. In addition, precipitation and temperature from the fifth generation European Centre for Medium-Range Weather Forecasts (ECMWF) Reanalysis (ERA5) [35] were also used to explore the impact of precipitation and temperature data on simulation and assimilation. The assimilated data are Moderate Resolution Imaging Spectroradiometer (MODIS) MOD10C1 snow cover fraction (SCF) data (MODIS) [36]. Since the albedo of clouds and snow can sometimes be similar (e.g., fresh snow and altostratus clouds), to eliminate the interference of cloud cover on SCF information, this study introduces MODIS MOD10C1 cloud cover data to perform quality control on the assimilation (Figure 2). The satellite remote sensing snow depth data from the National Institute of Tibetan Plateau Research (TPDC) of China [4] and the ERA5 snow depth data [35] were used to compare with the simulation and assimilation results of this study.

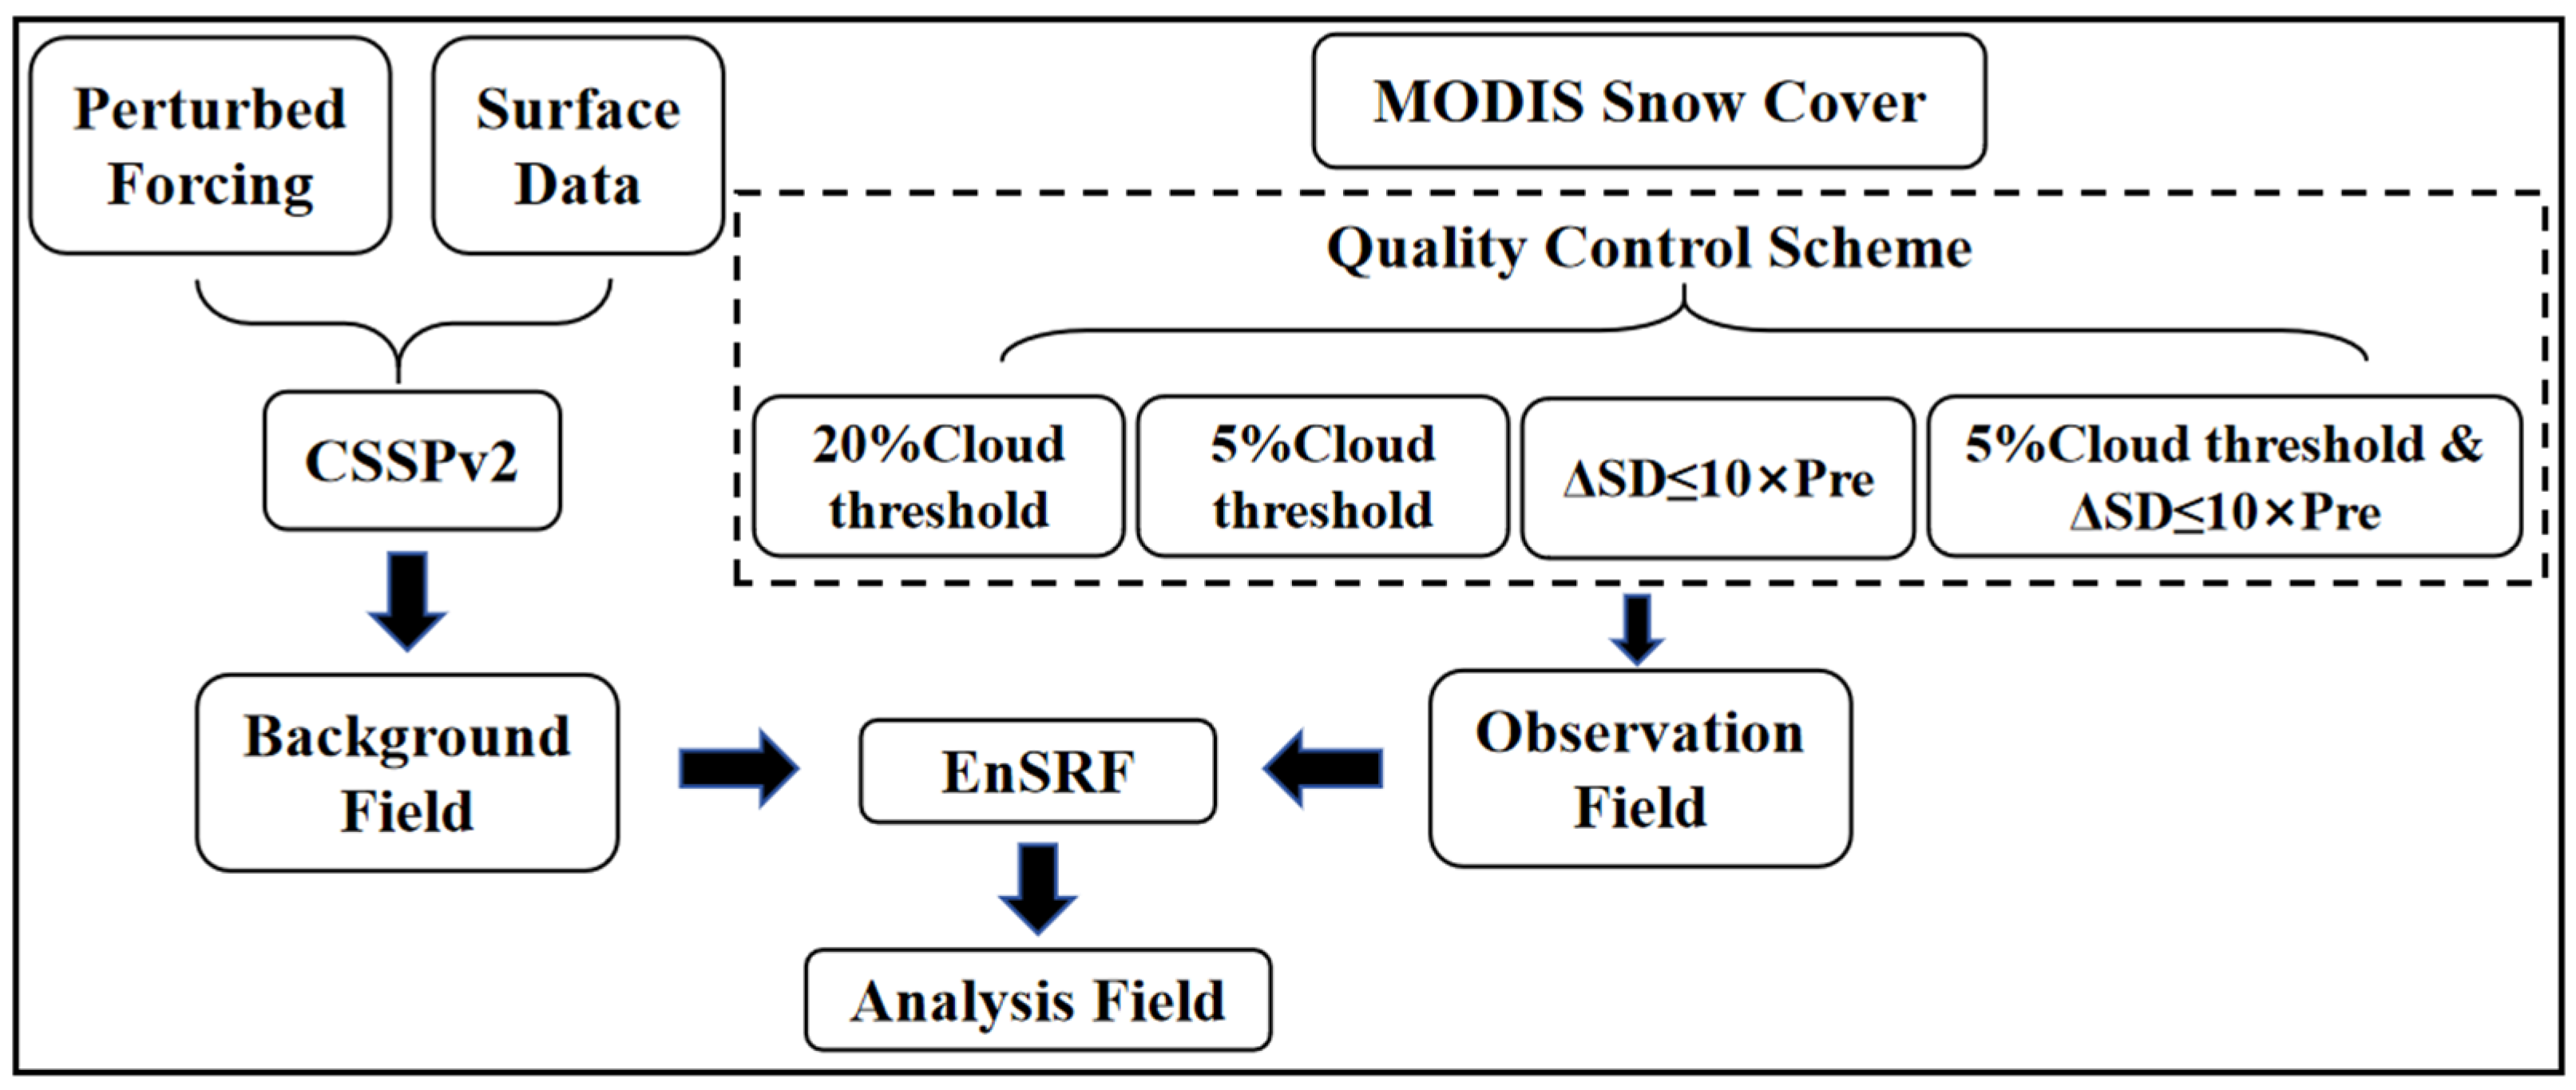
2.2. CSSPv2-Snow Data Assimilation System (CSSPv2-SDA)

Figure 3 shows the schematic of the CSSPv2-SDA system. The system is based on the CSSPv2 model [13,37,38,39]. CSSPv2 is a process-oriented LSM that originates from the Common Land Model (CoLM) [40] and has a good performance in modeling the hydrological, thermal, and ecological processes at high (e.g., 100 m~1 km scale) spatial resolution [41].
The EnSRF [17] was used to assimilate MODIS SCF data into the CSSPv2 model. It uses an ensemble-based approach to estimate error covariances and update model states through the Kalman gain. Assimilation mainly includes two steps: forecasting and analysis. The first step of forecasting is to initialize the ensemble, and to perturb the model state variables:11
x 0 a = x 0 p + μ ,  
where x 0 p is the initial state field and μ represents the background error vector, which corresponds to a Gaussian distribution. In this study, we accomplished ensemble initialization by perturbing the meteorological forcings.
Then, in order to integrate the state forwards in time, forecasted state at time k is defined as
x k f = M x k 1 a , α k , β k + w ,  
where M ( ) is the model operator and x k f is the member of the forecasted state which transforms to background state x k b when compared and integrated with observational data. α k and β k are the meteorological forcing conditions and model parameters, respectively. w represents the model error vector.
Unlike the Ensemble Kalman Filter, the EnSRF does not require perturbing of the observations in the analysis step, which avoids additional errors and applies the observation error to depict the impacts of observation uncertainties on the assimilation [17]. EnSRF employs a diminished Kalman gain to adjust the discrepancies from the ensemble averages (Equations (3)–(6)), and uses the new analysis field to update the model’s estimate of the state variables. Consequently, it circumvents the perturbation error without incurring extra computational expenses.
x k a = x k b + K ~ y H x k b ,
K ~ = α K ,  
K = P b H T H P b H T + R 1 ,
α = 1 + R H P b H T + R 1 ,
where x k a is the analyzed state; x k b is the background model forecast; y is the observation; K ~ is the EnSRF gain; and K is the Kalman gain. The H is the snow cover observation operator introduced by Niu and Yang [42,43], which converts SCF (snow cover fraction) to SD (snow depth) under the assumption that the variation of SCF is contingent upon the snow water equivalent (SWE) and snow depth (SD). Snow depth is a state variable that is directly involved in the dynamical equations of the model while snow cover is a diagnostic variable that does not directly participate in the dynamical processes of the model. Therefore, an observation operator is needed to convert snow cover into snow depth to facilitate assimilation [44]. Moreover, this study adopted constant error values of 0.01 and 0.1 as the observation error and model error for MODIS snow cover fraction (SCF), respectively [44,45,46]. The MODIS SCF and cloud cover dataset are applied on a gridcell basis into the CSSPv2 land surface model.
The joint quality control scheme is applied to the snow depth data converted from MODIS SCF data. Due to the high cloud cover fraction in high-altitude areas (Figure 2) and the large sensitivity of snow depth to precipitation [25], we employ a quality control before data assimilation. Specifically, when the MODIS cloud cover at a grid point is less than or equal to 5%, and the change in snow depth between two days does not exceed 10 times of the change in total precipitation, the snow depth data converted from the MODIS SCF satellite data at that grid point will be assimilated. Otherwise, no assimilation is performed. In addition, if the SCF or cloud cover fraction of a grid point is missing, assimilation will not be performed on that day.
There are 15 ensemble members with perturbed forcings in the data assimilation process [38]. Precipitation (PRE) and shortwave radiation (DSWRF) undergo multiplicative perturbations with a mean of 1 and standard deviations of 0.5 mm (for PRE) and 0.1 W/m2 (for DSWRF), respectively. While temperature (T2m) and longwave radiation (DLWRF) are perturbed with a mean of zero and standard deviations of 0.5 K (for T2m) and 15 W/m2 (for DLWRF), using Gaussian noise (Table 2) [47,48]. The assimilation is performed at 11:00 am each day with MODIS SCF record.

2.3. Experimental Design

This study uses CMFD data to drive the CSSPv2-SDA assimilation system, and compares the snow depth results with CMA station observations, ERA5, and TPDC snow depth data. The experiment ran from 24 February 2000, to 31 December 2015, with a spatial resolution of 3 km.
Three additional quality control schemes were adopted to investigate the influence quality control schemes on the assimilation results, including a 20% cloud cover threshold, a 5% cloud cover threshold, and a precipitation-based scheme that considers data invalid if the snow assimilation increment is more than 10 times the precipitation amount. In addition, the ERA5 precipitation and temperature data were used to drive CSSPv2-SDA with different quality control schemes to quantify the contribution of high-quality forcing data to the assimilation.

3. Results

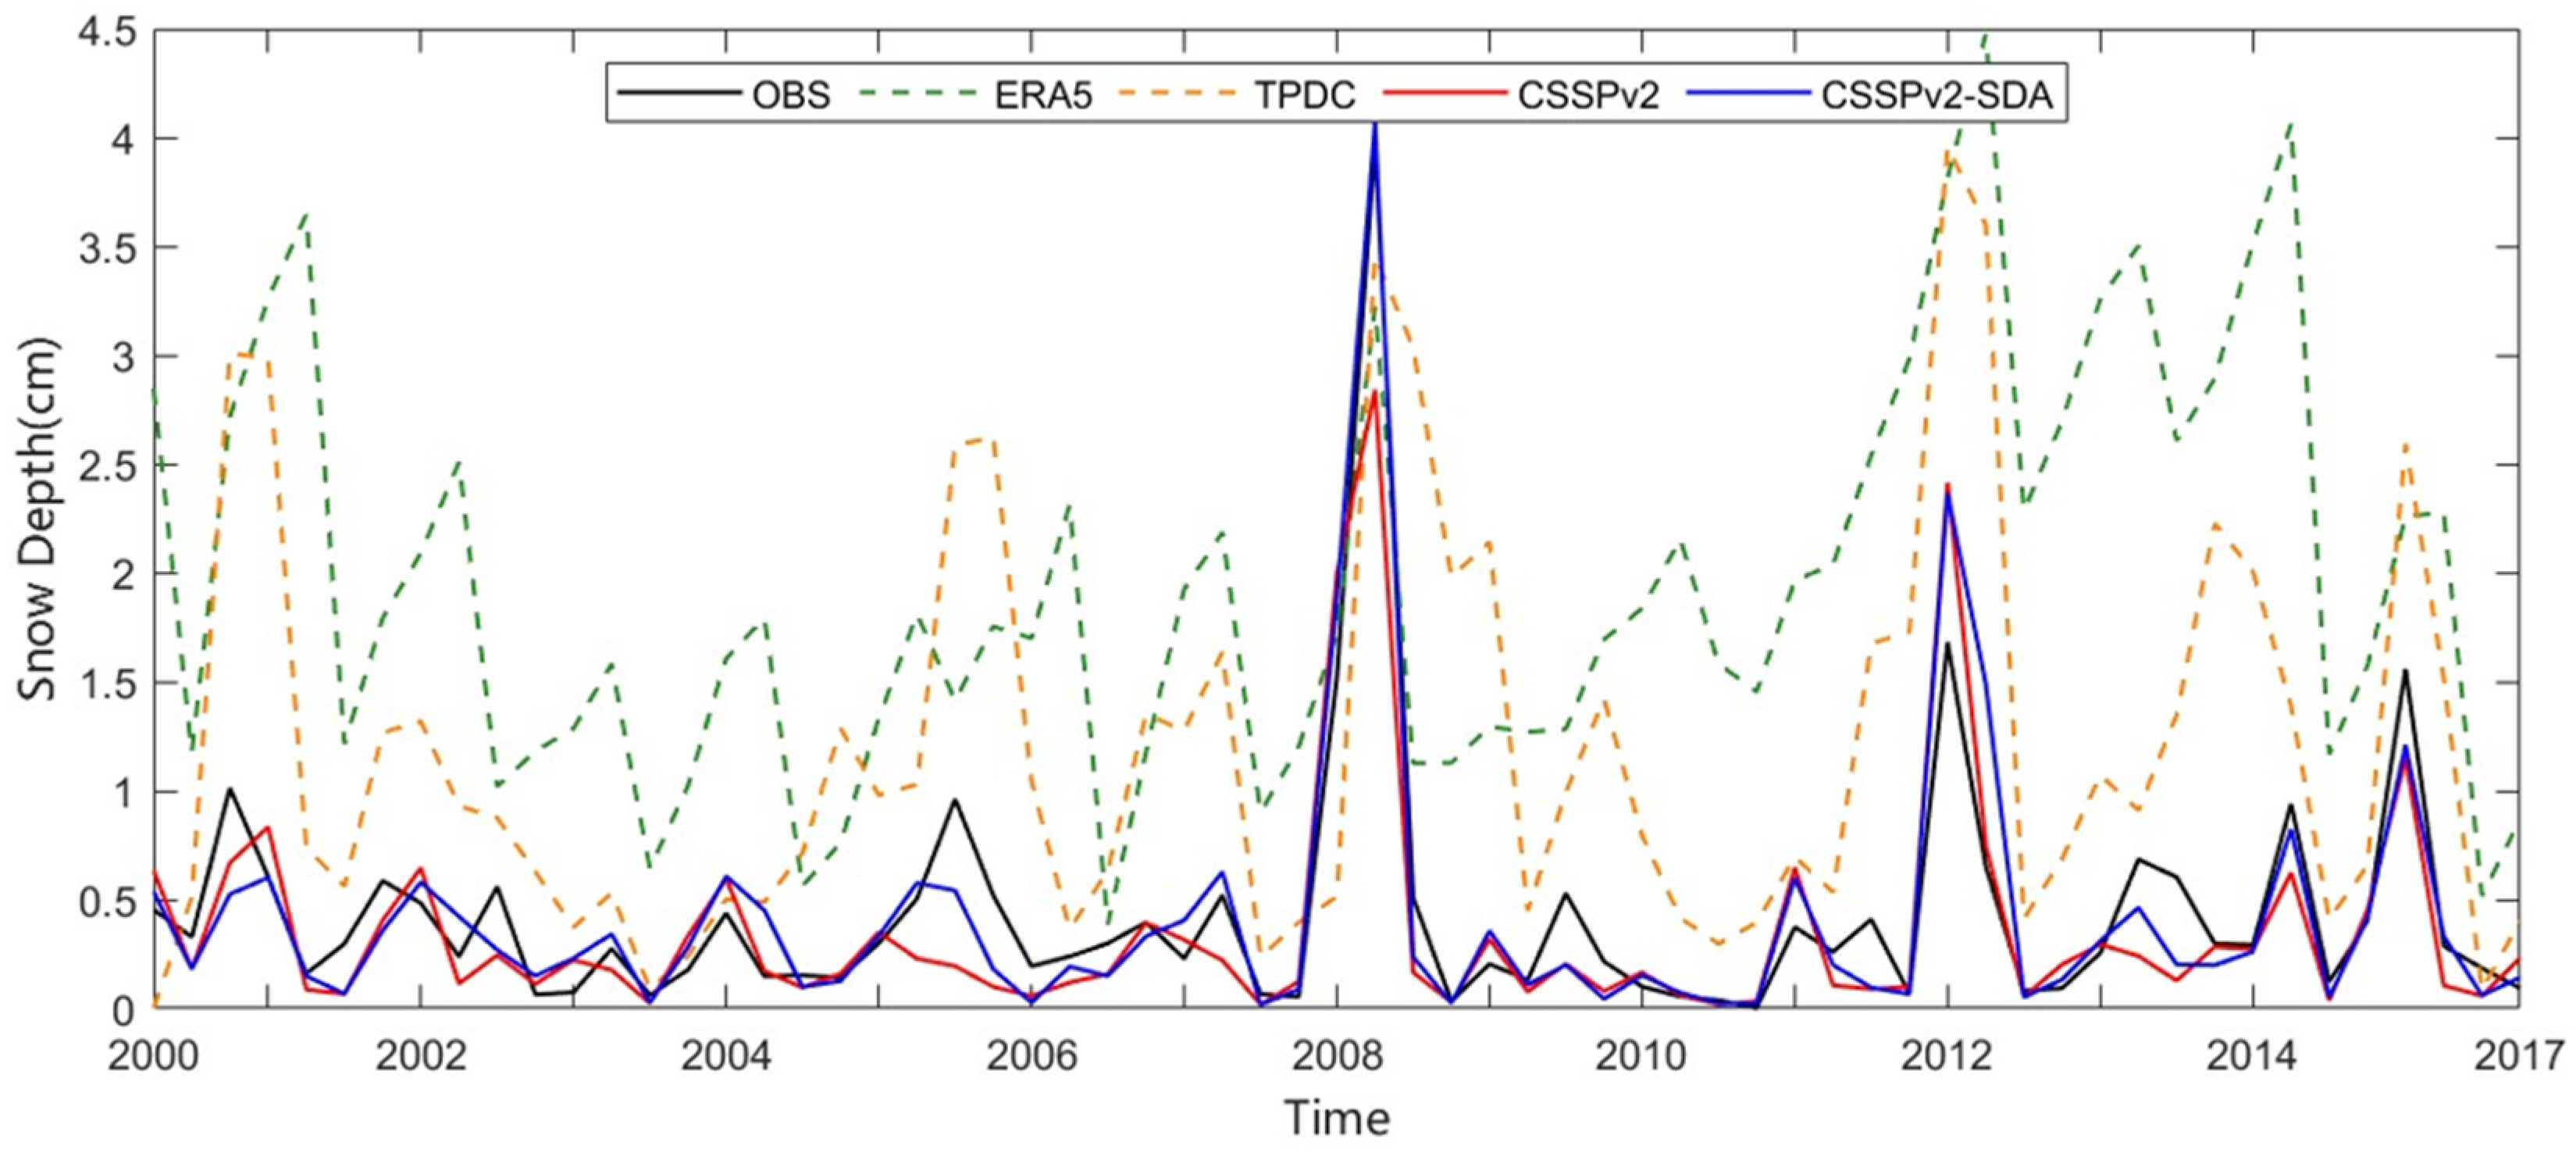
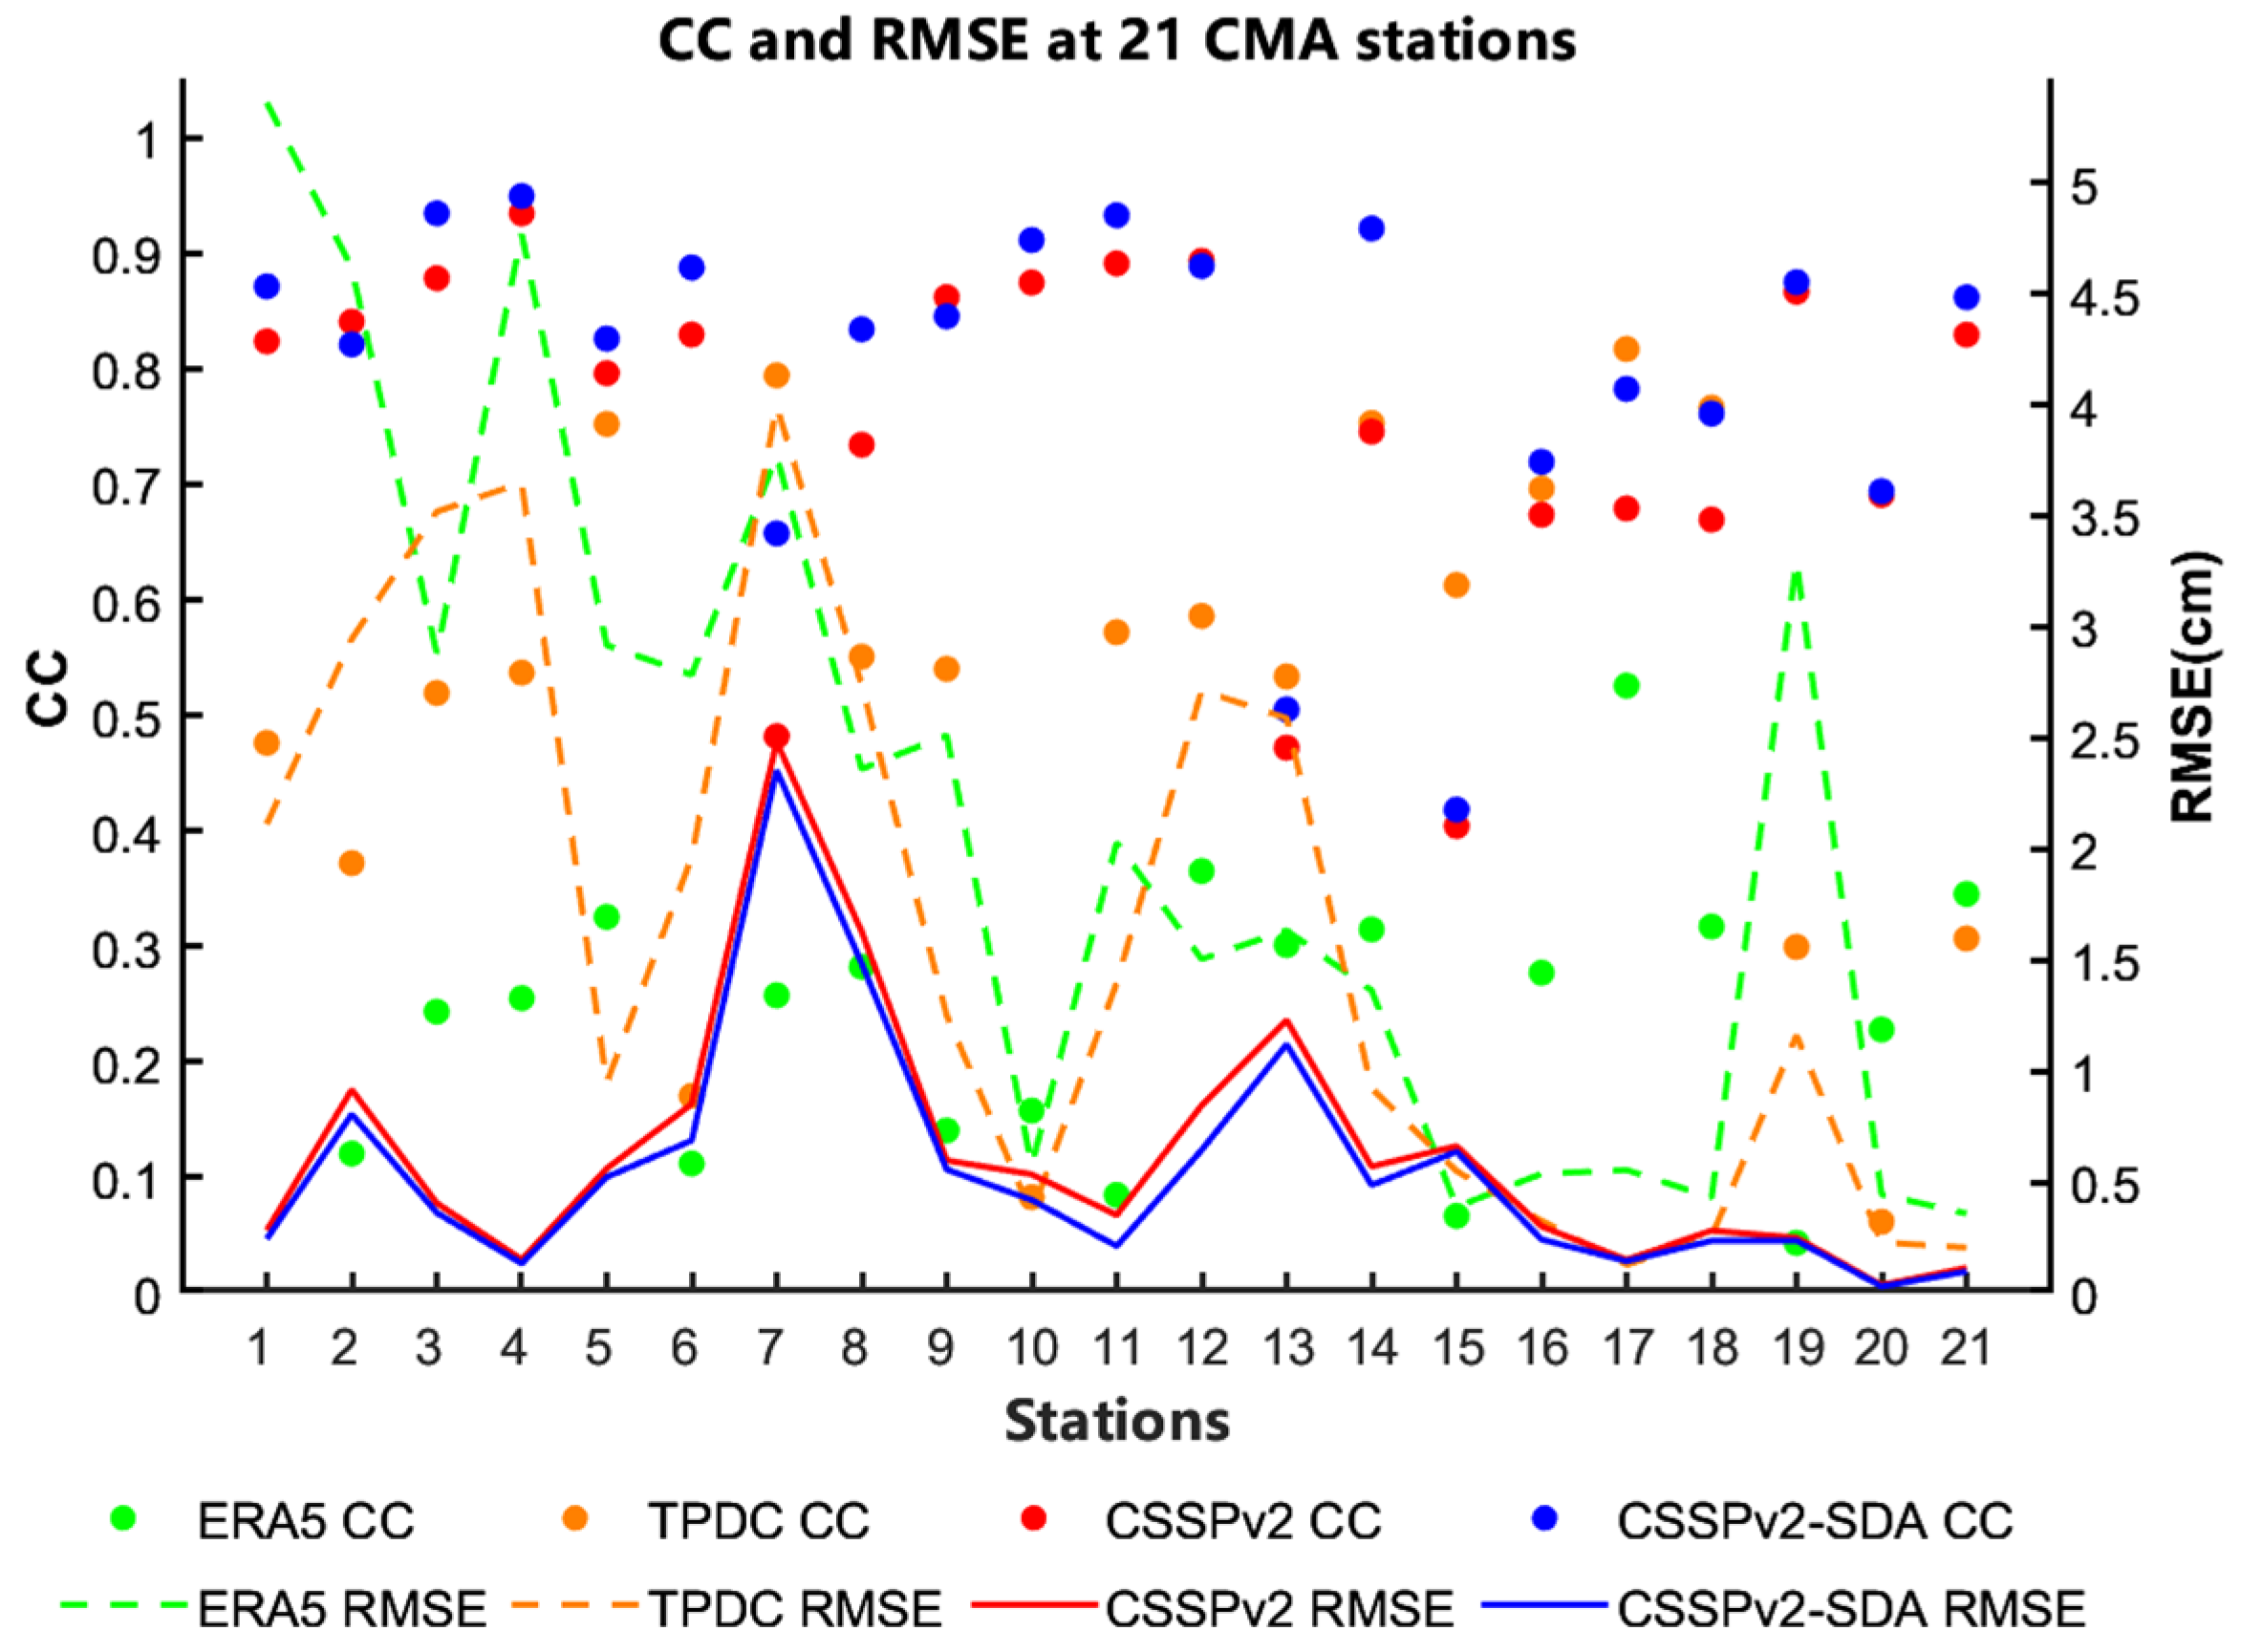
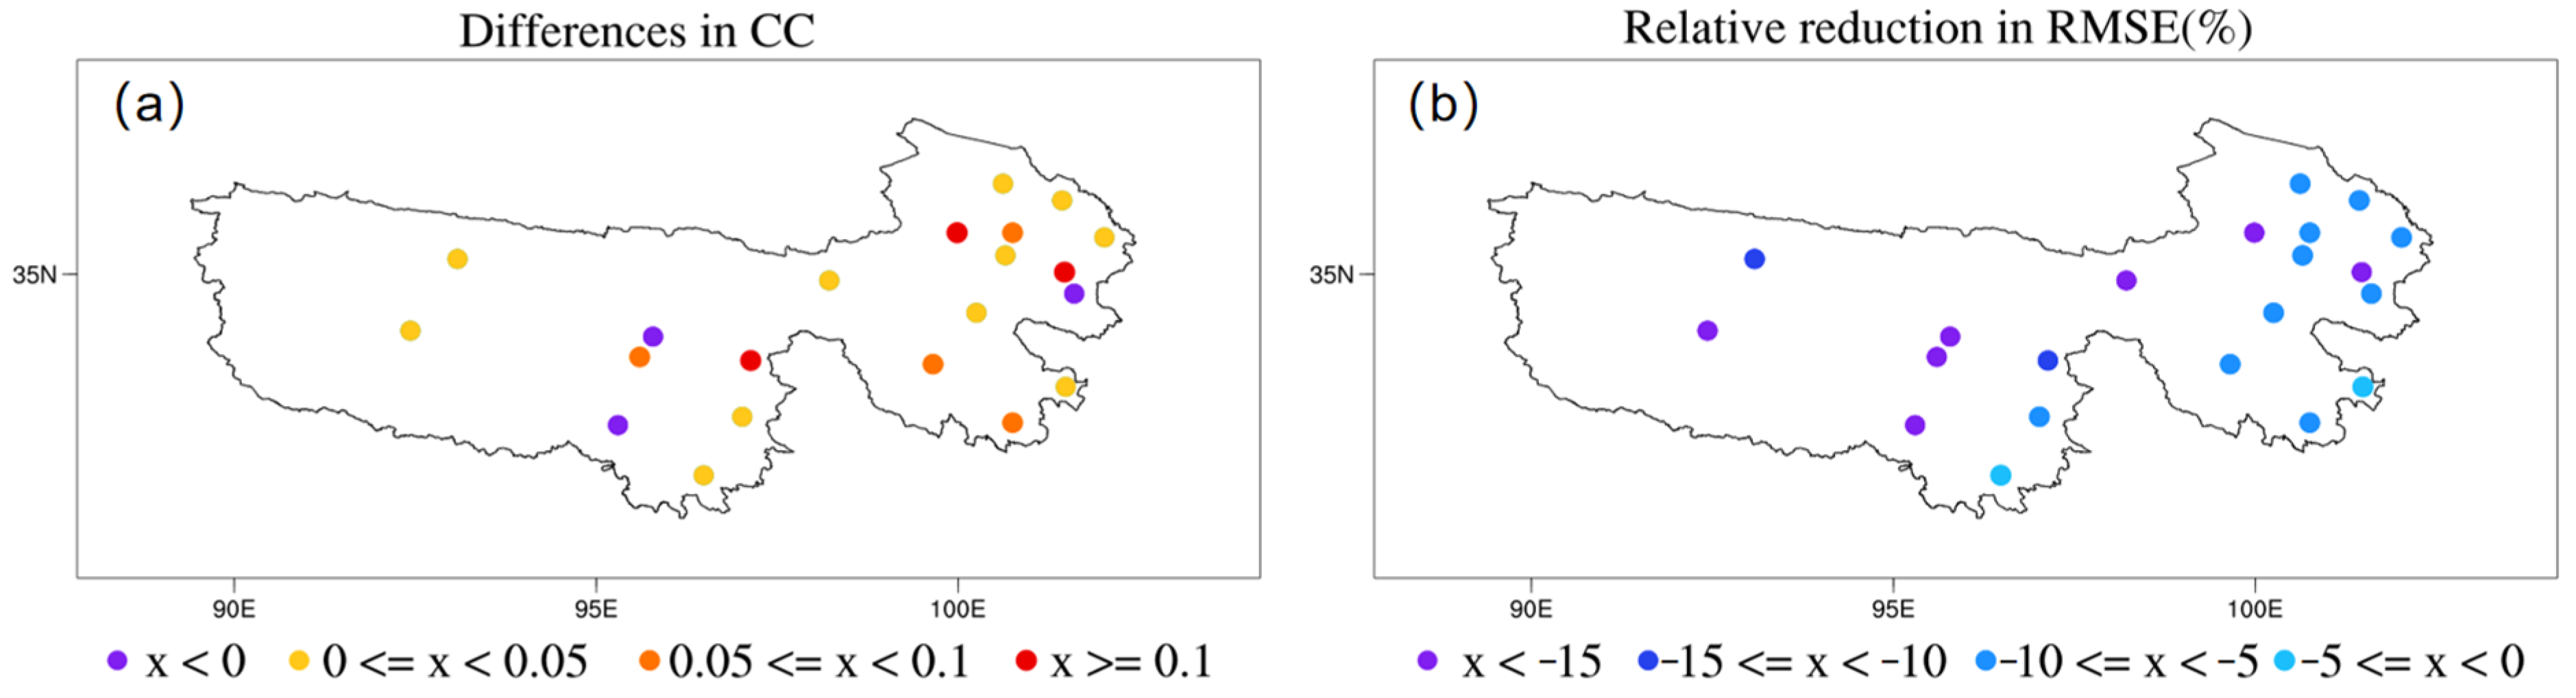
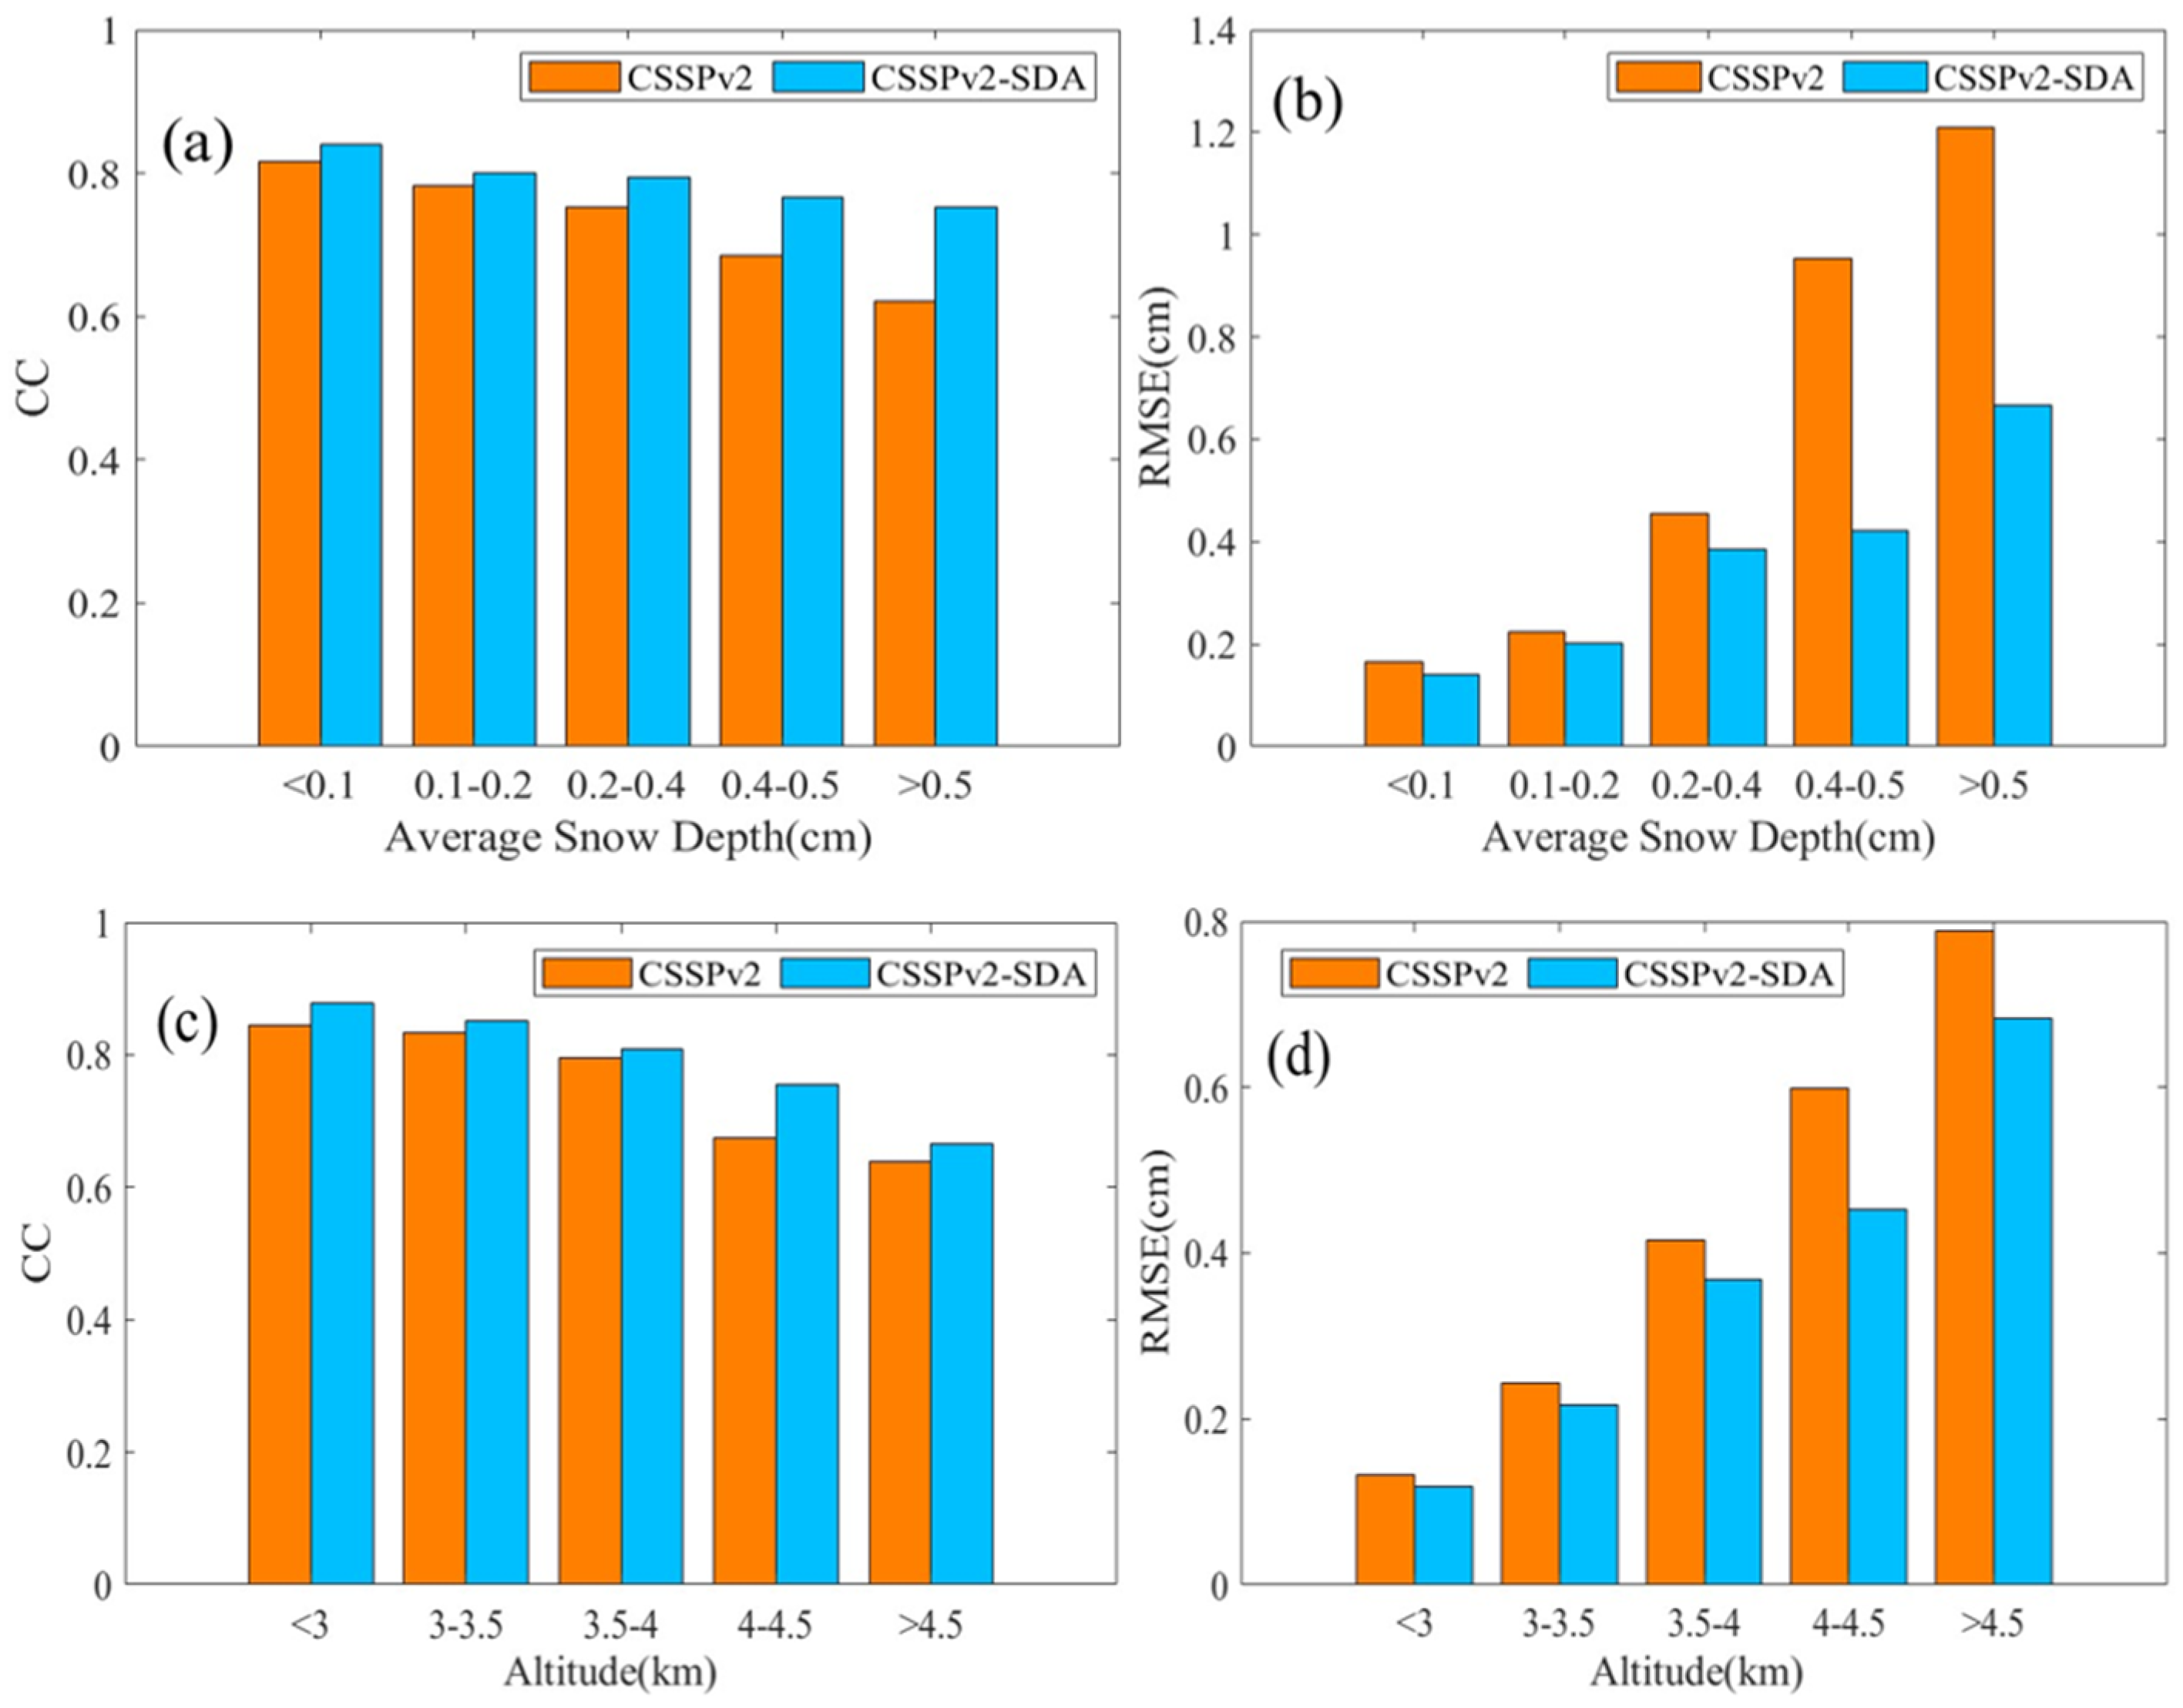
3.1. The Performance of CSSPv2-SDA Assimilation System

Figure 4 depicts the observed and simulated winter (November–February) snow depth averaged over 21 stations during 2000–2015. Both the ERA5 and TPDC products overestimate the winter snow depth in the Sanjiangyuan region, with the root-mean-squared-error (RMSE) being 1.08~1.74 cm. Compared to the ERA5 and TPDC, the CSSPv2 simulation is much closer to the observations and captures the peaks and valleys quite well, leading to a small RMSE (0.27 cm). In addition, the CSSPv2 simulation also shows priorities in capturing annual variations of snow depth, by increasing the correlation coefficient (CC) from 0.37~0.57 of ERA5/TPDC to 0.88. The advantages of CSSPv2 simulation are attributed to both a high-quality precipitation forcing and the physical parameterizations (e.g., five-layers snow module) [13].
The comparison of simulated and assimilated snow depths with those from ERA5 and TPDC at each station is presented in Figure 5. The simulation performance at each station is superior to that of ERA5 and TPDC, with CC ranging between 0.5 and 0.9, whereas ERA5 and TPDC have CCs of 0.2 to 0.7. The simulation errors are also lower, with RMSE all below 3 cm, significantly less than ERA5 and TPDC. Assimilation has improved the CC at most stations (19 out of 21) and reduced the RMSE at all stations, demonstrating a significant enhancement to the simulation.
After assimilating MODIS snow cover fraction data into the model, the simulation result (CSSPv2-SDA) is further improved in both average and station scales. Specifically, CSSPv2-SDA increases the snow depth when the CSSPv2 model-simulated snow depth is underestimated (such as in November 2005 and January 2008) and reduces the RMSE to 0.22 cm (about 18.5% smaller than that of CSSPv2 model simulation). The interannual variations of snow depth in CSSPv2-SDA are also closer to the observation, resulting in a 5.6% larger CC than CSSPv2. Similarly, the assimilation system has mostly improved the simulation of individual stations. Figure 6a,b show the spatial distribution of added value of snow data assimilation at station scales. For most stations, the CC increases by 0.05–0.1 (Figure 6a), and the RMSE decreases by 5–19% (Figure 6b).
Figure 7 analyzes the assimilation results over stations with different average snow depth levels and different elevations. Figure 7a,b categorize the stations into five classes based on the simulated snow depth levels—average snow depth <0.1 cm, 0.1–0.2 cm, 0.2–0.4 cm, 0.4–0.5 cm, and >0.5 cm—and compare the changes in CC and RMSE before and after assimilation. It can be observed that assimilation improves the simulation for stations in all snow depth categories, with increased CC and decreased RMSE. The improvement from assimilation becomes more significant as the snow depth level increases, indicating a positive correlation between the assimilation increment and the snow depth level. Similarly, Figure 7c,d analyze the changes in CC and RMSE of simulated and assimilated snow depth with elevation levels of <3 km, 3–3.5 km, 3.5–4 km, 4–4.5 km, and >5 km. Assimilation also improves the simulation results for stations at all elevation levels, and again, the assimilation increment shows a positive correlation with elevation height.

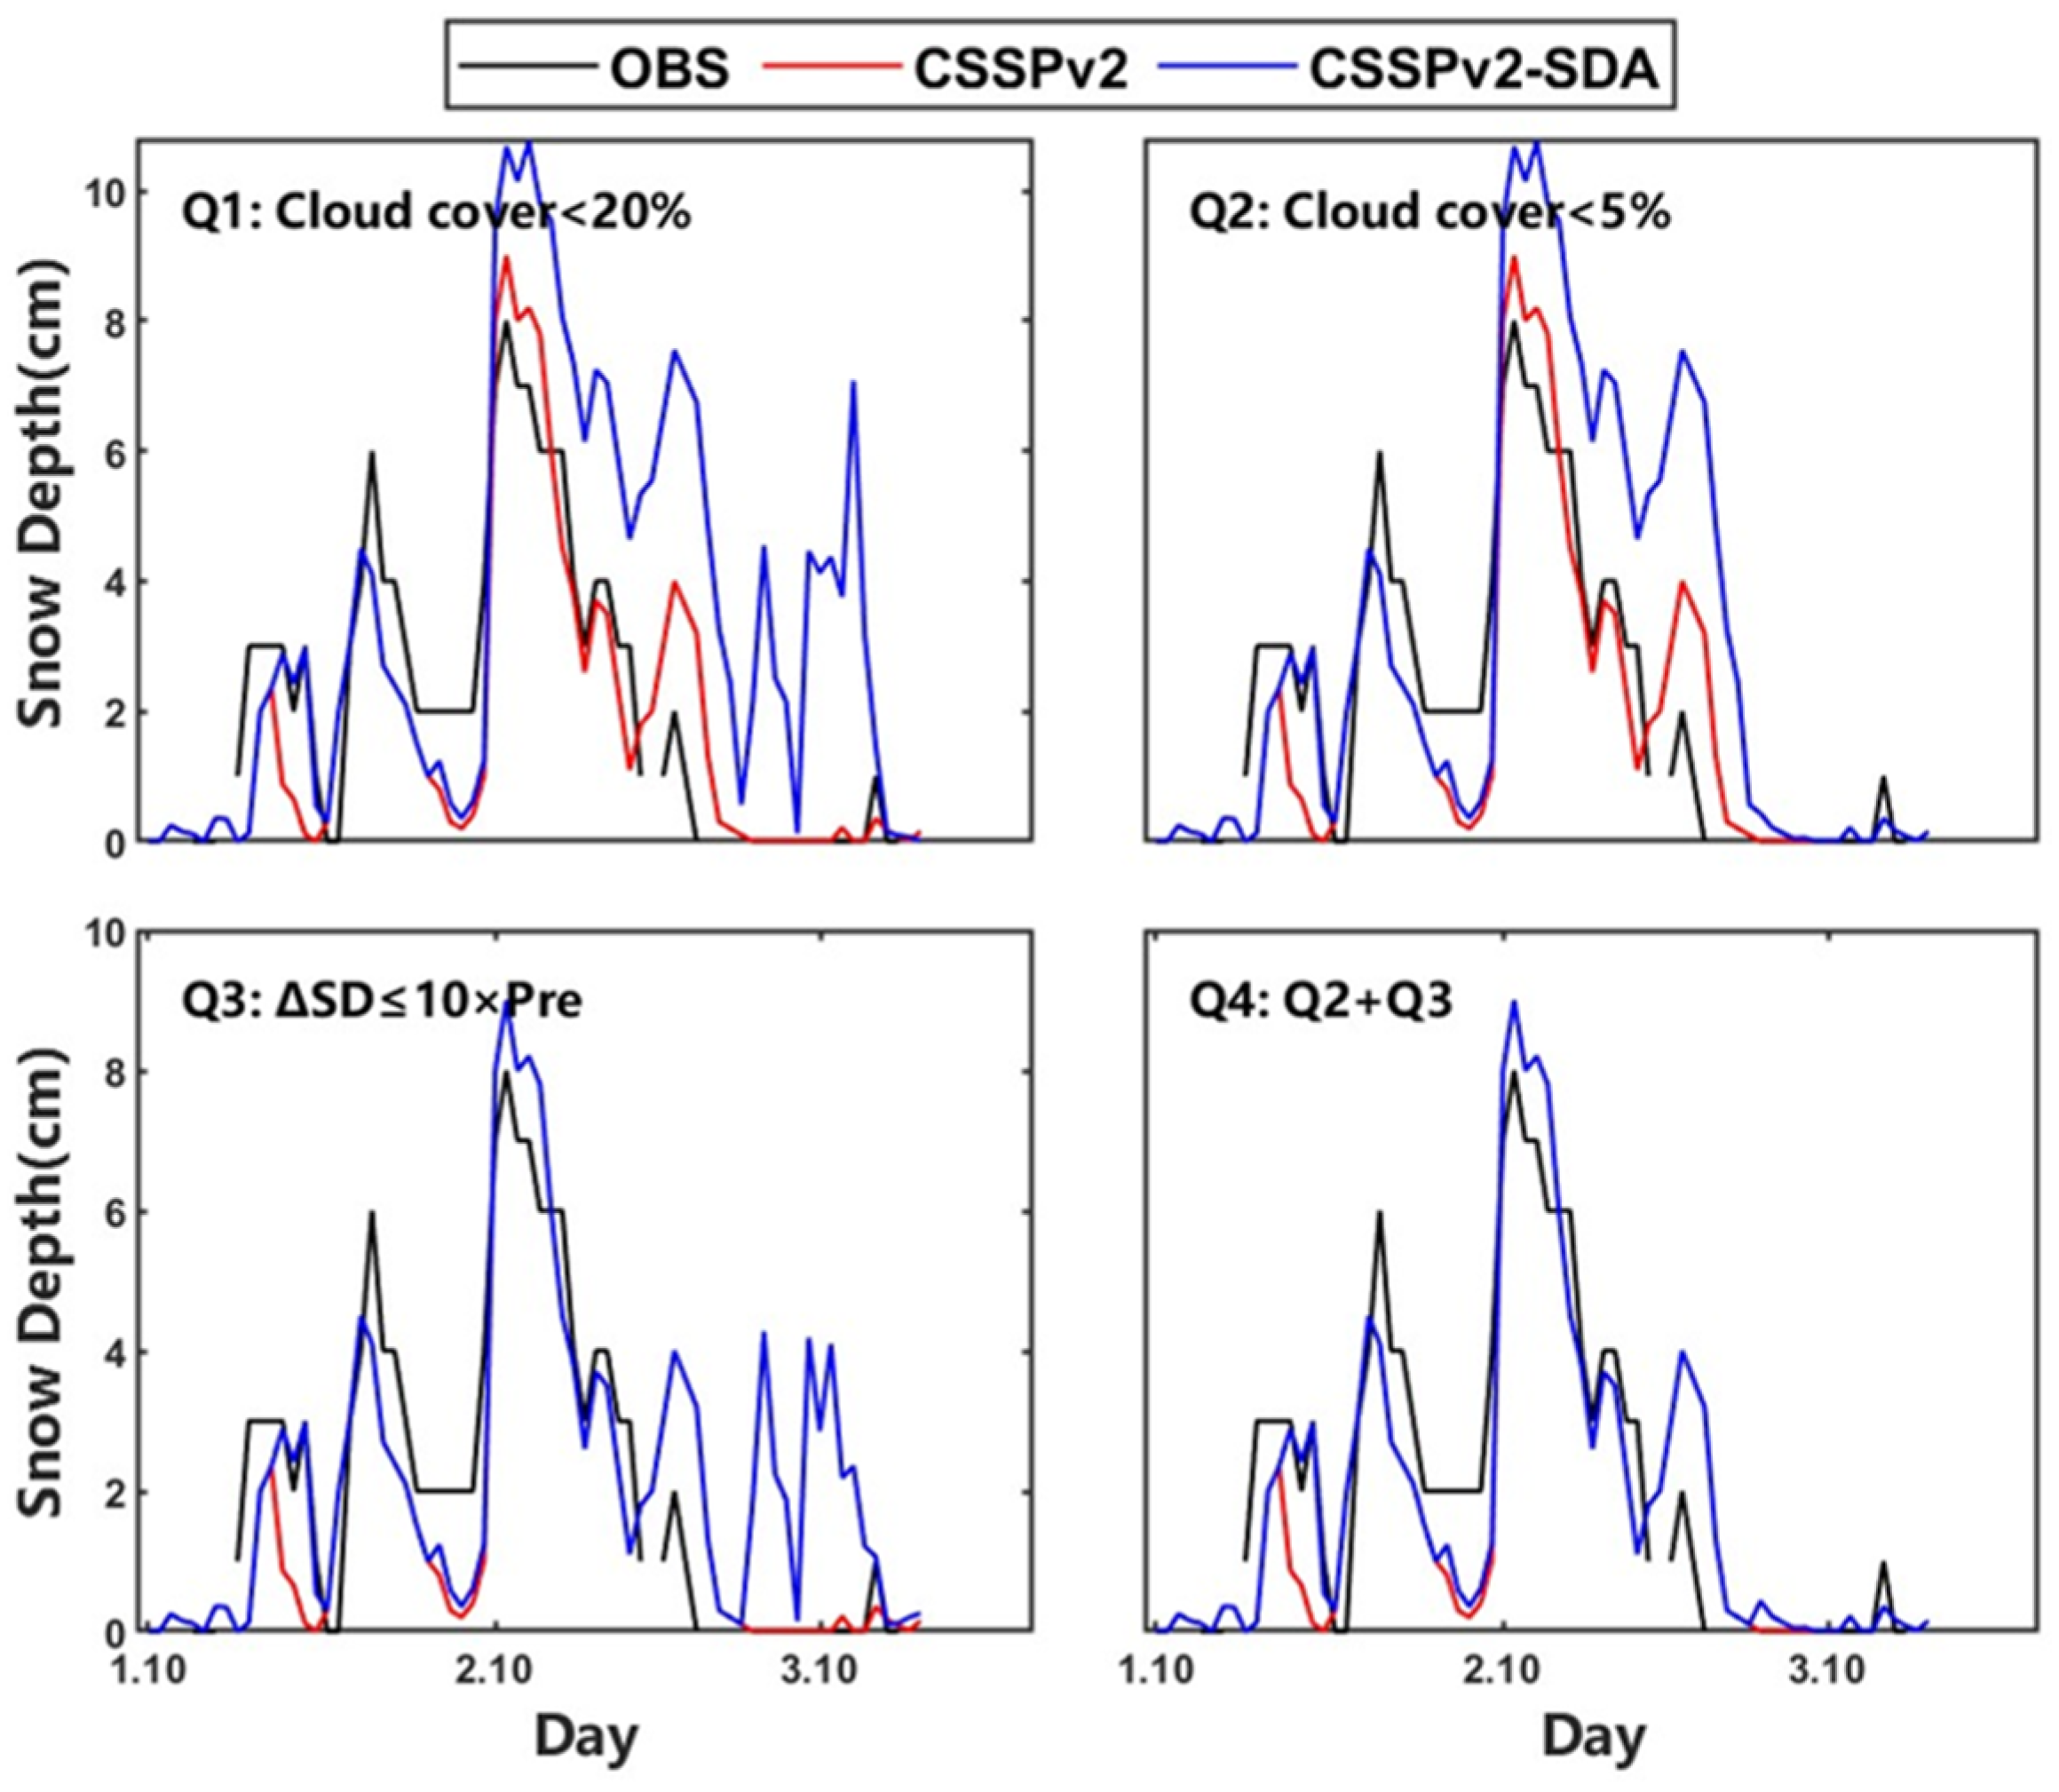
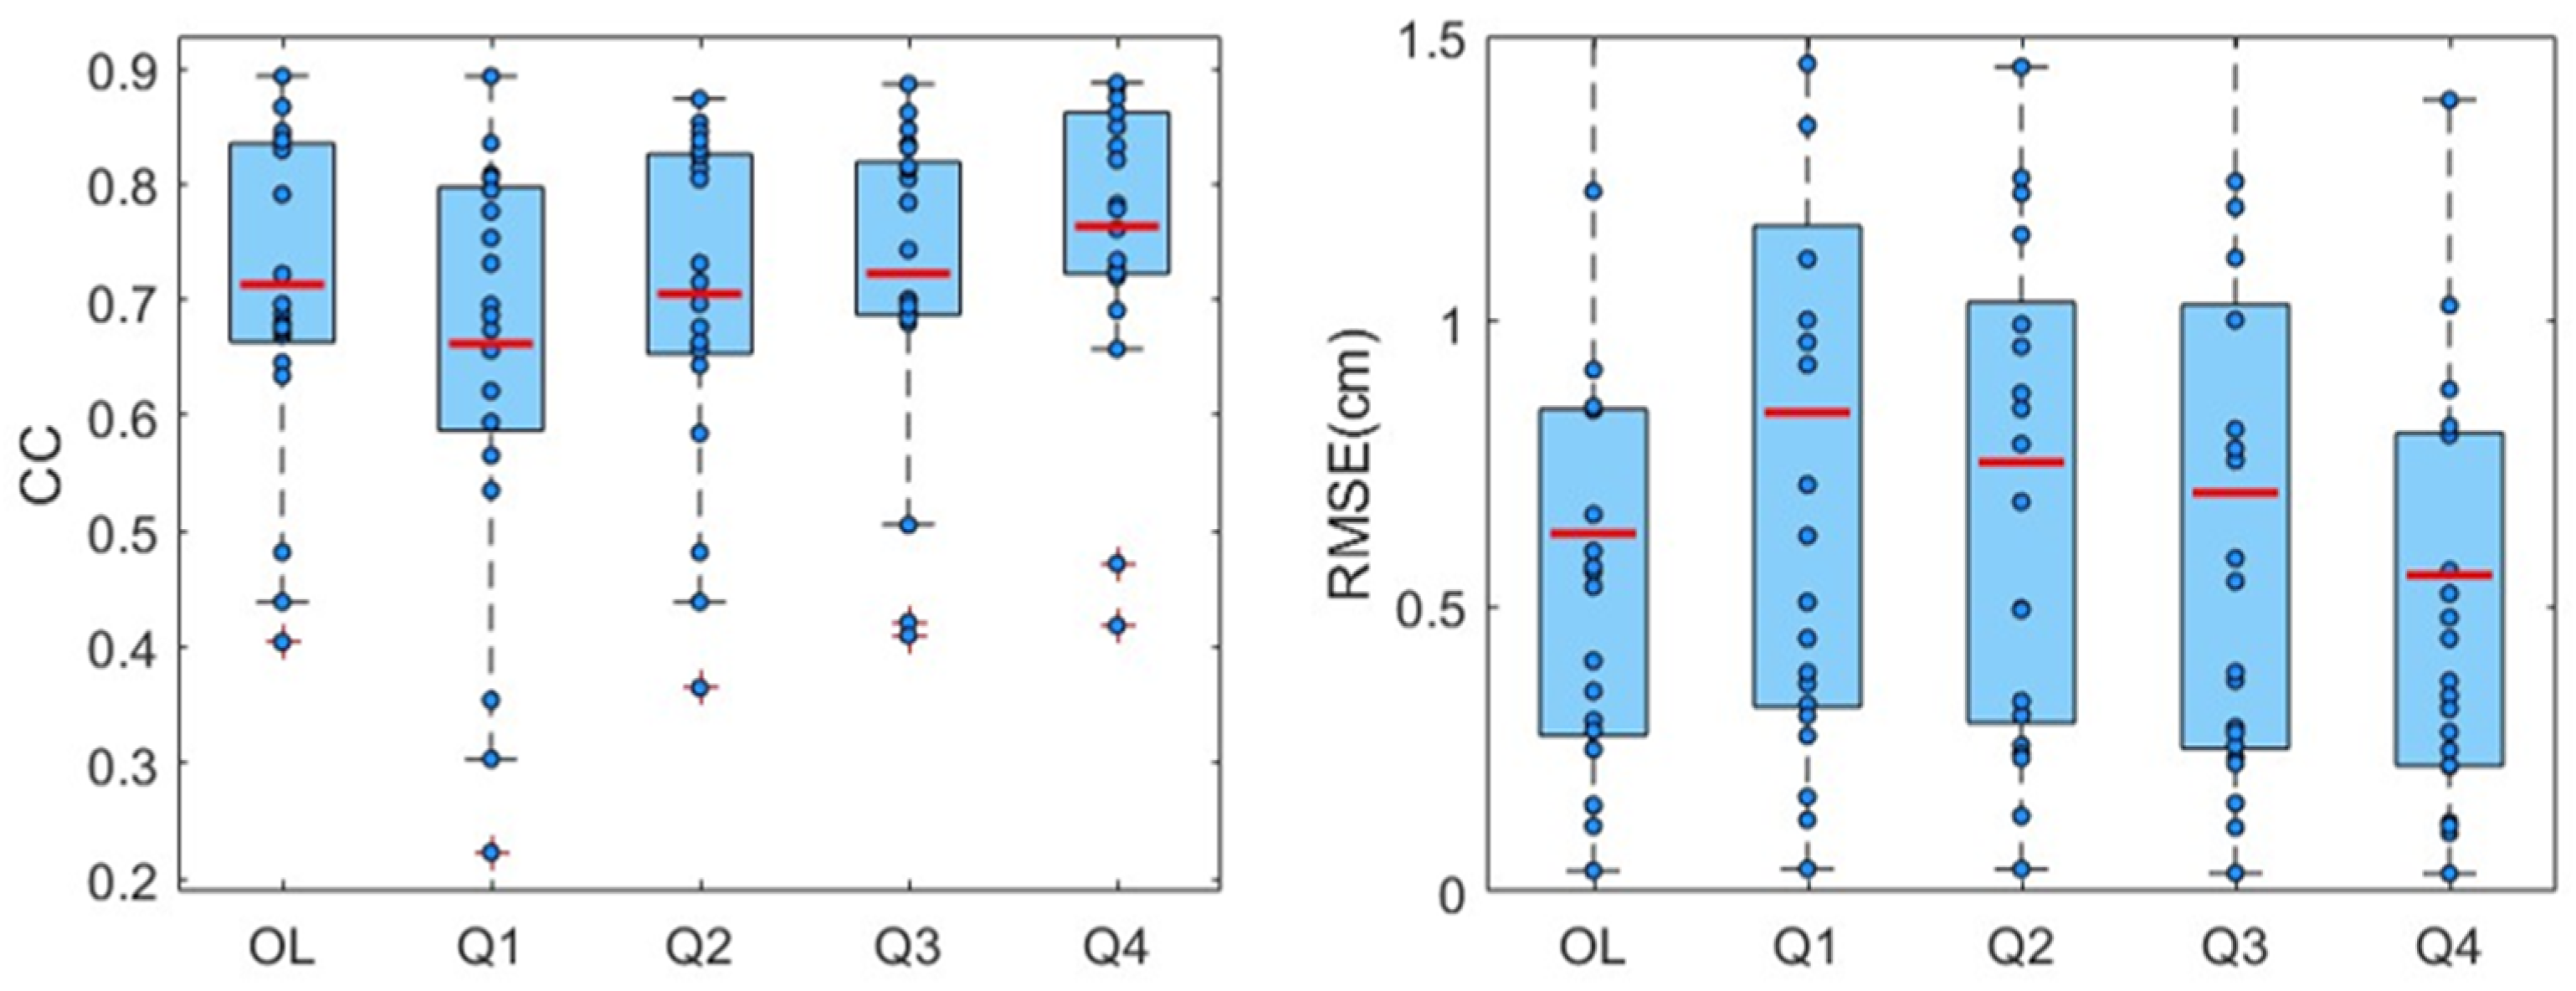
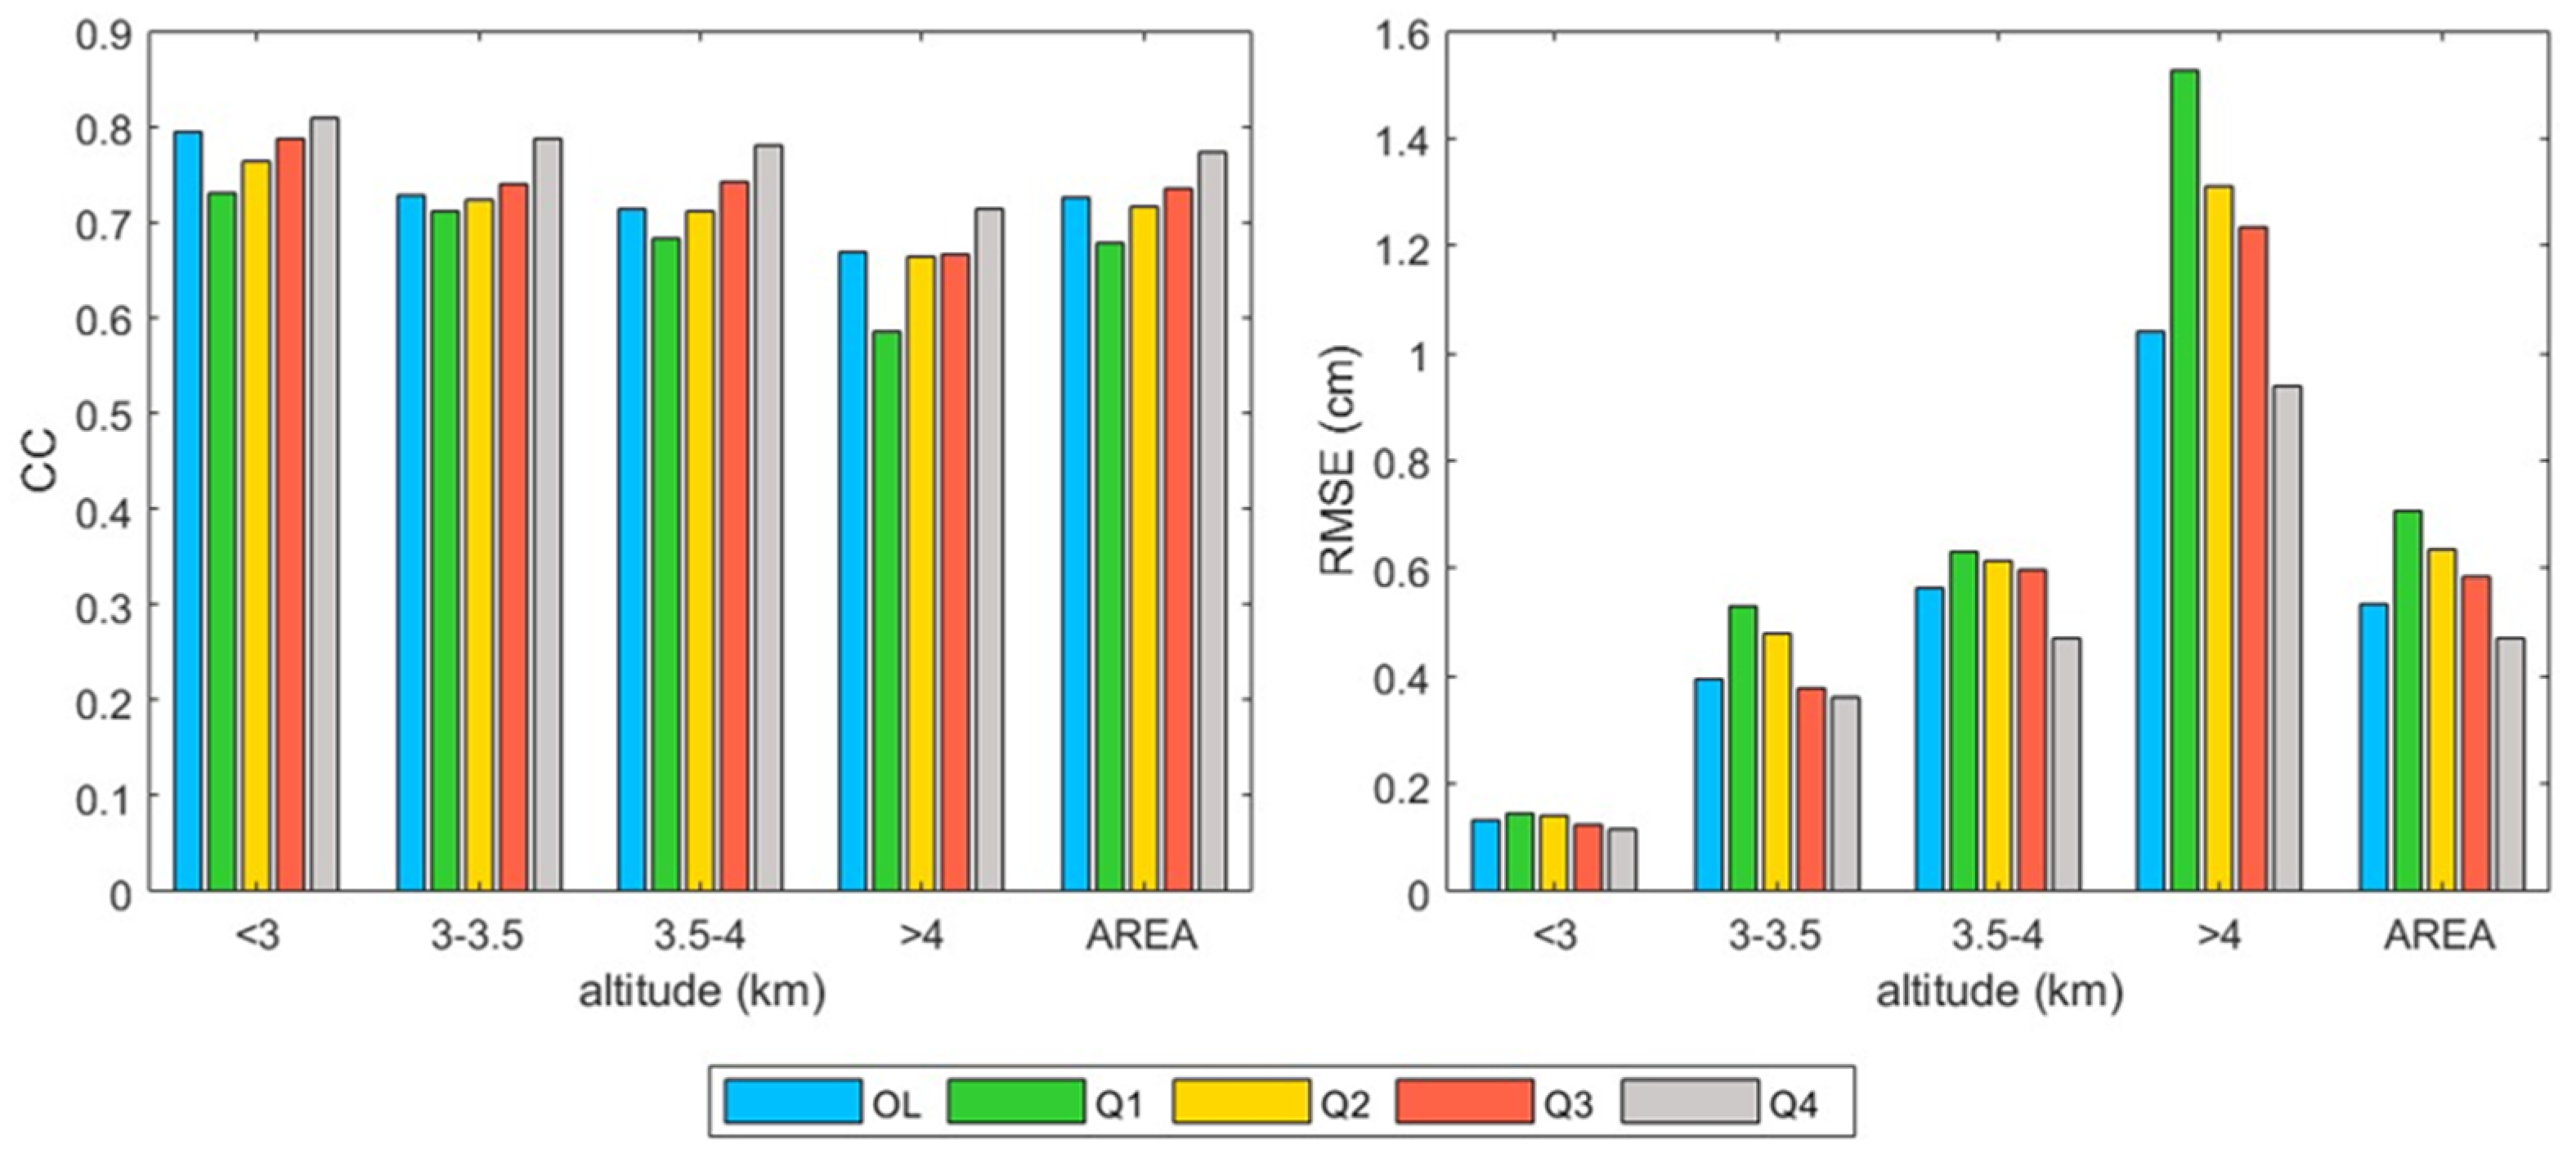
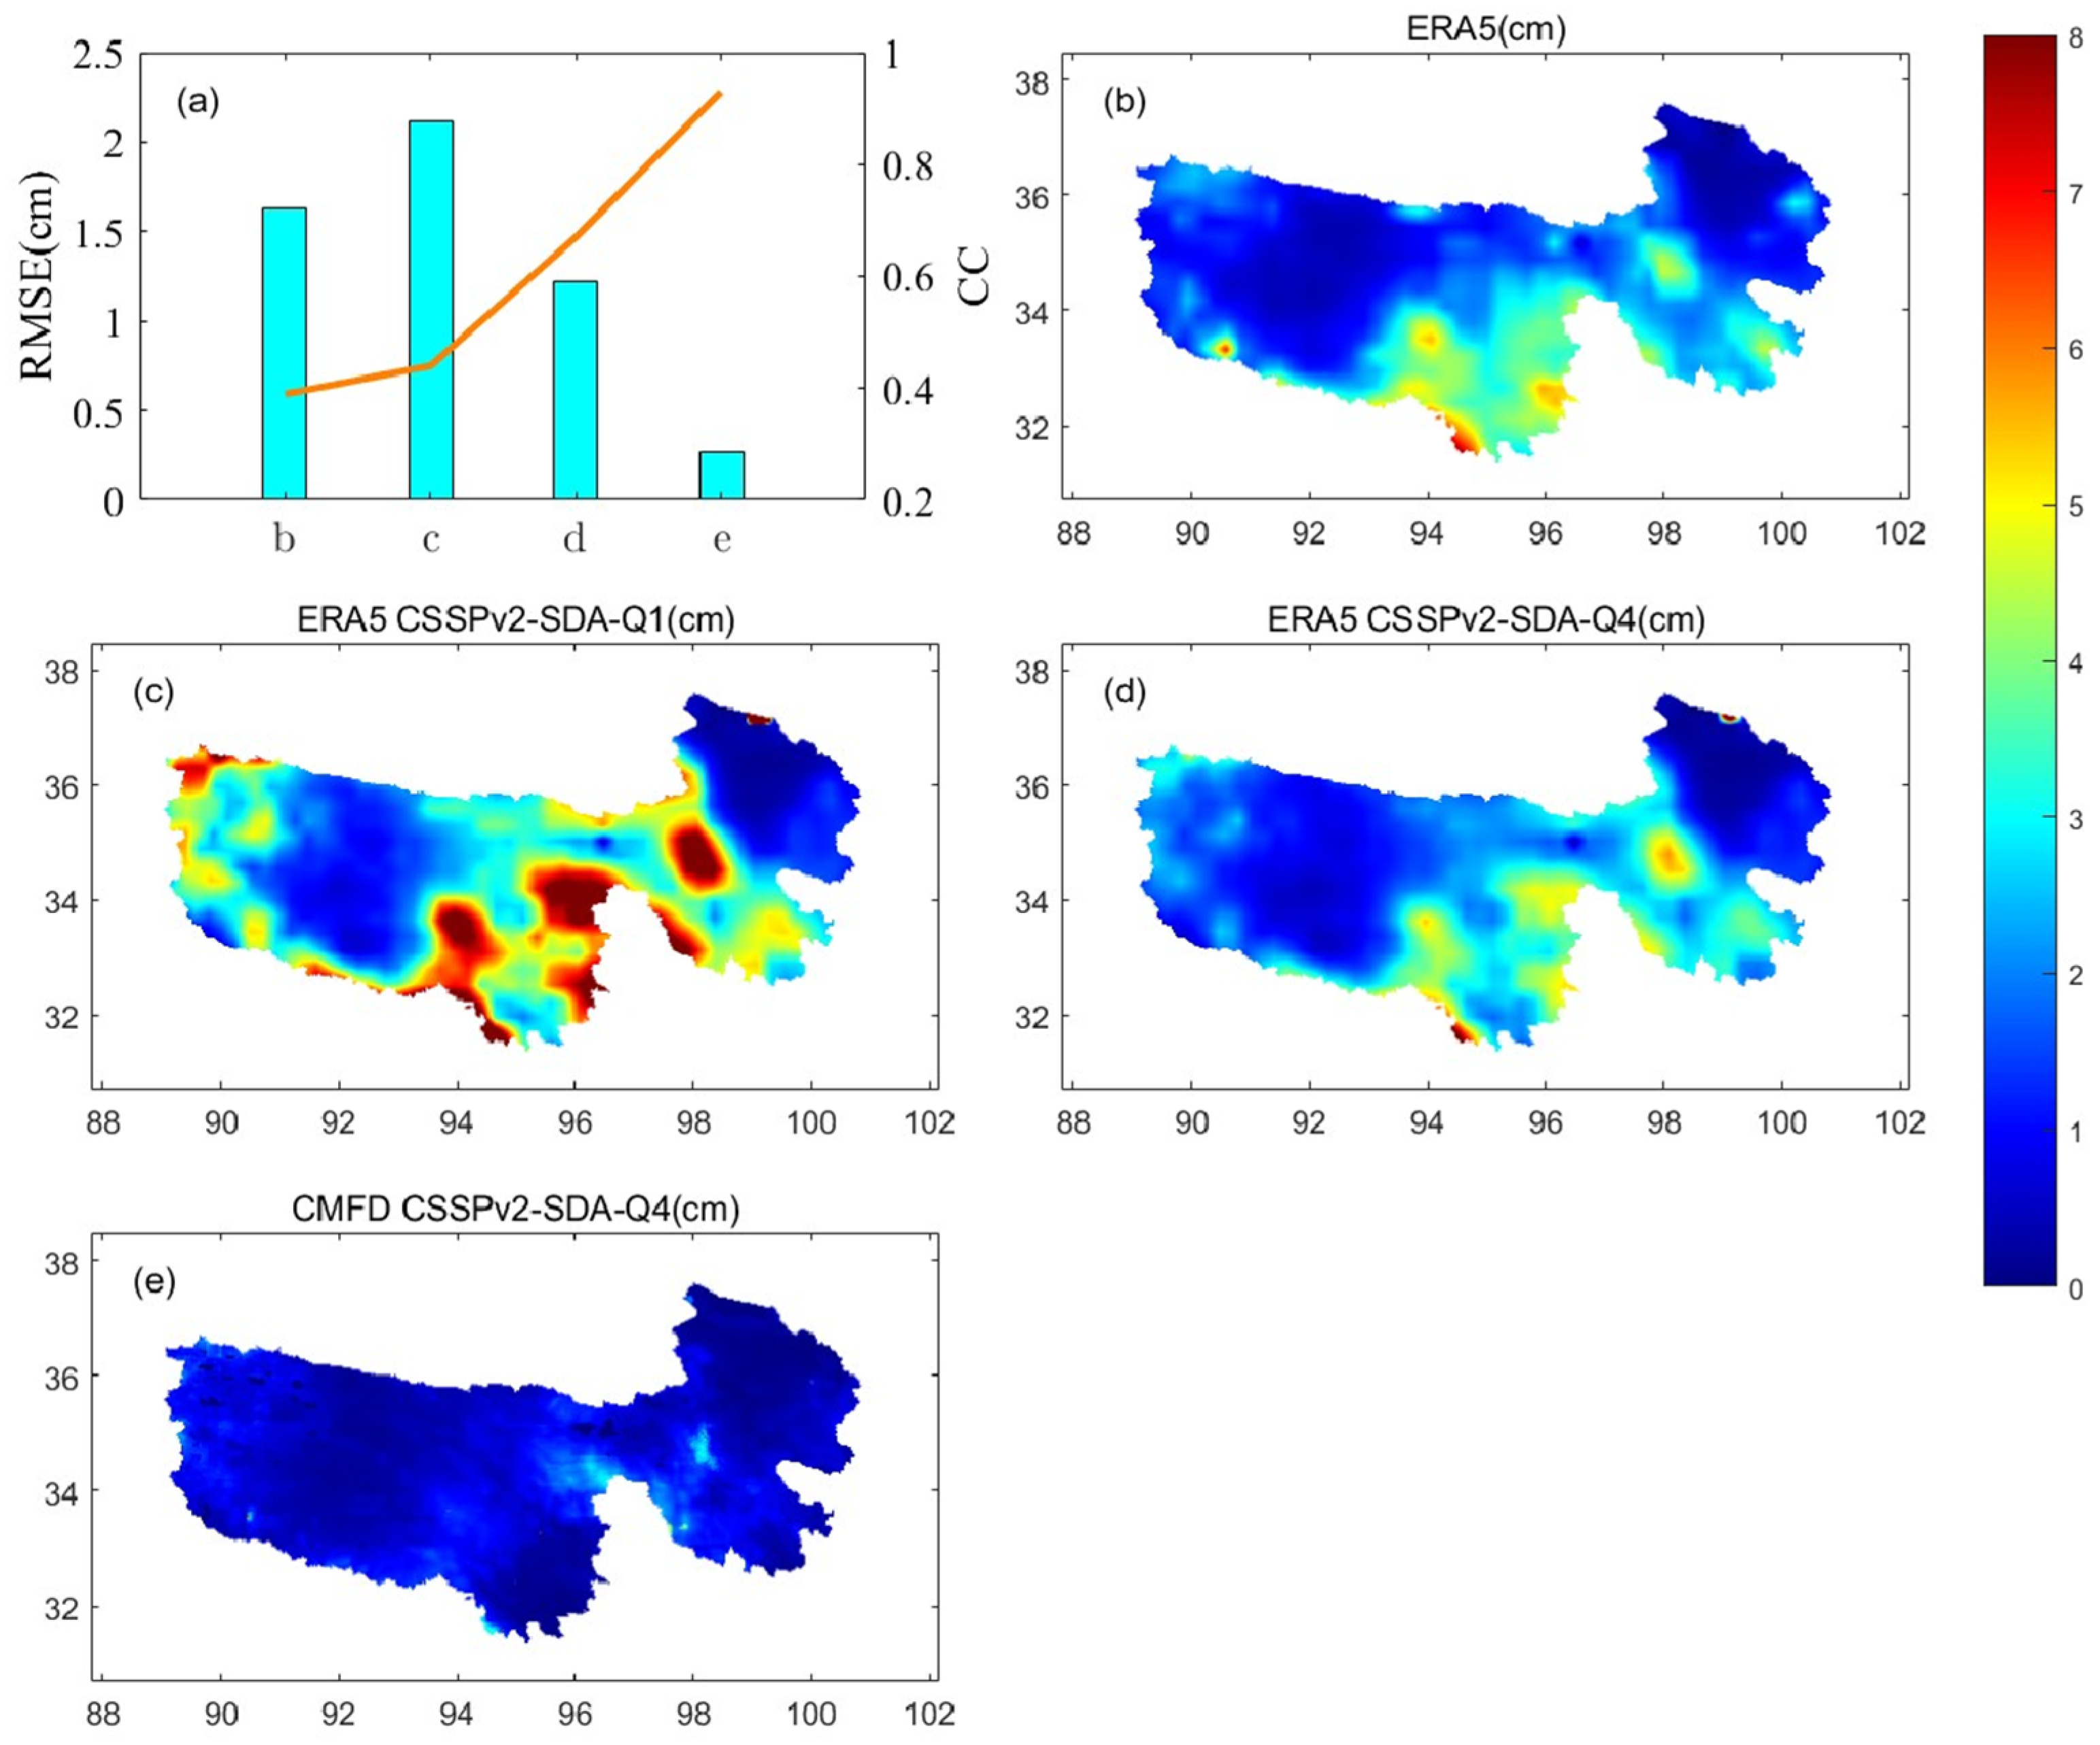
3.2. The Influence of Different Quality Control Schemes and Meteorological Forcing Data on Assimilation

Figure 8 presents the effects of four different quality control schemes on the assimilation system. Over the station 56034 Qingshuihe station (Figure 8), using a commonly used 20% cloud cover threshold causes excessive snow depth increases since February 10th and leads to a poor assimilation performance. Using a 5% cloud cover threshold reduces the abnormal snow depth increase around March 10th, but the assimilation result still shows overestimations. The precipitation restriction scheme filters out the anomaly on February 10th, but the anomaly on March 10th remains. The joint quality control by both cloud cover and precipitation thresholds effectively removed both anomalies, enhancing the snow depth estimation accuracy after assimilation.
Figure 9 shows the difference in RMSE and CC between the data assimilation and open-loop simulations (OL; without data assimilation) over the 21 stations when using different quality control schemes (Q1–Q4). Only using the cloud cover restriction scheme or the precipitation restriction scheme results in limited improvements (and even worse performance), especially for the RMSE. In contrast, the joint quality control scheme can both filter out snow depth observation with large uncertainties during high cloud cover and eliminate snow depth increments that are inconsistent with the precipitation dataset, finally reducing RMSE by 11.7% and increasing CC by 7% at nearly all stations compared to the CSSPv2 simulation.
Figure 10 illustrates the comparison of simulations with four different quality control schemes at various elevation ranges: <3 km, 3–3.5 km 3.5–4 km, and >4 km across 21 stations. Q1 exhibits lower CC and higher RMSE compared to the simulation at almost all elevation levels, indicating that this inappropriate quality control scheme actually degrades the performance of the assimilation. The 5% cloud threshold scheme (Q2) shows more pronounced assimilation increments at elevations above 4 km, while the precipitation-limited scheme (Q3) demonstrates more significant assimilation increments at elevations below 4 km. This suggests that assimilation is more susceptible to cloud interference at higher elevations, whereas precipitation-driven constraints may be more effective in improving assimilation at lower elevations. Joint quality control scheme (Q4) demonstrates the best assimilation performance across all elevation levels.
Figure 11 shows the impact of the quality control schemes and different forcing data. The performances of CSSPv2-SDA system using different quality control schemes and different forcing data are shown in Figure 11a. The station average CC of ERA5 is 0.37 and the RMSE of ERA5 is 1.74 cm (Figure 11b). Under the quality control scheme with a 20% cloud cover threshold, the assimilated snow depth (Figure 11c) has a CC that increased to 0.44, but the RMSE rises to 2.12 cm, indicating that using an inappropriate quality control scheme may actually reduce the accuracy of the simulation. When the quality control scheme combining a 5% threshold with precipitation restriction is applied (Figure 11d), the CC increases to 0.67, and the RMSE decreases to 1.22 cm. This set of assimilated data is inferior to the assimilated data driven by CMFD (Figure 11e), which has a CC of 0.93 and a RMSE of 0.22 cm. Comparing each set of data, the newly proposed quality control scheme has an average accuracy improvement of 47% over traditional quality control schemes; CMFD forcing data have an average improvement of 58% over ERA5 forcing data (Figure 11a).

4. Conclusions

In this study, the CSSPv2-SDA system was developed based on the EnSRF and a joint quality control scheme. The assimilation system produced high-quality snow depth data for the Sanjiangyuan region by reducing the RMSE by 18.5% and increasing the CC by 5.6%. Compared to the state-of-art reanalysis and satellite remote sensing products, snow depth from CSSPv2-SDA increased the CC from 0.47 to 0.93 and reduced the RMSE from 1.41 cm to 0.22 cm. The assimilation improvement at stations in the western part of the region is more pronounced than in the eastern part, potentially due to the sparser distribution of stations in the western area, leading to greater uncertainty in the forcing data. The improvement of CSSPv2-SDA assimilation system is different with different snow depths and altitudes, and it is positively correlated with the snow depth and altitude.
The performance of CSSPv2-SDA varies based on different forcing data and quality control schemes. Assimilation increments at different elevations show that the interference from cloud assimilation is greater at higher elevations than at lower elevations, while constraints driven by precipitation and other meteorological factors may be more effective in improving assimilation at lower elevations. Thus, snow assimilation in plateau areas requires a stringent quality control scheme. Without quality control on the snow cover products, erroneous observations may be assimilated, and erroneous results would be produced [10]. Inappropriate quality control schemes can actually degrade the assimilation results, such as the default scheme, which leads to an increase in RMSE by 30%, while the joint quality control scheme for cloud threshold and precipitation improved the accuracy by an average of 47%. This highlights the importance of exploring appropriate quality control schemes for different regions in assimilation. The improvement brought by the high-resolution forcing data is also obvious, with an average accuracy increase of 58%. This shows the importance of selecting the appropriate forcing data in the snow assimilation in the alpine region.

5. Discussion

In the assimilation of snow cover fraction (SCF) data, quality control schemes, particularly those addressing cloud cover and precipitation constraints, have consistently been crucial for enhancing assimilation performance. By comprehensively considering the proportions of cloud cover, snow cover, and snow-free areas, the quality of assimilated SCF data can be improved [49]. Given the discrepancies between observed and model-simulated SCF, empirical relationships between the two can be established to regulate snow depth increments [50], which is the rationale of the snow data assimilation.
The performance of LSMs driven by different meteorological datasets varies significantly [51]. Snow cover simulation is particularly sensitive to changes in meteorological drivers such as precipitation [25]. Therefore, selecting high-quality precipitation data is crucial for snow data assimilation. Additionally, the assimilations of variables such as soil moisture, soil water storage, and brightness temperature may also play a significant role in improving snow data assimilation [52,53]. To reduce the uncertainty, multi-sensor assimilation [54] could be employed in future research.
In addition to using cloud coverage data as quality control data, other data, such as temperature and short-wave radiation, can be combined for quality control. In future research, it is also possible to combine more assimilation methods and quality control schemes to explore their performance in improving snow data assimilation [48].

Author Contributions

Conceptualization, T.Y. and X.Y.; Methodology, T.Y. and X.Y.; Software, T.Y., E.Z. and P.J.; Writing—Original Draft Preparation, T.Y.; Writing—Review and Editing, T.Y., X.Y., E.Z. and P.J.; Funding Acquisition, X.Y. All authors have read and agreed to the published version of the manuscript.

Funding

This work was supported by National Natural Science Foundation of China (U22A20556), and the National Key Scientific and Technological Infrastructure project “Earth System Numerical Simulation Facility” (EarthLab).

Data Availability Statement

The CMFD meteorological data can be found here: http://data.tpdc.ac.cn/en/data/8028b944-daaa-4511-8769-965612652c49/ (accessed on 6 January 2023). The publicly available datasets ECMWF in this study can be found here: https://apps.ecmwf.int/datasets/data/tigge/levtype=sfc/type=pf/ (accessed on 9 September 2023). The MODIS/Terra SCF datasets are available at the MODIS Snow/ICE Global Mapping Project website (https://modis-snow-ice.gsfc.nasa.gov/, accessed on 2 September 2023). The in situ observations are provided by the China Meteorological Administration (http://data.cma.cn/, accessed on 16 March 2024).

Conflicts of Interest

The authors declare that they have no known competing financial interests or personal relationships that could have appeared to influence the work reported in this paper.

References

  1. Dong, C. Remote sensing, hydrological modeling and in situ observations in snow cover research: A review. J. Hydrol. 2018, 561, 573–583. [Google Scholar] [CrossRef]
  2. Ruggieri, P.; Benassi, M.; Materia, S.; Peano, D.; Ardilouze, C.; Batté, L.; Gualdi, S. On the role of Eurasian autumn snow cover in dynamical seasonal predictions. Clim. Dyn. 2022, 58, 2031–2045. [Google Scholar] [CrossRef]
  3. Livneh, B.; Badger, A.M. Drought less predictable under declining future snowpack. Nat. Clim. Change 2020, 10, 452–458. [Google Scholar] [CrossRef]
  4. Yan, D.; Ma, N.; Zhang, Y. Development of a fine-resolution snow depth product based on the snow cover probability for the Tibetan Plateau: Validation and spatial–temporal analyses. J. Hydrol. 2022, 604, 127027. [Google Scholar] [CrossRef]
  5. Turner, A.G.; Slingo, J.M. Using idealized snow forcing to test teleconnections with the Indian summer monsoon in the Hadley Centre GCM. Clim. Dyn. 2011, 36, 1717–1735. [Google Scholar] [CrossRef]
  6. Wang, J.; Cui, Y.; He, X.; Zhang, J.; Yan, S. Surface Albedo Variation and Its Influencing Factors over Dongkemadi Glacier, Central Tibetan Plateau. Adv. Meteorol. 2015, 2015, 852098. [Google Scholar]
  7. Broxton, P.D.; Zeng, X.; Dawson, N. Why do global reanalyses and land data assimilation products underestimate snow water equivalent. J. Hydrometeorol. 2016, 17, 2743–2761. [Google Scholar] [CrossRef]
  8. Arsenault, K.R.; Houser, P.R.; De Lannoy, G.J.M.; Dirmeyer, P.A. Impacts of snow cover fraction data assimilation on modeled energy and moisture budgets. J. Geophys. Res. Atmos. 2013, 118, 7489–7504. [Google Scholar]
  9. Yan, D.; Zhang, Y. A 0.01° daily improved snow depth dataset for the Tibetan Plateau. J. Hydrol. 2024, 631, 130706. [Google Scholar] [CrossRef]
  10. Zhang, S.; Shi, C.X.; Shen, R.P.; Wu, J. Improved assimilation of Fengyun-3 satellite-based snow cover fraction in northeastern China. J. Meteor. Res. 2019, 33, 960–975. [Google Scholar]
  11. Liang, J.; Yang, Z.; Lin, P. Systematic Hydrological Evaluation of the Noah-MP Land Surface Model over China. Adv. Atmos. Sci. 2019, 36, 1171–1187. [Google Scholar] [CrossRef]
  12. Schneider, T.; Lan, S.; Stuart, A.; Teixeira, J. Earth System Modeling 2.0: A Blueprint for Models That Learn From Observations and Targeted High-Resolution Simulations. Geophys. Res. Lett. 2017, 44, 12396–12417. [Google Scholar]
  13. Yuan, X.; Ji, P.; Wang, L.; Liang, X.-Z.; Yang, K.; Ye, A.; Su, Z.; Wen, J. High-resolution land surface modeling of hydrological changes over the Sanjiangyuan region in the eastern Tibetan plateau: 1. Model development and evaluation. J. Adv. Model. Earth Syst. 2018, 10, 2806–2828. [Google Scholar] [CrossRef]
  14. Scanlon, B.R.; Zhang, Z.; Save, H.; Sun, A.Y.; Schmied, H.M.; Van Beek, L.P.H.; Wiese, D.N.; Wada, Y.; Long, D.; Reedy, R.C.; et al. Global models underestimate large decadal declining and rising water storage trends relative to GRACE satellite data. Proc. Natl. Acad. Sci. USA 2018, 115, E1080–E1089. [Google Scholar] [CrossRef]
  15. Evensen, G. Sequential data assimilation with a nonlinear quasi-geostrophic model using Monte Carlo methods to forecast error statistics. J. Geophys. Res. 1994, 99, 10143–10162. [Google Scholar]
  16. Zhang, Y.-F.; Hoar, T.J.; Yang, Z.-L.; Anderson, J.L.; Toure, A.M.; Rodell, M. Assimilation of MODIS snow cover through the Data Assimilation Research Testbed and the Community Land Model version 4. J. Geophys. Res. Atmos. 2014, 119, 7091–7103. [Google Scholar]
  17. Whitaker, J.S.; Hamill, T.M. Ensemble data assimilation without perturbed observations. Mon. Weather Rev. 2002, 130, 1913–1924. [Google Scholar] [CrossRef]
  18. Xiao, H.; Han, W.; Wang, H.; Wang, J.; Liu, G.; Xu, C. Corrigendum. J Meteorol Res. 2021, 35, 224. [Google Scholar] [CrossRef]
  19. Li, X.; Liu, F.; Ma, C.; Hou, J.; Zheng, D.; Ma, H.; Bai, Y.; Han, X.; Vereecken, H.; Yang, K.; et al. Land data assimilation: Harmonizing theory and data in land surface process studies. Rev. Geophys. 2024, 62, e2022RG000801. [Google Scholar] [CrossRef]
  20. Weaver, A.T. 3D-Var and 4D-Var approaches to ocean data assimilation. In Proceedings of the ECMWF Workshop on the Role of the Upper Ocean in Medium and Extended Range Forecasting, Reading, UK, 13–15 November 2002; Volume 1, pp. 57–66. [Google Scholar]
  21. Duan, X.; Chen, Y.; Wang, L.; Zheng, G.; Liang, T. The impact of land use and land cover changes on the landscape pattern and ecosystem service value in Sanjiangyuan region of the Qinghai-Tibet Plateau. J. Environ. Manag. 2023, 325, 116539. [Google Scholar] [CrossRef]
  22. Robertson, L.; Langner, J. On The Issue Of Quality Control In Data Assimilation. In Air Pollution Modeling and Its Application XIII; Gryning, S.E., Batchvarova, E., Eds.; Springer: Boston, MA, USA, 2000. [Google Scholar]
  23. Sakov, P.; Sandery, P. An adaptive quality control procedure for data assimilation. Tellus A Dyn. Meteorol. Oceanogr. 2018, 69, 1318031. [Google Scholar]
  24. Yan, D.; Ma, N.; Zhang, Y. A Daily, 0.05° Snow Depth Dataset for Tibetan Plateau (2000–2018). National Tibetan Plateau/Third Pole Environment Data Center. 2021. Available online: https://cstr.cn/18406.11.Snow.tpdc.271743 (accessed on 12 August 2023).
  25. Ji, P.; Yuan, X.; Jiao, Y.; Zhang, M. On the reliability of 12 high-resolution precipitation products for process-based hydrological modeling in China. J. Hydrol. 2023, 628, 130598. [Google Scholar]
  26. Zhu, E.; Shi, C.; Sun, S.; Jia, B.; Wang, Y.; Yuan, X. Hybrid Assimilation of Snow Cover Improves Land Surface Simulations over Northern China. J. Hydrol. 2023, 24, 1725–1738. [Google Scholar]
  27. Keyhan, G.; Peyman, A.; Morin, S.; Hamid, M. How does precipitation data influence the land surface data assimilation for drought monitoring? Sci. Total Environ. 2022, 831, 154916. [Google Scholar]
  28. Wang, R.; Ding, Y.; Shangguan, D.; Cuo, L.; Zhao, Q.; Qin, J.; Li, J.; Song, M. Projections of glacier peak water and its timing in the Sanjiangyuan on the Tibet Plateau. J. Hydrol. Reg. Stud. 2023, 45, 101313. [Google Scholar]
  29. Qu, L.; Jia, S.; Li, R. Spatial Water Consumption Test and Analysis of Various Typical Vegetation in the Sanjiangyuan Region. Sustainability 2023, 15, 5422. [Google Scholar] [CrossRef]
  30. Ma, B.; Zeng, W.; Xie, Y.; Wang, Z.; Hu, G.; Li, Q.; Cao, R.; Zhuo, Y.; Zhang, T. Boundary delineation and grading functional zoning of Sanjiangyuan National Park based on biodiversity importance evaluations. Sci. Total Environ. 2022, 825, 154068. [Google Scholar] [CrossRef]
  31. Dai, E.Z.; Zeng, X.B.; Dickinson, R.E.; Baker, I.; Bonan, G.B.; Bosilovich, M.G.; Denning, A.S.; Dirmeyer, P.A.; Houser, P.R.; Niu, G.Y.; et al. The Common Land Model. B. Am. Meteorol. Soc. 2003, 84, 1013–1024. [Google Scholar]
  32. Rao, P.; Wang, F.; Yuan, X.; Liu, Y.; Jiao, Y. Evaluation and comparison of 11 sets of gridded precipitation products over the Qinghai-Tibet Plateau. Atmos. Res. 2024, 302, 107315. [Google Scholar]
  33. Yu, Q.; Feng, C.; Shi, Y.; Guo, L. Spatiotemporal interaction between ecosystem services and urbanization in China: Incorporating the scarcity effects. J. Clean. Prod. 2021, 317, 128392. [Google Scholar]
  34. Yang, K.; He, J.; Tang, W.; Lu, H.; Qin, J.; Chen, Y.; Li, X. China Meteorological Forcing Dataset (1979–2018). National Tibetan Plateau/Third Pole Environment Data Center. 2019. Available online: https://cstr.cn/18406.11.AtmosphericPhysics.tpe.249369.file (accessed on 6 January 2023).
  35. Hersbach, H.; Bell, B.; Berrisford, P.; Hirahara, S.; Horányi, A.; Muñoz-Sabater, J.; Nicolas, J.; Peubey, C.; Radu, R.; Schepers, D.; et al. The ERA5 global reanalysis. Q. J. R. Meteorol. Soc. 2020, 146, 1999–2049. [Google Scholar]
  36. Hall, D.K.; Riggs, G.A.; Salomonson, V.V.; Digirolamo, N.E.; Bayr, K.J. MODIS snow-cover products. Remote Sens. Environ. 2002, 83, 181–194. [Google Scholar] [CrossRef]
  37. Ji, P.; Yuan, X.; Shi, C.; Jiang, L.; Wang, G.; Yang, K.A. long-term simulation of land surface conditions at high-resolution over continental China. J. Hydrometeorol. 2023, 24, 285–314. [Google Scholar]
  38. Yuan, X.; Liang, X.Z. Evaluation of a conjunctive surface-subsurface process model (CSSP) over the contiguous United States at regional-local scales. J. Hydrometeorol. 2011, 12, 579–599. [Google Scholar] [CrossRef]
  39. Choi, H.I.; Kumar, P.; Liang, X.-Z. Three-dimensional volume-averaged soil moisture transport model with a scalable parameterization of subgrid topographic variability. Water Resour. Res. 2007, 43, W04414. [Google Scholar]
  40. Dai, Y.; Hacker, C.E.; Zhang, Y.; Li, Y.; Li, J.; Xue, Y.; Li, D. Conflicts of human with the Tibetan brown bear (Ursus arctos pruinosus) in the Sanjiangyuan region, China. Glob. Ecol. Conserv. 2020, 22, e01039. [Google Scholar] [CrossRef]
  41. Ji, P.; Yuan, X. High-Resolution Land Surface Modeling of Hydrological Changes Over the Sanjiangyuan Region in the Eastern Tibetan Plateau: 2. Impact of Climate and Land Cover Change. J. Adv. Model. Earth Syst. 2018, 10, 2829–2843. [Google Scholar]
  42. Niu, G.Y.; Yang, Z.L. An observation-based formulation of snow cover fraction and its evaluation over large North American river basins. J. Geophys. Res. 2007, 112, 21101. [Google Scholar]
  43. Niu, G.Y.; Yang, Z.L.; Mitchell, K.E.; Chen, F.; Ek, M.B.; Barlage, M.; Kumar, A.; Manning, K.; Niyogi, D.; Rosero, E.; et al. The community Noah land surface model with multiparameterization options (Noah-MP): 1. Model description and evaluation with local-scale measurements. J. Geophys. Res. Atmos. 2011, 116, 1–19. [Google Scholar]
  44. Evensen, G. Data Assimilation: The Ensemble Kalman Filter, 2nd ed.; Springer: Berlin/Heidelberg, Germany, 2010; Volume 42, pp. 1001–1002. [Google Scholar]
  45. Andreadis, K.M.; Lettenmaier, D.P. Assimilating remotely sensed snow observations into a macroscale hydrology model. Adv. Water Resour. 2006, 29, 872–886. [Google Scholar]
  46. Su, H.; Yang, Z.L.; Niu, G.Y.; Dickinson, R.E. Enhancing the estimation of continental-scale snow water equivalent by assimilating MODIS snow cover with the ensemble Kalman filter. J. Geophys. Res. Atmos. 2008, 113, 1–12. [Google Scholar] [CrossRef]
  47. Zhao, L.; Yang, Z.L. Multi-sensor land data assimilation: Toward a robust global soil moisture and snow estimation. Remote Sens. Environ. 2018, 216, 13–27. [Google Scholar]
  48. Hou, J.; Huang, C.; Chen, W.; Zhang, Y. Improving snow estimates through assimilation of MODIS fractional snow cover data using machine learning algorithms and the common land model. Water Resour. Res. 2021, 57, e2020WR029010. [Google Scholar] [CrossRef]
  49. Liu, Y.; Christa, D.; Sujay, K.; James, L.; Michael, S.; Tian, Y.; Gregory, M. Assimilating satellite-based snow depth and snow cover products for improving snow predictions in Alaska. Adv. Water Resour. 2013, 54, 208–227. [Google Scholar]
  50. Toure, A.M.; Reichle, R.H.; Forman, B.A.; Getirana, A.; De Lannoy, G.J.M. Assimilation of MODIS Snow Cover Fraction Observations into the NASA Catchment Land Surface Model. Remote Sens. 2018, 10, 316. [Google Scholar] [CrossRef]
  51. Zeng, J.; Yuan, X.; Ji, P.; Shi, C. Effects of meteorological forcings and land surface model on soil moisture simulation over China. J. Hydrol. 2021, 603, 126978. [Google Scholar] [CrossRef]
  52. Jia, B.; Xie, Z.; Tian, X.; Shi, C. A soil moisture assimilation scheme based on the ensemble Kalman filter using microwave brightness temperature. Sci. China 2009, 52D, 1835–1848. [Google Scholar]
  53. Tian, X.; Xie, Z.; Dai, A.; Shi, C.; Jia, B.; Chen, F.; Yang, K. A dual-pass variational data assimilation framework for estimating soil moisture profiles from AMSR-E microwave brightness temperature. J. Geophys. Res. 2009, 114, D16102. [Google Scholar]
  54. Stigter, E.E.; Wanders, N.; Saloranta, T.M.; Shea, J.M.; Bierkens, M.F.P. Assimilation of snow cover and snow depth into a snow model to estimate snow water equivalent and snowmelt runoff in a Himalayan catchment. Cryosphere 2017, 11, 1647–1664. [Google Scholar]
Figure 1. Study area and the locations of meteorological observation stations. The Sanjiangyuan region is located in the Qinghai-Tibet Plateau in western China, where 21 CMA meteorological observation stations are used to verify the quality of the assimilation data.
Water 17 01078 g001
Figure 2. Spatial averages and standard deviations of MODIS snow cover faction (SCF) and cloud cover fraction.
Water 17 01078 g002
Figure 3. The construction of CSSPv2-SDA system. ∆SD refers to snow depth change and Pre refers to total precipitation between two consecutive timesteps. The assimilation system is based on the CSSPv2 land surface hydrological model and the EnSRF assimilation algorithm. It generates the background field by perturbing meteorological forcing data, performs quality control on MODIS satellite remote sensing data to generate the observation field, and applies the EnSRF method to generate the analysis field.
Water 17 01078 g003
Figure 4. Validation of CSSPv2-SDA product in average scale. Monthly mean snow depth time series of observations, ERA5, TPDC, CSSPv2 model simulation, and CSSPv2-SDA assimilation.
Water 17 01078 g004
Figure 5. Validation of CSSPv2-SDA product at station scale. The CC and RMSE of the 21 CMA stations are represented by dots and lines, respectively.
Water 17 01078 g005
Figure 6. CSSPv2-SDA data validation. (a) Differences in wintertime CC for assimilated and simulated snow depth at 21 stations. (b) Relative reduction in wintertime RMSE (%) for assimilated and simulated snow depth in 21 stations.
Water 17 01078 g006
Figure 7. Comparisons of average CC and RMSE between simulated and assimilated snow depths driven by CMFD. (a) CC for different snow depths. (b) RMSE for different snow depths. (c) CC for different altitudes. (d) RMSE for different altitudes.
Water 17 01078 g007
Figure 8. Evaluation of quality control scheme. Time series of observed, simulated, and assimilated snow depth at station 56034 during a snowfall event in 2012 are shown, with four different quality control schemes. Q1 uses the cloud cover threshold of 20%, and Q2 uses 5%. Q3 requires snow depth assimilation increment should be less than 10 times the precipitation amount, and Q4 is the combination of Q2 and Q3.
Water 17 01078 g008
Figure 9. CC and RMSE for CSSPv2 open-loop simulation (OL) and data assimilation with 4 quality control schemes (Q1–Q4) at the 21 observation stations. The dots represent the CC or RMSE values for each station, while the red lines indicate the average values of CC or RMSE.
Water 17 01078 g009
Figure 10. CC and RMSE for CSSPv2 simulation (OL) and data assimilation with four different quality control schemes (Q1–O4) for the whole area and four altitude ranges.
Water 17 01078 g010
Figure 11. The impact of quality control schemes and meteorological forcing data on regional multi-year average snow depth. (a) Evaluation of data in (be) on the average of 21 CMA stations. The bar plots of (be) are for the root mean square error results of (be), and the line charts of (be) are the correlation coefficient results shown in (be). (b) ERA5 snow depth data, (c) CSSPv2-SDA data with 20% cloud threshold, (d) CSSPv2-SDA data with 5% cloud threshold and precipitation restriction, (e) CSSPv2-SDA data forced by CMFD precipitation and temperature.
Water 17 01078 g011
Table 1. Information on the meteorological forcing data, satellite snow cover used for assimilation, cloud cover data used for quality control, and snow depth validation data used for comparing with CSSPv2.
NameTimeOriginal ResolutionOperating Resolution
Climate ForcingCMFD, ERA52000.2–2015.120.25°3 km
Assimilation DataMODIS Snow Cover0.05°
Quality Control DataMODIS Cloud Cover
Validation DataTPDC
ERA5
CMA-OBS--
Table 2. Ensemble perturbation method of the snow cover assimilation.
VariablePerturbation MethodStandard Deviation
Climate ForcingShort Wave RadiationMultiplicative0.1 (−)
Long Wave RadiationAdditive15 (W/m2)
PrecipitationMultiplicative0.5 (−)
TemperatureAdditive0.5 (K)
Disclaimer/Publisher’s Note: The statements, opinions and data contained in all publications are solely those of the individual author(s) and contributor(s) and not of MDPI and/or the editor(s). MDPI and/or the editor(s) disclaim responsibility for any injury to people or property resulting from any ideas, methods, instructions or products referred to in the content.

