Statistical Approach for the Imputation of Long-Term Seawater Data Around the Korean Peninsula from 1966 to 2021
Abstract
1. Introduction
2. Methods
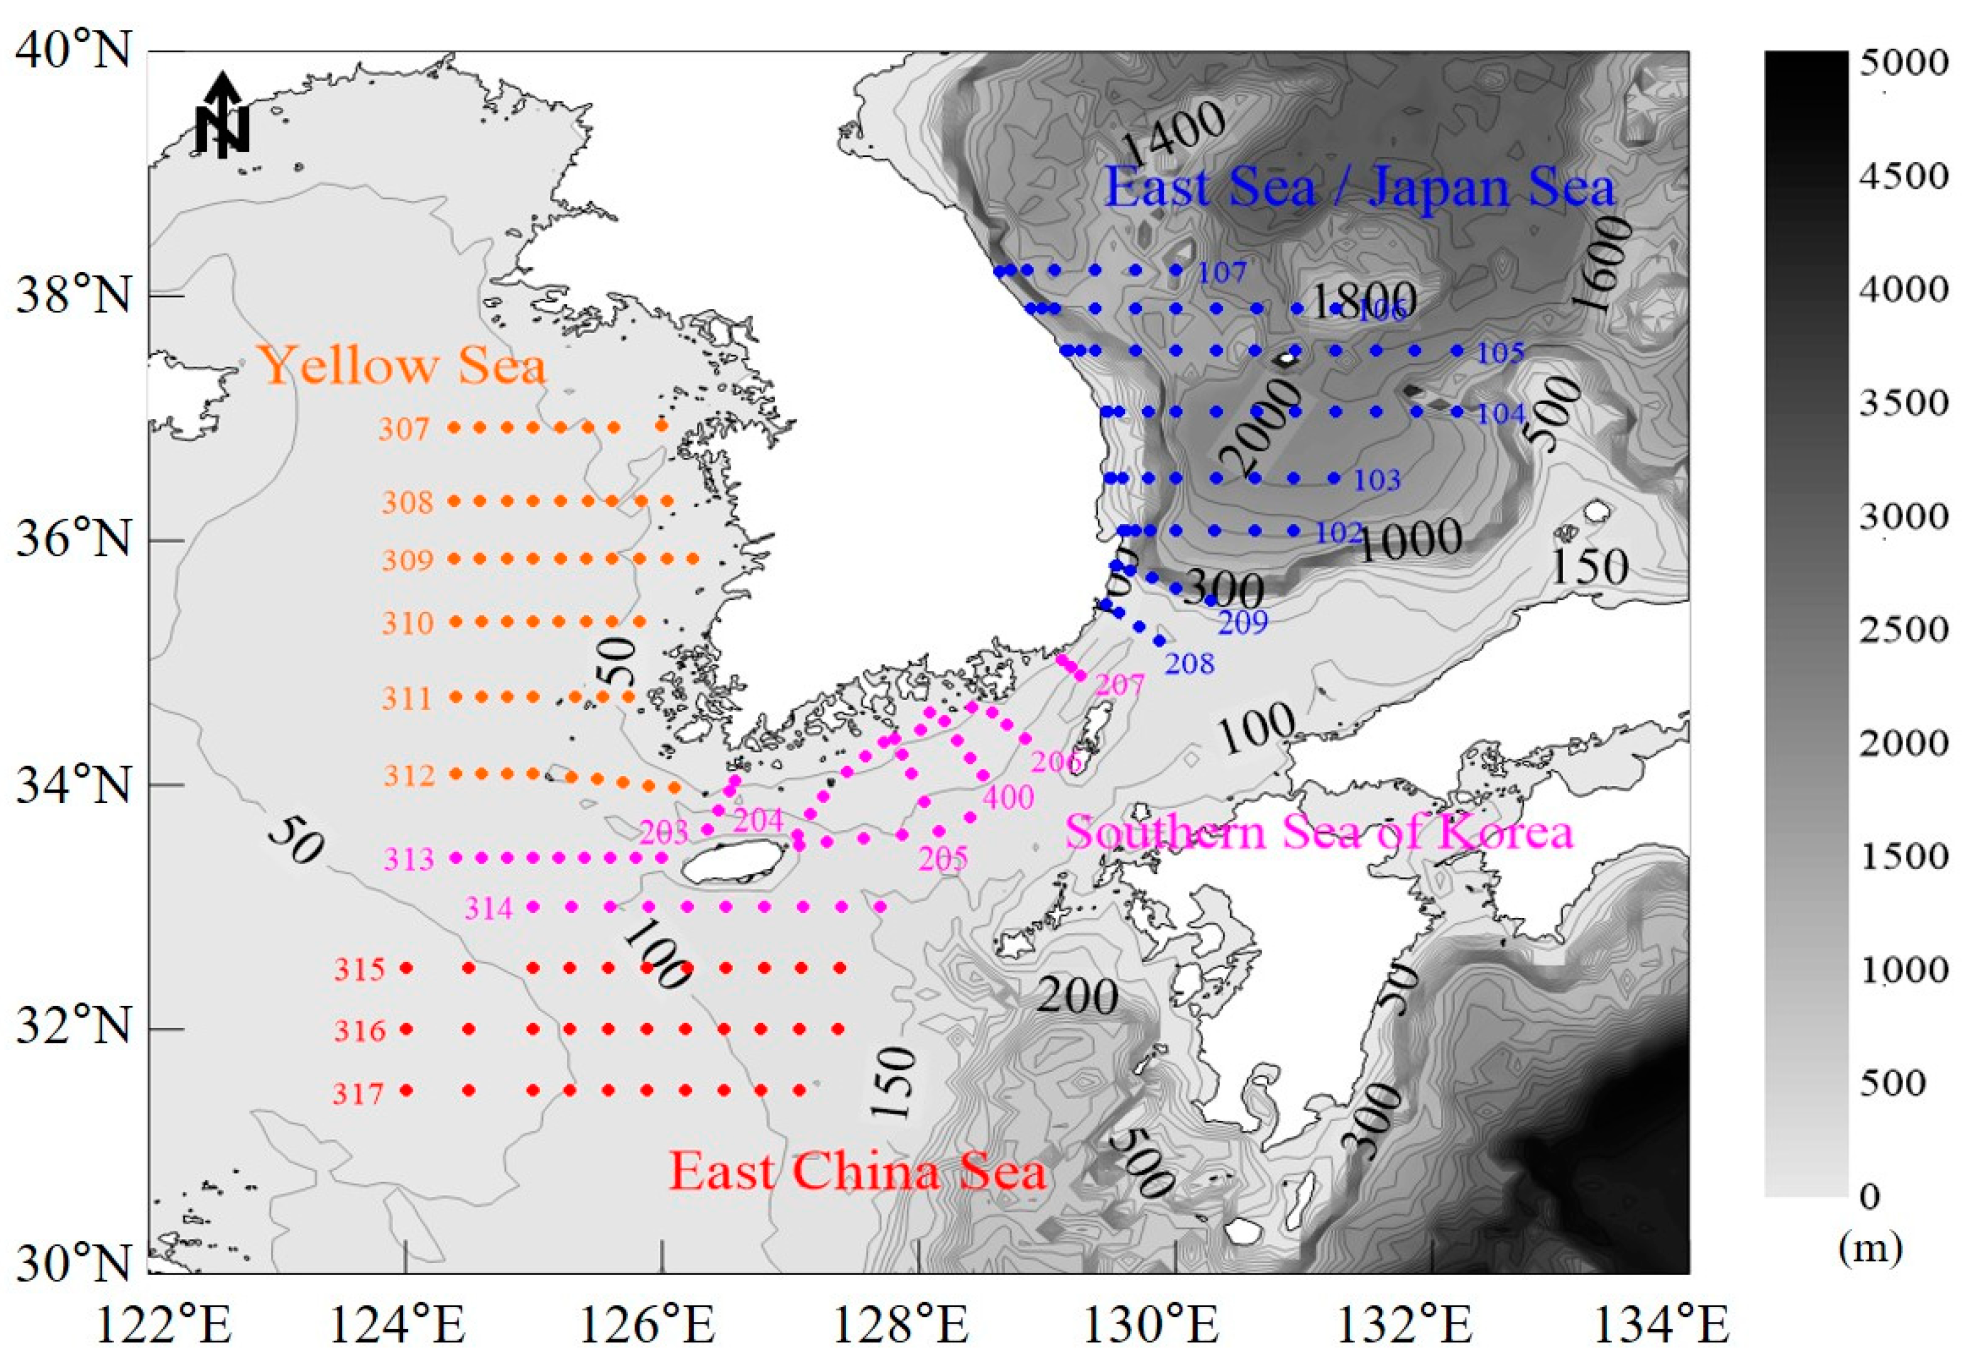
2.1. Study Area and Data Collection
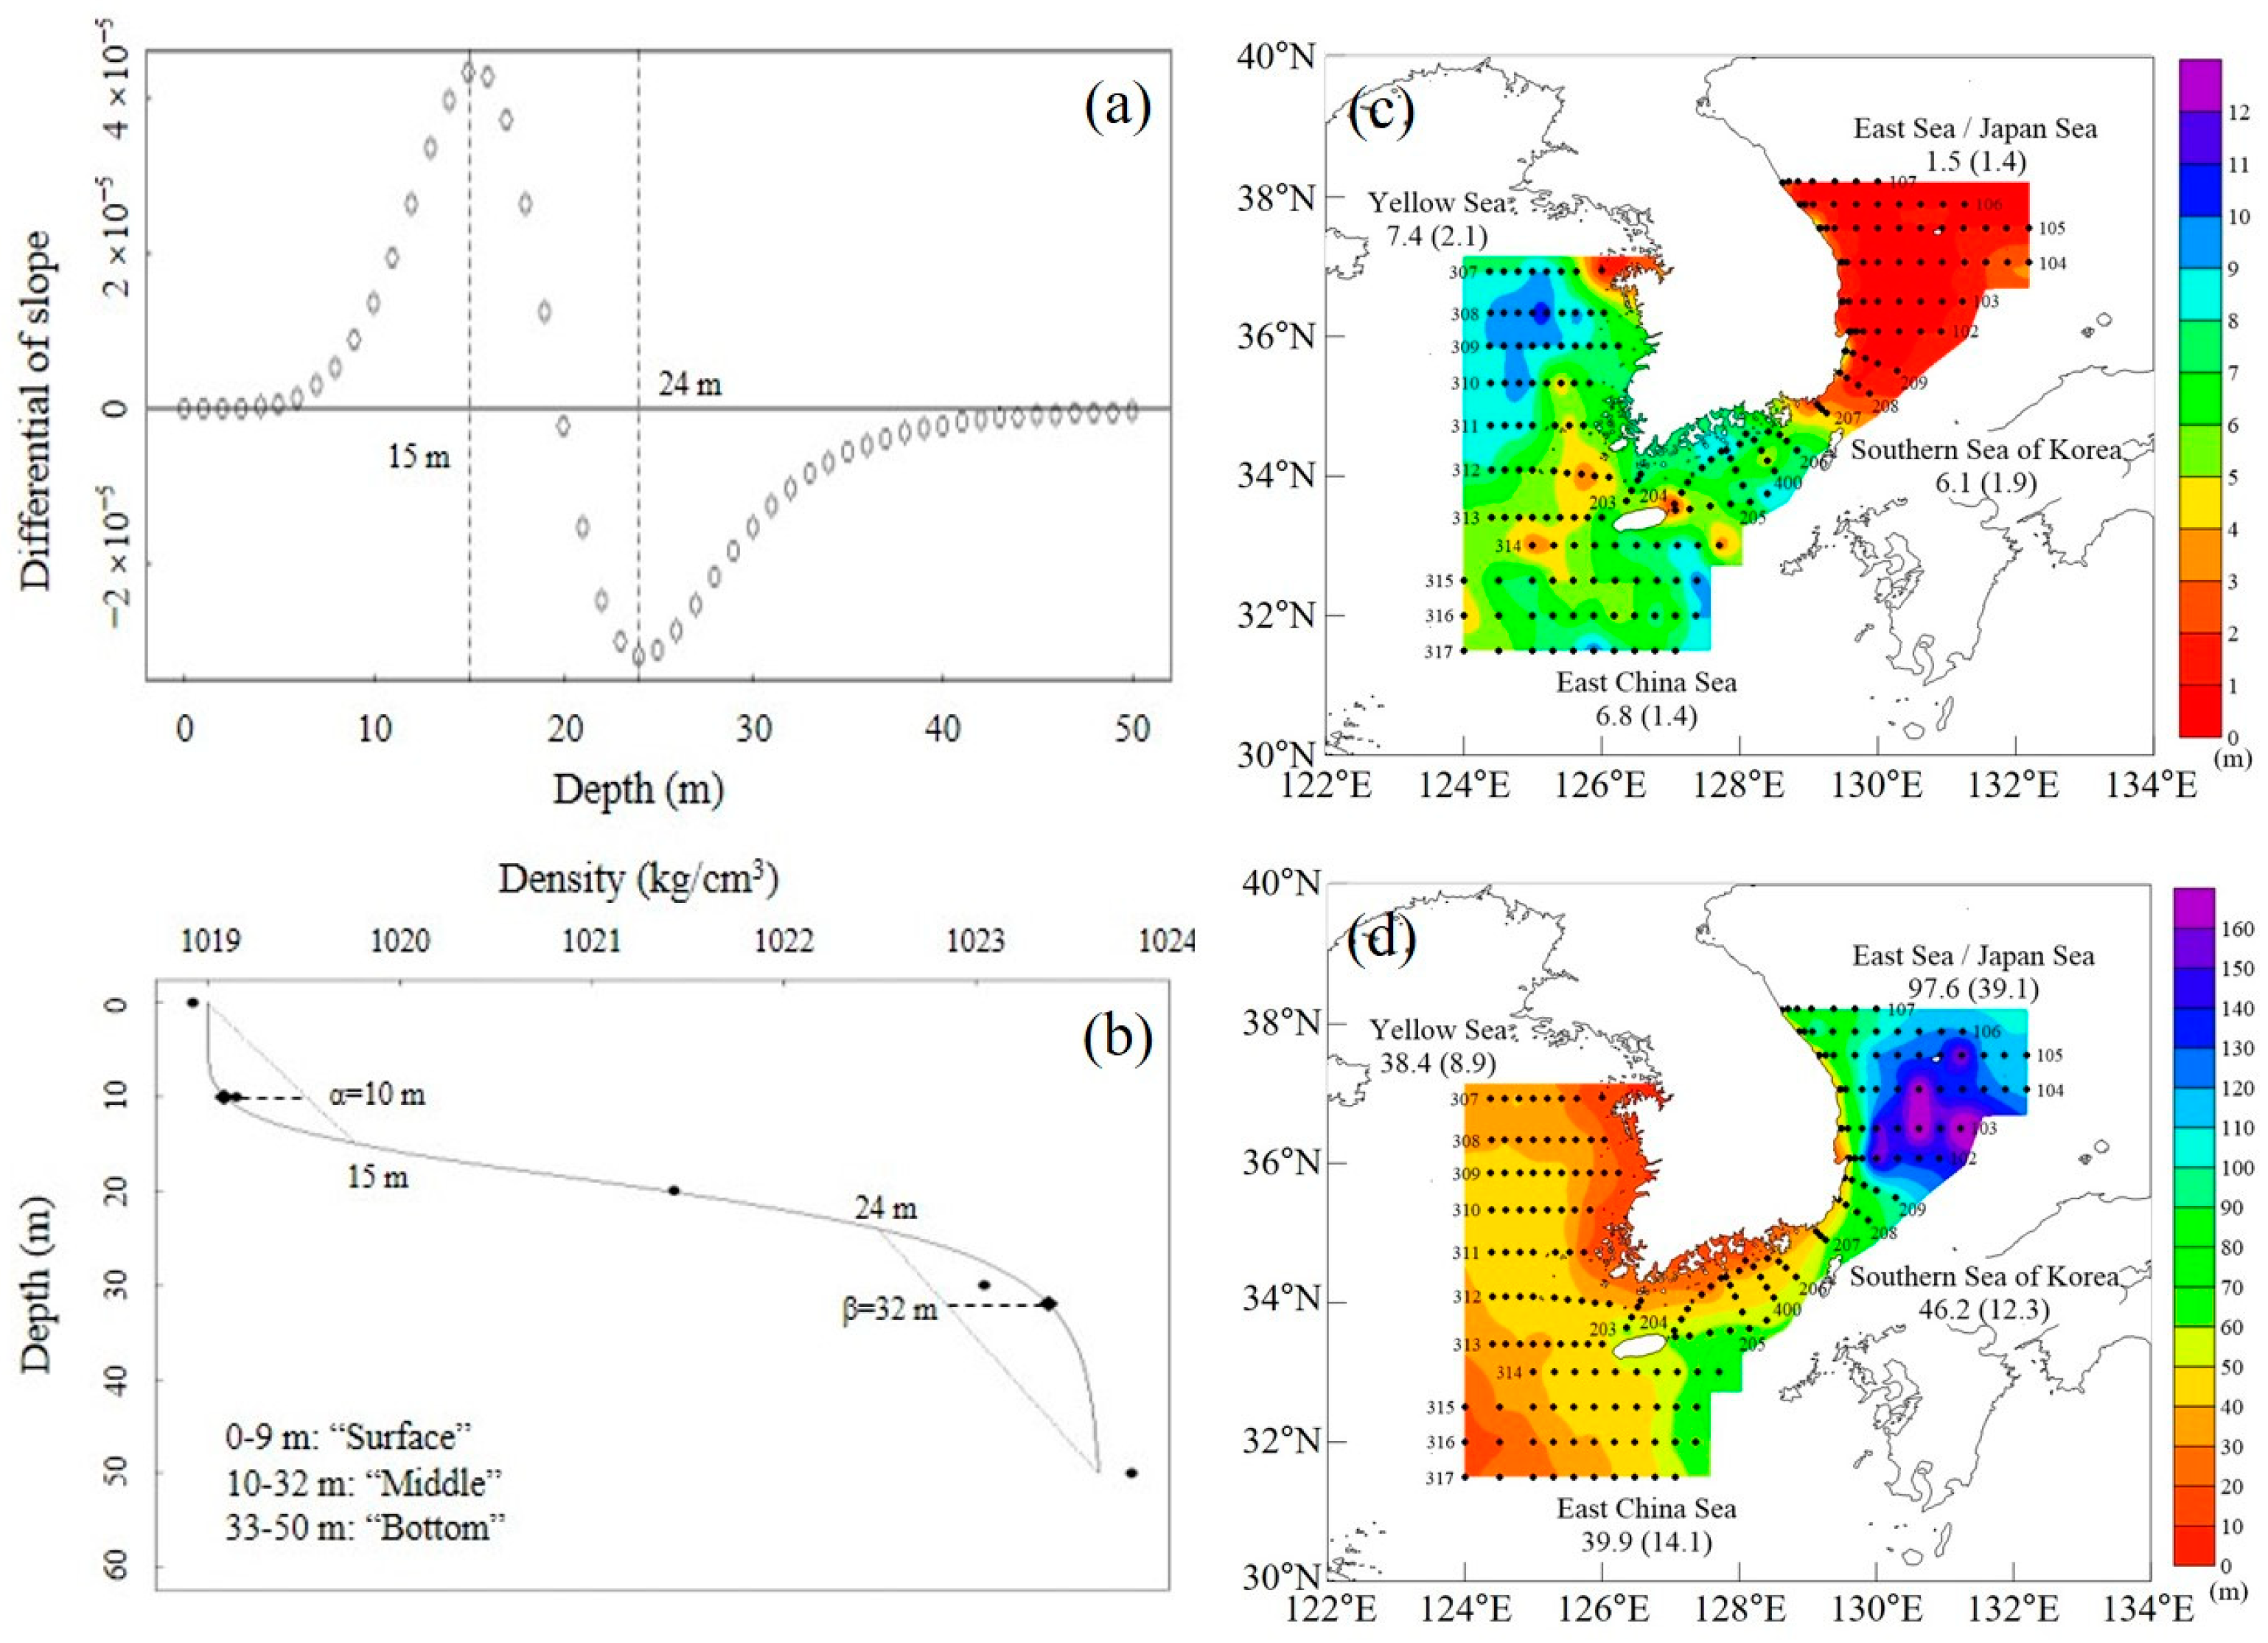
2.2. Water Layer Classification and Density Estimation
2.3. Data Imputation and Statistical Analysis
- (1)
- For data imputation, we considered three MI methods within the MICE framework: norm method, classification and regression trees (CART), and random forest (RF). The norm method is a simple imputation technique that does not consider predictor variables, which involves imputing missing values with the mean or median of the observed data. In contrast, both CART and RF are decision tree-based methods, which are particularly useful when the relationship between predictor variables and missing values is complex or nonlinear. To enhance the quality of the temperature and salinity data in QC2 and QC4, we assign the average value, repeating five times per MI methods (CART, RF, and the norm method), based on the QC1 data.
- (2)
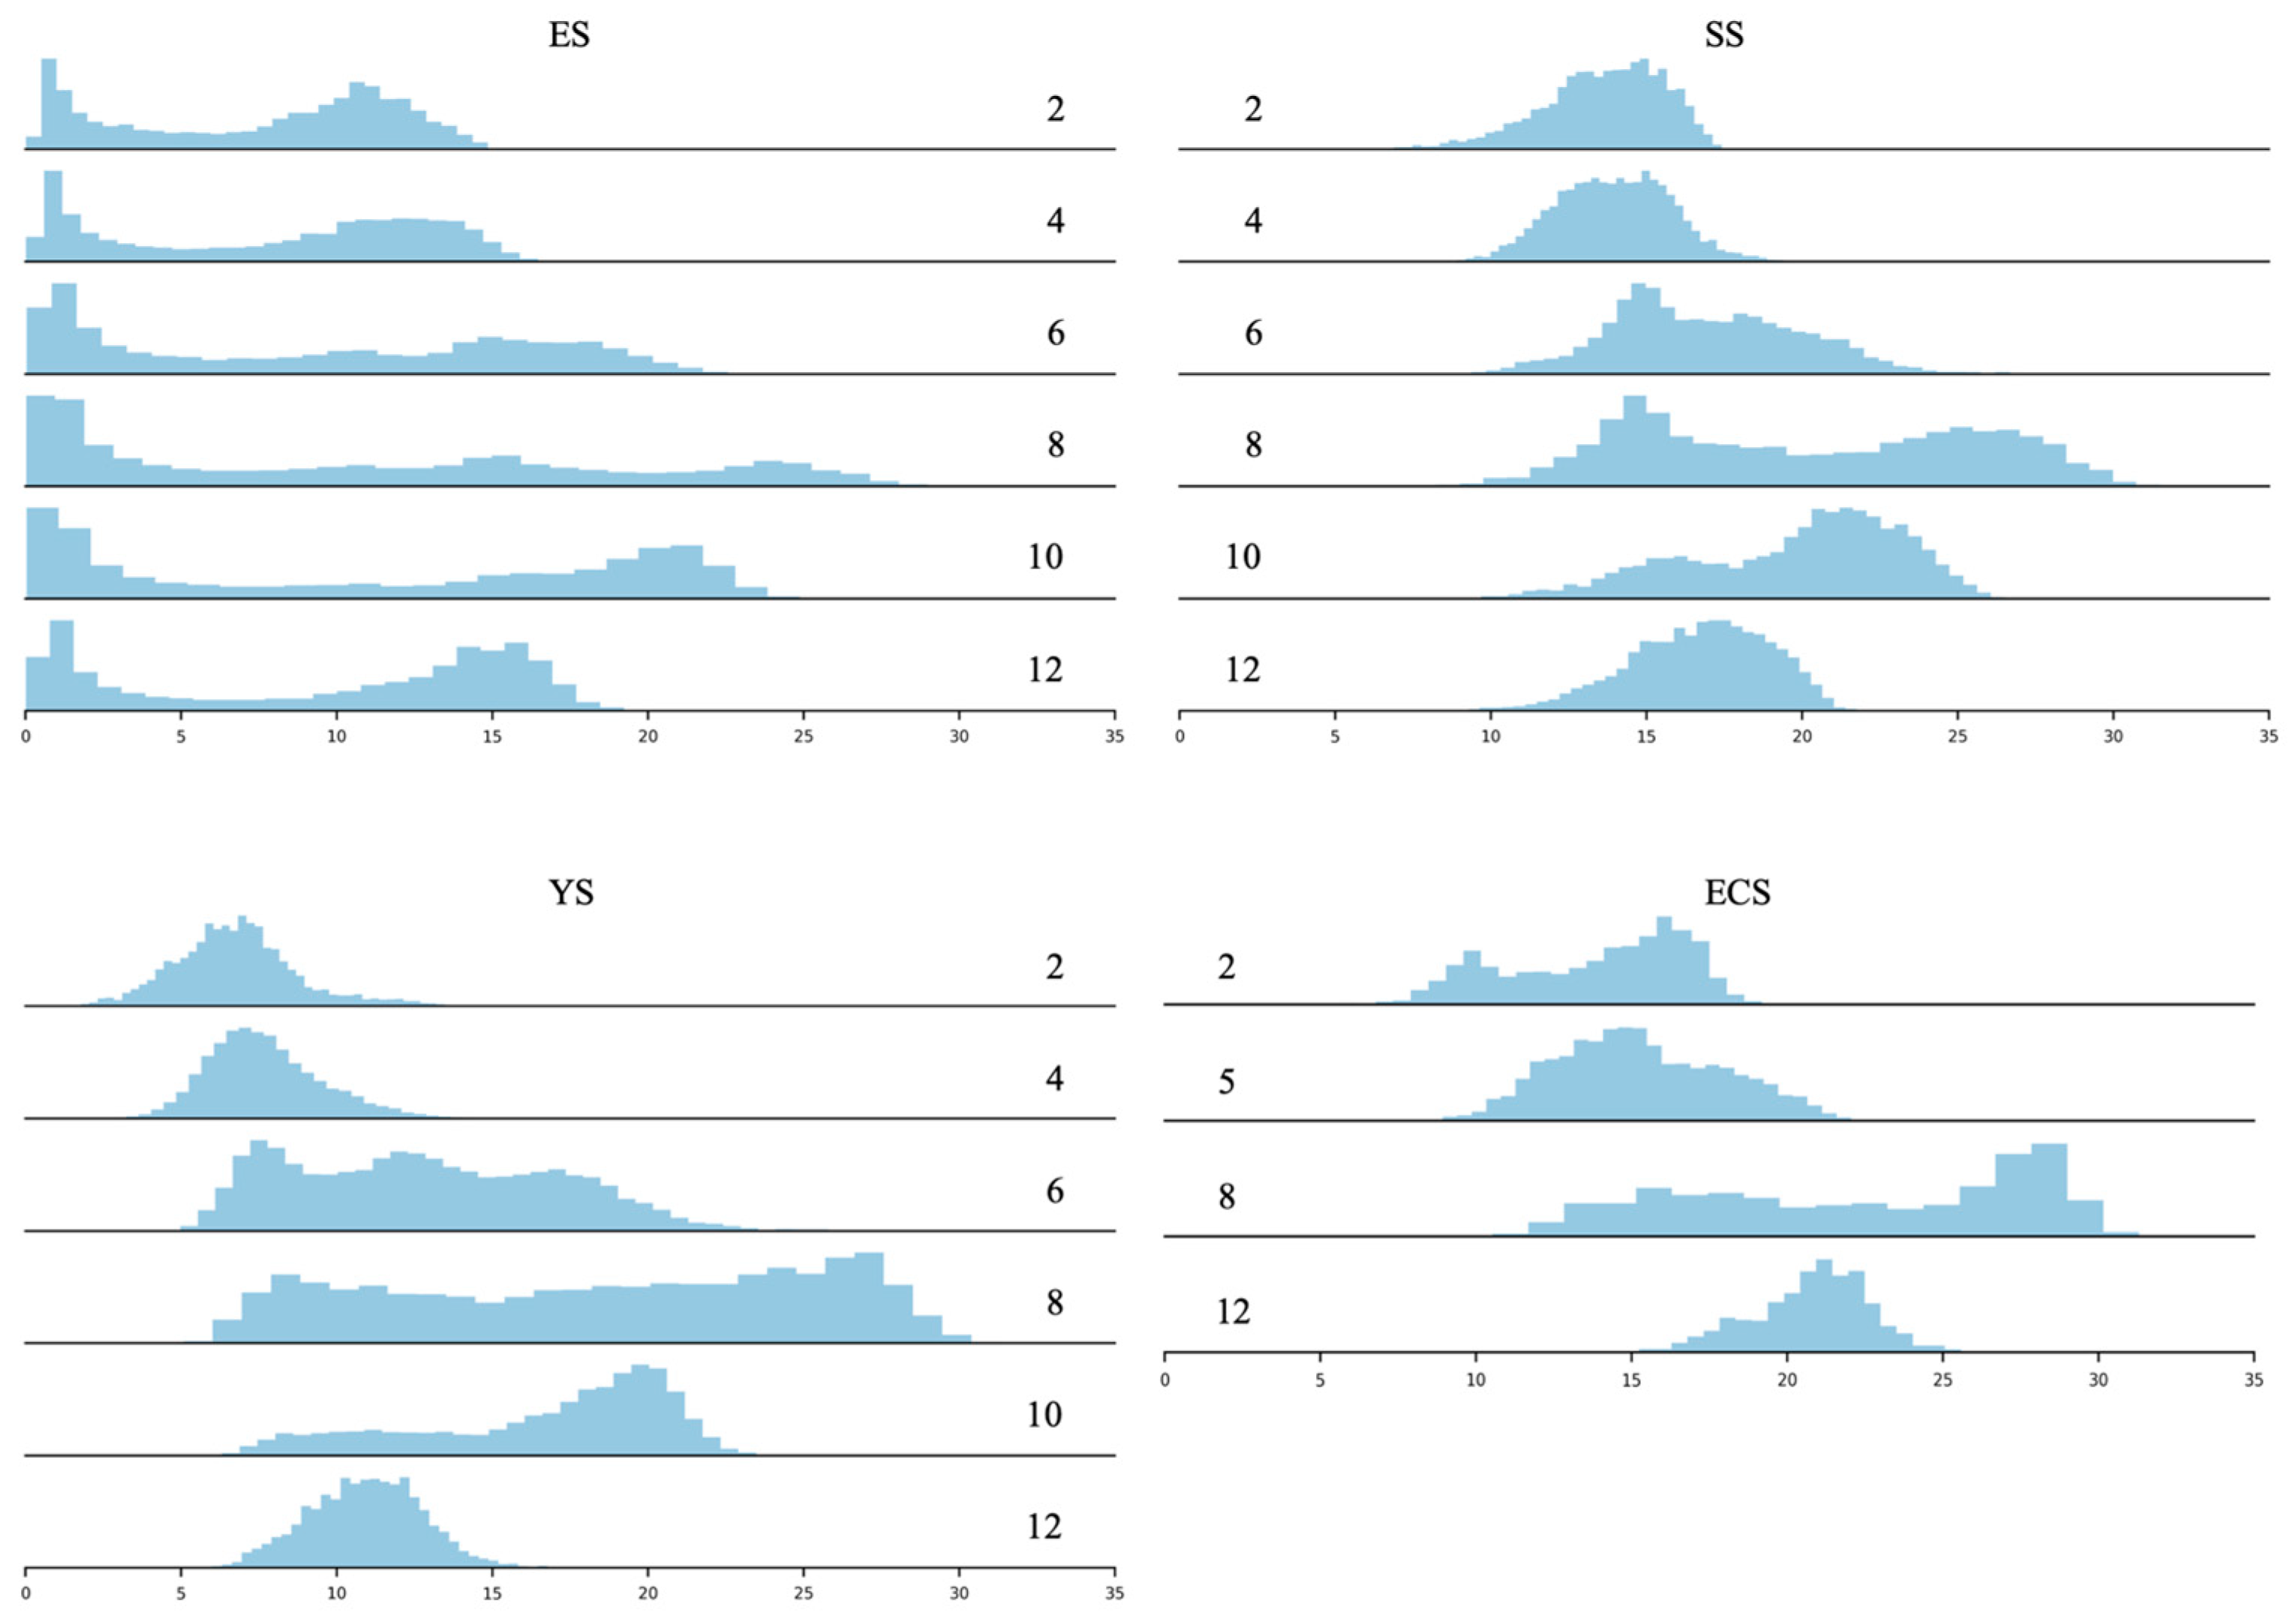
- To estimate the distribution of density features, we considered several distributions and selected the best one from the data. The seven distributions considered in this study were the normal, skewed normal, log-normal, student T, log-gamma, gamma, and inverse gamma (inv-gamma) distributions. Each distribution has different assumptions and properties suitable for different types of data.
- (3)
- To select the best distribution, we compared the distribution from the imputed data with the distribution from the QC1field-observed data using the Kolmogorov–Smirnov (KS) test [30]. The KS test is a non-parametric statistical test that assesses the similarity between two probability distributions. This procedure helps determine if the two samples exhibit the same distribution or if there is a statistically significant difference between them. The KS test was used to identify the most suitable distribution for the target feature among the seven distributions. Afterward, the differences between the distributions of the new target feature and the original target feature were scored (Table 4).
2.4. Deep Learning-Based Time Series Analysis
3. Results and Discussion
3.1. Water Layer Classification
3.2. Data Imputation
3.3. Temperature Trends
3.4. Influence of Pacific Decadal Oscillation
3.5. Proposed Model for Long-Term Temperature Analysis
4. Conclusions
Supplementary Materials
Author Contributions
Funding
Data Availability Statement
Conflicts of Interest
References
- Arias, P.; Bellouin, N.; Coppola, E.; Jones, R.; Krinner, G.; Marotzke, J.; Naik, V.; Palmer, M.; Plattner, G.; Rogelj, J. Climate Change 2021: The Physical Science Basis. Contribution of Working Group I to the Sixth Assessment Report of the Intergovernmental Panel on Climate Change; Technical Summary; Cambridge University Press: Cambridge, UK, 2021. [Google Scholar]
- Nakao, T. Oceanic variability in relation to fisheries in the East China Sea and the Yellow Sea. J. Fac. Mar. Sci. Technol. Tokai Univ. 1977, 199–367. [Google Scholar]
- Park, K.; Park, J.; Choi, B.; Lee, S.; Shin, H.; Lee, S.; Byun, D.; Kang, B.; Lee, E. Schematic maps of ocean currents in the Yellow Sea and the East China Sea for science textbooks based on scientific knowledge from oceanic measurements. J. Korean Soc. Oceanogr. 2017, 22, 151–171. [Google Scholar] [CrossRef]
- Chen, C.; Xue, P.; Ding, P.; Beardsley, R.C.; Xu, Q.; Mao, X.; Gao, G.; Qi, J.; Li, C.; Lin, H. Physical mechanisms for the offshore detachment of the Changjiang Diluted Water in the East China Sea. J. Geophys. Res. Ocean. 2008, 113, C2. [Google Scholar] [CrossRef]
- Park, M.; Song, J.; Han, I.; Lee, J. A Study of Long-term Trends of SST in the Korean Seas by Reconstructing Historical Oceanic Data. J. Korean Soc. Mar. Environ. Saf. 2019, 25, 881–897. [Google Scholar] [CrossRef]
- Seong, K.; Hwang, J.; Han, I.; Go, W.; Suh, Y.; Lee, J. Characteristic for long-term trends of temperature in the Korean waters. J. Korean Soc. Mar. Environ. Saf. 2010, 16, 353–360. [Google Scholar]
- Yoon, S.C.; Youn, S.H.; Shim, M.J.; Yoon, Y.Y. Characteristics and variation trend of water mass in offshore of the east coast of Korea during last 10 years. J. Korean Soc. Mar. Environ. Energy 2017, 20, 193–199. [Google Scholar] [CrossRef]
- Ghahramani, Z.; Michael, I.J. Supervised learning from incomplete data via an EM approach. Adv. Neural Inf. Process Syst. 1994, 6, 120–127. [Google Scholar]
- Beckers, J.-M.; Michel, R. EOF Calculations and Data Filling from Incomplete Oceanographic Datasets. J. Atmos. Ocean. Technol. 2003, 20, 1839–1856. [Google Scholar] [CrossRef]
- Han, I.; Lee, J. Change the annual amplitude of sea surface temperature due to climate change in a recent decade around the Korean Peninsula. J. Korean Soc. Mar. Environ. Saf. 2020, 26, 233–241. [Google Scholar] [CrossRef]
- Han, S.-B. Hydrographic Observations around Korean Peninsula: Past, Present and Future. J. Korean Soc. Oceanogr. 1992, 27, 332–341. [Google Scholar]
- Korea Oceanographic Data Center. Available online: https://www.nifs.go.kr/kodc/soo_list.kodc (accessed on 10 April 2023).
- Kara, A.B.; Rochford, P.A.; Hurlburt, H.E. Mixed layer depth variability over the global ocean. J. Geophys. Res. Ocean. 2003, 108, C3. [Google Scholar] [CrossRef]
- Kara, A.B.; Rochford, P.A.; Hurlburt, H.E. An optimal definition for ocean mixed layer depth. J. Geophys. Res. Ocean. 2000, 105, 16803–16821. [Google Scholar] [CrossRef]
- Yoon, D.; Choi, H. Development of algorithms for extracting thermocline parameters in the South Sea of Korea. Ocean. Polar Res. 2012, 34, 265–273. [Google Scholar] [CrossRef]
- Ryu, I.; Lee, B.; Cho, Y.; Choi, H.; Shin, D.; Kim, S.; Yu, S. Analyzing Flow Variation and Stratification of Paldang Reservoir Using High-frequency W ater Temperature Data. J. Korean Soc. Water Environ. 2020, 36, 392–404. [Google Scholar] [CrossRef]
- Kim, K.; Kim, K.; Kim, Y.; Cho, Y.; Kang, D.; Takematsu, M.; Volkov, Y. Water masses and decadal variability in the East Sea (Sea of Japan). Prog. Oceanogr. 2004, 61, 157–174. [Google Scholar] [CrossRef]
- Kim, Y.O.; Choi, J.; Choi, D.H.; Oh, K. A biological indication of vertical mixing of the Yellow Sea Bottom Cold Water. Ocean. Sci. J. 2023, 58, 7. [Google Scholar] [CrossRef]
- Lee, W.; Hur, D. Development of 3-d hydrodynamical model for understanding numerical analysis of density current due to salinity and temperature and its verification. KSCE J. Civ. Eng. 2014, 34, 859–871. [Google Scholar] [CrossRef]
- Gill, A.E. Transfer of Properties between Atmosphere and Ocean. In Atmosphere—Ocean Dynamics; Academic Press: New York, NY, USA, 1982; pp. 36–38. ISBN 0122835204. [Google Scholar]
- Zhang, Z. Multiple imputation with multivariate imputation by chained equation (MICE) package. Ann. Transl. Med. 2016, 4, 30. [Google Scholar] [CrossRef]
- Yuan, Y. Multiple imputation using SAS software. J. Stat. Softw. 2011, 45, 1–25. [Google Scholar] [CrossRef]
- Murray, J.S. Multiple imputation: A review of practical and theoretical findings. Statist. Sci. 2018, 33, 142–159. [Google Scholar] [CrossRef]
- Kim, H.; Soh, H.Y.; Kwak, M.; Han, S. Machine learning and multiple imputation approach to predict chlorophyll-a concentration in the coastal zone of Korea. Water 2022, 14, 1862. [Google Scholar] [CrossRef]
- Sheng, H.; Liu, H.; Wang, C.; Guo, H.; Liu, Y.; Yang, Y. Analysis of cyanobacteria bloom in the Waihai part of Dianchi Lake, China. Ecol. Inf. 2012, 10, 37–48. [Google Scholar] [CrossRef]
- Sterne, J.A.; White, I.R.; Carlin, J.B.; Spratt, M.; Royston, P.; Kenward, M.G.; Wood, A.M.; Carpenter, J.R. Multiple imputation for missing data in epidemiological and clinical research: Potential and pitfalls. BMJ 2009, 338, b2393. [Google Scholar] [CrossRef]
- Nakagawa, S.; Freckleton, R.P. Model averaging, missing data and multiple imputation: A case study for behavioural ecology. Behav. Ecol. Sociobiol. 2011, 65, 103–116. [Google Scholar] [CrossRef]
- Mackinnon, A. The use and reporting of multiple imputation in medical research—A review. J. Intern. Med. 2010, 268, 586–593. [Google Scholar] [CrossRef]
- Lokupitiya, R.S.; Lokupitiya, E.; Paustian, K. Comparison of missing value imputation methods for crop yield data. Environmetrics 2006, 17, 339–349. [Google Scholar] [CrossRef]
- Berger, V.W.; Zhou, Y. Kolmogorov–smirnov test: Overview. In Wiley Statsref: Statistics Reference Online; John Wiley & Sons Press: New York, NY, USA, 2014; pp. 1–5. [Google Scholar] [CrossRef]
- Hwang, K.; Jung, S. Decadal changes in fish assemblages in waters near the Ieodo ocean research station (East China Sea) in relation to climate change from 1984 to 2010. Ocean Sci. J. 2012, 47, 83–94. [Google Scholar] [CrossRef]
- Yoon, S.; Chang, K.; Na, H.; Minobe, S. An east-west contrast of upper ocean heat content variation south of the subpolar front in the East/Japan Sea. J. Geophys. Res. Ocean. 2016, 121, 6418–6443. [Google Scholar] [CrossRef]
- Rahmstorf, S.; Foster, G.; Cahill, N. Global temperature evolution: Recent trends and some pitfalls. Environ. Res. Lett. 2017, 12, 054001. [Google Scholar] [CrossRef]
- Lee, E.; Park, K. Validation of satellite sea surface temperatures and long-term trends in Korean coastal regions over past decades (1982–2018). Remote Sens. 2020, 12, 3742. [Google Scholar] [CrossRef]
- Taylor, S.J.; Letham, B. Forecasting at scale. Am. Stat. 2018, 72, 37–45. [Google Scholar] [CrossRef]
- Triebe, O.; Laptev, N.; Rajagopal, R. NeuralProphet: Explainable Forecasting at Scale. arXiv 2021, arXiv:2111.15397. [Google Scholar] [CrossRef]


| QC Flag | Mean |
|---|---|
| QC1 | Good |
| QC2 | Not evaluated, not available or unknown |
| QC3 | Questionable, suspect |
| QC4 | Bad |
| ES | SS | YS | ECS | Sum | |
|---|---|---|---|---|---|
| QC1 | 219,132 | 106,612 | 95,277 | 19,113 | 440,134 |
| QC2 | 11,559 | 3032 | 2134 | 672 | 17,397 |
| QC4 | 2 | 0 | 0 | 1 | 3 |
| Sum | 230,693 | 109,644 | 97,411 | 19,786 | 457,534 |
| ES | SS | YS | ECS | Sum | |
|---|---|---|---|---|---|
| QC1 | 212,237 | 105,128 | 94,305 | 18,596 | 430,266 |
| QC2 | 11,559 | 3032 | 2134 | 672 | 17,397 |
| QC4 | 6897 | 1484 | 972 | 518 | 9871 |
| Sum | 230,693 | 109,644 | 97,411 | 19,786 | 457,534 |
| Area | Layer | Month | |||||
|---|---|---|---|---|---|---|---|
| 2 | 4 (5) | 6 | 8 | 10 (11) | 12 | ||
| East China Sea | bottom | log-gamma | log-gamma | - | gamma | log-gamma | - |
| middle | log-gamma | log-gamma | - | log-gamma | log-gamma | - | |
| surface | log-gamma | log-gamma | - | skewed norm | log-gamma | - | |
| East Sea | bottom | log-gamma | log-gamma | log-gamma | log-gamma | log-gamma | log-gamma |
| middle | skewed norm | skewed norm | skewed norm | skewed norm | skewed norm | skewed norm | |
| surface | skewed norm | log-norm | skewed norm | student t | skewed norm | log-norm | |
| Southern Sea of Korea | bottom | skewed norm | skewed norm | skewed norm | log-gamma | log-gamma | skewed norm |
| middle | skewed norm | skewed norm | log-gamma | norm | log-norm | log-gamma | |
| surface | log-gamma | log-gamma | log-gamma | log-gamma | skewed norm | log-gamma | |
| Yellow Sea | bottom | student t | skewed norm | log-gamma | log-gamma | log-gamma | log-norm |
| middle | skewed norm | skewed norm | skewed norm | inv-gamma | skewed norm | skewed norm | |
| surface | skewed norm | skewed norm | skewed norm | skewed norm | skewed norm | log-gamma | |
| CART | Norm | RF | |
|---|---|---|---|
| # Not reject (total) | 44 (66) | 42 (66) | 43 (66) |
| Percentage (%) | 66.7 | 63.6 | 63.2 |
| Area | Classification | Trend | Long-Term Trend [1966, 2021] | ||
|---|---|---|---|---|---|
| [1966, 2000] | [2000, 2009] | [2009, 2021] | |||
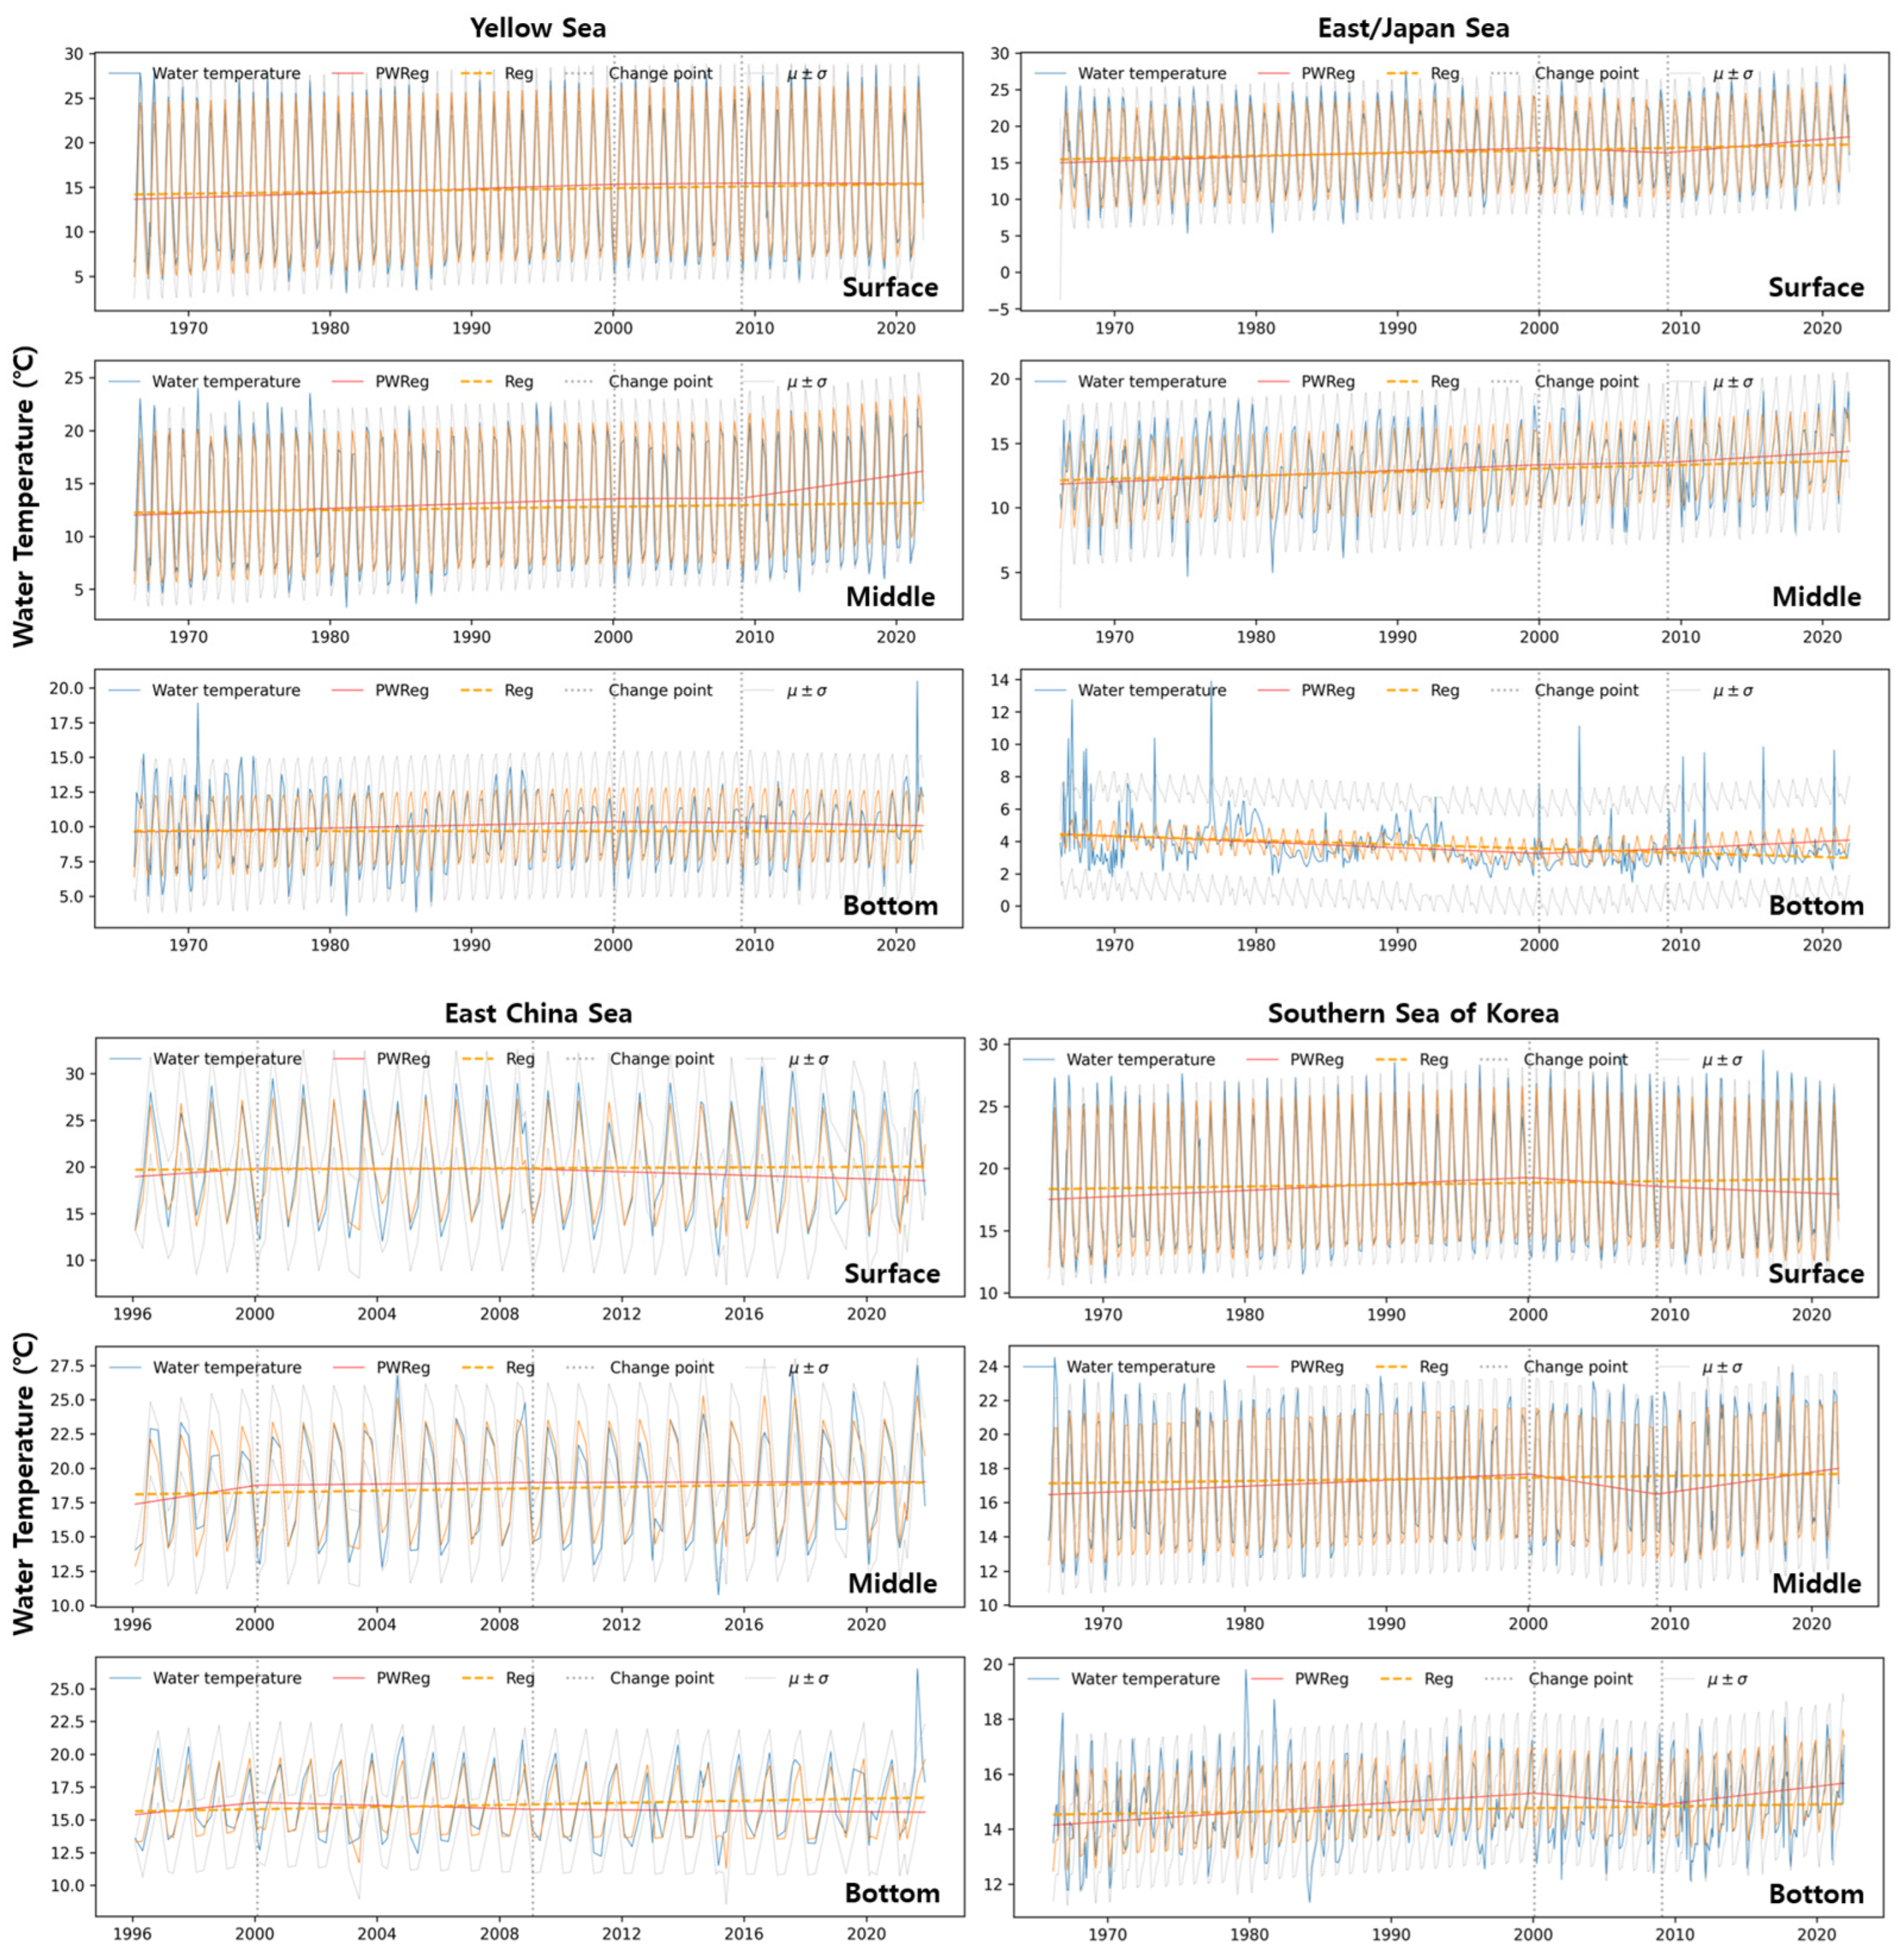
| ECS | surface | 0.226 | −0.010 | −0.096 | 0.013 |
| ECS | middle | 0.347 | 0.022 | 0.004 | 0.034 |
| ECS | bottom | 0.232 | −0.059 | −0.017 | 0.040 |
| ES | surface | 0.060 | −0.075 | 0.170 | 0.036 |
| ES | middle | 0.044 | 0.020 | 0.067 | 0.027 |
| ES | bottom | −0.036 | 0.031 | 0.043 | −0.026 |
| YS | surface | 0.049 | 0.015 | −0.003 | 0.021 |
| YS | middle | 0.046 | 0.004 | 0.200 | 0.016 |
| YS | bottom | 0.021 | −0.004 | −0.017 | 0.000 |
| SS | surface | 0.052 | −0.079 | −0.048 | 0.015 |
| SS | middle | 0.035 | −0.131 | 0.118 | 0.010 |
| SS | bottom | 0.034 | −0.048 | 0.062 | 0.007 |
Disclaimer/Publisher’s Note: The statements, opinions and data contained in all publications are solely those of the individual author(s) and contributor(s) and not of MDPI and/or the editor(s). MDPI and/or the editor(s) disclaim responsibility for any injury to people or property resulting from any ideas, methods, instructions or products referred to in the content. |
© 2025 by the authors. Licensee MDPI, Basel, Switzerland. This article is an open access article distributed under the terms and conditions of the Creative Commons Attribution (CC BY) license (https://creativecommons.org/licenses/by/4.0/).
Share and Cite
Kwak, M.-T.; Lee, K.; Ceong, H.-T.; Oh, S. Statistical Approach for the Imputation of Long-Term Seawater Data Around the Korean Peninsula from 1966 to 2021. Water 2025, 17, 1066. https://doi.org/10.3390/w17071066
Kwak M-T, Lee K, Ceong H-T, Oh S. Statistical Approach for the Imputation of Long-Term Seawater Data Around the Korean Peninsula from 1966 to 2021. Water. 2025; 17(7):1066. https://doi.org/10.3390/w17071066
Chicago/Turabian StyleKwak, Myeong-Taek, Kyunghwan Lee, Hyi-Thaek Ceong, and Seungwon Oh. 2025. "Statistical Approach for the Imputation of Long-Term Seawater Data Around the Korean Peninsula from 1966 to 2021" Water 17, no. 7: 1066. https://doi.org/10.3390/w17071066
APA StyleKwak, M.-T., Lee, K., Ceong, H.-T., & Oh, S. (2025). Statistical Approach for the Imputation of Long-Term Seawater Data Around the Korean Peninsula from 1966 to 2021. Water, 17(7), 1066. https://doi.org/10.3390/w17071066


