Article

Successional Pathways of Riparian Vegetation Following Weir Gate Operations: Insights from the Geumgang River, South Korea

1
National Forest Satellite Information & Technology Center, National Institute of Forest Science, Seoul 05203, Republic of Korea
2
Department of Biological Sciences and Bioengineering, Inha University, Incheon 22212, Republic of Korea
*
Author to whom correspondence should be addressed.
Water 2025, 17(7), 1006; https://doi.org/10.3390/w17071006
Submission received: 20 February 2025 / Revised: 25 March 2025 / Accepted: 27 March 2025 / Published: 29 March 2025
(This article belongs to the Section Ecohydrology)

Abstract

:
The construction and operation of dams or weirs has been demonstrated to induce alterations in riparian vegetation, a critical factor in evaluating and sustaining ecosystem health and resilience. A notable instance of this phenomenon is evidenced by the implementation of multifunctional large weirs along the major rivers of South Korea from 2008 to 2012. This study examined the successional changes in riparian vegetation caused by weir construction and operation using multi-year data from a combination of remote sensing, based on the spectra of satellite images, and field surveys on vegetation and geomorphology in the Geumgang River. The exposure duration of the sandbars and the colonization time of riparian vegetation were estimated using the normalized difference vegetation index (NDVI) and the normalized difference water index (NDWI) from multispectral satellite imagery. The study found that the duration of exposure and the vegetation successional ages varied according to the construction and operation of the weirs. The Geumgang River vegetation was classified into ten plant communities using the optimal partitioning and optimal silhouette algorithms. The in situ changes in the vegetation were traced, and the successional ages of the classified vegetations were determined. Based on these findings, three successional pathways could be proposed: The first pathway is characterized by a transition from pioneer herbaceous plants and then tall perennial grasses to willow trees on the exposed sandbar. The second pathway involves direct colonization by willow shrubs starting on the sandbar. The third pathway is marked by hydric succession, starting from aquatic vegetation in stagnant waters and lasting to willow trees. The observed vegetation succession was found to be contingent on the initial hydrogeomorphic characteristics of the environment, as well as the introduction of willow trees within the sandbar that was exposed by the operation of the weir. These findings emphasize the need for adaptive river management that integrates ecological and geomorphological processes. Controlled weir operations should mimic natural flow to support habitat diversity and vegetation succession, while targeted sediment management maintains sandbars. Long-term monitoring using field surveys and remote sensing is crucial for refining restoration efforts. A holistic approach considering hydrology, sediment dynamics, and vegetation succession is essential for sustainable river restoration.

1. Introduction

Rivers are dynamic systems that undergo continuous changes due to hydrological and geomorphological processes. Under monsoon climates, precipitation is often concentrated during specific seasons, leading to increased river discharge, flooding, and sediment transport [1]. These processes contribute to the formation of sandbars and gravel bars, which serve as critical habitats for riparian vegetation and wildlife. Furthermore, flood-induced sediment redistribution contributes to the transformation of the physical characteristics of river systems, thereby influencing ecological succession and habitat availability over time [2].
In riverine ecosystems, the interaction of riparian vegetation with water flow and topography gives rise to a continuous gradient of riparian environments, extending from the water to the sandbar, the riverbank, and the high floodplain area or backwater. Along this gradient, diverse vegetation develops, including lotic and lentic herb communities, as well as riverine forests [3,4]. The influence of vegetation on riverine environments is manifested through its impact on water flow, sedimentation, and topography, leading to a feedback regulatory cycle [5,6]. The alterations in environmental conditions triggered by vegetation have a cascading effect, resulting in changes in the characteristics and composition of species within the plant community and inducing succession over time [7,8].
Succession, its dynamics, and the associated processes in river ecosystems have long been a major focus of ecologists. Traditional field-based studies have provided valuable insights into localized vegetation dynamics and changes. By establishing survey plots across various habitats within the river, studies can identify typical riparian vegetation or seed banks and analyze successional pathways based on vegetation age, species composition, and environmental gradients such as hydrological, geomorphological, and soil conditions [9,10,11,12,13]. However, field-based studies are subject to significant limitations when applied to long-term, large-scale analyses due to their labor-intensive nature [14,15]. Conversely, remote sensing facilitates the monitoring of riverine vegetation and changes over extended periods through time-series satellite imagery or aerial photography [16]. This approach enables the identification of relationships between vegetation successional pathways and factors such as reflectance, various spectral indices, land cover changes, and hydrological events, which can then be mapped over time [16,17,18,19,20,21].
Although remote sensing is a useful tool for research on vegetation succession, it has some limitations. Due to the limitations of sensors used in remote sensing, previous studies have often focused on the trait-based aspects of vegetation, for example, the herb, shrub, and tree stages, making it difficult to track vegetation changes at the species or community level [22]. Within river ecosystems, even within a given trait category, plant communities can demonstrate varied relationships with microhabitats, topography, and hydrological factors [23,24,25,26]. Moreover, the presence of diverse habitats within riverine ecosystems gives rise to numerous potential successional pathways. However, the majority of studies have identified these pathways as typical single pathways [9,10,11,12]. Consequently, it is imperative to consider the full spectrum of successional pathways that account for these variations [6]. The identification of diverse plant communities and environmental conditions, which are challenging to discern through remote sensing in floodplains, can be enhanced by detailed field surveys [21,27]. The integration of these two approaches, remote sensing and field survey, can help overcome the limitations inherent to each method. However, such efforts have been limited in scope.
Since the 1960s, river improvement projects in South Korea have focused on flood control and water resource management, leading to channel straightening, embankment construction, and floodplain conversion [28,29]. The Four Major Rivers Restoration Project (2008–2012) further accelerated these modifications by constructing multifunctional weirs across major rivers, including the three weirs Baekjebo, Gongjubo, and Sejongbo on the Geumgang River [30,31]. In 2017, efforts were initiated to restore the riverine ecosystem through the operation of these weirs, resulting in varying degrees of weir gate openings at these weirs. The timing and extent of these openings differed, influencing sandbar exposure duration and subsequent vegetation succession. These variations provide an opportunity to examine multiple stages of riparian vegetation development under different hydrological conditions.
A variety of approaches have been employed to study the sandbars formed by the opening of weir gates in the Geumgang River. By tracking changes in the sandbar topography and habitat types using aerial photographs, previous studies have observed an increase in sandbar habitat diversity following weir operations [30,31,32,33]. Additionally, time-series satellite imagery analysis has confirmed the temporal continuity of these sandbars [34]. Field-based ecological studies have also been continuously conducted. Since 2010, the structure and distribution of vegetation communities in the Geumgang River system, including the weir sections, have been monitored [35,36]. Following the weir gate openings, intensive research has focused on the vegetation established on the newly exposed sandbars [37]. Thus, in the Geumgang River, these studies have provided preliminary classifications of plant communities, distribution patterns, and their relationships with environmental factors. However, these studies have primarily presented conceptual frameworks for succession rather than quantitatively analyzing successional dynamics. Therefore, to overcome these limitations, an integrated approach is necessary, and the Geumgang River provides an ideal setting for studying these dynamics. Remote sensing enables the capture of the temporal continuity of sandbar exposure following weir operations in the Geumgang River, while field surveys allow for the detailed tracking of vegetation changes. The integration of these two approaches provides a high-resolution understanding of riparian vegetation succession.
In this study, we integrate a field-based approach to examine the ecological characteristics of riparian vegetation with a remote sensing-based approach to assess temporal dynamics. By combining these methods, we aim to identify diverse successional trajectories and classify distinct succession patterns along the various riparian conditions. To achieve this, we focus on the Geumgang River in South Korea and establish the following objectives: (1) classify riparian vegetation based on its structural and ecological characteristics and analyze the transitions between vegetation types using field surveys; (2) determine the exposure timing of bare ground following weir operations and the Four Major Rivers Restoration Project via remote sensing; (3) calculate the exposure time for each vegetation type using remote sensing and field surveys; and (4) infer multiple riparian vegetation successions by integrating field-based observations of vegetation transitions with remote sensing-derived exposure time estimates.

2. Materials and Methods
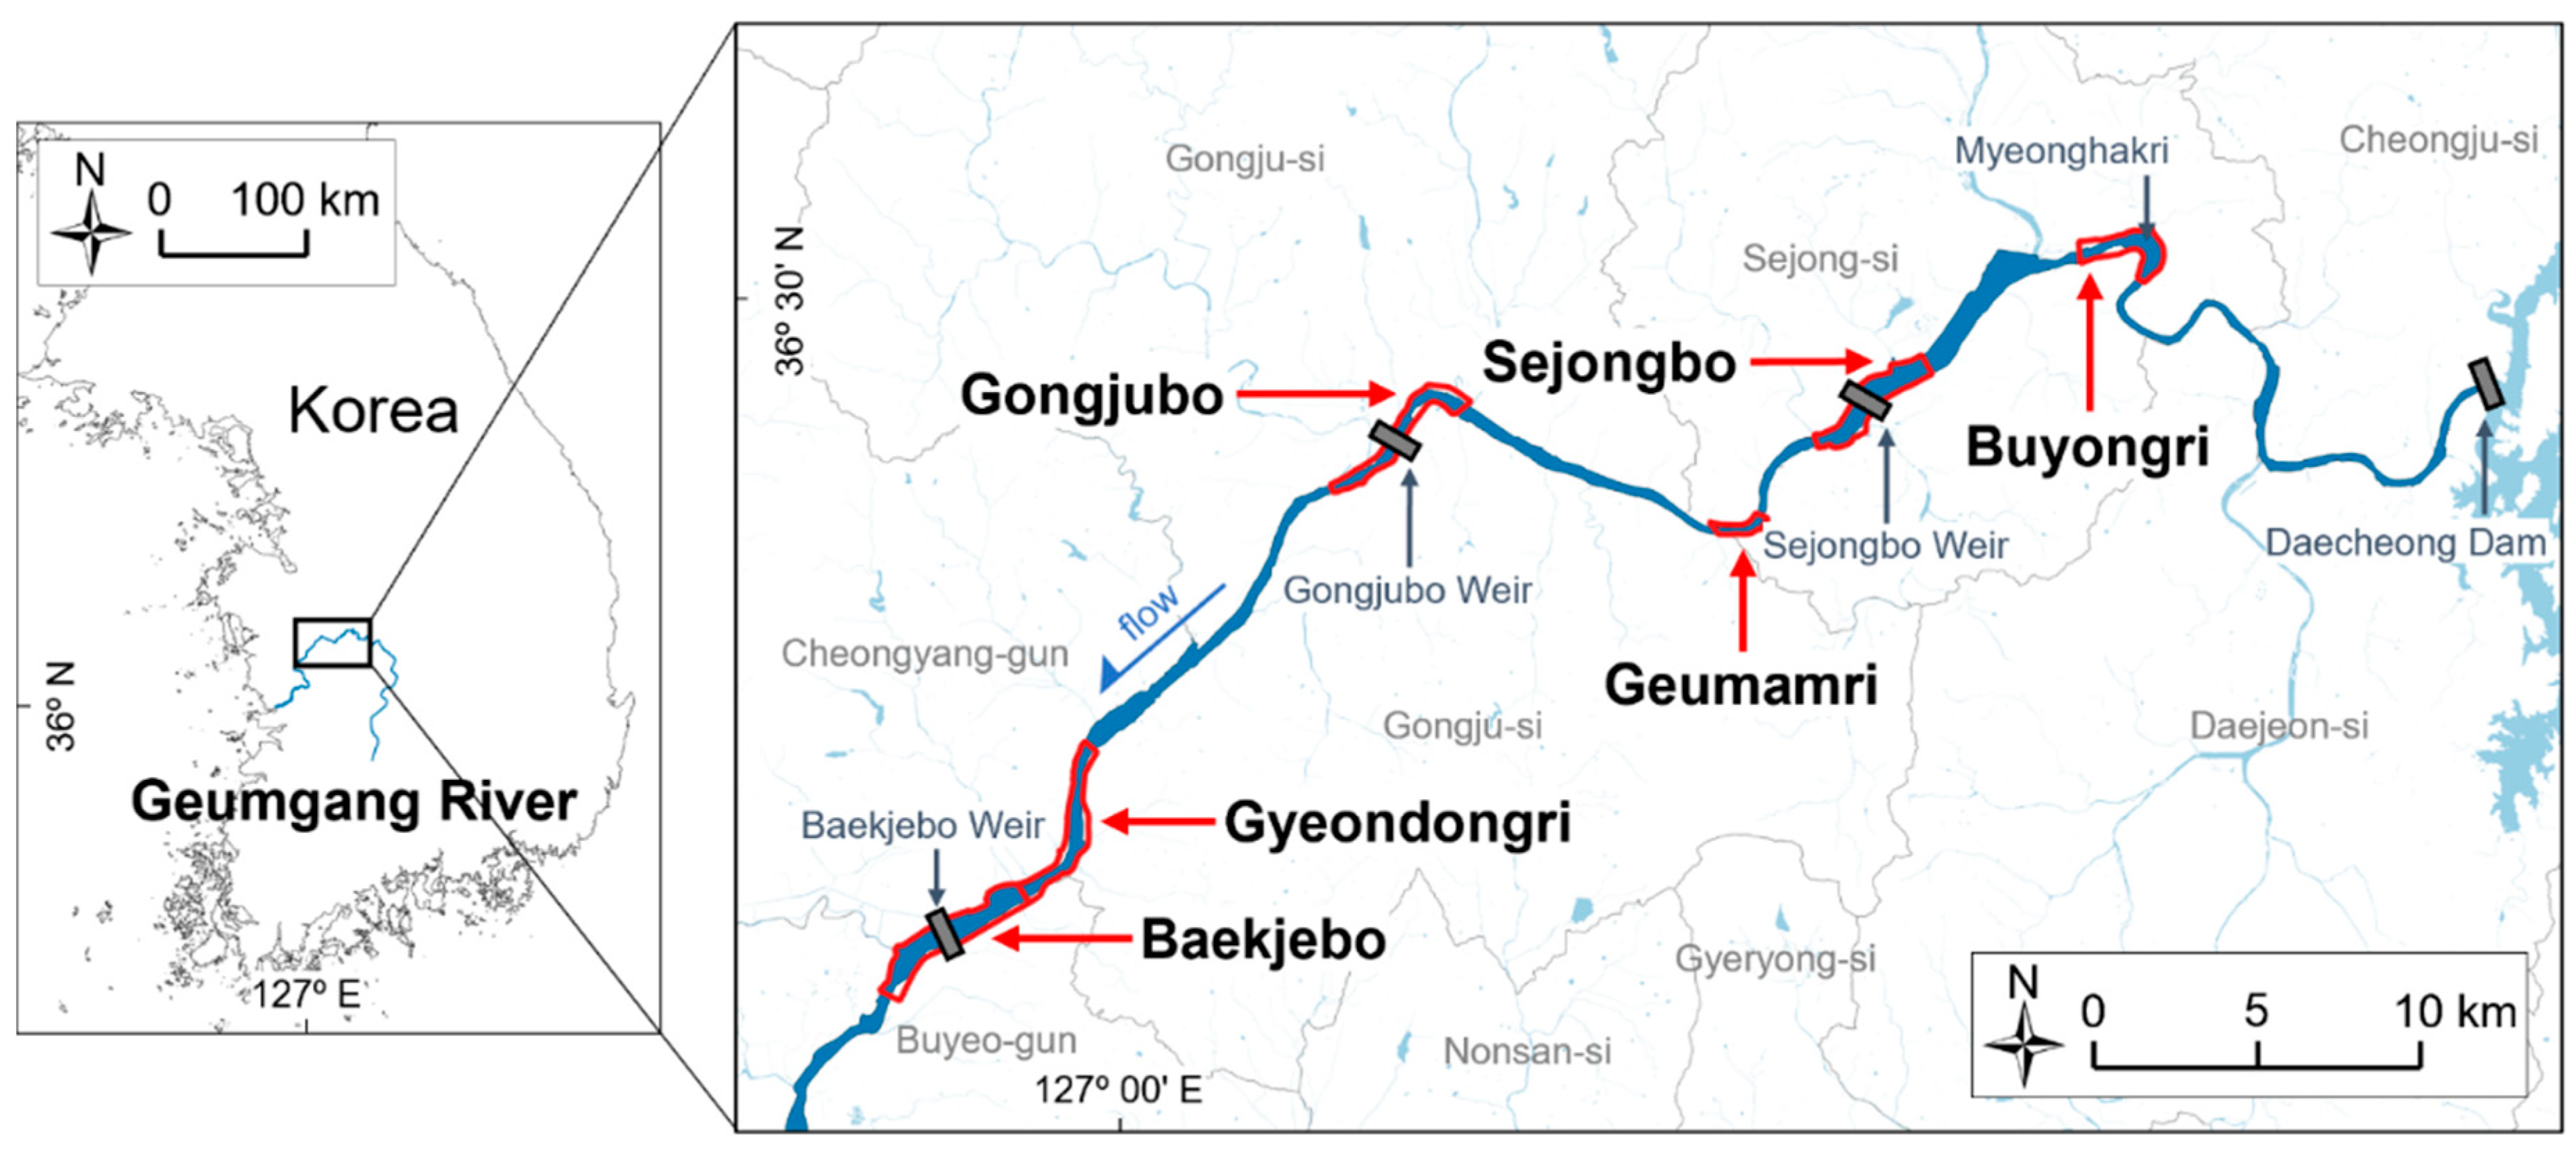
2.1. Study Site

This study was conducted on the Geumgang River, which is located in the south-central part of the Korean Peninsula (Figure 1). The Geumgang River originates at its source, subsequently deviates in a northerly direction, then turns and flows in a southwestern direction, finally entering the West Sea. The Geumgang River has a flowing length of 398 km and a watershed area of 9913 km2 [35]. At the river’s mouth, an estuary bank was constructed in 1990 to block the inflow of seawater. Furthermore, the construction of the Daecheong Dam in 1980, situated 110 km upstream from the river’s mouth, was undertaken for the purposes of flood control, water supply, and power generation. The study area is located downstream of the Daecheong Dam, which is characterized as a regulated river. The survey section exhibited a sandy riverbed, exemplifying the characteristic sandy river topography and vegetation. This section has been modified by straightening and the construction of levees. The river’s width is approximately 500 m, and the floodplain is developed to a width of about 200 m inside each levee.
The Four Major Rivers Restoration Project, which was implemented on the Geumgang River between 2008 and 2012, sought to achieve several objectives. These objectives included the creation of cultural and tourism spaces, the security of a reliable water supply, the control of floods, and the improvement of water quality. To this end, the project entailed the dredging and straightening of the low-flow channel while ensuring the maintenance of some floodplain vegetation. The construction of the three multifunctional weirs during the project resulted in substantial ecosystem alterations (Figure 1). The large weirs resulted in the submersion and subsequent disappearance of the previously observed sandbars upstream of the weirs. The first weir, Baekjebo Weir, is located 59 km upstream from the estuary bank and has a height of 7 m. The management water level for this weir was set at EL 4.2 m above sea level. The second weir, Gongjubo Weir, is situated 23 km upstream from the Baekjebo Weir and has a height of 7 m. The management water level of the Gongjubo Weir was set at EL 8.8 m. The third weir, Sejongbo Weir, is located 19 km upstream from the Gongjubo Weir and has a height of 4 m. The management water level of the Sejongbo Weir was EL 11.8 m [36].
A total of six survey sections were established for this study, encompassing areas with varying degrees of influence from weir operations on the Geumgang River (Figure 1). These sections include the immediate upstream and downstream areas of the three weirs—Baekjebo, Gongjubo, and Sejongbo—as well as three upstream sections located further from the weirs: Gyeondongri, Geumarmri, and Buyongri. The study area is characterized by varying degrees of influence from weir operations, with sections experiencing strong impacts (the Baekjebo, Gongjubo, and Sejongbo Weirs), moderate influences (Gyeondongri and Geumarmri, located between weirs), and minimal effects (Buyongri, located upstream from the most upstream weir). This spatial variation in hydrological influence underscores the diverse environmental conditions across the study sections, rendering them suitable for examining the impact of weir operations on riparian vegetation and geomorphological changes.
The specific locations and lengths of the survey sections are as follows: The Baekjebo section extends for a total of 5.5 km, encompassing both the upstream and downstream areas of the Baekjebo Weir. The Gyeondongri section commences at the point where the Baekjebo section concludes and extends 5.5 km upstream. The Gongjubo section extends 5.7 km, traversing the Gongjubo Weir. The Geumamri section commences 11.8 km upstream of the Gongjubo Weir and extends 1.6 km. The Sejongbo section encompasses 4.4 km around the Sejongbo Weir. The Buyongri section extends 4.0 km, situated upstream of the Sejongbo Weir.

2.2. Hydrological and Geomorphological Changes by the Weir Operation

The three weirs, completed in 2012, were typically closed to maintain the planned maintenance level until 2017 (Table 1). During this period, the weir gates were temporarily opened for water quality control and flood flow exclusion [38]. Since 2017, the gates have remained open to restore river ecosystems by returning the river flow to its pre-construction state [39]. The timing and magnitude of the gate operations at the three weirs differed slightly from each other (Table 1). At the Baekjebo Weir, the gates were fully opened only from July to October in 2018 and 2019 while remaining closed during the other months to maintain the water level. In May 2020, the gates were opened to EL 1.5 m. However, by October 2020, the water level was raised to EL 2.8 m. From April 2021 to March 2022, the fully open level of EL 1.5 m was maintained, after which the weir was partially closed again to maintain the water level at EL 2.8 m (Figure 2a). At the Gongjubo Weir, the gates were partially opened in June 2017, maintaining the water level at EL 4.3 m. Beginning in May 2020, the gates were fully opened, lowering the water level to EL 3.7 m. However, from 2021 onwards, the gates were intermittently closed between June and October to accommodate an upstream local festival (Figure 2b). At the Sejongbo Weir, the gates were partially opened in November 2017, maintaining the water level at EL 10.0 m. Since January 2018, the gates have been fully opened, stabilizing the water level at EL 8.4 m (Figure 2c). However, the Buyongri section, which is located upstream of the Sejong Weir, was not affected by the gate operation (Figure 2d).
In the Baekjebo section, the opening of the weir gates led to the drainage of the reservoir upstream of the weir, resulting in the exposure of sandbars along the water’s edge of the main and side channels (Figure S1a,c). Conversely, the opening of the weir gates at the Baekjebo Weir did not result in the exposure of new sandbars in the downstream section of the Baekjebo Weir. This outcome can be attributed to the maintenance of water levels in this area by the estuary dam situated at the lowest reach of the Geumgang River. In the Gyeondongri section, which is located upstream of the Baekjebo Weir, the opening of the gates at the Baekjebo Weir also exposed sandbars along the channel (see Figure S1b,d). The inundation area of the Gongjubo Weir, extending from the upstream boundary of the Gongjubo section to the downstream boundary of the Sejongbo section, underwent significant alterations in its geomorphology due to the operation of the water gates at the Gongjubo Weir. This operation resulted in the exposure of sandbars in the upstream regions of the Gongjubo and Geumamri sections located downstream of the Sejongbo section (see Figure S2). The Sejongbo section, distinguished by its steep river slope, exhibited a substantial exposure of sandbars, giving rise to the formation of intricate topographies following the opening of the Sejongbo water gate (Figure S3a,c,e). Conversely, the Buyongri section remained unaltered by the operation of the Sejongbo water gate, indicating that the impact of the weir gate on the topography was negligible and that the predominant influence was attributed to flooding (Figure S3b,d,f).

2.3. Field Survey

Field surveys of the vegetation and environment were conducted in six survey sections of the Geumgang River. Line transects were installed in locations where the terrain and vegetation exhibited characteristics indicative of the particular survey section. A total of four line transects were established in each section of the weirs, with two each upstream and downstream from the weir, and three line transects were installed in the sections located from upstream the weir (Figure S4). Plots for vegetation surveys were strategically positioned at the center of the dominant species-defined vegetation along each line transect. Areas subjected to artificial management of vegetation for leisure activities and outdoor recreation were excluded from the installation of plots. The dimensions of the plots were determined by the square of the height of each vegetation type (e.g., herbaceous: 1 m × 1 m or 2 m × 2 m; willow shrub: 5 m × 5 m or 10 m × 10 m; willow tree: 10 m × 10 m or 20 m × 20 m). This flexible quadrat sizing based on vegetation height allows for a more accurate representation of the species composition and structural characteristics, ensuring that the sampling captures the ecological variability of different vegetation types [40,41]. The following data were recorded in the plots: species occurrence, species coverage, vegetation height, and tree age. The determination of tree age was conducted by examining the annual rings of tree trunks, which were meticulously cut with a saw.
The temporal framework for the field surveys was designed to encompass changes in the vegetation and environment over time while also reflecting the operational conditions of the weir gates (Table 1). The first survey was conducted from 11 September to 19 September 2020; the second from 23 June to 28 June 2021; the third from 11 October to 17 October 2021; and the fourth from 15 September 2022 to 20 September 2022 (Figure 2). The vegetation and environment survey plots were maintained in a constant state throughout the study. New vegetation was identified along the line transect, and additional plots were installed to accommodate this change. Plots exhibiting anthropogenic disturbances, such as cutting or planting between survey periods, were excluded from the study. The total number of plots surveyed was 663. The initial survey encompassed 174 plots, the second survey included 173 plots, the third survey involved 156 plots, and the fourth survey consisted of 160 plots.

2.4. Remote Sensing

To estimate the elapsed exposure time of the sandbar and riparian vegetation, multispectral satellite imagery was collected during the construction of the weir and at the time of gate opening and closure (Table 1). Since Sentinel-2 commenced its mission in June 2015, it was not available during the construction period of the three weirs on the Geumgang River in 2011–2012. Consequently, images captured by Landsat 5 were utilized for this period. Despite the feasibility of standardizing all images to Landsat, Sentinel-2 imagery with a 10–20 m resolution was deemed more suitable than Landsat imagery with a 30 m resolution for assessing geomorphic and land cover changes at the scale of the Geumgang River.
The images employed the red and near-infrared (NIR) bands of Landsat 5 and the NIR and shortwave infrared (SWIR) bands of Sentinel-2. All bands were resampled to a 10 × 10 m resolution, and the images were subsequently utilized to calculate the normalized difference vegetation index (NDVI) and the normalized difference water index (NDWI) [42,43]. The NDVI and NDWI were subsequently binarized by identifying threshold values using Otsu’s method [44]. Recent advancements in remote sensing techniques have demonstrated the efficacy of multi-sensor fusion approaches for deriving vegetation and water indices in inland waters. These approaches enhance the robustness of time-series analysis and effectively distinguish between vegetated and non-vegetated areas, as well as water and non-water areas [26,45,46,47].
This method has been partially applied in the Geumgang River, and when compared with a habitat map derived from supervised classification using high-resolution aerial imagery, it demonstrated an accuracy of over 96% [37]. All procedures were performed using the ‘EBImage’ package [48] in R (ver. 4.3.1) [49] and QGIS (ver. 3.32.0) [50].
The map of exposure time was created through the following procedure for the binarized image (Figure 3): Original vegetation was identified in areas where the pixel values were smaller than the threshold in the NDWI binarized image when the weir was closed and larger than the threshold in the NDVI binarized image at the time of the Four Major Rivers Project. These areas remained above the water level even after the weir closure and were not damaged during the project implementation, indicating that the vegetation existed prior to the project. Secondary vegetation newly induced was identified in areas where the pixel values were smaller than the threshold in both the NDWI binarized image when the weir was closed and the NDVI binarized image at the time of the project. This category corresponds to newly vegetated areas where the habitat remained above the water level despite the weir closure but where the vegetation had been completely removed by the project. Sandbars exposed by partial opening were identified by determining the areas where the pixel values in the NDWI binarized image were larger than the threshold when the weir was closed but became smaller than the threshold when the weir was partially opened. These areas correspond to submerged habitats that were exposed following the weir’s partial opening. Sandbars exposed by full opening were identified in areas where the pixel values were larger than the threshold when the weir was closed and after partial opening but became smaller than the threshold when the weir was fully opened. This category represents habitats that were exposed above the water level only after the complete opening of the water gate. Finally, water areas were defined as areas where the pixel values remained larger than the threshold in the NDWI binarized image even after the weir was fully opened. This implies that despite the full opening of the water gate, these areas remained submerged.
An analysis of each survey plot was conducted to ascertain its classification within the exposure timing map. The elapsed exposure time was subsequently calculated. The elapsed exposure time was defined as the period from the opening start time of each weir to the survey time. The elapsed exposure time is based on September 2020, the first survey time, and the elapsed exposure time from the second to fourth surveys was calculated by adding the intervals between the survey times. The exposure timing map delineates the duration of exposure for different habitat types. Original vegetation was assigned an elapsed exposure time of 20 years based on field surveys confirming that the trees in the corresponding plots were approximately 20 years old. Secondary vegetation newly induced was set to an exposure duration of 9–10 years, reflecting the time elapsed since the implementation of the Four Major Rivers Project in each section. Sandbars exposed by partial opening were assigned an exposure duration starting from the initial partial opening of each weir, marking the point at which these areas first emerged above the water level. Sandbars exposed by full opening were designated based on the time since the full opening of each weir, representing the period when these areas were completely exposed. Finally, the water level was set to an exposure duration of zero days, as these areas remained submerged regardless of the survey period.

2.5. Statistical Analysis

Statistical analysis was performed with R (ver. 4.3.1) [49] to classify vegetation types and track their changes in the Geumgang River. The classification of vegetation structures was analyzed with the optimal partitioning algorithm (optpart) and optimal silhouette algorithm (optsil) from the package ‘optpart’ [51]. The optimal partitioning algorithm is a non-hierarchical cluster classification method that maximizes the ratio of within-cluster similarity to among-cluster similarity. This approach has been shown to outperform other classification methods, including hierarchical clustering, TWINSPAN, and k-means cluster, in terms of cluster segmentation ability and indicator species identification [52,53]. It is imperative to note that the cluster classification employed in this analysis necessitates the utilization of a distance matrix and the precise number of clusters in advance. For the distance matrix, Bray–Curtis dissimilarity was calculated using the ‘vegdist’ function in the ‘vegan’ package (ver. 2.6-4) [54], as this dissimilarity was considered to have the best classification performance [52,53]. The number of clusters was determined using silhouette widths as an indicator [55,56]. To estimate the optimal number of clusters, we initially classified 2–15 clusters using the ‘optpart’ function and optimized the cluster classification with the ‘optsil’ function of the ‘optpart’ package (ver. 4.0-5) [57]. Finally, the average silhouette widths for different cluster numbers were calculated to evaluate the clustering performance, and the highest silhouette value was observed at ten clusters, which was selected as the optimal number for classification (Figure S5).
The classified vegetation community was characterized by indicator species, species diversity, growth form, and hydrological type. The selection of indicator species was executed through the utilization of the ‘multipatt’ function of the ‘indicspecies’ package (ver. 1.7.12) [58]. The Shannon–Wiener diversity index [59] was employed to calculate species diversity, using the ‘diversity’ function of the ‘vegan’ package [54]. The growth form and hydrological type of plant species were classified according to Choung et al. (2020) [60]. Subsequently, the community representative values of growth form and hydrological type were determined by employing the ‘functcomp’ function of the ‘FD’ package (ver1.3.-13) [61], weighted by the coverage of appeared species.
A comprehensive statistical analysis was conducted to monitor vegetation changes through field surveys over a three-year period. The elapsed exposure time for each plant community was then compared. First, Bray–Curtis dissimilarity was calculated using the ‘vegdist’ function of the ‘vegan’ package [54]. Subsequently, a network graph was constructed, with each community represented as a node, employing the ‘graph’ function of the ‘igraph’ package (ver. 1.4.2), and the number of observations was documented as edges [62]. The elapsed exposure time for each community was analyzed using the ‘aov’ function and ‘TukeyHSD’ function in R and compared post hoc. The detrended correspondence analysis (DCA) was then used to determine the classification of plant communities and the relationship between plant communities and elapsed exposure time. The log-transformed vegetation cover data were analyzed with the ‘decorana’ function of the ‘vegan’ package [54]. The elapsed exposure time was then represented as a contour line using the ‘ordisurf’ function [54].

3. Results

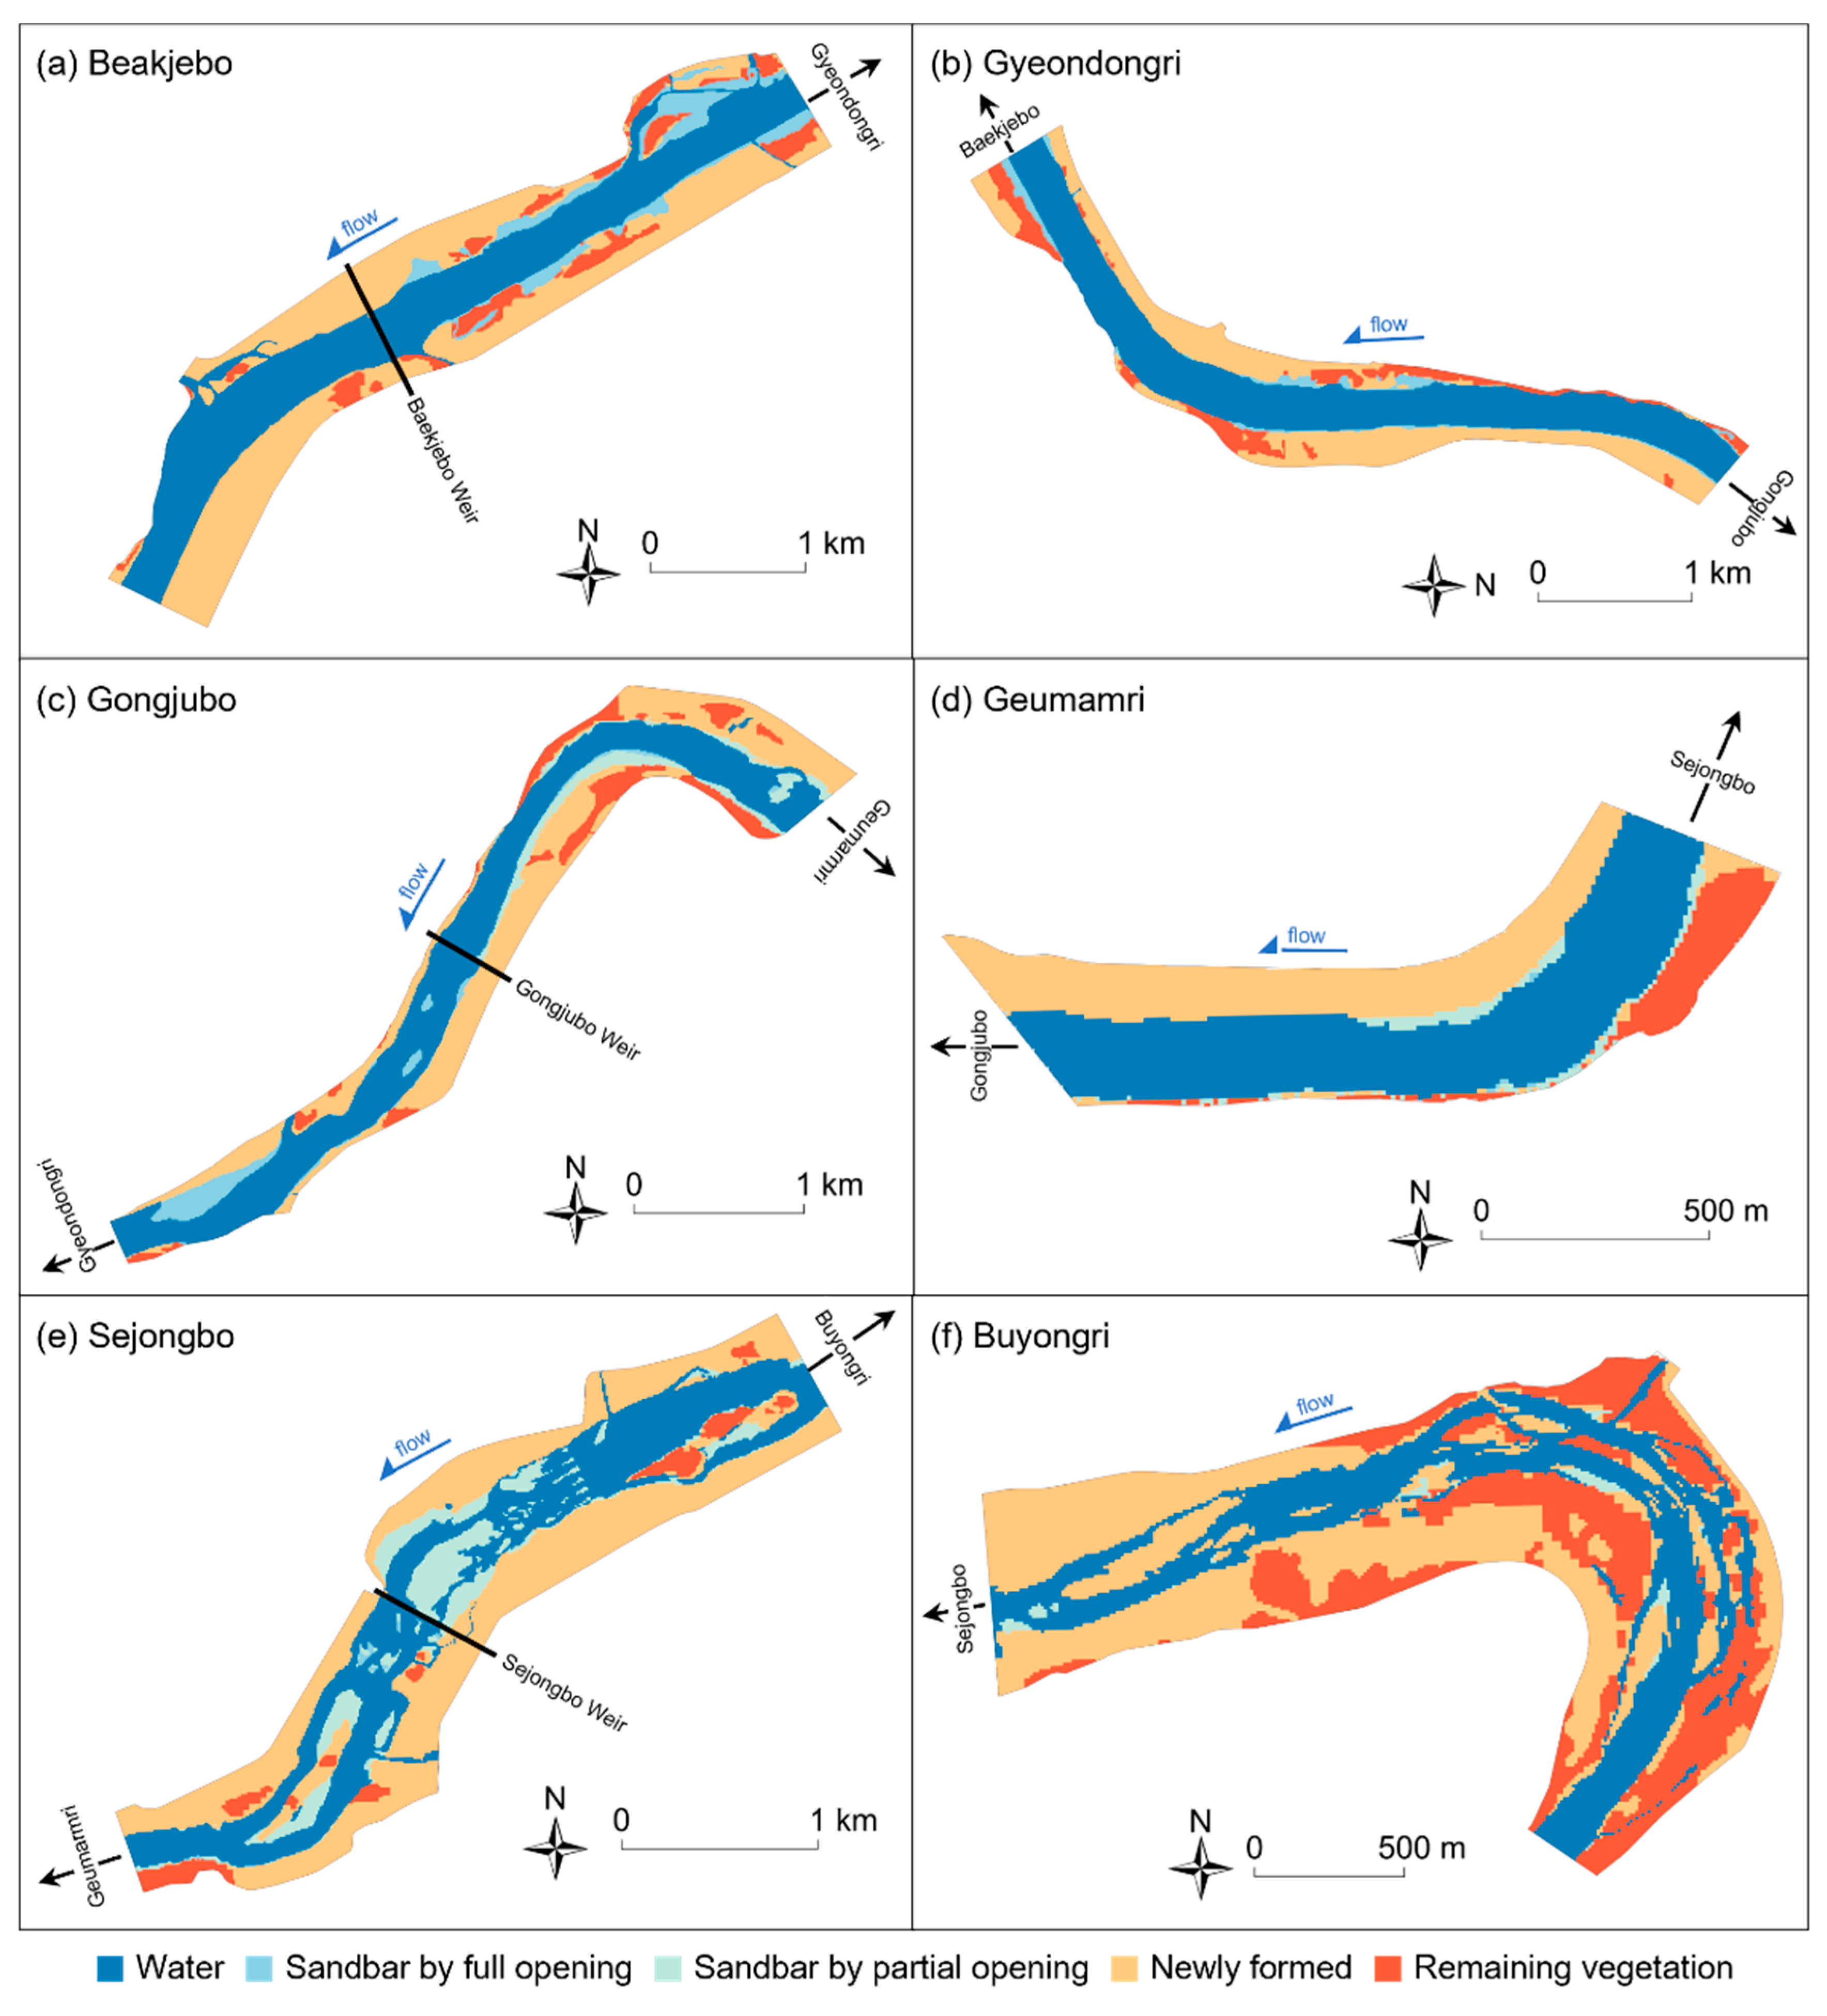
3.1. Geomorphological Changes

The study, which employed remote sensing techniques, identified substantial geomorphological alterations in the Geumgang River following weir gate operations, particularly with respect to sandbar exposure (Figure 4). A total of 592.4 ha (78%) of the original 755.8 ha of vegetation was lost due to the Four Major Rivers Project, resulting in the exposure of new floodplain areas. The subsequent opening of weir gates further influenced sediment deposition and sandbar formation, with varying degrees of exposure across different sections (Table 2). Due to the opening of the Baekjebo Weir, a total of 59.3 ha of sandbars were exposed in the upstream Baekjebo section (34.0 ha), Gyeondongri section (13.1 ha), and downstream Gongjubo section (12.0 ha), with exposure durations ranging from 0.3 to 2.3 years. A similar phenomenon was observed following the opening of the Gongjubo Weir. The partial opening of the Gongjubo Weir exposed a total of 27.8 ha of sandbars in the upstream Gongjubo section, Geumamri section, and downstream Sejongbo section, with an additional 3.3 ha exposed after the full gate opening. At the Sejongbo Weir, the initial gate opening exposed a total of 11.9 ha of sandbars in the upstream Sejongbo section and Buyongri section, with an additional 16.2 ha exposed following the full gate opening, with exposure durations ranging from 2.8 to 4.7 years. The progressive exposure of these sandbars, driven by both the destruction of previous vegetation and hydrological changes following weir operations, created new surfaces for riparian vegetation establishment. These findings highlight how weir-induced hydrological shifts influence sediment deposition patterns, shaping the foundation for subsequent vegetation succession.

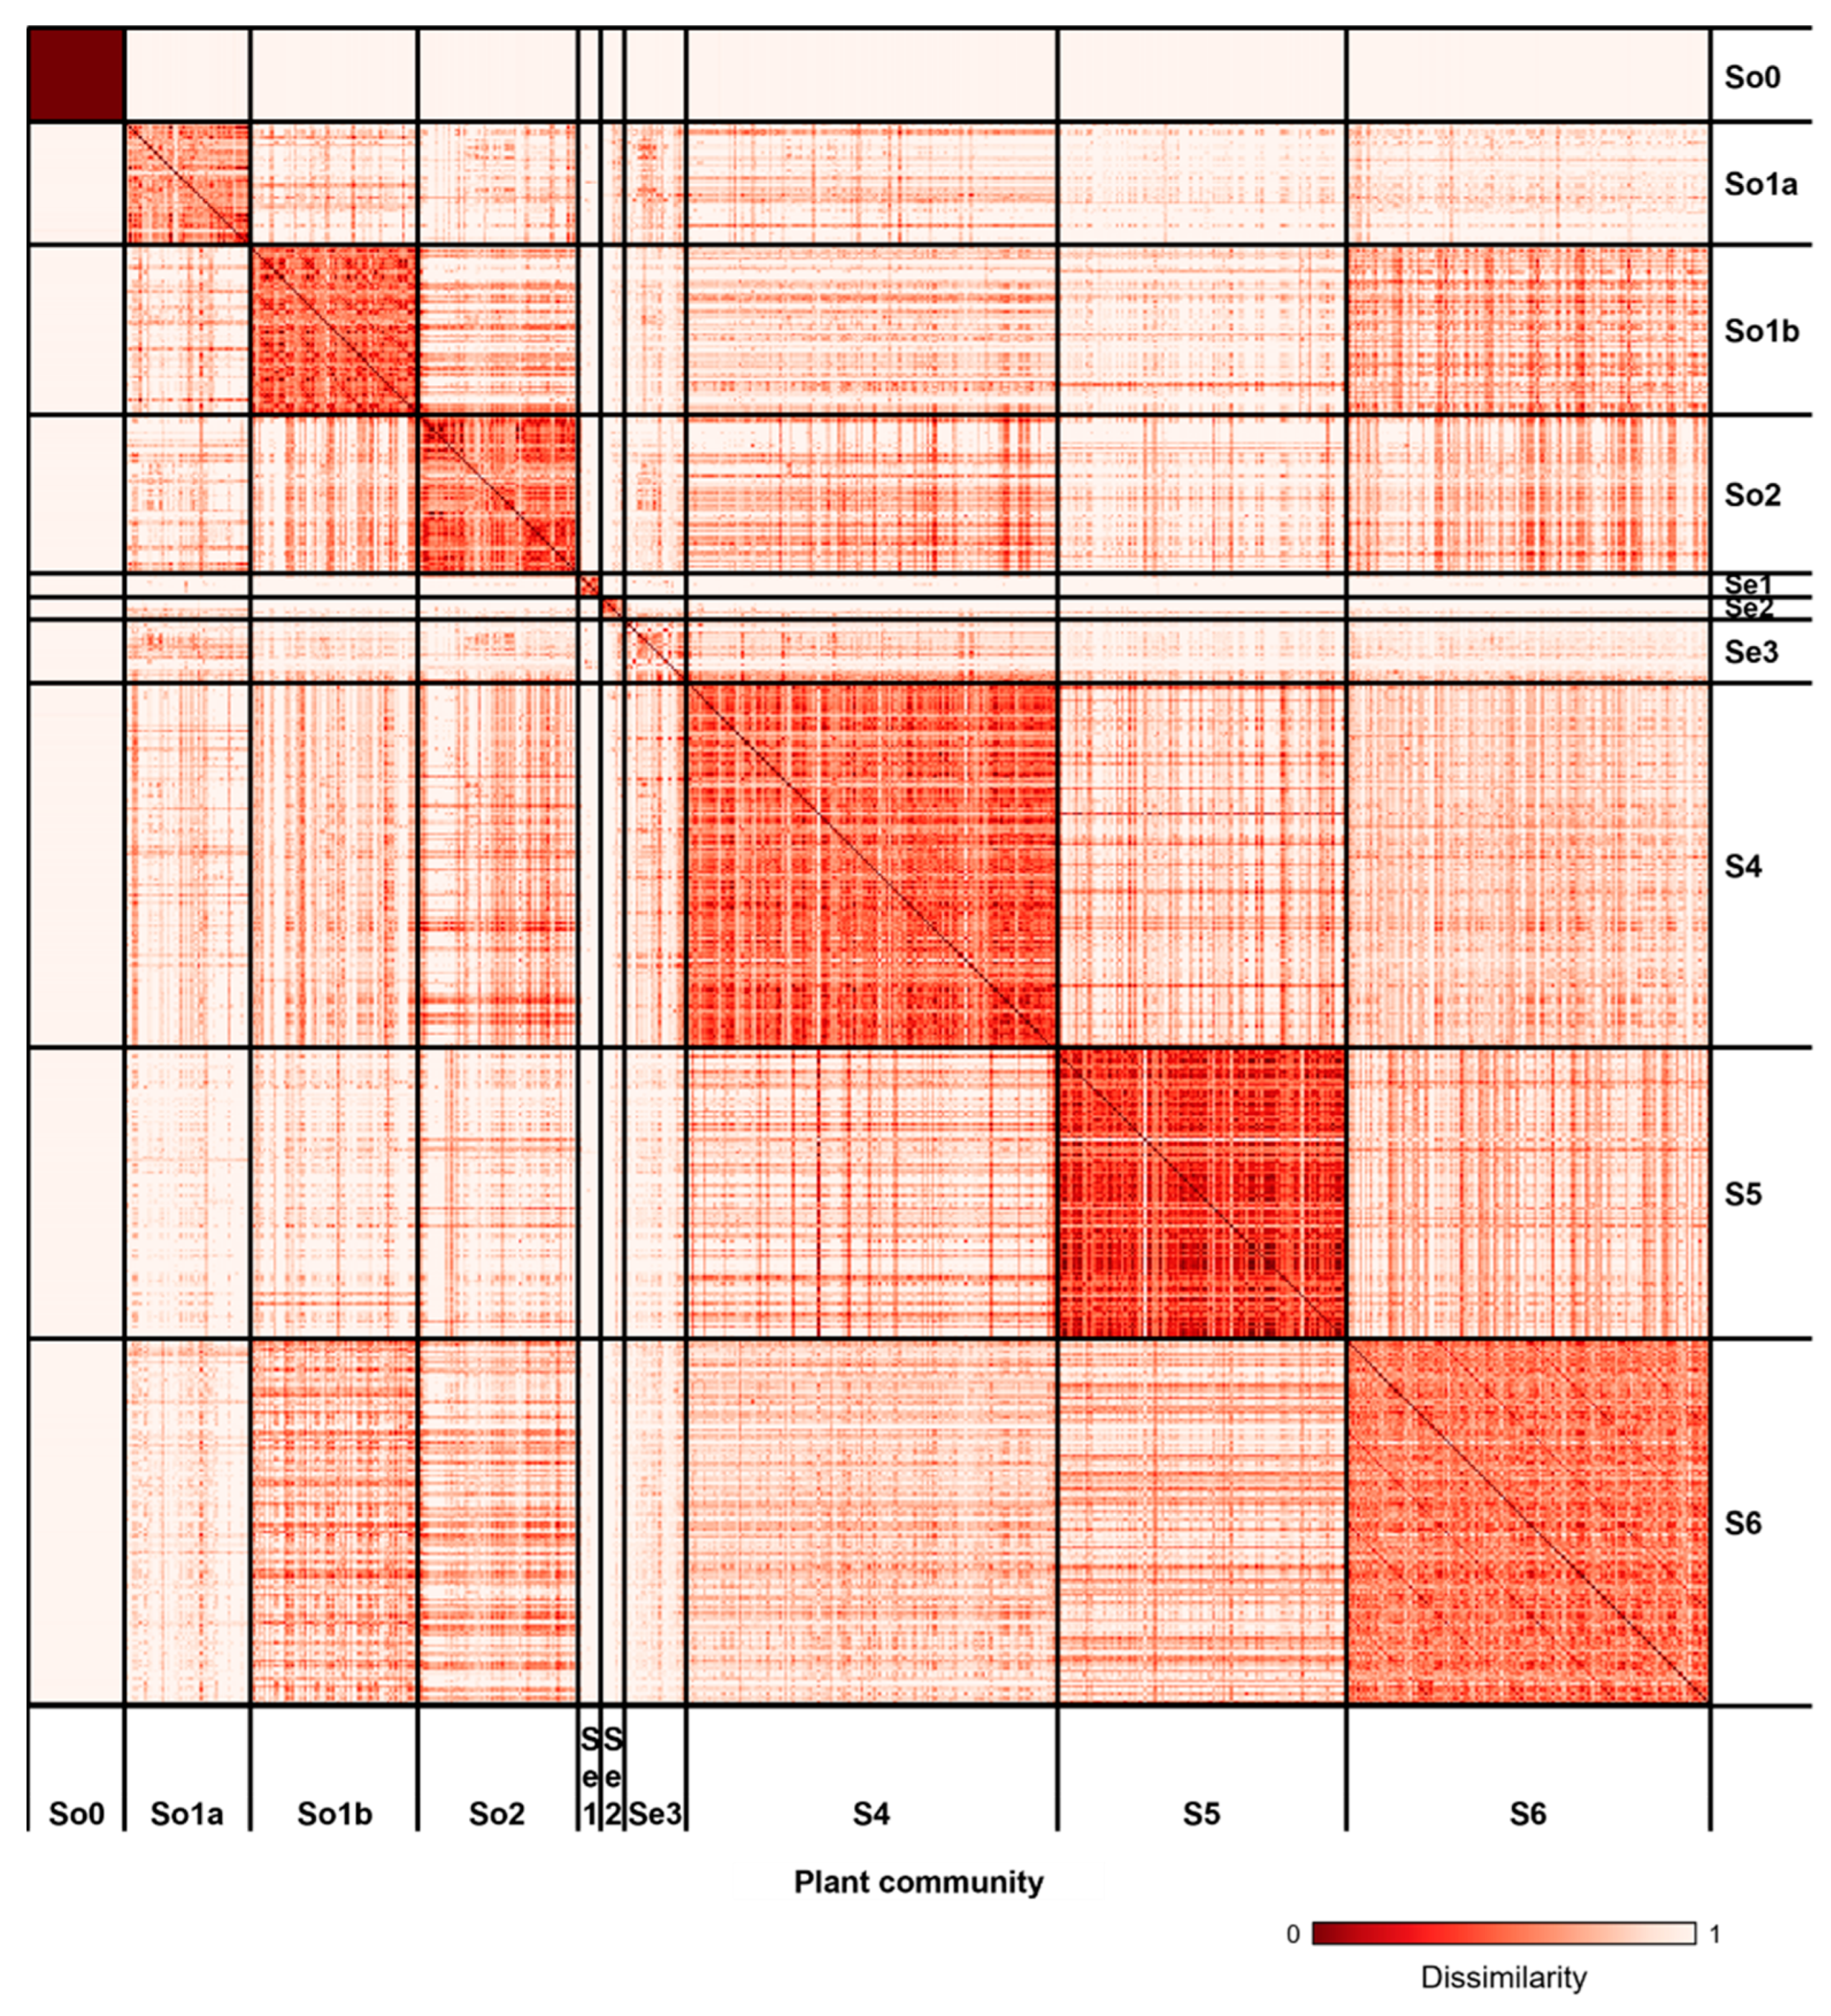
3.2. Vegetation Classification

The riparian vegetation of the Geumgang River was classified into ten distinct plant communities (Figure 5 and Figure S1). Among them, the Miscanthus sacchariflorus community (S5) was clearly distinct from the others, while the Scirpus radicans community (Se3) exhibited similarities to several other communities. Furthermore, the Salix pierotii community (S6) exhibited a close association with the Salix triandra subsp. nipponica community (So1b), suggesting a gradual transition between these vegetation types.
The ten plant communities in the Geumgang River reflect distinct habitat conditions and species compositions (Table 3, Table 4 and Table S2 and Figure S6). Newly exposed bare sandbars (So0) had no vegetation, forming after weir gate openings or flood disturbances. In these unstable environments, the annual herb Persicaria lapathifolia community (So1a) was established accompanied by other early successional species, with sparse plant cover. In contrast, the Salix triandra subsp. nipponica community (So1b) was distinguished by the presence of tree and shrub willows along with other herbs in the understory. In more stabilized floodplain areas, reed- and grass-dominated communities were observed. Phalaris arundinacea (So2) formed dense stands along shorelines, exhibiting a wide range of coverage that varied across time and space. Phragmites australis (S4) dominated semi-terrestrial zones with high water availability, while Miscanthus sacchariflorus (S5) thrived in relatively drier areas, often forming monodominant stands with over 90% coverage. Across these communities, young Salix pierotii seedlings were frequently observed in the understory, indicating potential woody succession in some areas. In aquatic and wetland environments, submerged and emergent hydrophytes were prevalent. Potamogeton crispus (Se1) covered stagnant or slow-moving waters, while Typha angustifolia (Se2) and Scirpus radicans (Se3) occupied shallow, periodically flooded areas. S. radicans communities rapidly expanded following weir gate openings, replacing previously submerged vegetation as water levels receded. Finally, tree-dominated riparian forests were represented by the Salix pierotii (S6) community. These stands supported a well-developed understory of grasses and herbs, with willows reaching an average height of 7.2 m. This community exhibited the highest species diversity among the classified vegetation types, forming structurally complex floodplain forests. This classification provides a comprehensive overview of the riparian plant communities in the Geumgang River, highlighting the distribution and ecological characteristics of each group.

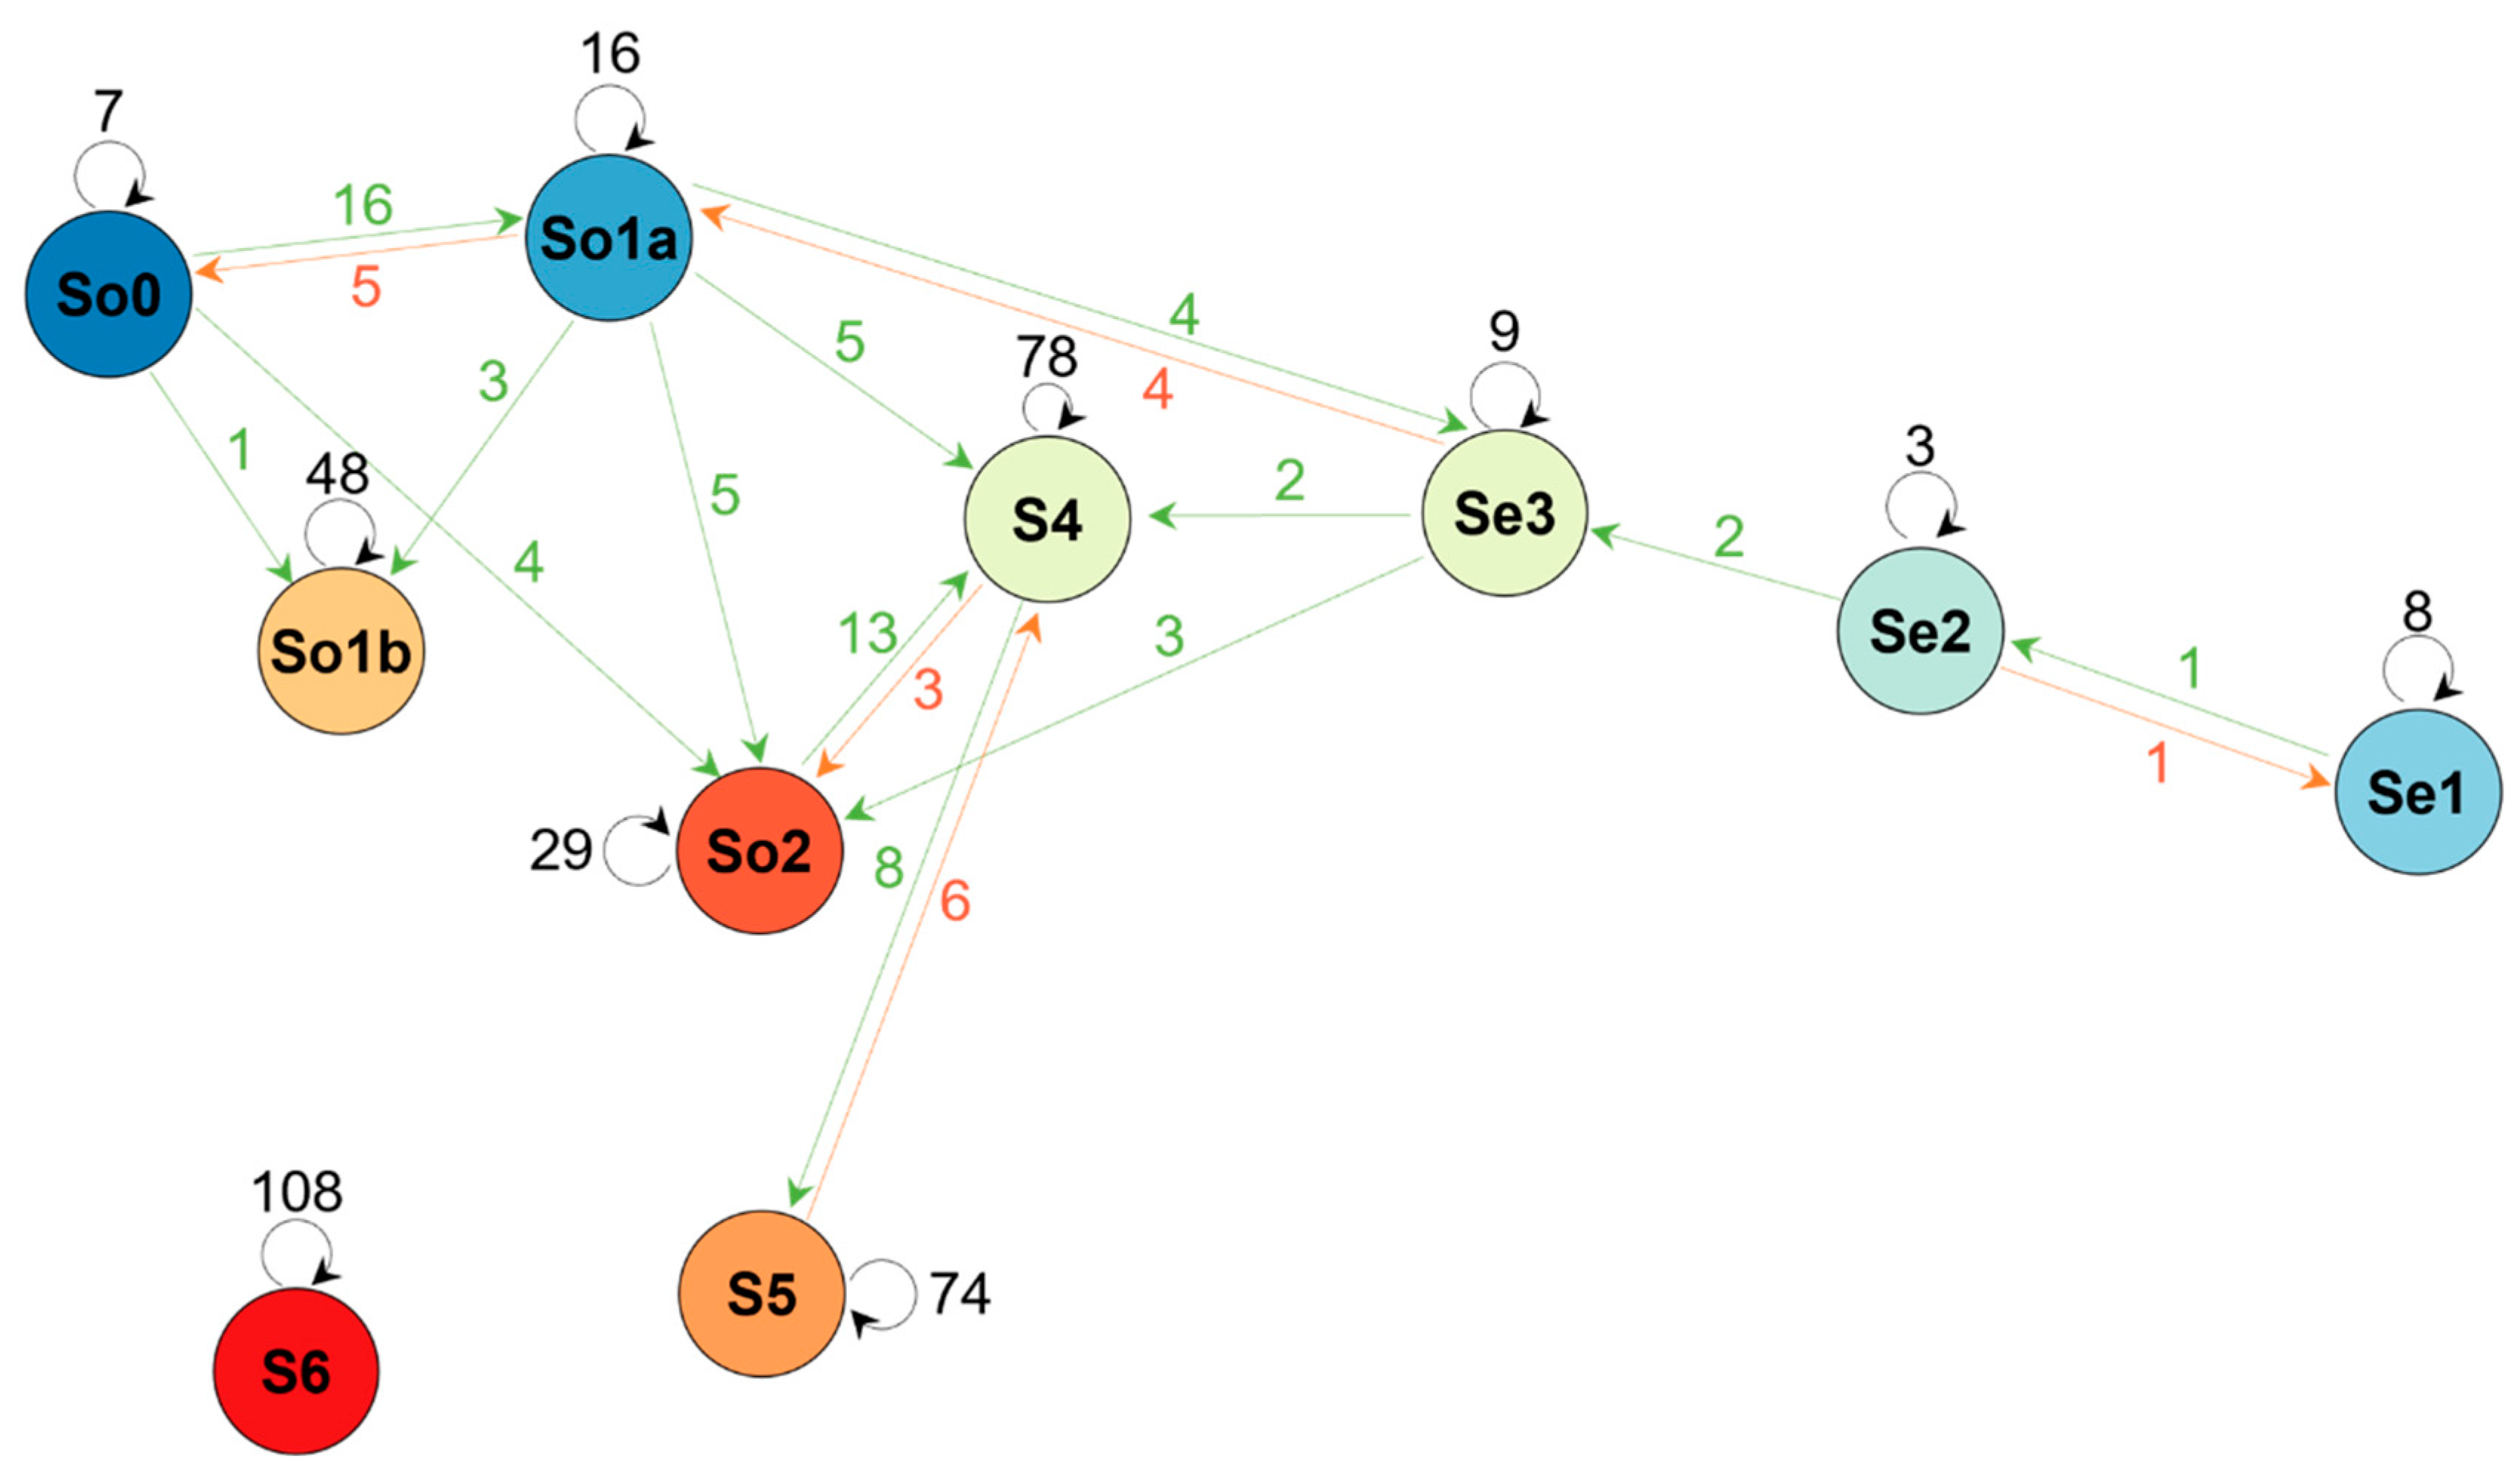
3.3. Vegetation Changes

The riparian plant communities of the Geumgang River underwent discernible changes over the course of the three-year study period (Figure 6). Early successional communities, such as So0 and So1a, exhibited dynamic shifts, with So0 transitioning primarily to So1a and occasionally to So2. So1a further changed into So2, S4, Se3, or So1b, depending on the specific habitat conditions. In hydric habitats, vegetation changes followed a geomorphological gradient, with submerged Se1 communities transitioning to shallow-water Se2 communities, which then became emergent Se3 communities as water levels receded. In mesic environments, So2, S4, and S5 communities gradually developed as the terrain became higher and drier. Meanwhile, some vegetation plots, particularly tree- and subtree-dominated communities such as So1b and S6, showed no changes, indicating stable community composition and high resistance to flood disturbances throughout the study period.
The succession patterns of plant communities could be classified according to the elapsed exposure time, which reflected their temporal progression (Figure 7). Early-stage vegetation types included So0, So1a, Se1, Se2, and Se3, which appeared shortly after exposure. Se1 remained submerged (0 years exposure time), while Se2 occurred in shallow water (0.3 years). The mean exposure times for So0 and So1a were 2.8 and 2.4 years, respectively. Intermediate and late successional types of So1b, So2, and S4/S5 had a mean exposure time in the range of 7–11 years, and the latest successional stage, S6, exhibited an average exposure time of 14.4 years.
The DCA results reflect succession patterns and habitat types in the Geumgang River, illustrating how plant communities are structured along environmental gradients (Figure 8). DCA analysis explained 78.7% of the variance in riparian vegetation distribution. Exposure time emerged as the predominant driver of plant community arrangement along the first axis, where early-stage communities (Se1, Se2, and So1a) were positioned at one end, while later successional types (S4, S5, and S6) were clustered at the opposite end. Along the first and third axes, communities with similar exposure times were further distinguished by their species composition and environmental conditions. Specifically, So1a and So1b were closely positioned, while So2, S4, and S5 formed a separate cluster. Despite the strong correlation between exposure time and plant community distribution, some variations remained unexplained, suggesting that habitat conditions and microenvironmental factors also play a role in shaping riparian vegetation.

4. Discussion

The utilization of dams and weirs in the control of fluvial flow has a long-standing history, with applications encompassing various human activities, including flood mitigation, irrigation, and hydropower generation. However, these anthropogenic structures have been demonstrated to exert considerable impacts on the natural hydrological and sediment regimes of rivers, leading to diminished flow variability, sediment trapping, and channel simplification [63,64]. Such alterations disrupt the formation and maintenance of dynamic fluvial habitats and affect the establishment and prosperity of riparian vegetation [5,65,66]. In response to these ecological impacts, efforts such as dam removal and water gate operation, including flushing, have been implemented to restore natural river dynamics and associated ecosystem functions [67,68,69]
In fluvial environments, topography, flow dynamics, and vegetation interact continuously, forming a complex system with interconnected spatial and temporal processes [70]. The operation of a weir’s water gates exerts a substantial influence on this riverine system by altering flow patterns and sediment transport, and creating diverse habitats for organisms [71,72]. In the Geumgang River, the opening of weir gates led to the exposure of extensive sandbars in the upstream impoundments, reshaping channel morphology and creating new depositional surfaces. These represent dynamic habitats across the spatial gradient, from water bodies to sandbars, riverbanks, highlands or back marshes, and levees.
Different vegetation communities become established according to continuous geomorphological and hydrological changes [3,4]. The Geumgang River study area exemplifies this complexity, with ten distinct plant communities distributed along a gradient from submerged and floating vegetation to floodplain forests. These communities reflect the diverse ecological niches observed in sandy streams of South Korea [4,73,74,75].
Although the opening of weirs has led to increased ecological diversity, the effects of flow regulation by the weirs may still persist. This regulation can result in reduced water level fluctuations and, over time, lead to a spatial dichotomy between wet and dry zones [5]. Riparian vegetation succession is often described in a one-dimensional trajectory at the functional vegetation level, typically following the transition from submerged vegetation or annual herbaceous vegetation to perennial herbaceous vegetation to woody vegetation [5,34,37,76]. However, in regulated rivers, such as those with operating weirs, this model may be overly simplistic, and successional trajectories should be expanded to reflect habitat-specific pathways.
Remote sensing-based studies have predominantly centered on land cover and this functional level of succession. The discernment of more intricate community composition or species-level transitions remains challenging due to the limitations in spectral differentiation and classification accuracy [21,77,78,79]. In contrast, field-based studies facilitate a more profound ecological understanding by analyzing vegetation at the community and species levels, offering a more detailed understanding of succession dynamics [5]. However, these studies are constrained by temporal limitations, impeding the capacity to track succession over extended periods or to accurately quantify the timing of transitions [12,80,81,82].
This study proposes a novel methodology that integrates remote sensing with field observations to overcome the limitations of previous approaches and offer a more comprehensive framework for analyzing riparian succession. The combined approach utilizes finer taxonomic scales to classify vegetation communities and quantify exposure time, thereby analyzing their relationships to refine successional pathways. Through this methodology, we propose three distinct successional pathways that account for habitat heterogeneity, hydrological variability, and vegetation traits. This approach advances beyond conventional approaches that oversimplify succession as a uniform and predictable process.
The first successional pathway can be defined as the hydric vegetation succession pathway, where bare sandbars transitioned through the sequence P. lapathifoliaP. arundinaceaP. australisM. sacchariflorusS. pierotii. This pattern, typical of floodplains, began where water flow disturbances prevented aquatic vegetation establishment. Pioneer species dominated early stages, followed by perennial grasses and reeds as sediment stabilized. Eventually, S. pierotii formed dense floodplain forests [76,83,84].
The second successional pathway can be defined as the willow succession pathway, in which some bare bars were immediately colonized by S. triandra subsp. nipponica, which later gave way to S. pierotii forests. Although subtree or tree species are typically associated with later succession stages, S. triandra subsp. nipponica was able to establish early in areas where high-flow disturbance prevented herbaceous species from taking hold. These individuals rapidly expanded and suppressed herbaceous competitors, allowing for a direct transition to S. pierotii-dominated floodplain forests [12,85,86].
The third pathway can be defined as the aquatic vegetation succession pathway, where in stagnant water bodies with minimal flow, the sequence P. crispusT. angustifoliaS. radicansP. australisM. sacchariflorusS. pierotii was observed. Submerged species dominated in deep water, while emergent vegetation like T. angustifolia expanded as water levels dropped. Over time, S. radicans replaced submerged species in exposed wetland areas, and further desiccation led to a transition toward reed- and grass-dominated communities, ultimately culminating in riparian forests [87,88,89,90].
While this study provides valuable insights into riparian vegetation succession, some methodological limitations must be acknowledged. A key limitation is the use of two satellite sensors with different spatial resolutions (30 m for Landsat 5 and 10–20 m for Sentinel-2). Although the two datasets were not directly fused, the impact of the discrepancy in resolution was mitigated by categorizing the land cover based on habitat types and periods. Landsat 5 was used for pre-weir terrestrial zones, and Sentinel-2 was used for pre-weir aquatic zones. However, the lower resolution of Landsat 5 may have failed to capture small-scale vegetation disturbances in floodplain areas. Notwithstanding this limitation, the current dataset is well integrated with field-based plot data and effectively represents successional trends. Addressing this limitation through advanced fusion techniques could enhance spatial accuracy and allow for more detailed vegetation mapping [91,92,93]. Another limitation concerns the validation of exposure time estimates. While the NDVI and NDWI classifications using Otsu’s method effectively detected vegetation presence/absence and shoreline changes, further refinement could be achieved through additional ground-based verification, the use of advanced indices, or the application of more sophisticated classification algorithms [94,95,96,97]. However, correlations between vegetation structure, estimated plant age, and exposure duration indicate that the overall trends are well represented. Additionally, the observed relationship between estimated exposure duration and field-surveyed vegetation patterns aligns with the general ecological succession sequence, providing indirect validation at the plot level. Nevertheless, at the landscape scale, some accuracy limitations remain in mapping fine-scale successional processes.

5. Conclusions

This study identified three distinct successional pathways in the riparian vegetation of the Geumgang River following sandbar exposure due to weir operations. The first pathway, hydric vegetation succession, involved an initial dominance of annual herbaceous plants (P. lapathifolia), transitioning into perennial herbaceous species (P. arundinacea and P. australis) and, ultimately, woody vegetation (S. pierotii). The second pathway, willow vegetation succession, was characterized by the direct colonization of sandbars by subtree willows (S. triandra subsp. nipponica), which later gave way to floodplain forests dominated by S. pierotii. The third pathway, aquatic vegetation succession, progressed from submerged vegetation (P. crispus) to emergent and wetland vegetation (T. angustifolia and S. radicans) before transitioning into reed and riparian forest communities. These findings underscore the significance of species- and community-level approaches in understanding riparian vegetation dynamics, offering a more detailed perspective beyond traditional, functionally based succession models. By integrating field-based ecological surveys with remote sensing data, this study demonstrates how exposure time and hydrological conditions collectively shape vegetation development, influencing successional pathways over time. This combined approach not only captures fine-scale vegetation dynamics but also provides a broader temporal perspective, offering valuable insights for riverine management and restoration efforts.

Supplementary Materials

The following supporting information can be downloaded at https://www.mdpi.com/article/10.3390/w17071006/s1: Table S1. List of multispectral satellite images used for distinguishing successional stages and mapping of riparian vegetation in the Geumgang River, South Korea. Thresholds of the normalized difference vegetation index (NDVI) or the normalized difference water index (NDWI) for binarization were calculated using Otsu’s method; Table S2. Floristic composition and landscape photograph of the riparian plant communities in the Geumgang River, South Korea; Figure S1. Satellite images of the Sentinel-2 of the Baekjebo section and the Gyeondongri section of the Geumgang River, South Korea. These images were taken before the opening and after the full opening of the weir. The image before the opening was captured on 8 March 2020, and the image after the full opening was taken on 28 November 2021; Figure S2. Satellite images of the Sentinel-2 of the Gongjubo section and the Geumamri section of the Geumgang River, South Korea. These images were taken before the opening, after the partial opening, and after the full opening of the weir. The image before the opening was taken on 3 January 2018, after the partial opening on 13 January 2019, and after the full opening on 21 February 2021; Figure S3. Satellite images of the Sentinel-2 of the Sejongbo section and the Buyongri section of the Geumgang River, South Korea. These images were taken before the opening, after the partial opening, and after the full opening of the weir. The image before the opening was taken on 30 October 2017, after the partial opening on 13 January 2018, and after the full opening on 13 January 2019; Figure S4. Aerial photographs of the surveyed sections using a drone (Phantom 4 pro, DJI, Shenzhen, China) in the Geumgang River, South Korea in September 2020. The red line is the line transect from the field survey.; Figure S5. Mean silhouette width across the specified number of clusters, thereby facilitating the determination of the optimal cluster number. The ten clusters that exhibited the maximum width were selected for further analysis; Figure S6. Heatmap displaying the main ecological characteristics of the riparian plant communities in the Geumgang River, South Korea. The quantification of values was conducted on a community-level scale, with the calculation of means being weighted according to species coverage.

Author Contributions

Conceptualization, K.-H.C. and C.L.; methodology, K.-H.C. and C.L.; software, C.L.; validation, K.-H.C. and C.L.; formal analysis, C.L.; investigation, C.L.; resources, C.L.; data curation, C.L.; writing—original draft preparation, C.L.; writing—review and editing, K.-H.C. and C.L.; visualization, K.-H.C. and C.L.; supervision, K.-H.C.; project administration, K.-H.C.; funding acquisition, K.-H.C. All authors have read and agreed to the published version of the manuscript.

Funding

This work was supported by the Korea Environmental Industry & Technology Institute (KEITI) through the Aquatic Ecosystem Conservation Research Program, funded by the Korea Ministry of Environment (MOE) (2020003050002).

Data Availability Statement

The raw data supporting the conclusions of this article will be made available by the authors on request.

Conflicts of Interest

The authors declare no conflict of interest.

References

  1. Ghosh, S.; Mistri, B. Geographic concerns on flood climate and flood hydrology in monsoon-dominated Damodar River basin, Eastern India. Geogr. J. 2015, 2015, 486740. [Google Scholar] [CrossRef]
  2. Wright, S.A.; Kaplinski, M. Flow structures and sandbar dynamics in a canyon river during a controlled flood, Colorado River, Arizona. J. Geophys. Res. 2011, 116, F01019. [Google Scholar] [CrossRef]
  3. Blom, C.W.P.M.; Bögemann, G.M.; Laan, P.; van der Sman, A.J.M.; van de Steeg, H.M.; Voesenek, L.A.C.J. Adaptations to flooding in plants from river areas. Aquat. Bot. 1990, 38, 29–47. [Google Scholar] [CrossRef]
  4. Lee, Y.K.; Kim, J.W. Riparian Vegetation of South Korea; Keimyung University Press: Daegu, Republic of Korea, 2005. [Google Scholar]
  5. Merritt, D.M.; Cooper, D.J. Riparian vegetation and channel change in response to river regulation: A comparative study of regulated and unregulated streams in the Green River Basin, USA. River Res. Appl. 2000, 16, 543–564. [Google Scholar] [CrossRef]
  6. Lee, C.; Lee, K.; Kim, H.; Baek, D.; Kim, W.; Woo, H.; Kim, D. Impacts of an extreme flood event on the riparian vegetation of a monsoonal cobble-bed stream in southern Korea: A multiscale fluvial biogeomorphic framework. River Res. Appl. 2022, 38, 1101–1114. [Google Scholar] [CrossRef]
  7. Corenblit, D.; Steiger, J.; Gurnell, A.M.; Tabacchi, E.; Roques, L. Control of sediment dynamics by vegetation as a key function driving biogeomorphic succession within fluvial corridors. J. Br. Stud. 2009, 34, 1790–1810. [Google Scholar] [CrossRef]
  8. van Andel, J.; Bakker, J.P.; Grootjans, A.P. Mechanisms of vegetation succession: A review of concepts and perspectives. Acta Bot. Neerl. 1993, 42, 413–433. [Google Scholar]
  9. Bornette, G.; Amoros, C.; Castella, C.; Beffy, C.J. Succession and fluctuation in the aquatic vegetation of two former Rhône River channels. Vegetatio 1994, 110, 171–184. [Google Scholar] [CrossRef]
  10. Gergely, A.; Hahn, I.; Mészáros-Draskovits, R.; Simon, T.; Szabó, M.; Barabás, S. Vegetation succession in a newly exposed Danube riverbed. Appl. Veg. Sci. 2001, 4, 35–40. [Google Scholar] [CrossRef]
  11. Zhao, B.; Yan, Y.; Guo, H.; He, M.; Gu, Y.; Li, B. Monitoring rapid vegetation succession in estuarine wetland using time series MODIS-based indicators: An application in the Yangtze River Delta area. Ecol. Indic. 2009, 9, 346–356. [Google Scholar] [CrossRef]
  12. Prach, K.; Petřík, P.; Brož, Z.; Song, J.S. Vegetation succession on river sediments along the Nakdong River, South Korea. Folia Geobot. 2014, 49, 507–519. [Google Scholar] [CrossRef]
  13. Bourgeois, B.; Boutin, C.; Vanasse, A.; Poulin, M. Divergence between riparian seed banks and standing vegetation increases along successional trajectories. J. Veg. Sci. 2017, 28, 787–797. [Google Scholar] [CrossRef]
  14. Williams, B.S.; D’Amico, E.; Kastens, J.H.; Thorp, J.H.; Flotemersch, J.E.; Thoms, M.C. Automated riverine landscape characterization: GIS-based tools for watershed-scale research, assessment, and management. Environ. Monit. Assess. 2013, 185, 7485–7499. [Google Scholar] [CrossRef]
  15. Sukhodolov, A.N. Field-based research in fluvial hydraulics: Potential, paradigms and challenges. J. Hydraul. Res. 2015, 53, 1–19. [Google Scholar] [CrossRef]
  16. Marcus, W.A.; Fonstad, M.A. Remote sensing of rivers: The emergence of a subdiscipline in the river sciences. Earth Surf. Process. Landf. 2010, 35, 1867–1872. [Google Scholar] [CrossRef]
  17. Mouat, D.A.; Lancaster, J. Use of remote sensing and GIS to identify vegetation change in the upper San Pedro River watershed, Arizona. Geocarto Int. 1996, 11, 55–67. [Google Scholar] [CrossRef]
  18. Temesgen, H.; Nyssen, J.; Zenebe, A.; Haregeweyn, N.; Kindu, M.; Lemenih, M.; Haile, M. Ecological succession and land use changes in a lake retreat area (Main Ethiopian Rift Valley). J. Arid Environ. 2013, 91, 53–60. [Google Scholar] [CrossRef]
  19. Han, M.; Brierley, G.; Li, B.; Li, Z.; Li, X. Impacts of flow regulation on geomorphic adjustment and riparian vegetation succession along an anabranching reach of the Upper Yellow River. Catena 2020, 190, 104561. [Google Scholar] [CrossRef]
  20. Huylenbroeck, L.; Laslier, M.; Dufour, S.; Georges, B.; Lejeune, P.; Michez, A. Using remote sensing to characterize riparian vegetation: A review of available tools and perspectives for managers. J. Environ. Manag. 2020, 267, 110652. [Google Scholar] [CrossRef]
  21. Rusnák, M.; Goga, T.; Michaleje, L.; Šulc Michalková, M.; Máčka, Z.; Bertalan, L.; Kidová, A. Remote sensing of riparian ecosystems. Remote Sens. 2022, 14, 2645. [Google Scholar] [CrossRef]
  22. Lara-Alvarez, C.; Flores, J.J.; Rodriguez-Rangel, H.; Lopez-Farias, R. A literature review on satellite image time series forecasting: Methods and applications for remote sensing. Wiley Interdiscip. Rev. Data Min. Knowl. Discov. 2024, 14, e1528. [Google Scholar] [CrossRef]
  23. Corenblit, D.; Tabacchi, E.; Steiger, J.; Gurnell, A.M. Reciprocal interactions and adjustments between fluvial landforms and vegetation dynamics in river corridors: A review of complementary approaches. Earth-Sci. Rev. 2007, 84, 56–86. [Google Scholar] [CrossRef]
  24. Camporeale, C.; Perucca, E.; Ridolfi, L.; Gurnell, A.M. Modeling the interactions between river morphodynamics and riparian vegetation. Rev. Geophys. 2013, 51, 379–414. [Google Scholar] [CrossRef]
  25. Del Tánago, M.G.; Martínez-Fernández, V.; Aguiar, F.C.; Bertoldi, W.; Dufour, S.; de Jalón, D.G.; Garófano-Gómez, V.; Mandzukovski, D.; Rodríguez-González, P.M. Improving river hydromorphological assessment through better integration of riparian vegetation: Scientific evidence and guidelines. J. Environ. Manag. 2021, 292, 112730. [Google Scholar] [CrossRef] [PubMed]
  26. Lee, K.; Lee, C.; Baek, D.; Park, G.; Shim, T.; Kim, W.; Cho, K.-H.; Kim, D. Vegetation destruction during an extreme flood: Multilevel modelling of an entire river in southern Korea. Hydrol. Process. 2023, 37, e15051. [Google Scholar] [CrossRef]
  27. Dias-Silva, K.; Vieira, T.B.; de Matos, T.P.; Juen, L.; Simião-Ferreira, J.; Hughes, R.M.; Júnior, P.D.M. Measuring stream habitat conditions: Can remote sensing substitute for field data? Sci. Total Environ. 2021, 788, 147617. [Google Scholar] [CrossRef] [PubMed]
  28. HRFCO (Hangang River Flood Control Office). Korean River Catalog; Ministry of Land Transport and Maritime Affairs: Seoul, Republic of Korea, 2014. [Google Scholar]
  29. Choi, I.C.; Shin, H.J.; Nguyen, T.T.; Tenhunen, J. Water policy reforms in South Korea: A historical review and ongoing challenges for sustainable water governance and management. Water 2017, 9, 717. [Google Scholar] [CrossRef]
  30. Kim, D.; Lee, C.; Kim, H.; Ock, G.; Cho, K.-H. Changes in landscape characteristics of stream habitats with the construction and operation of river-crossing structures in the Geum-gang River, South Korea. Ecol. Resil. Infrastruct. 2021, 8, 64–78. [Google Scholar] [CrossRef]
  31. Ock, G.; Choi, M.; Kim, J.-C.; Park, H.-G.; Han, J.H. Evaluation of habitat diversity changes by weir operation of the Sejongbo Weir in Geum River using high-resolution aerial photographs. Ecol. Resil. Infrastruct. 2020, 7, 366–373. [Google Scholar] [CrossRef]
  32. MOLTM (Ministry of Land, Transport and Maritime). Master Plan of Four Major Rivers Restoration; Ministry of Land, Transport and Maritime: Gwacheon, Republic of Korea, 2009. [Google Scholar]
  33. MOLIT (Ministry of Land, Infrastructure and Transport). Study on River Change Monitoring and Evaluation; Ministry of Land, Infrastructure and Transport: Sejong, Republic of Korea, 2016. [Google Scholar]
  34. Lee, C.; Kim, H.; Cho, K.H. Spatial distribution and successional changes of riparian vegetation on sandbars exposed after watergate-opening of weirs in the Geumgang River, South Korea. Ecol. Resil. Infrastruct. 2022, 9, 194–205. [Google Scholar] [CrossRef]
  35. MOE (Ministry of Environment). Aquatic Ecosystem Monitoring in the Weirs of Geum River; Ministry of Environment: Sejong, Republic of Korea, 2021. [Google Scholar]
  36. MOE (Ministry of Environment). Research on the Effect of Weir Construction on Freshwater Ecosystem; Ministry of Environment: Sejong, Republic of Korea, 2010. [Google Scholar]
  37. Lee, C.; Cho, K.H. Development of a method for tracking sandbar formation by weir-gate opening using multispectral satellite imagery in the Geumgang River, South Korea. Ecol. Resil. Infrastruct. 2023, 10, 135–142. [Google Scholar] [CrossRef]
  38. MOLIT (Ministry of Land, Infrastructure and Transport); MOE (Ministry of Environment); MAFRA (Ministry of Agriculture, Food and Rural Affairs). The Report on the Optimal Linkage Operation Plan Between Dam-Weir-Reservoir; Ministry of Land, Infrastructure and Transport, Ministry of Environment, Ministry of Agriculture, Food and Rural Affairs: Sejong, Republic of Korea, 2017. [Google Scholar]
  39. MOE (Ministry of Environment). Dam Operation and Monitoring Plan; Ministry of Environment: Sejong, Republic of Korea, 2022. [Google Scholar]
  40. Ellenberg, D.; Mueller-Dombois, D. Aims and Methods of Vegetation Ecology; Wiley: New York, NY, USA, 1974. [Google Scholar]
  41. Van der Maarel, E.; Franklin, J. Vegetation Ecology, 2nd ed.; Wiley-Blackwell: Hoboken, NJ, USA, 2012. [Google Scholar]
  42. Gao, B.C. NDWI—A normalized difference water index for remote sensing of vegetation liquid water from space. Remote Sens. Environ. 1996, 58, 257–266. [Google Scholar] [CrossRef]
  43. Carlson, T.N.; Ripley, D.A. On the relation between NDVI, fractional vegetation cover, and leaf area index. Remote Sens. Environ. 1997, 62, 241–252. [Google Scholar] [CrossRef]
  44. Otsu, N. A threshold selection method from gray-level histograms. IEEE Trans. Syst. Man Cybern. Syst. 1979, 9, 62–66. [Google Scholar]
  45. Piedelobo, L.; Taramelli, A.; Schiavon, E.; Valentini, E.; Molina, J.L.; Nguyen Xuan, A.; González-Aguilera, D. Assessment of green infrastructure in Riparian zones using Copernicus programme. Remote Sens. 2019, 11, 2967. [Google Scholar] [CrossRef]
  46. Valerio, F.; Godinho, S.; Ferraz, G.; Pita, R.; Gameiro, J.; Silva, B.; Marques, A.T.; Silva, J.P. Multi-temporal remote sensing of inland surface waters: A fusion of Sentinel-1 & 2 data applied to small seasonal ponds in semiarid environments. Int. J. Appl. Earth Obs. Geoinf. 2024, 135, 104283. [Google Scholar] [CrossRef]
  47. Salvoldi, M.; Siaki, G.; Sprintsin, M.; Karnieli, A. Burned area mapping using multi-temporal sentinel-2 data by applying the relative differenced aerosol-free vegetation index (RdAFRI). Remote Sens. 2020, 12, 2753. [Google Scholar] [CrossRef]
  48. Pau, G.; Fuchs, F.; Sklyar, O.; Boutros, M.; Huber, W. EBImage—An R package for image processing with applications to cellular phenotypes. J. Bioinform. 2010, 26, 979–981. [Google Scholar] [CrossRef]
  49. R Core Team. R: A Language and Environment for Statistical Computing. Available online: https://www.r-project.org (accessed on 30 June 2023).
  50. QGIS.org. QGIS Geographic Information System. Available online: http://www.qgis.org (accessed on 30 June 2023).
  51. Roberts, D.W. Vegetation classification by two new iterative reallocation optimization algorithms. Plant Ecol. 2015, 216, 741–758. [Google Scholar] [CrossRef]
  52. Aho, K.; Roberts, D.W.; Weaver, T. Using geometric and non-geometric internal evaluators to compare eight vegetation classification methods. J. Veg. Sci. 2008, 19, 549–562. [Google Scholar] [CrossRef]
  53. Pakgohar, N.; Eshaghi Rad, J.; Gholami, G.; Alijanpour, A.; Roberts, D.W. A comparative study of hard clustering algorithms for vegetation data. J. Veg. Sci. 2021, 32, e13042. [Google Scholar] [CrossRef]
  54. Oksanen, J.; Simpson, G.; Blanchet, F.; Kindt, R.; Legendre, P.; Minchin, P.R.; O’Hara, R.B.; Solymos, P.; Stevens, M.H.H.; Szoecs, E.; et al. Vegan: Community Ecology Package. Available online: https://CRAN.R-project.org/package=vegan (accessed on 15 December 2022).
  55. Hakkenberg, C.R.; Peet, R.K.; Urban, D.L.; Song, C. Modeling plant composition as community continua in a forest landscape with LiDAR and hyperspectral remote sensing. Ecol. Appl. 2018, 28, 177–190. [Google Scholar] [CrossRef] [PubMed]
  56. Lengyel, A.; Roberts, D.W.; Botta-Dukát, Z. Comparison of silhouette-based reallocation methods for vegetation classification. J. Veg. Sci. 2021, 32, e12984. [Google Scholar] [CrossRef]
  57. Roberts, D.W. Optpart: Optimal Partitioning of Similarity Relations. R Package Version 3.0-3. Available online: https://CRAN.R-project.org/package=optpart (accessed on 1 June 2023).
  58. De Cáceres, M.; Legendre, P. Associations between species and groups of sites: Indices and statistical inference. Ecology 2009, 90, 3566–3574. [Google Scholar] [CrossRef] [PubMed]
  59. Pielou, E.C. A quick method of determining the diversity of foraminiferal assemblages. J. Paleontol. 1979, 53, 1237–1242. [Google Scholar]
  60. Choung, Y.; Min, B.M.; Lee, K.S.; Cho, K.-H.; Joo, K.Y.; Hyun, J.-O.; Na, R.H.; Oh, H.K.; Nam, G.-H.; Lee, J. Categorized wetland preference and life forms of the vascular plants in the Korean Peninsula. J. Ecol. Environ. 2021, 45, 1–6. [Google Scholar] [CrossRef]
  61. Laliberté, E.; Legendre, P.A. Distance-based framework for measuring functional diversity from multiple traits. Ecology 2010, 91, 299–305. [Google Scholar] [CrossRef]
  62. Csardi, G.; Nepusz, T. igraph: Network Analysis and Visualization in R. Available online: https://zenodo.org/records/14736815 (accessed on 8 July 2023).
  63. Poff, N.L.; Allan, J.D.; Bain, M.B.; Karr, J.R.; Prestegaard, K.L.; Richter, B.D.; Sparks, R.E.; Stromberg, J.C. The natural flow regime. BioScience 1997, 47, 769–784. [Google Scholar] [CrossRef]
  64. Ligon, F.K.; Dietrich, W.E.; Trush, W.J. Downstream ecological effects of dams. BioScience 1995, 45, 183–192. [Google Scholar] [CrossRef]
  65. Nilsson, C.; Berggren, K. Alterations of riparian ecosystems caused by river regulation. BioScience 2000, 50, 783–792. [Google Scholar] [CrossRef]
  66. Yang, J.; Li, E.H.; Yang, C.; Xia, Y.; Zhou, R. Effects of south-to-north water diversion project cascade dams on riparian vegetation along the middle and lower reaches of the Hanjiang River, China. Front. Plant Sci. 2022, 13, 849010. [Google Scholar] [CrossRef] [PubMed]
  67. Bellmore, J.R.; Duda, J.J.; Craig, L.S.; Greene, S.L.; Torgersen, C.E.; Collins, M.J.; Vittum, K.M. Status and trends of dam removal research in the United States. WIREs Water 2017, 4, e1164. [Google Scholar] [CrossRef]
  68. Doyle, M.W.; Stanley, E.H.; Harbor, J.M. Stream ecosystem response to small dam removal: Lessons from the heartland. Geomorphology 2005, 71, 227–244. [Google Scholar] [CrossRef]
  69. Magilligan, F.J.; Graber, B.E.; Nislow, K.H.; Chipman, J.W.; Sneddon, C.S.; Fox, C.A. River restoration by dam removal: Enhancing connectivity at watershed scales. Elem. Sci. Anth. 2016, 4, 000108. [Google Scholar] [CrossRef]
  70. Bednarek, A.T. Undamming rivers: A review of the ecological impacts of dam removal. Environ. Manag. 2001, 27, 803–814. [Google Scholar] [CrossRef]
  71. Kim, J.W.; Lee, S.E.; Lee, J. Hwasan wetland vegetation in Gunwi, South Korea: With a phytosociological focus on alder Alnus japonica forests. Korean J. Ecol. Environ. 2017, 50, 70–78. [Google Scholar] [CrossRef]
  72. Corenblit, D.; Piégay, H.; Arrignon, F.; González-Sargas, E.; Bonis, A.; Davies, N.S.; Ebengo, D.M.; Garófano-Gómez, V.; Gurnell, A.M.; Henry, A.L.; et al. Interactions between vegetation and river morphodynamics. Part I: Research clarifications and challenges. Earth-Sci. Rev. 2024, 253, 104769. [Google Scholar] [CrossRef]
  73. Cho, H.-J. Mechanisms and Model of Early Succession of Riparian Vegetation in a Sandy Stream. Ph.D. Thesis, Inha University, Incheon, Republic of Korea, 2012. [Google Scholar]
  74. Jin, S.-N. Modeling the Distribution of Floodplain Vegetation in the Medium Sized Stream of the Central Korean Peninsula. Ph.D. Thesis, Inha University, Incheon, Republic of Korea, 2017. [Google Scholar]
  75. Lim, B.S.; Seol, J.; Kim, A.R.; An, J.H.; Lim, C.H.; Lee, C.S. Succession of the abandoned rice fields restores the riparian forest. Int. J. Environ. Res. Public Health 2022, 19, 10416. [Google Scholar] [CrossRef]
  76. Walker, L.R.; Del Moral, R. Primary Succession and Ecosystem Rehabilitation; Cambridge University Press: Cambridge, UK, 2003. [Google Scholar]
  77. Magdaleno, F.; Fernández, J.A. Hydromorphological alteration of a large Mediterranean river: Relative role of high and low flows on the evolution of riparian forests and channel morphology. River Res. Appl. 2011, 27, 374–387. [Google Scholar] [CrossRef]
  78. Sanchis-Ibor, C.; Segura-Beltrán, F.; Navarro-Gómez, A. Channel forms and vegetation adjustment to damming in a Mediterranean gravel-bed river (Serpis River, Spain). River Res. Appl. 2019, 35, 37–47. [Google Scholar] [CrossRef]
  79. Song, F.; Zhang, W.; Yuan, T.; Ji, Z.; Cao, Z.; Xu, B.; Lu, L.; Zou, S. UAV quantitative remote sensing of riparian zone vegetation for river and lake health assessment: A review. Remote Sens. 2024, 16, 3560. [Google Scholar] [CrossRef]
  80. Seok, J.E.; Lim, B.S.; Moon, J.S.; Kim, G.S.; Lee, C.S. Spatial distribution of vegetation on stream bars and the riparian zone reflects successional pattern due to fluid dynamics of river. Water 2023, 15, 1493. [Google Scholar] [CrossRef]
  81. Casado, A.; Peiry, J.L.; Campo, A.M. Geomorphic and vegetation changes in a meandering dryland river regulated by a large dam, Sauce Grande River, Argentina. Geomorphology 2016, 268, 21–34. [Google Scholar] [CrossRef]
  82. Woo, H.; Park, M.; Cho, K.-H.; Cho, H.; Chung, S. Recruitment and succession of riparian vegetation in alluvial river regulated by upstream dams—Focused on the Nakdong River downstream Andong and Imha Dams. J. Korea Water Resour. 2010, 43, 455–469. [Google Scholar] [CrossRef]
  83. Müllerová, A.; Řehounková, K.; Prach, K. Succession of aquatic and littoral vegetation in disused sandpits. Land Degrad. Dev. 2022, 33, 257–268. [Google Scholar] [CrossRef]
  84. Cho, H.J.; Jin, S.N.; Lee, H.; Marrs, R.H.; Cho, K.-H. The relationship between the soil seed bank and above-ground vegetation in a sandy floodplain, South Korea. Ecol. Resil. Infrastruct. 2018, 5, 145–155. [Google Scholar] [CrossRef]
  85. Lee, P.H.; Son, S.G.; Kim, C.S.; Oh, K.H. Population dynamics of Salix nipponica and S. koreensis during the riverbed sedimentation in the wetland of the Nam-River. J. Wet. Res. 2000, 2, 95–107. [Google Scholar]
  86. Azami, K.; Fukuyama, A.; Asaeda, T.; Takechi, Y.; Nakazawa, S.; Tanida, K. Conditions of establishment for the Salix community at lower-than-normal water levels along a dam reservoir shoreline. Landsc. Ecol. Eng. 2013, 9, 227–238. [Google Scholar] [CrossRef]
  87. Ward, J.V. An expansive perspective of riverine landscapes: Pattern and process across scales. GAIA 1997, 6, 52–60. [Google Scholar] [CrossRef]
  88. MOE (Ministry of Environment). Aquatic Ecosystem Monitoring in the Weirs of Geum River; Ministry of Environment: Sejong, Republic of Korea, 2016. [Google Scholar]
  89. Gudžinskas, Z.; Taura, L. Scirpus radicans (Cyperaceae) a newly-discovered native species in Lithuania: Population, habitats and threats. Biodivers. Data J. 2021, 9, e65674. [Google Scholar] [CrossRef]
  90. Corenblit, D.; Piégay, H.; Arrignon, F.; González-Sargas, E.; Bonis, A.; Ebengo, D.M.; Garófano-Gómez, V.; Gurnell, A.M.; Henry, A.L.; Hortobágyi, B.; et al. Interactions between vegetation and river morphodynamics. Part II: Why is a functional trait framework important? Earth-Sci. Rev. 2024, 253, 104709. [Google Scholar]
  91. Ghimire, P.; Lei, D.; Juan, N. Effect of image fusion on vegetation index quality—A comparative study from Gaofen-1, Gaofen-2, Gaofen-4, Landsat-8 OLI and MODIS Imagery. Remote Sens. 2020, 12, 1550. [Google Scholar] [CrossRef]
  92. Wang, Q.; Blackburn, G.A.; Onojeghuo, A.O.; Dash, J.; Zhou, L.; Zhang, Y.; Atkinson, P.M. Fusion of Landsat 8 OLI and Sentinel-2 MSI data. IEEE Trans. Geosci. Remote Sens. 2017, 55, 3885–3899. [Google Scholar] [CrossRef]
  93. Guan, H.; Su, Y.; Hu, T.; Chen, J.; Guo, Q. An object-based strategy for improving the accuracy of spatiotemporal satellite imagery fusion for vegetation-mapping applications. Remote Sens. 2019, 11, 2927. [Google Scholar] [CrossRef]
  94. Jovanovic, N.; Garcia, C.L.; Bugan, R.D.; Teich, I.; Rodriguez, C.M.G. Validation of remotely-sensed evapotranspiration and NDWI using ground measurements at Riverlands, South Africa. Water SA 2014, 40, 211–220. [Google Scholar] [CrossRef]
  95. Wen, J.; Wu, X.; You, D.; Ma, X.; Ma, D.; Wang, J.; Xiao, Q. The main inherent uncertainty sources in trend estimation based on satellite remote sensing data. Theor. Appl. Climatol. 2023, 151, 915–934. [Google Scholar] [CrossRef]
  96. Ashok, A.; Rani, H.P.; Jayakumar, K.V. Monitoring of dynamic wetland changes using NDVI and NDWI based Landsat imagery. Remote Sens. Appl. Soc. Environ. 2021, 23, 100547. [Google Scholar] [CrossRef]
  97. Lee, J.; Lim, J.; Lee, J.; Park, J.; Won, M. Ground-based NDVI network: Early validation practice with Sentinel-2 in South Korea. Sensors 2024, 24, 1892. [Google Scholar] [CrossRef]
Figure 1. Map showing the study site in the Geumgang River, South Korea. Red lines denote the boundaries of each study section, with the respective names of these sections indicated near the red arrows. Gray arrows indicate the locations of water level observation stations.
Water 17 01006 g001
Figure 2. Temporal variation in water levels from 2017 to 2022 at the water level observation stations of the Geumgang River in South Korea. The locations of these stations are indicated by the gray arrows in Figure 1: (a) water level station at the Baekjebo Weir; (b) water level station at the Gongjubo Weir; (c) water level station at the Sejongbo Weir; (d) reference water level station at the Myeonghakri, upstream of Sejongbo.
Water 17 01006 g002
Figure 3. Flowchart for the methodology for distinguishing the timing of exposure of the sandbar and the timing of vegetation formation using multispectral satellite images. The periods indicated on the successional stages are based on the initial survey time (NDWI = normalized difference water index; NDVI = normalized difference vegetation index). For a comprehensive list of satellite images utilized in this study, refer to Table S1.
Water 17 01006 g003
Figure 4. Map showing the distribution of sandbars with different exposure times and vegetation with different formation times in the study sections of the Geumgang River, South Korea.
Water 17 01006 g004
Figure 5. Heatmap of pairwise Bray–Curtis dissimilarity among 663 riparian vegetation plots situated along the Geumgang River in South Korea. Each row and column of the graph corresponds to a distinct plot, with the color intensity of each plot denoting its species composition differences. Darker shades in the graph indicate lower dissimilarity, or higher similarity, between the species composition of the respective plots. The identification of communities within the graph was achieved through the optimal partitioning of similarity relationships. The reordering of plots within the heatmap was based on clustering results, thereby facilitating the visualization of within-cluster similarity and between-cluster dissimilarity.
Water 17 01006 g005
Figure 6. Network graph illustrating the changes in vegetation from 2020 to 2022 in the riparian plant communities of the Geumgang River, South Korea. The positions of the nodes are determined based on Bray–Curtis dissimilarity. The graph displays only the edges with observed changes between the 2020 and 2022 survey periods, and the numerals on the arrows represent the count of those changes. A green numeral indicates a progressive pathway, a red numeral indicates a retrogressive pathway, and a black numeral indicates a stagnant pathway. For a list of abbreviations, refer to Table 3.
Water 17 01006 g006
Figure 7. Box plot showing the elapsed exposure time for the riparian plant community in the Geumgang River, South Korea. Different letters above bars indicate significant differences between communities according to Tukey’s honestly significant difference at α = 0.05.
Water 17 01006 g007
Figure 8. Biplots using two axes each for the three dimensions of detrended correspondence analysis of vegetation coverage in the Geumgang River, South Korea. All ellipses were delineated within the 95% confidence intervals. (a) Plant community (So0 = bare bar, So1a = Persicaria lapathifolia community, So1b = Salix triandra subsp. nipponica community, So2 = Phalaris arundinacea community, Se1 = Potamogeton crispus community, Se2 = Typha angustifolia community, Se3 = Scirpus radicans community, S4 = Phragmites australis community, S5 = Miscanthus sacchariflorus community, and S6 = Salix pierotii community), (b) species (for abbreviations, refer to Table 3), and (c) elapsed exposure time.
Water 17 01006 g008
Table 1. Timeline of construction completion and water gate operation of weirs and satellite image acquisition and field surveys for studying riparian vegetation succession in the Geumgang River, South Korea.
EventYear
201020112012...201720182019202020212022
Weir construction
Water gate operation
Baekjebo Weir
Gongjubo Weir
Sejongbo Weir
Satellite image
Baekjebo Weir
Gongjubo Weir
Sejongbo Weir
Field survey
Note(s): ◀: construction completion of the weirs; ◐: partial opening of water gate; ○: full opening of water gate; ★: satellite image acquisition or field survey.
Table 2. Changes in vegetated land due to the Four Major Rivers Project and sandbar formation resulting from weir water gate operations in the study sections of the Geumgang River, South Korea. The numerals in parentheses denote percentages.
SectionArea (ha)
Newly Exposed SandbarPre-Existing VegetationTotal
By Full OpeningBy Partial OpeningNewly FormedRemaining
Baekjebo34.0
(14%)
-171.4
(71%)
35.1
(15%)
240.5
(100%)
  Upstream34.0
(22%)
-91.7
(59%)
29.7
(19%)
155.4
(100%)
  Downstream0
(0%)
-79.7
(94%)
5.4
(6%)
85.1
(100%)
Gyeondongri13.3
(10%)
-88.4
(67%)
29.4
(23%)
131.1
(100%)
Gongjubo13.8
(10%)
15.5
(11%)
86.9
(61%)
25.0
(18%)
141.2
(100%)
  Upstream1.8
(2%)
15.5
(17%)
51.5
(57%)
21.5
(24%)
90.3
(100%)
  Downstream12.0
(23%)
0
(0%)
35.4
(70%)
3.5
(7%)
50.9
(100%)
Geumarmri0.1
(0%)
2.2
(8%)
18.6
(72%)
5.2
(20%)
26.1
(100%)
Sejongbo15.8
(8%)
36.3
(19%)
141.4
(72%)
14.6
(8%)
193.7
(100%)
  Upstream14.4
(13%)
11.8
(10%)
81.7
(73%)
6.6
(6%)
114.5
(100%)
  Downstream1.4
(2%)
10.1
(13%)
59.7
(75%)
8.0
(10%)
79.2
(100%)
Buyongri1.8
(2%)
0.9
(1%)
85.8
(60%)
54.0
(37%)
142.5
(100%)
Table 3. Indicator species of riparian plant communities in the Geumgang River, South Korea. The classification of the communities was determined through the optimization of similarity relationships, a process that was subsequently refined by maximizing the silhouette widths. The indicator value serves as a quantitative metric for assessing the strength of the association between a species and a particular community.
CommunityIndicator Species
NameAbb.Scientific NameAbb.Indicator Valuep
Bare barSo0----
Persicaria lapathifoliaSo1aPersicaria lapathifoliaPl0.860<0.001
Chenopodium albumCb0.3520.014
Salix triandra subsp. nipponicaSo1bSalix triandra subsp. nipponicaSt0.933<0.001
Phalaris arundinaceaSo2Phalaris arundinaceaPh0.719<0.001
Potamogeton crispusSe1Potamogeton crispusPc1.000<0.001
Spirodela polyrhizaSo0.691<0.001
Myriophyllum spicatumMy0.663<0.001
Trapa japonicaTj0.662<0.001
Hydrilla verticillataHv0.3020.030
Ceratophyllum demersumCr0.2980.030
Hemistepta lyrataHl0.2910.037
Nymphoides peltataNp0.2790.031
Typha angustifoliaSe2Typha angustifoliaTa0.999<0.001
Cyperus amuricusCa0.3340.021
Lindernia crustaceaLi0.3330.015
Lindernia micranthaLm0.3330.014
Zizania latifoliaZl0.3310.009
Actinostemma lobatumAl0.3060.017
Carex leiorhynchaCl0.3030.023
Juncus decipiensJd0.2930.026
Lindernia procumbensLp0.2650.041
Scirpus radicansSe3Scirpus radicansSr0.714<0.001
Leersia japonicaLr0.435<0.001
Paspalum distichumPi0.3490.012
Panicum dichotomiflorumPd0.2810.026
Phragmites australisS4Phragmites australisPa0.797<0.001
Humulus japonicusHj0.4080.026
Miscanthus sacchariflorusS5Miscanthus sacchariflorusMs0.901<0.001
Salix pierotiiS6Salix pierotiiSp0.945<0.001
Salix chaenomeloidesSc0.485<0.001
Achyranthes bidentata var. japonicaAb0.3490.016
Glycine sojaGs0.3250.022
Sicyos angulatusSg0.3190.041
Table 4. Ecological characteristics and community structure of the riparian plant communities in the Geumgang River, South Korea. The Shannon–Wiener diversity index was employed to calculate species diversity. For a list of abbreviations, refer to Table 3. For a comprehensive analysis of the dominance of each growth form and hydrological type in the community, refer to Figure S6.
CommunityProperties of Dominant SpeciesNo. of
Species
DiversityHeight
(m)
Coverage
(%)
Tree Age
(Years)
n
Growth FormHydrological Type
So0-------37
So1aAnnual herbHygrophyte4.0 ± 2.21.17 ± 0.700.4 ± 0.251 ± 330.1 ± 0.350
So1bPerennial subtreeHygrophyte3.9 ± 2.81.04 ± 0.673.8 ± 2.293 ± 135.1 ± 4.068
So2Perennial herbHygrophyte2.7 ± 2.30.66 ± 0.710.8 ± 0.665 ± 300.3 ± 0.860
Se1Perennial herbSubmergent3.0 ± 1.40.99 ± 0.450.4 ± 0.159 ± 29-11
Se2Perennial herbEmergent3.1 ± 1.40.96 ± 0.491.4 ± 0.554 ± 18-8
Se3Perennial herbEmergent3.5 ± 1.80.97 ± 0.590.4 ± 0.280 ± 21-26
S4Perennial herbEmergent3.3 ± 1.80.96 ± 0.521.4 ± 0.683 ± 250.1 ± 0.6145
S5Perennial herbHygrophyte3.2 ± 1.60.90 ± 0.501.6 ± 0.496 ± 100.5 ± 1.6114
S6Perennial treeHygrophyte7.2 ± 3.71.75 ± 0.527.2 ± 3.398 ± 0712.6 ± 5.3144
Disclaimer/Publisher’s Note: The statements, opinions and data contained in all publications are solely those of the individual author(s) and contributor(s) and not of MDPI and/or the editor(s). MDPI and/or the editor(s) disclaim responsibility for any injury to people or property resulting from any ideas, methods, instructions or products referred to in the content.

