Article

Response Strategies to Socio-Economic Drought: An Evaluation of Drought Resistance Capacity from a Reservoir Operation Perspective

1
Department of Resources and Environmental Engineering, Sichuan Water Conservancy Vocational College, Chengdu 611231, China
2
Chengdu Society of Environmental Sciences, Chengdu 610000, China
3
School of Water Conservancy and Hydroelectric Power, Hebei University of Engineering, Handan 056038, China
*
Author to whom correspondence should be addressed.
Water 2025, 17(7), 1002; https://doi.org/10.3390/w17071002
Submission received: 14 January 2025 / Revised: 25 March 2025 / Accepted: 27 March 2025 / Published: 28 March 2025
(This article belongs to the Section Water and Climate Change)

Abstract

:
Inadequate water supply during droughts, leading to socio-economic drought, has become a global issue. In this context, the drought resistance and disaster mitigation capabilities of reservoirs play a crucial role during drought events. Taking the downstream Yellow River Basin (DYRB) as the study area, this research analyzes the evolution and characteristics of socio-economic drought in the region from 1956 to 2016 at different time scales (3 months, 6 months, 9 months, and 12 months). The copula function is used to calculate the joint recurrence period of socio-economic drought in the downstream area. In addition, this study constructs a reservoir optimization operation model to explore the drought resistance capabilities of water supply strategies in response to downstream socio-economic droughts. The results show that the indices across the four time scales indicate that the DYRB faced the most severe socio-economic drought from the 1990s to the early 21st century, with long durations and widespread impacts. Compared with conventional scheduling methods, water supply restriction strategies can cope with more severe socio-economic droughts. However, the maximum drought resistance capacity corresponding to its recurrence period still cannot cope with the socio-economic droughts of the early 21st century. Therefore, the implementation of basin-wide unified water planning is of great importance to improve drought resistance capacity.

1. Introduction

In the context of drought management, achieving an equilibrium between water supply and demand is imperative for ensuring the stable socio-economic development of a region. The concept of socio-economic drought encompasses not only the scarcity of water resulting from diminished precipitation but also the question of whether the water supply can adequately meet the demands of various sectors and the economic ramifications thereof [1,2] (Wilhite and Glantz, 1985; Zseleczky and Yosef, 2014). Statistical data from the Yellow River Conservancy Commission reveal that the frequency of basin-wide drought events has increased by 35% since 2000 compared to the 20th century, with the downstream region experiencing 12 extreme drought episodes between 2001 and 2020. In the DYRB, prolonged drought conditions have caused agricultural production reductions exceeding 20% in drought years (2014–2016), directly affecting over 50 million residents’ water supply. The accelerated development of industrialization and urbanization has resulted in numerous regions encountering substantial challenges in meeting water demands during drought periods, thereby underscoring the critical nature of socio-economic drought as a global concern [3,4]. For instance, Al-Faraj et al [5]. studied the development of upstream watersheds and their impact on downstream flow, highlighting inter-basin drought management issues, and demonstrated that water resource scheduling and watershed management are crucial for alleviating drought impacts. Against the backdrop of global climate change and the increasing frequency of extreme weather events, socio-economic drought has gradually become an emerging area of research. Qu et al. [6] addressed the issue of underestimating the extent of socioeconomic drought due to the impact of virtual water on water resources. By considering the comprehensive demand for water resources and evaluating the role of water transfer in mitigating socioeconomic drought from the perspective of production and consumption, the study found that the water stress index in exporting regions significantly increases compared to the water pressure index in importing regions, due to the contribution of virtual water. The external pressure on the exporting regions was overlooked, leading to a severe underestimation of drought risk in the importing regions. Meng et al. [7] developed a new index, the Distributed Standardized Socioeconomic Drought Index (DSSEDI), to address the gap in existing socioeconomic drought indices that lack spatial distribution and standardization. The index was applied to the Pearl River Basin, and the study found that the population and economy in the Pearl River Delta are significantly vulnerable to drought. During severe droughts, the economic risk near Shenzhen can reach up to USD 4.66 billion. Tela et al. [8] evaluated the spatiotemporal trends of meteorological drought and its impact on socioeconomic drought in the Tekeze Basin using questionnaires, field observations, and CHIRPS data through a random forest model. The study recommended the effective implementation of the mitigation measures initially carried out by government and non-governmental organizations, emphasizing the active participation of local communities. Current studies on socio-economic drought focus on several aspects, including the construction of an indicator system [4,9,10,11,12], risk assessments [13,14,15], and the propagation effects between drought and socio-economic drought [16,17]. Additionally, some scholars have focused on the evolution characteristics and driving factors of socio-economic drought [17,18]. However, there is relatively little research on how to evaluate the drought resistance capacity of socio-economic droughts.
Reservoirs, as large-scale artificial water infrastructure, play a pivotal role in drought resistance by regulating water volumes to effectively manage downstream water demands [19]. Reservoirs are not only essential for regulating extreme events such as floods and droughts, but their storage and release operations directly influence the balance between water supply and demand downstream. In the context of drought, the operational strategies employed by reservoirs, such as the modulation of release volumes, assume particular significance concerning the supply capacity defined within the framework of socio-economic drought [20]. Consequently, the evaluation of a reservoir’s drought resistance, particularly concerning its performance during socio-economic droughts, emerges as a pivotal approach to address this issue. Tu et al. [21] report a significant decrease in socioeconomic drought attributes under reservoir regulation, highlighting the potential of reservoir operations to mitigate socioeconomic drought.
The evaluation of drought resistance capacity in reservoirs can be categorized into qualitative and quantitative assessments. Qualitative assessments are typically based on the static attributes of the reservoir, constructing composite indices for evaluation. For instance, Lu et al. [22] utilized a fuzzy comprehensive evaluation model comprising nine indicators to assess the drought resistance of hydraulic engineering projects, thereby identifying that nearly half of the third-level hydraulic districts exhibited inadequate drought resistance, thereby emphasizing the necessity for enhancing drought resistance in water infrastructure. Pourmoghim et al. [23] developed a four-tier evaluation framework incorporating long-term resilience, reliability, implementation costs, and ecological status in lake drought resistance assessments. In a related study, Wang et al. [24] proposed an adaptive evaluation system based on reservoir scale, layout, and engineering management, which was applied to reservoirs in the lower Yellow River.
In quantitative assessment, Shah et al. [25] evaluated the drought risk of 38 global reservoirs using the Reservoir-Based Drought (RBD) metric, integrating evapotranspiration and storage alterations. Their findings indicated that 71% of reservoirs are influenced by climate change and 29% by human activities. The drought resistance of reservoirs is typically evaluated based on supply and demand, as reflected by the ratio of water supply to water demand of a reservoir under a specified drought recurrence period [26]. However, the comprehensive evaluation method is often found to fail to reflect the actual level of drought resistance.
In the context of drought management, the optimal scheduling of reservoir operations is recognized as a pivotal strategy for enhancing drought resistance. A prominent measure employed is water supply restriction, which has been shown to effectively mitigate downstream water scarcity during drought periods by regulating the water supply from reservoirs [27,28,29]. Numerous studies have demonstrated that restricting water supply not only reduces wastage through precise allocation of water resources but also optimizes water supply by prioritizing emergency demand [30,31]. In addition, the development of hedging rules for future droughts has attracted significant attention, with the potential to enhance the resistance and water supply capacity of reservoirs during drought periods [32,33,34,35,36]. Drought-limit level setting is another significant strategy that can be used to regulate water supply by determining a minimum water level, thus ensuring that reservoirs do not overdraw water resources during droughts [37,38,39,40]. These strategies collectively contribute to the maintenance of the reservoir’s stable operational capacity during periods of drought.
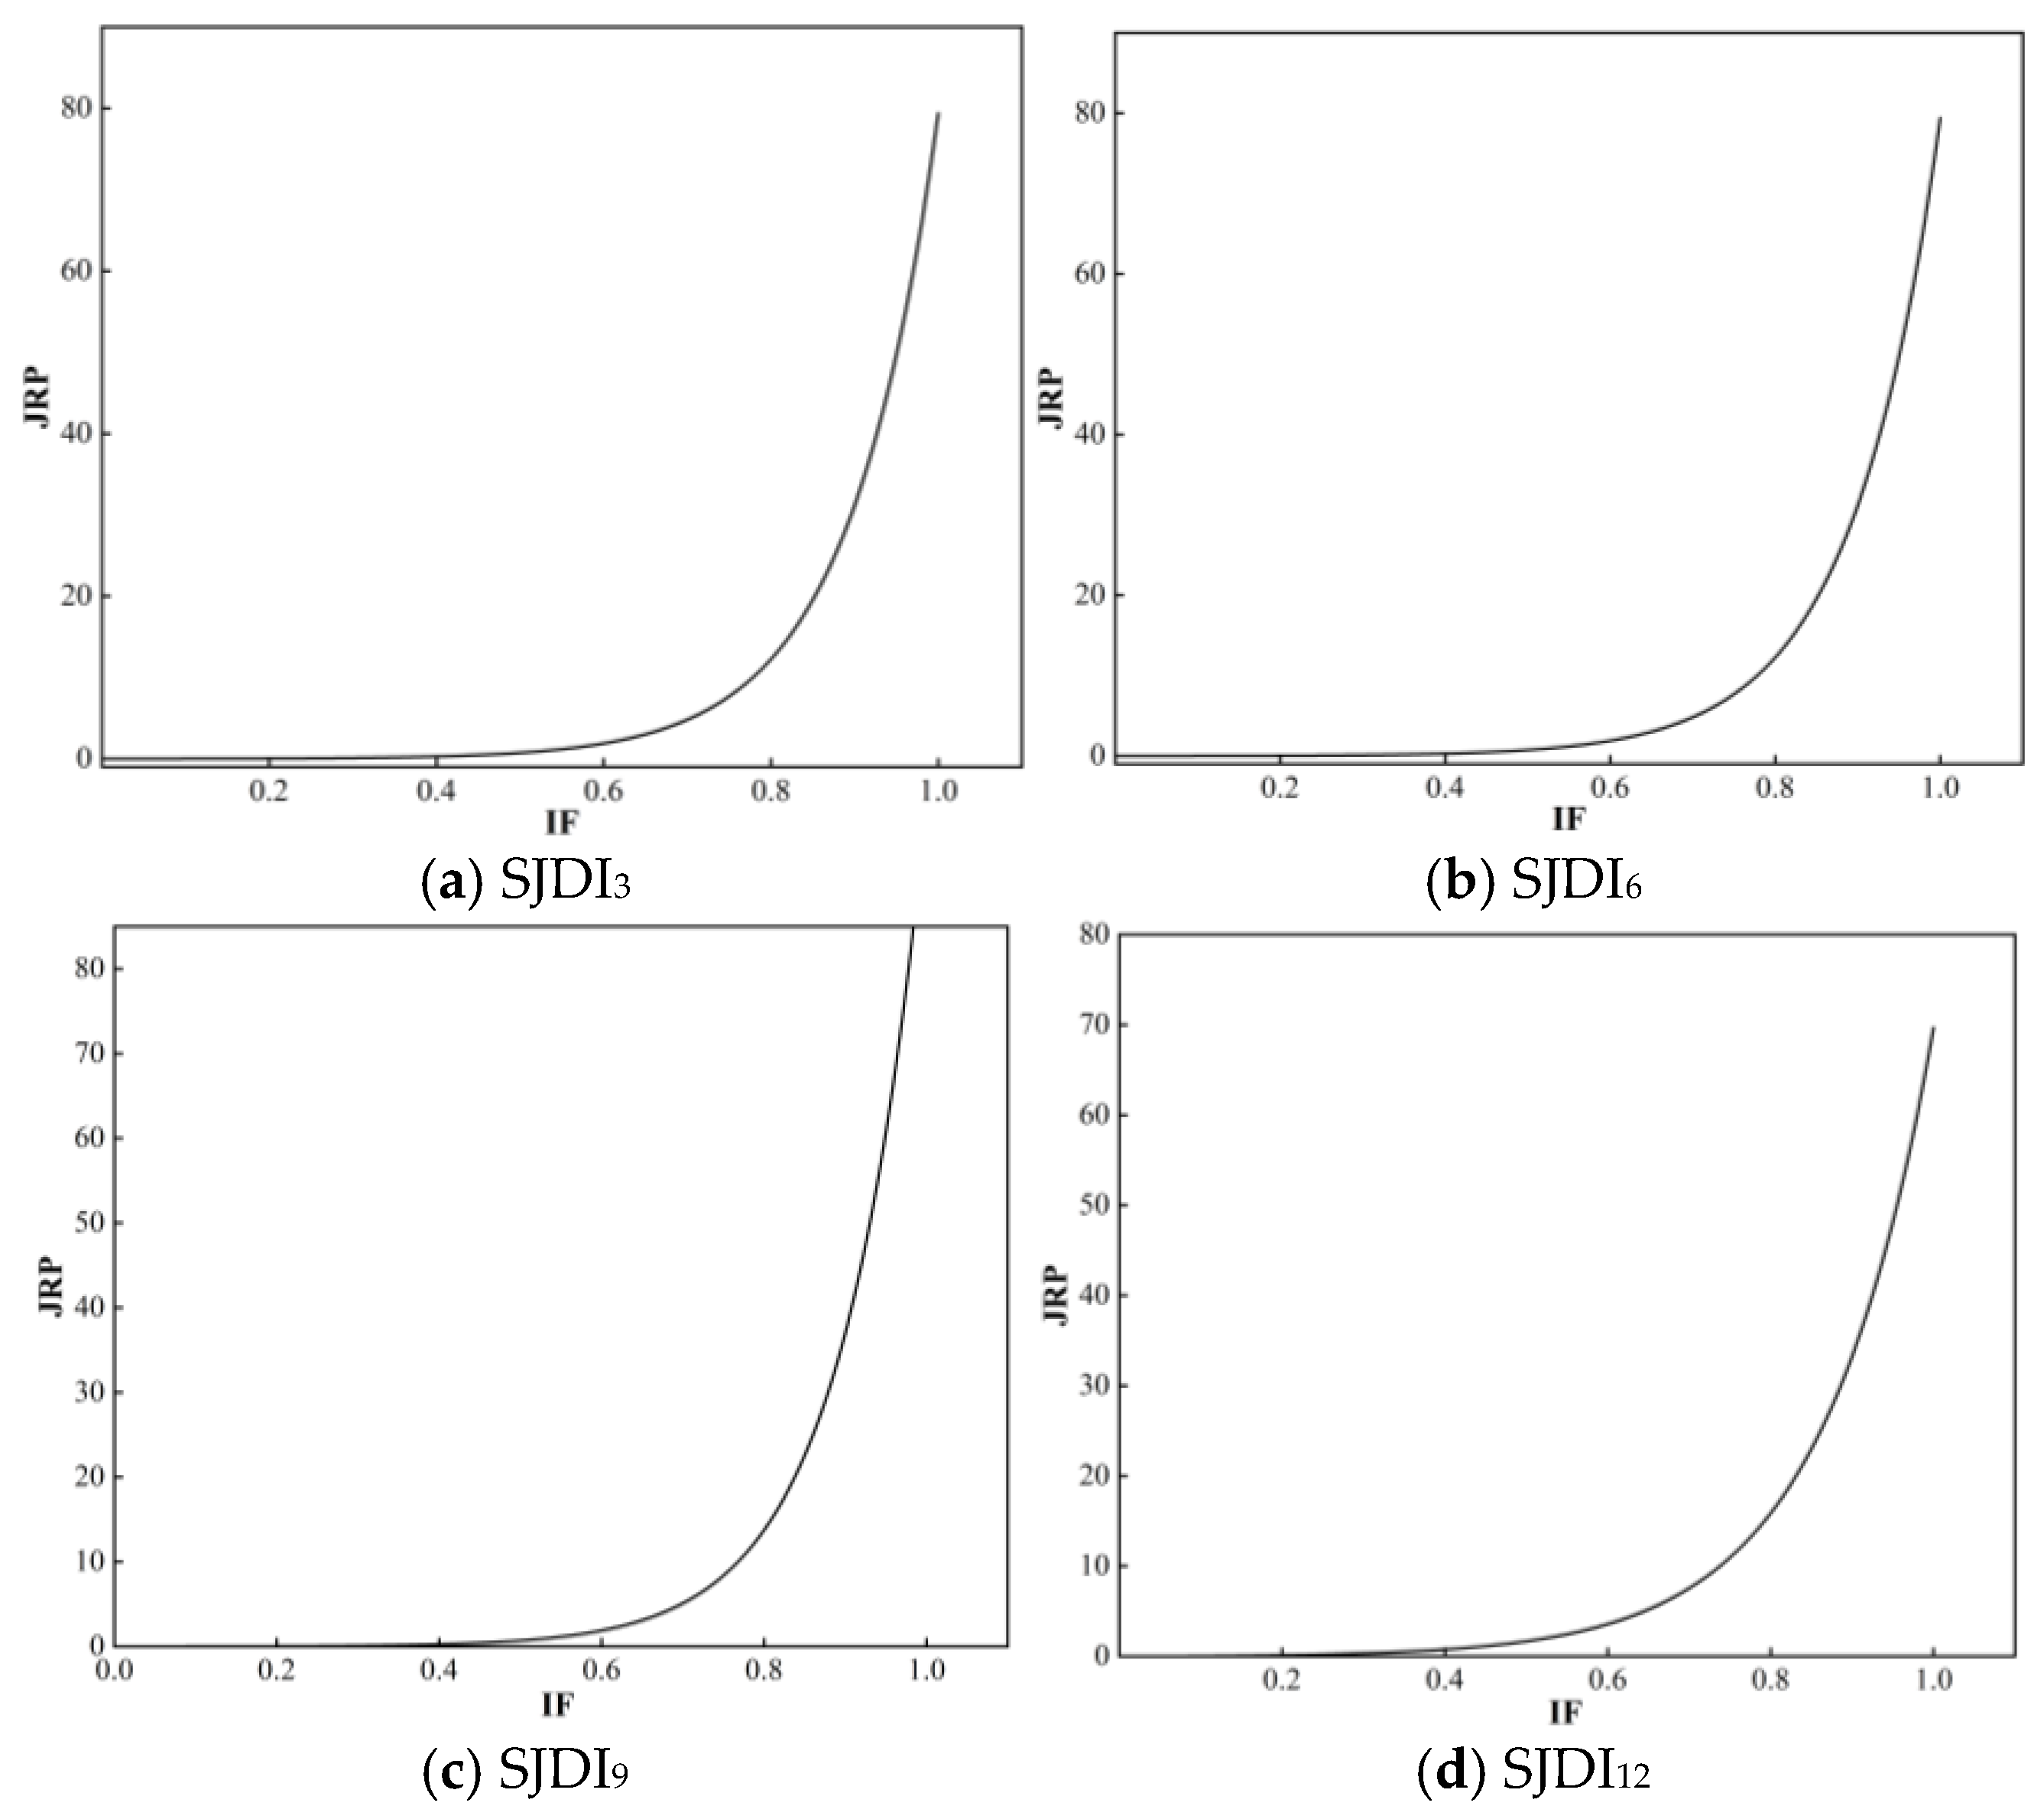
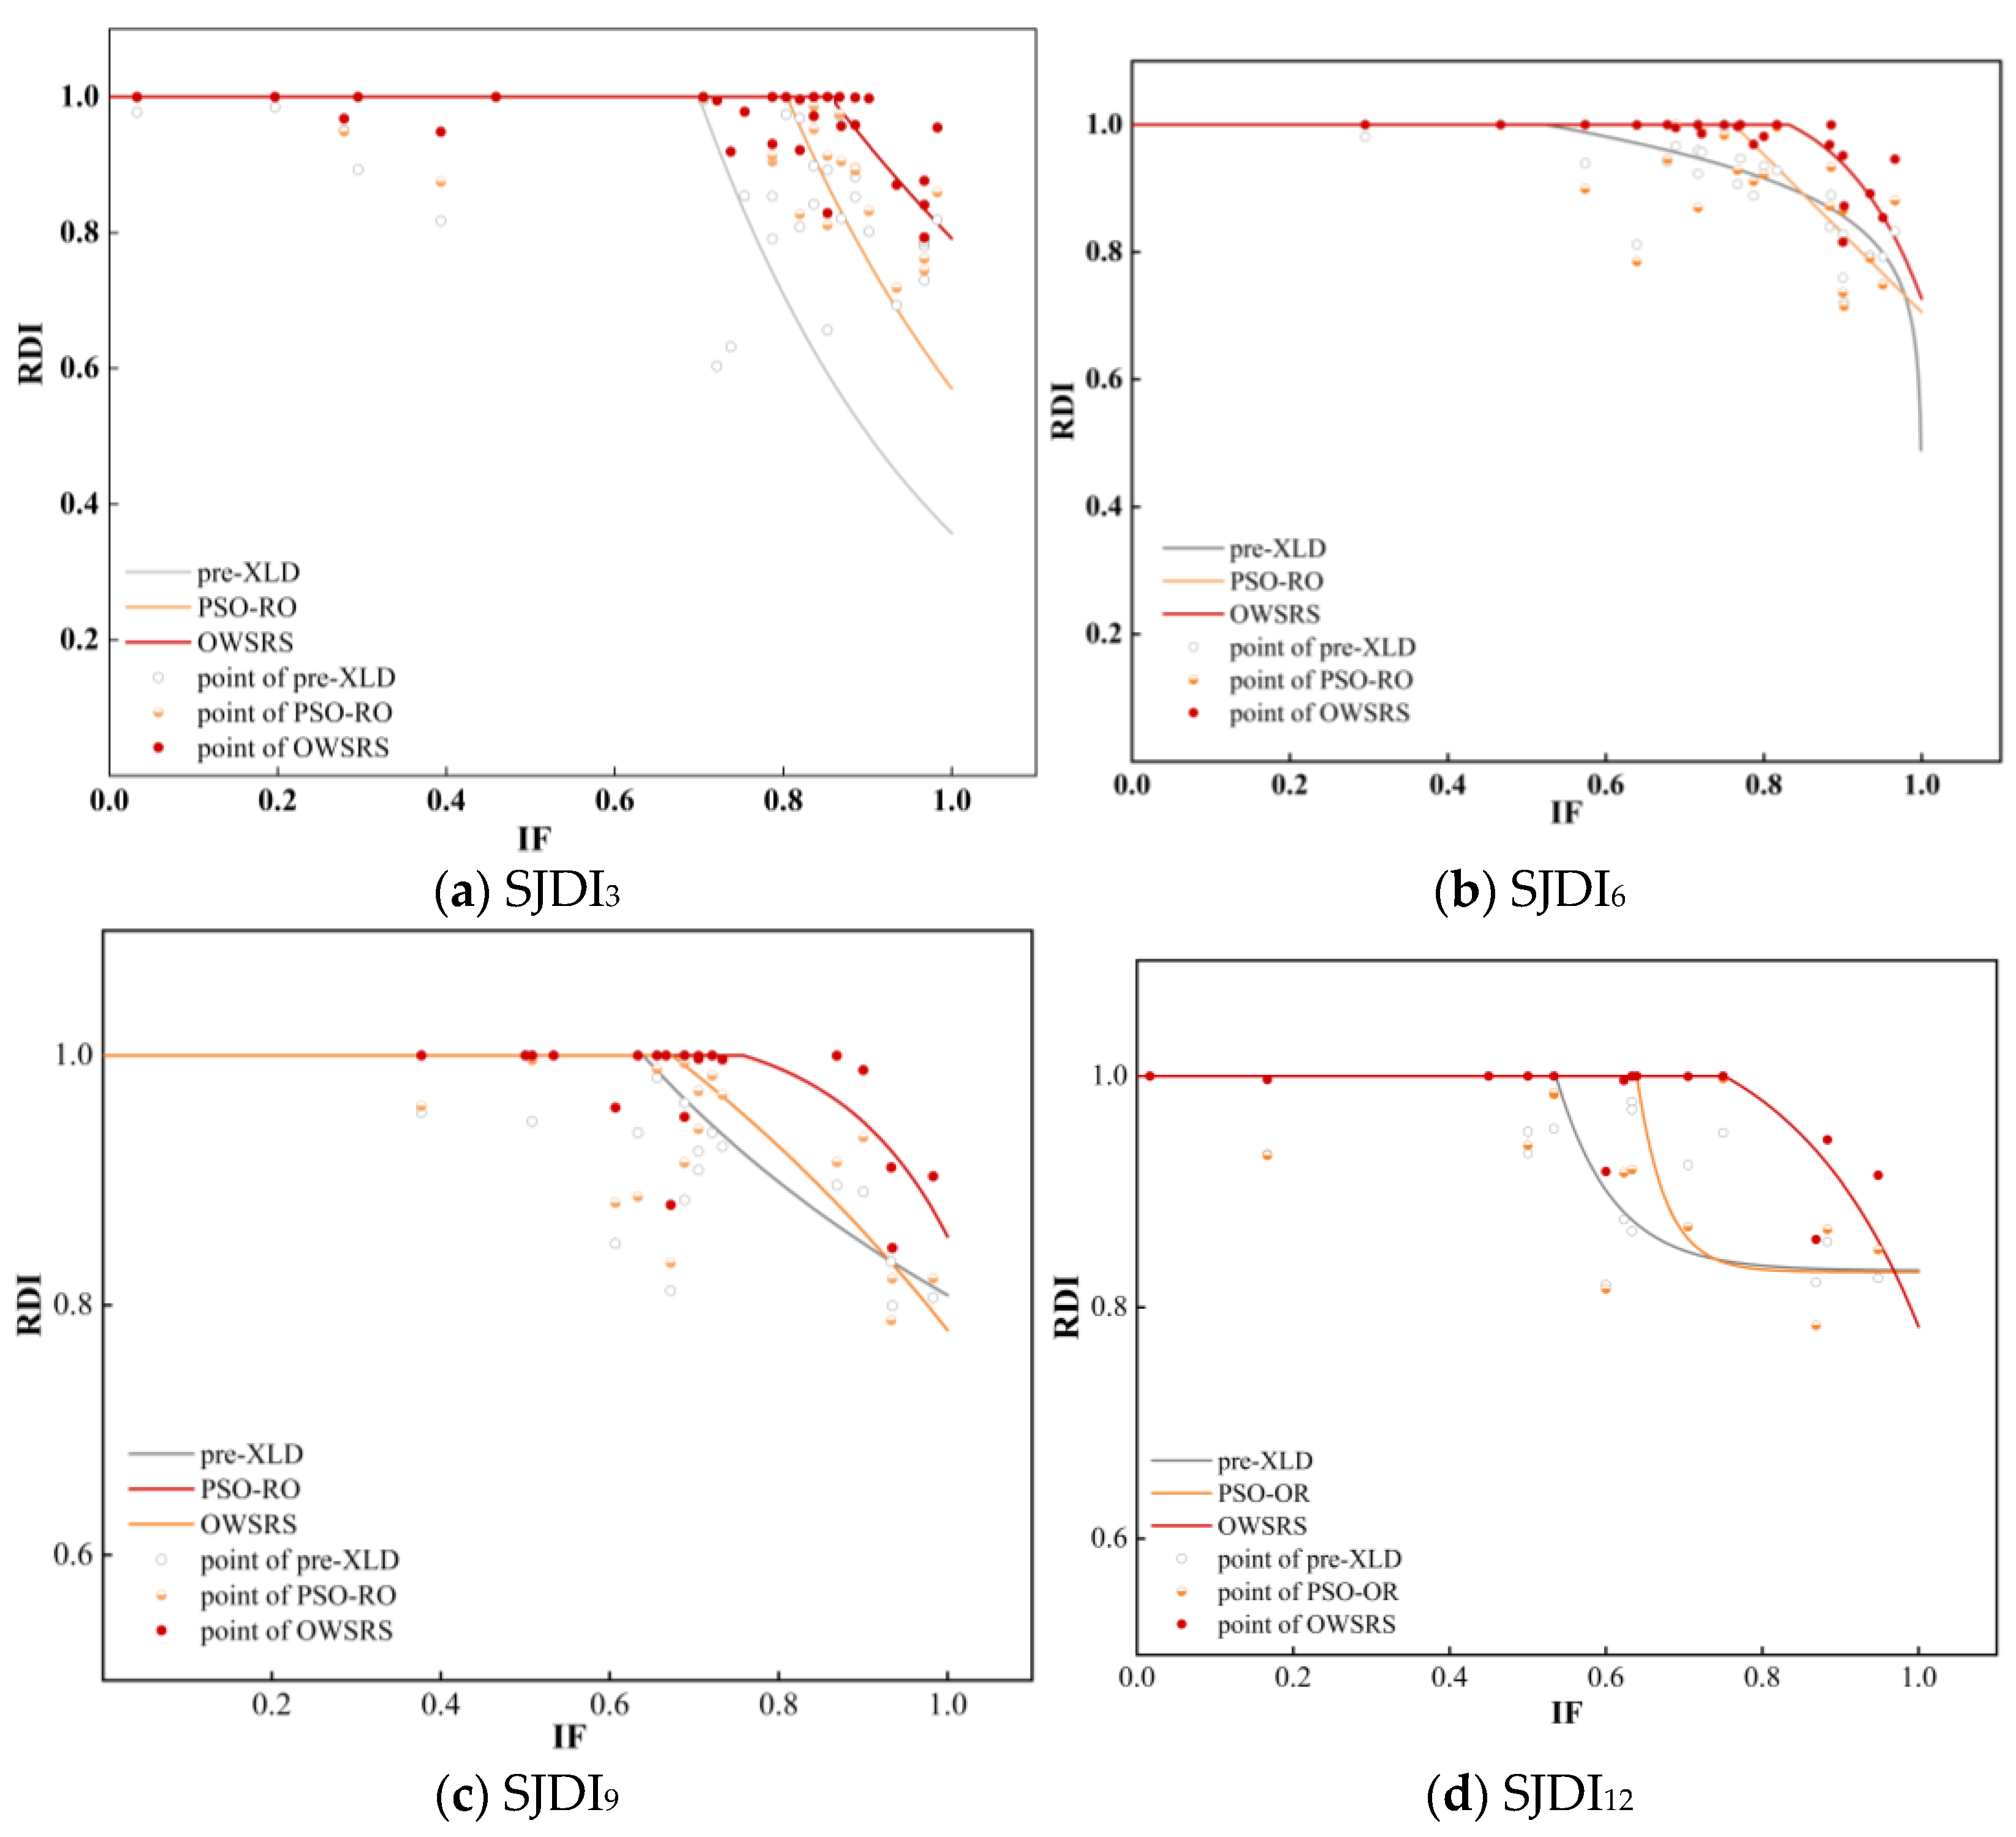
Existing studies have three main limitations. First, most drought resilience assessments rely on static reservoir characteristics rather than operational dynamics during actual drought events. Second, few link socio-economic drought assessments to reservoirs. Third, few studies have systematically quantified the drought resistance capacity of different reservoir operation strategies under different return periods. In this study, the capability of reservoirs to respond to socio-economic drought is defined as the ability of reservoirs to meet the demands of various downstream water users under different recurrence intervals. This study characterizes socio-economic droughts of varying severity through the joint recurrence intervals calculated using copula functions, thereby providing a more comprehensive reflection of the multidimensional characteristics of drought (e.g., duration, peak, and severity) [20]. Meanwhile, accurately constructing socio-economic drought indicators is crucial for identifying drought characteristics. Based on the methods of existing studies [13], this study constructs a simple and direct socio-economic drought indicator that effectively reflects the relationships among upstream inflow, inter-basin inflow, and downstream water demands. Additionally, this study addresses gaps in the quantification of drought resilience capacity through three key innovations: (1) developing a multiscale socio-economic drought assessment framework that integrates copula-based joint recurrence intervals to describe the complexity of socio-economic drought comprehensively, (2) establishing a Resistance Drought Index (RDI) to quantitatively link reservoir operational performance with drought severity and inflow frequency, and (3) using a PSO-optimized reservoir model to compare conventional and restricted water supply strategies, providing actionable insights for adaptive drought management. Our approach advances the methods for assessing drought resilience and offers a practical tool for optimizing water resource allocation in the Yellow River during extreme events.
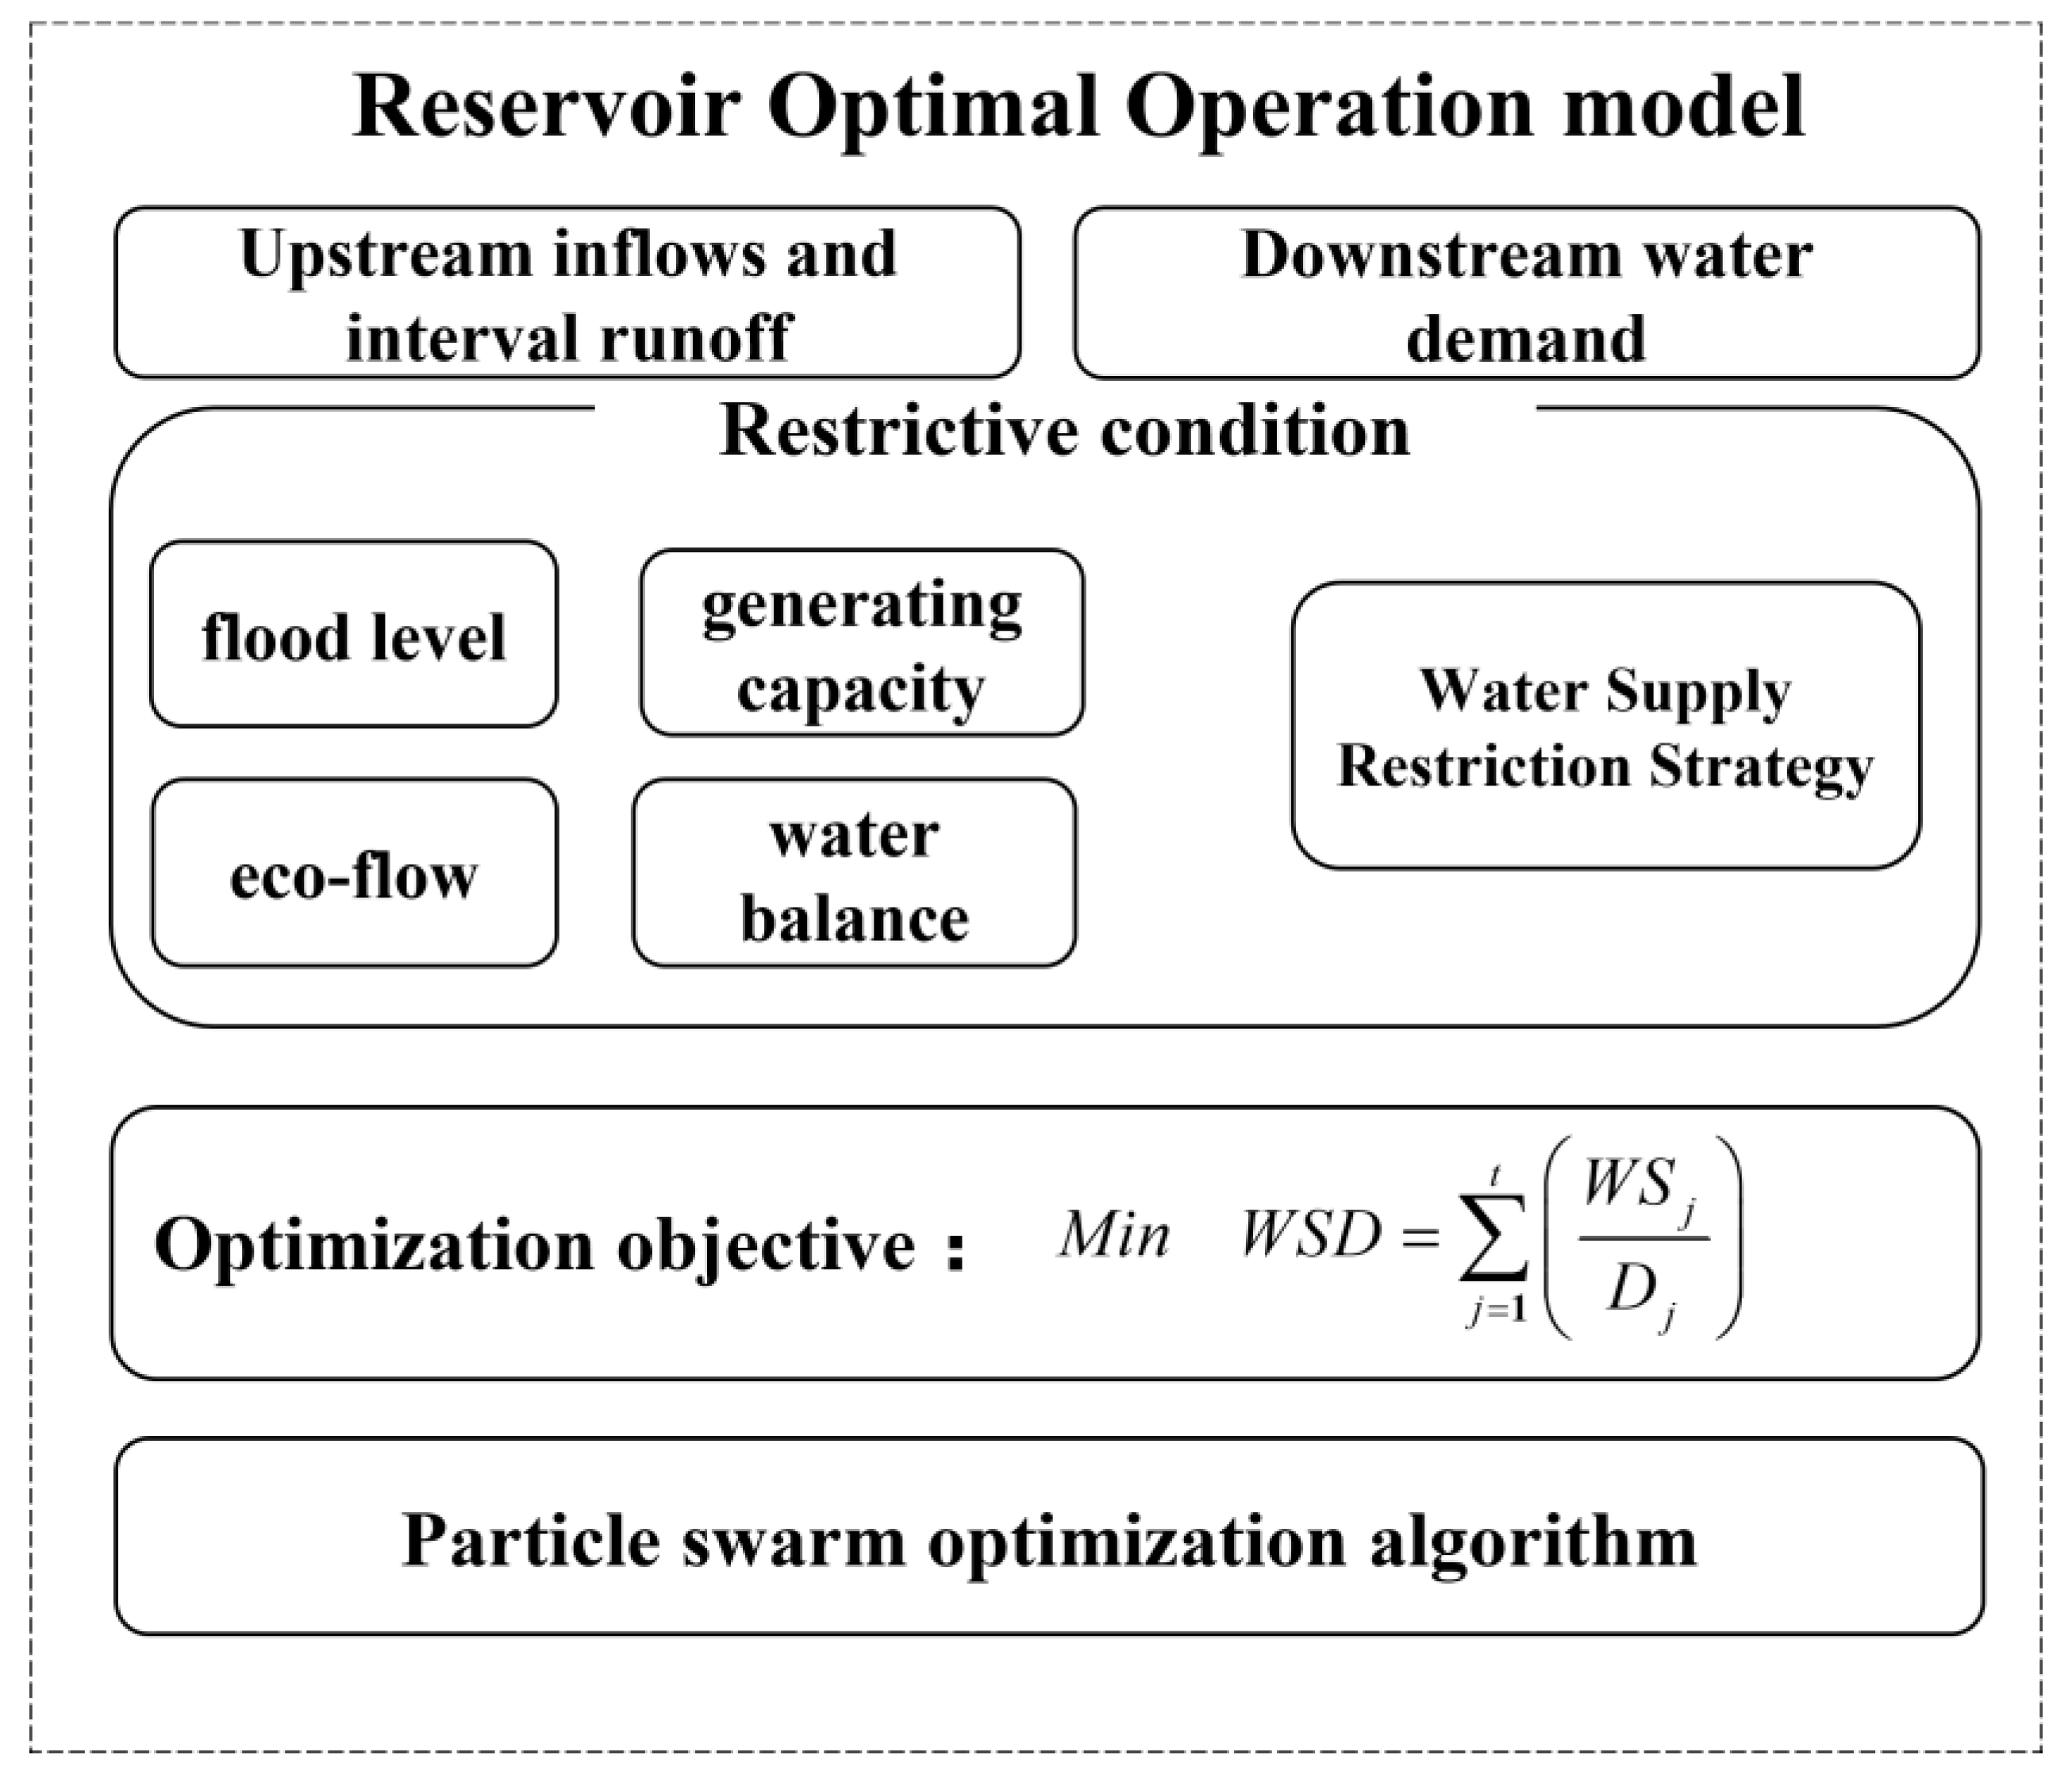
The main objectives of this study are as follows: (1) to quantitatively assess the drought resistance capacity of reservoirs in response to socio-economic drought at different scales, advancing the development of drought resistance capacity evaluation; (2) to reveal the relationship between reservoir drought resistance and socio-economic drought recurrence periods/water inflow frequency during drought periods; and (3) to explore the changes in a reservoir’s drought resistance capacity under water supply restriction strategies. The technical lines for this study are shown in Figure 1.

2. Study Area and Data

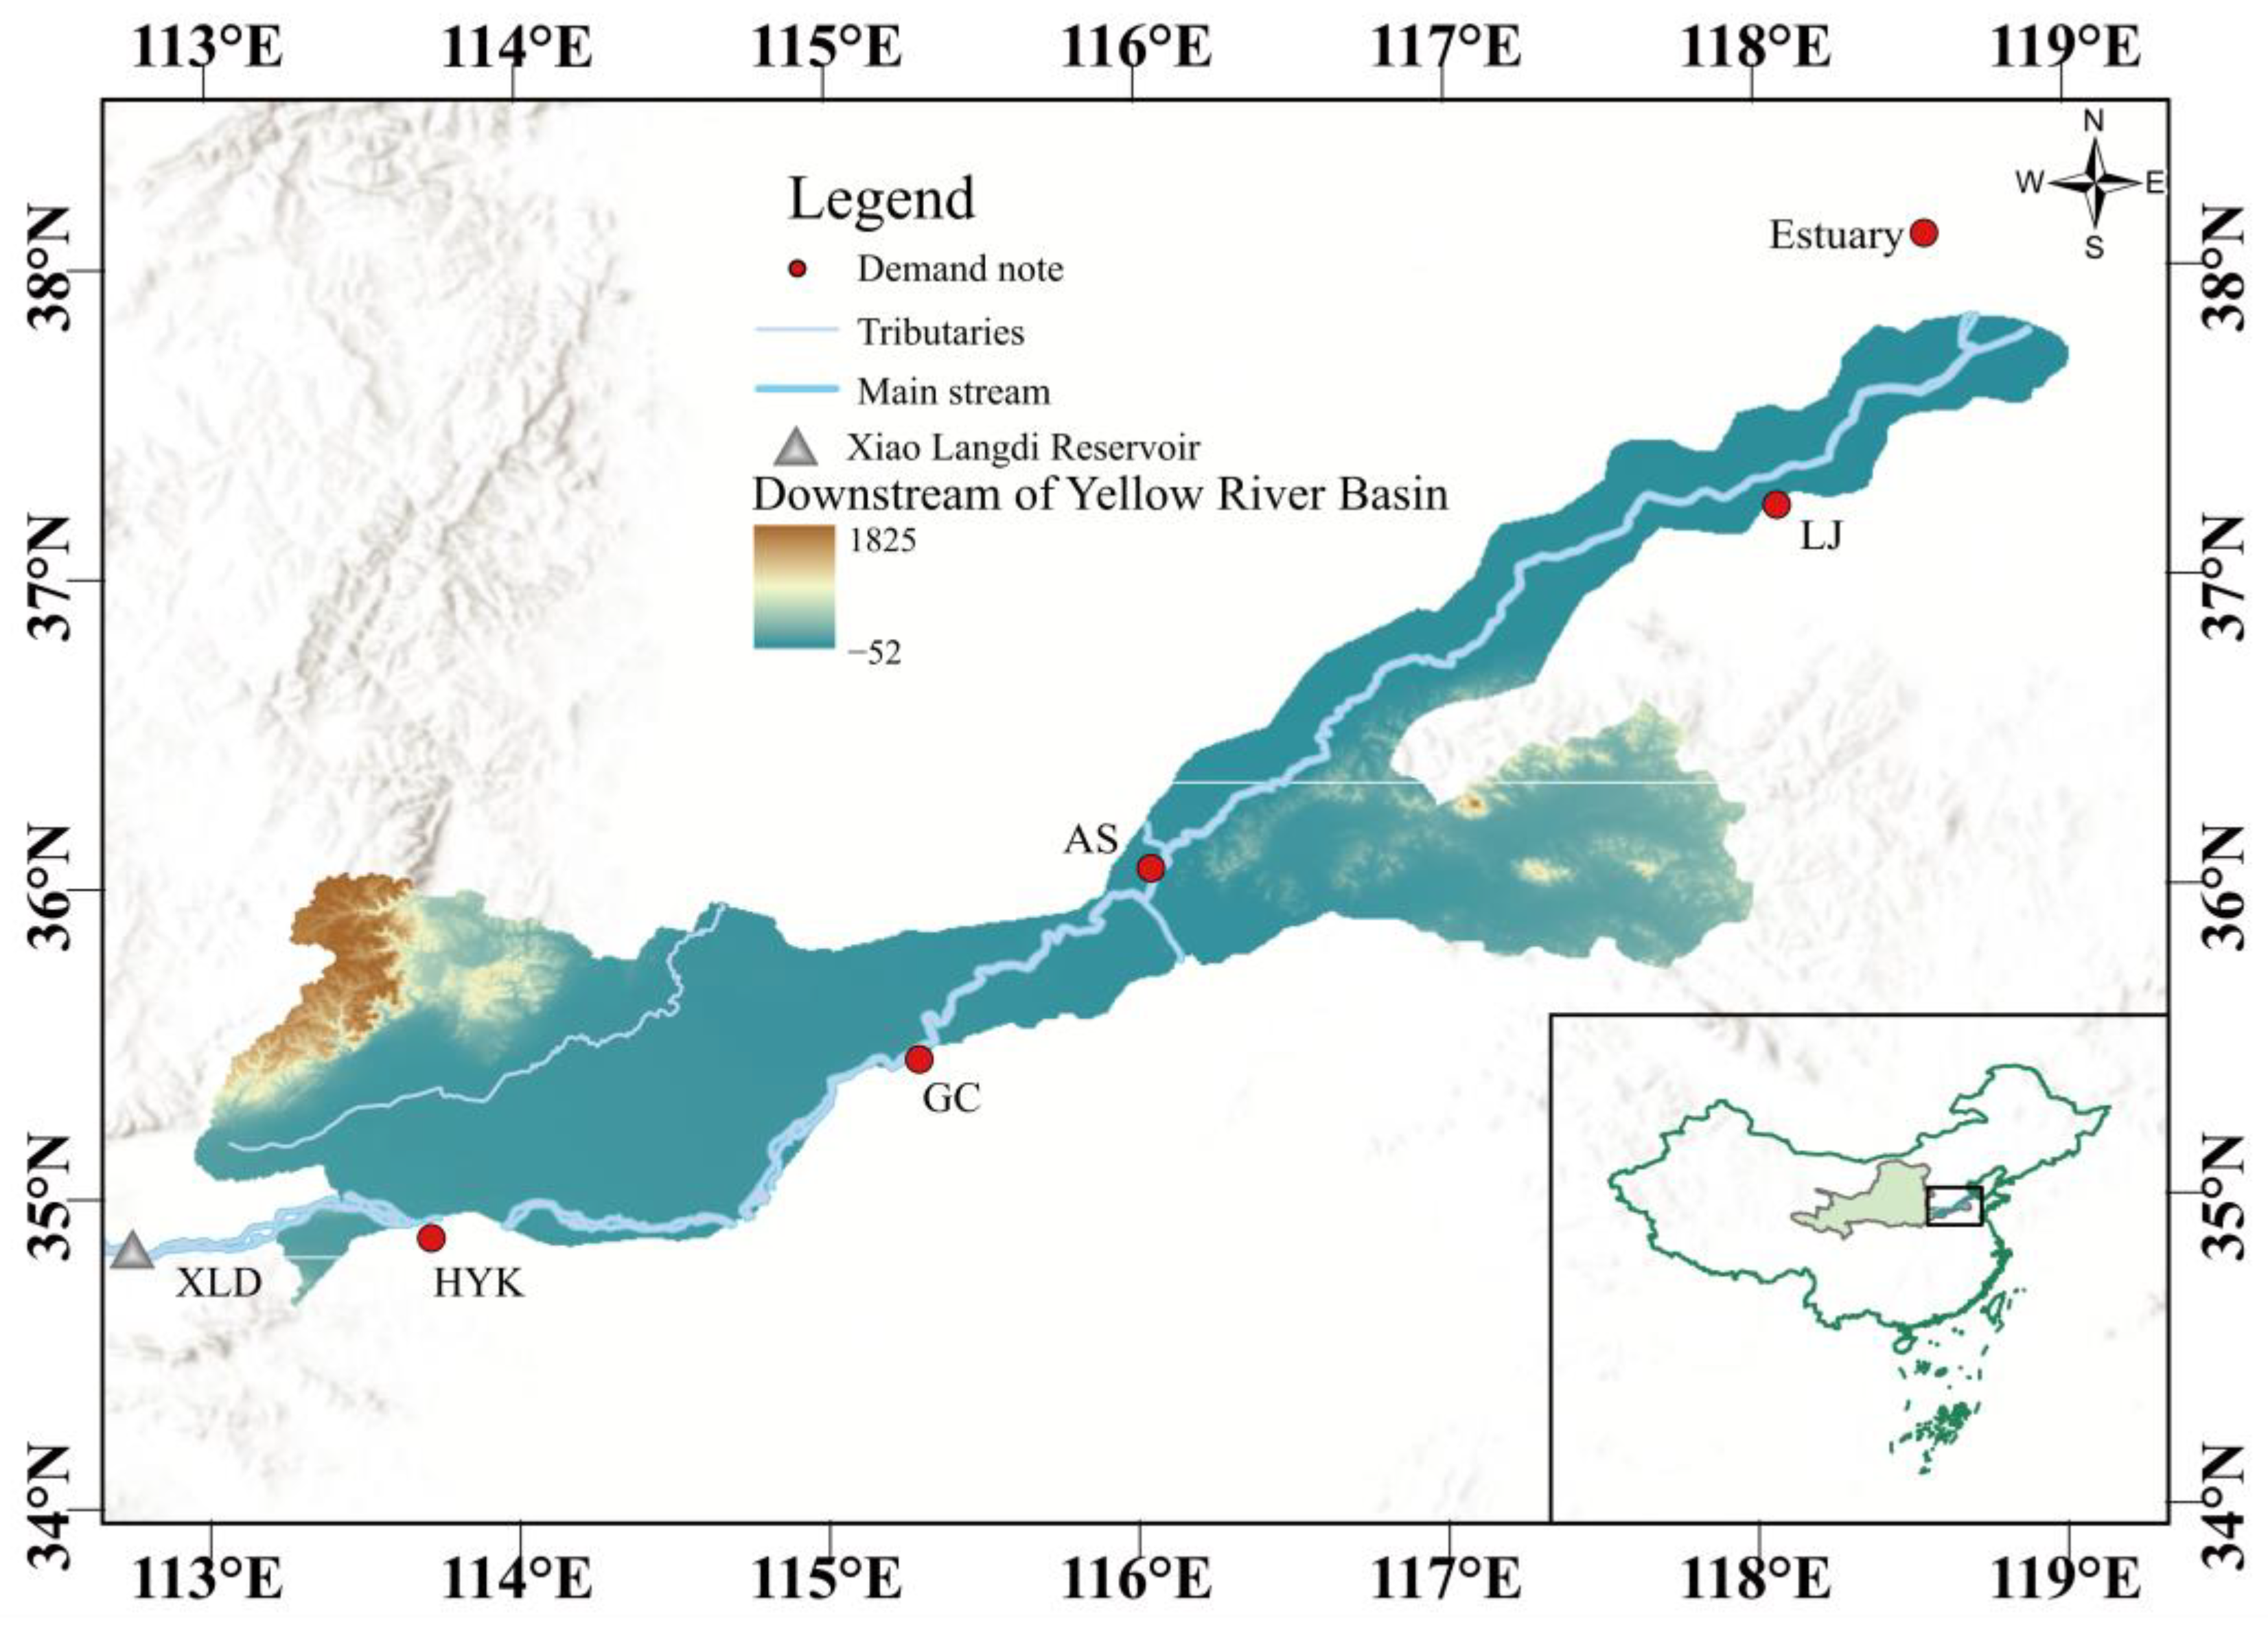
The Yellow River is located in the northern part of China, extending from 95°53′ to 119°05′ in longitude and 32°10′ to 42°50′ in latitude, as shown in Figure 2. It traverses a total of nine provinces, namely Qinghai, Sichuan, Gansu, Ningxia, Inner Mongolia, Shaanxi, Shanxi, Henan, and Shandong [41]. The river ultimately flows into the Bohai Sea. Historically, the Yellow River Basin has experienced several large-scale droughts, with the DYRB experiencing almost continuous flow cut-offs in the 1980s [42]. In the 21st century, the annual runoff of the Yellow River has been decreasing, and various types of drought events are occurring frequently. The severity of the drought is having a detrimental effect on the sustainable development of the Yellow River Basin [43]. Xiaolangdi Reservoir (XLD) is the only annually regulated reservoir in the downstream region of the main stem of the Yellow River, responsible for flood control, water supply, and power generation. The DYRB was selected as the study area and XLD as the study object. The analysis of the socio-economic drought in the densely populated area of the DYRB and the evaluation of the drought resistance capacity of the mainstem reservoirs to cope with socio-economic drought are of great significance in solving the problem of human–water conflicts in the Yellow River Basin, as well as guiding the assessment of the drought resistance capacity of the reservoirs of other mainstems and tributaries.
The datasets used in this study include the natural monthly runoff data (1956–2016) and monthly surface water demand data (2030 level) for each node. The monthly runoff data are the results of the Third National Survey and Evaluation of Water Resources provided by the Yellow River Water Resources Commission (YRWRC). The collected water demand data are shown in Table 1, where we conceptualize the monthly downstream users’ water demand by attributing it to major nodes, such as the HuaYuankou (HYK) node, so that it is easy for the reservoir operation model to perform calculations.

3. Methodology

3.1. Framework for Evaluation of Drought Resistance of Reservoirs in Responding to Socio-Economic Droughts

3.1.1. Socio-Economic Drought Index Construction at Multiple Scales

The construction of a socio-economic drought index facilitates the analysis of drought events. This paper proposes the construction of a Simple Socio-economic Drought Index (SJDI). The methodology involves the calculation of the degree of deficit in unmet water demand and the degree of surplus in supply and demand fulfilment:
W S i = Q i + I i D i D i ( i = 1 , , 12 )
where Q i is the upstream water inflow, I i is the interval runoff, D i is the downstream water demand, and W S i is the degree of satisfaction of supply and demand.
Secondly, normal, extreme value, logarithmic, log-logistic, Weber, Pareto, and lognormal distributions were considered to fit the empirical distributions, and the fitting results were tested using the k-s test and the Akaike Information Criterion (AIC) test [9], and the log-logistic distribution was preferred to be used as the cumulative probability distribution of the W S i ; the distribution function is shown below:
F ( x ) = [ 1 + ( α x γ ) β ] 1
where x is the time series of W S i , and α , β , and γ are the scale, shape, and position parameters, respectively, all estimated by the linear method of moments fit. The parameters are defined as follows:
α = ( ω 1 2 ω 2 ) β Γ ( 1 + 1 / β ) Γ ( 1 1 / β )
β = 2 ω 2 ω 1 6 ω 2 ω 1 6 ω 3
γ = ω 1 α Γ ( 1 + 1 / β ) Γ ( 1 1 / β )
where Γ ( β ) is the gamma function with respect to β , and ω 1 , ω 2 , and ω 3 are probability weight moments of x. The expression is shown as follows:
ω s = 1 N i = 1 N ( 1 F i ) s D i F i = i 0.35 N
where s is 1, 2, and 3, and N is the month of participation in the calculation.
According to the classical approximation theory of Abramowitz and Stegun (1965), the standardized SJDI is defined as follows:
S J D I = { W C 0 + C 1 W + C 2 W 2 1 + D 1 W + D 2 W 2 + D 3 W 3       F ( X ) 0.5 ( W C 0 + C 1 W + C 2 W 2 1 + D 1 W + D 2 W 2 + D 3 W 3 )       F ( X ) > 0.5
W is determined by:
W = { 2 ln ( 1 F ( x ) ) F ( x ) 0.5 2 ln ( F ( x ) ) F ( x ) > 0.5
Among them,
C 0 = 2.515517 , C 1 = 0.802853 , C 2 = 0.010328 , D 1 = 1.432788 , D 2 = 0.189269 , D 3 = 0.001308

3.1.2. Drought Event Truncation

Tour theory is utilized for the identification of various drought event characteristics. This methodology is employed to identify socio-economic drought characteristics at multiple time scales (3, 6, 9, and 12 months) and to extract drought event characteristics such as drought duration, severity, and intensity in the following:
(1)
Three truncation levels are selected, X 0 = 0 ,   X 1 = 0.5 ,   X 2 = 1 (where X i denotes the socio-economic drought index). If the drought index is less than X 1 , it is initially determined that a drought has occurred in the same month,
(2)
If the drought index is higher than X 2 , for drought events lasting one month, it is determined that there is no drought.
(3)
If the interval between two adjacent drought events are only one month and the value of the drought index during that month is less than X 0 the two adjacent drought events are combined into one drought event.
In the latter case, the drought duration is the sum of the two drought durations, and the drought severity is the sum of the two drought events. In the absence of this condition, the two drought events are independent. Following the extraction of the drought characteristics, namely the drought duration, drought intensity, and drought severity, the joint recurrence period of each drought process at different time scales can be calculated.

3.1.3. Joint Recurrence Periods for Socio-Economic Drought Events

The copula function has been widely used in modeling nonlinear multivariate data structures such as hydrology and climate. It is a joint function that can join two independent marginal distributions together. Sklar (1959) [44] first proposed a copula and gave its mathematical expression. According to Sklar’s theorem, if H ( x ,   y ) is a binary joint distribution function of F ( x ) and G ( y ) with marginal distributions, then there must exist a unique copula function C such that
H ( x , y ) = C ( F ( x ) G ( y ) )
Conversely, if C is a copula function, then F ( x ) and G ( y ) are two arbitrary probability distribution functions. Then, there must exist a function H ( x ,   y ) , which is a joint distribution function corresponding to the marginal distributions of F ( x ) and G ( y ) exactly. The copula function has the property that the joint distribution can be constructed flexibly according to the marginal distributions. In this paper, two-dimensional copula joint probability distributions are chosen to calculate the joint recurrence period of drought processes at different scales, and the marginal distributions are constructed from the drought calendar time and drought intensity. Copula functions including Clayton copula, Frank copula, and Gumbel copula are chosen to determine the relevant drought joint probability distribution variables because they are easily constructed. The feasibility of the different distribution types was judged based on the K-S test, and the applicability of the marginal distributions was evaluated using the AIC criterion and the Root Mean Square Error (RMSE), and the distribution with the smallest AIC and the closest goodness of fit to 1 was selected as the optimal marginal distribution.

3.1.4. Drought Resistance Capacity of the Reservoir

The drought resistance capacity of the reservoir to respond to socio-economic drought is closely related to the recurrence period of droughts and the inflow frequency during droughts [45]. On this basis, the drought resistance capacity of the reservoir can be characterized by calculating the ratio of available water to water supply during different drought recurrence periods. This ratio reflects the extent to which the water supply in the reservoir can meet downstream water demands during droughts. It is expressed as follows:
R D I ( t , p ) = Q s u p p l y ( t , p ) D d e m a n d ( t , p )
where t represents the recurrence period of drought and p represents the inflow frequency during droughts. Q s u p p l y ( t , p ) signifies water supplied by the reservoir during drought period t and inflow frequency p , and D d e m a n d ( t , p ) indicates the amount of water that should be supplied to maintain downstream water demand during the drought period t and water inflow frequency p ; numerically, normal water demand during droughts can be used as an alternative. R D I ( t , p ) indicates the drought resistance capacity under the conditions of drought period t and inflow frequency p , with values in the range of ( 0 , 1 ] , and larger values of R D I ( t , p ) indicate higher drought resistance.

3.2. Reservoir Operation Model

Particle swarm optimization (PSO) is an evolutionary computational approach that models optimization algorithms for collective behavior, such as flocks of birds or schools of fish [29]. It iteratively adjusts the position and velocity of candidate solutions to find the optimal solution in the search space. By iteratively updating the velocities and positions of the particles, the particle swarm optimization algorithm gradually converges to the optimal solution, thus solving the optimization problem. In the optimization of the reservoir operation model, the algorithm shows superior global search capacity, a faster convergence rate, and good performance. The basic characteristics of XLD are provided in Table 2.
The present study proposes the construction of two reservoir operation models. The first is the PSO-based reservoir scheduling model, hereafter referred to as PSO-RO. The second is the PSO-RO model with a water supply restriction strategy, hereafter referred to as OWSRS. Section 3.2.1 and Section 3.2.2 present the objective functions and basic constraints for the two models, as shown in Figure 3, while Section 3.2.3 outlines the water supply restriction strategy, which is applied in the second model.

3.2.1. Objective Function

We have developed a monthly-scale reservoir operation model that considers ecological and power generation factors. The model takes the multi-year average water level of the XLD flood season in early July as the starting water level and considers various constraints. The objective is to minimize the depth of total water shortage damage in the DYRB and use the PSO optimal scheduling model to calculate the optimal reservoir release process. The expression for minimizing the depth of total water shortage damage is as follows:
min W S D = j = 1 t ( W S j ( W S j < 0 ) )
where the total depth of water supply destruction is denoted by W S D , and the water deficit at time j is denoted by W S j .

3.2.2. Constraints

(1) Water level constraints
Z t min Z t Z t max
where Z t min is the dead level, and Z t max means that the water level of the XLD reservoir is 235 meters in the main flood season and 248 meters in the second flood season, respectively.
(2) Water balance equation
V t + 1 = V t + ( Q t q t ) Δ t
where V t and V t + 1 are the storage capacity of XLD reservoir in the t and t + 1 periods, respectively. Q t and q t denote average monthly reservoir inflow and discharge.
(3) Reservoir discharge constraint
q t min q t q t max
where q t min and q t max denote the minimum and maximum discharge constraints of XLD reservoir in period t .
(4) Power output constraint
N t min N t N t max
where the minimum and maximum power outputs for reservoir in period t are denoted by N t min and N t max , respectively.
(5) Cascade hydraulic connection
I t = q t + Δ Q t
where Δ Q t denotes the interval incoming flow and I t denotes the total flow of node i in time period t.
It is worth noting that during the non-flood season, the flow of the Yellow River into the Bohai Sea is 5 billion cubic meters, while during the flood season, the flow of the Yellow River into the sea is 17 billion cubic meters. This must be considered when modeling.

3.2.3. Water Supply Restriction Strategy

The water supply restriction strategy is expressed as follows. Figure 4 illustrates the differences in reservoir operation optimization using PSO with and without water supply restriction strategies during drought periods and pre-drought periods. The principle of the water supply restriction strategy is to store the water volume in the reservoir for months where the water supply guarantee rate exceeds the initial set water supply guarantee rate, releasing only the water volume required by the initial water supply guarantee rate. During drought months, the stored water volume is released.
q = q t 1 λ
λ o r i g i n = P t
P t + 1 = 1 M W S t M t
It is activated when the water shortage rate reaches a certain level, and the water supply is multiplied by a discount factor one month before the drought period. λ is the discount factor, P t is the guaranteed water supply rate for the current period, M W S t is the number of water shortage periods, and M t is the total number of operation periods.

4. Results

4.1. Characteristics and Evolution of Socio-Economic Drought Events

This study investigates the evolution of socio-economic drought in the Yellow River Basin using the socio-economic drought indices developed and the associated theoretical framework. The analysis presented in Figure 5 shows the evolution of socio-economic drought in the DYRB across various time scales from 1956 to 2016. While the drought trends are generally consistent across these scales, the index at each time scale exhibits temporal variability. The signals of wet (positive) and dry (negative) conditions differ at different time steps. For example, from June to August 2003, the drought index exceeds the threshold at intra-annual time scales (3, 6, and 9 months), indicating significant recovery at these scales. However, at the annual scale (12 months), the drought was still ongoing. This discrepancy may be attributed to cumulative water deficits accumulated in earlier periods. Furthermore, a time lag is observed in the drought indices across various timescales. During the inter-annual drought from 1960 to 1962, for instance, the intra-annual drought indices indicated socio-economic drought in the spring and summer of 1960, whereas the multi-annual indices suggested that the drought persisted into the winter and spring of 1961.
A general trend towards drier conditions, particularly evident from the early 1990s to the early 2000s, is indicated by all scale indices. Notable historical drought events occurred in 1998–1999, 2000–2001, and 2003–2004, with drought indices at different time scales showing varying degrees of severity. Of particular note, multi-year-scale drought indices indicated severe drought during this period. Two main factors contributed to this trend: first, since 1987, the DYRB has experienced interruptions almost every year, with a record-breaking 229-day flow break in 1997. Secondly, between 1999 and 2002, the natural runoff of the Yellow River decreased annually, with volumes of 452, 350, 323, and 30 billion cubic meters, respectively. In May 2003, the water level of the Longyangxia Reservoir, a key upstream regulating reservoir, dropped to 2530.38 meters (just above its dead level), leaving a reserve volume of only 0.67 billion cubic meters [46]. Furthermore, six consecutive years of low precipitation during the flood season in the Yellow River Basin from 1997 to 2002 significantly influenced the socio-economic drought conditions in the downstream regions.
The variability of drought calendars decreases as the time scale increases, with the distribution becoming more concentrated. This trend may result from the smoothing of short-term fluctuations over longer time scales, leading to a more uniform temporal distribution. As illustrated in Figure 6a, drought intensity tends to be more dispersed at longer time scales, characterized by greater variability and more pronounced extremes. Similarly, as shown in Figure 6b, this could be attributed to the amplification of cumulative drought effects over extended periods. At shorter time scales, drought events with longer durations can pose immediate threats to irrigated agriculture and short-term water security. In contrast, at longer time scales, although drought events tend to have shorter durations, their significantly increased intensity may exert more profound and lasting impacts on regional economic development and water resource management.
In this paper, the optimal copula function is constructed based on the drought duration and drought severity optimal marginal distribution function fitting, and the joint recurrence period of different time scales is calculated to characterize the risk of socio-economic drought in the DYRB. The results are shown in Figure 7. The longer the drought duration, the greater the drought severity, making the recurrence period larger. In our study, we categorized the socio-economic drought recurrence period for each time scale into five levels from mild to severe to indicate the severity of socio-economic drought, as shown in Table 3.

4.2. Evaluation of RDI

The reservoir water supply during various socio-economic drought events during drought periods was calculated based on the PSO-RO and OWSRS models. Table 4 lists the drought resistance capabilities of the reservoirs under these two models. Additionally, by using the natural runoff before the construction of XLD, i.e., the drought resistance capability under the scenario without a reservoir (named pre-XLD), a comparative analysis was conducted on the drought start and end times, drought duration, water supply during drought, water demand during drought, and drought resistance capability of the three scenarios at different socio-economic drought scales.
In terms of water supply, compared to the pre-XLD scenario, the water supply in most cases for both the PSO-RO and OWSRS models was generally increased, and the duration of drought periods with adequate water supply was extended. For the socio-economic drought event in March 1960 (SJDI3) and the socio-economic drought event in January 2011 (SJDI6), the water supply in the PSO-RO model was slightly less than that in the pre-XLD scenario. The number of times the drought resistance capacity equaled one was higher in OWSRS than in PSO-RO, which, in turn, was higher than pre-XLD. This indicates that the water supply restriction strategy enhances the drought resistance of the reservoir in responding to socio-economic drought during drought periods.

5. Discussion

5.1. Relationship Between Socio-Economic Drought Recurrence Period and Inflow Frequency in Drought Periods

By calculating the inflow during the drought period, we explored the relationship between the inflow frequency and recurrence period during droughts. Figure 8 shows the fitted curves for inflow frequency and recurrence period. It is worth noting that previous studies [47] have analyzed the relationship between annual inflow frequency and recurrence period to determine the interplay between drought resistance capacity, inflow frequency, and recurrence period. This study defines inflow frequency as the frequency of inflows during drought periods within a long-term series, which is particularly important for analyzing potential cross-year droughts and inter-annual droughts.
In this study, we selected the top drought events from the four socio-economic drought indices to analyze their inflow frequency during the drought periods, as shown in Table 5. Generally, an inflow frequency greater than 0.75 indicates that the river is in a low-flow condition, while values greater than 0.9 suggest a severe drought condition. This observation aligns with the inflow frequency during the drought periods of the selected events, indicating that the inflow frequency during drought periods better reflects the river’s flow status than annual inflow frequency.

5.2. Discussion of Maximum Drought Resistance: Impact of Water Supply Restriction Strategy

The maximum drought resistance capacity is defined as the reservoir’s capacity to fully respond to socio-economic drought events. The RDI value at the last point where it equals one is considered the maximum drought resistance capacity, and this is achieved when the RDI is consistently less than one. The RDI points from Table 4 can be fitted based on this, as demonstrated in Figure 9. It is important to note that during the curve fitting process, some points may not align perfectly with the overall trend due to errors, and the curve fitting should place the curve beyond the critical point (i.e., the frequency corresponding to the maximum drought resistance capacity). Based on the trend of this point, the drought resistance capacity can be estimated using either extrapolation or interpolation, as appropriate. Generally, drought resistance capacity tends to decrease as inflow frequency increases. The analysis of the maximum drought resistance capacity prior to reservoir construction, as well as for the PSO-RO and OWSRS models, reveals that reservoirs utilizing the water supply restriction strategy exhibit enhanced drought resistance. The water supply restriction strategy involves the limitation of the monthly water supply to downstream areas in anticipation of the drought period, thereby reducing the water supply during that time and augmenting the reservoir’s storage capacity. This may result in a scenario where the water supply falls short of the water demand. When the drought period commences, the reservoir can release the previously reserved water to downstream areas, thereby mitigating the impacts of long-duration socio-economic drought events. The drought inflow frequency and maximum drought resistance capacity corresponding to the drought recurrence period for OWSRS are shown in Table 6.
As the scale of the socio-economic drought index increases, the return period of socio-economic drought corresponding to the maximum drought resistance shows a decreasing trend, as shown in Table 7. Secondly, different models exhibit an increasing trend in maximum drought resistance within the same scale of the socio-economic drought index. Taking SJDI₃ as an example, the maximum drought resistance corresponding to pre-XLD can cope with a socio-economic drought with a return period of 4.8 years, while the PSO-RO operation mode can cope with a drought with a return period of 12.3 years, and the OWSRS operation mode can cope with a drought with a return period of 21.5 years. In contrast, the water restriction strategy of OWSRS, which limits water supply during non-drought periods, results in a decrease in water supply guarantee rate in some periods, but its drought resistance capability in the long term improves by 16.7 years (relative to pre-XLD) and 9.2 years (relative to PSO-RO). This difference stems from OWSRS’s proactive water-saving mechanism, which strategically stores water in the early stages of drought through hedging rules (Figure 7). First, the nonlinear water allocation threshold of the restriction strategy aligns more closely with the drought development pattern. Second, ecological demands are prioritized as a constraint in the optimization process, preventing a catastrophic collapse of ecological flow during prolonged droughts that could lead to complete drought within the river channel. Third, the global optimization capability of the particle swarm algorithm can identify counterintuitive but effective operation rules, such as controlling short-term supply inadequacies to maintain long-term resilience.
It is important to note that, whilst the implementation of a water supply restriction strategy has been demonstrated to enhance the drought resistance capacity for socio-economic drought, the drought recurrence period at each time scale falls within Zone I in the recurrence period zoning. This suggests that the capacity of XLD to address socio-economic drought events in DYRB is limited, thus emphasizing the necessity for a basin-wide water allocation strategy for the Yellow River.

6. Conclusions

This study, by constructing a multi-scale socio-economic drought index, evaluates the drought resistance capacity of reservoirs and optimizes dispatch strategies, achieving the following main results:
(1)
The Yellow River downstream in the late 1990s–early 21st century was identified as a high-occurrence period of socio-economic drought, during which inflow was in an extremely dry state.
(2)
It was revealed that the PSO-RO model’s maximum drought resistance capacity at 3/6/9/12-month scales corresponds to return periods of 12.3/2.15/4.6/4.8 years, while the OWSRS supply-limiting strategy increases this to 21.5/4.5/13.8/12.7 years.
(3)
The water supply restriction strategy enhances the reservoir’s drought resistance to some extent, mitigating the impact of severe droughts downstream. However, its maximum drought resistance capability corresponds to a recurrence interval that can only address light droughts in Region I. This underscores the importance of adopting a unified water allocation strategy in the Yellow River Basin.
The research findings provide practical value for drought management in the Yellow River Basin: applying water supply restriction strategies to improve scheduling technology can enhance the drought resistance of reservoirs, providing prior experience for the optimal scheduling of similar reservoirs; second, the multi-scale socio-economic drought assessment system established can support the construction of a basin-level early warning and response mechanism; finally, the quantified assessment results fully verify that large reservoirs can serve as the primary control measure for addressing basin-wide droughts.
The limitation of this paper is that it did not thoroughly investigate how XLD responds in different drought classification sub-regions (Table 3) to practical and theoretically effective rules (PSO-RO and OWSRS) or to additional rules that have undergone simple adjustments. Future research can build on the existing work to explore this issue in more depth.

Author Contributions

All authors contributed to the study’s conception and design. D.J.: Writing—original draft preparation, conceptualization, methodology, and software. X.L.: Conceptualization, methodology, reviewing, and editing. Y.N.: Methodology, software, and editing. S.C.: Software, formal analysis, and investigation. Y.H.: Visualization and investigation. S.Z.: Reviewing. All authors have read and agreed to the published version of the manuscript.

Funding

This work was funded by the Flood Evolution and Adaptive Regulation of Typical Watersheds in High Flood Areas under Uncertainty Conditions (HK2024000049). Natural Science Foundation of Hebei Province, China (E2023402016, E2024402052 and E2020402087) and the Science and Technology Project of Hebei Education Department (BJ2025132).

Data Availability Statement

Data are contained within the article.

Conflicts of Interest

The authors declare no conflicts of interest.

References

  1. Wilhite, D.A.; Glantz, M.H. Understanding the drought phenomenon: The role of definitions. Water Int. 1985, 10, 111–120. [Google Scholar] [CrossRef]
  2. Zseleczky, L.; Yosef, S. Are Shocks Really Increasing? A Selective Review of the Global Frequency, Severity, Scope, and Impact of Five Types of Shocks; International Food Policy Research Institute: Washington, DC, USA, 2014; p. 5. [Google Scholar]
  3. Sivapalan, M. Debates—Perspectives on sociohydrology: Changing water systems and the “tyranny of small problems”. Water Resour. Res. 2015, 51, 4795–4805. [Google Scholar] [CrossRef]
  4. Mehran, A.; Mazdiyasni, O.; AghaKouchak, A. A hybrid framework for assessing socioeconomic drought: Linking climate variability, local resilience, and demand. J. Geophys. Res. Atmos. 2015, 120, 7520–7533. [Google Scholar] [CrossRef]
  5. Al-Faraj, F.A.M.; Al-Dabbagh, B.N.S. Assessment of collective impact of upstream watershed development and basin-wide successive droughts on downstream flow regime: The Lesser Zab transboundary basin. J. Hydrol. 2015, 530, 419–430. [Google Scholar] [CrossRef]
  6. Qu, J.; Qin, C.; Chang, J.; Zhao, Y.; Wang, H.; He, F. Impact of water transfer on socioeconomic drought in China: A new approach based on production and consumption. Agric. Water Manag. 2025, 308, 109291. [Google Scholar] [CrossRef]
  7. Meng, F.; Liu, S.; Han, Z.; Wang, Y.; Wu, R.; Shi, H. A new perspective on socioeconomic drought: A distributed and standardized index. Environ. Res. Lett. 2025, 20, 034047. [Google Scholar] [CrossRef]
  8. Tela, Y.T.; Wassie, S.B.; Ferede, M.B. Assessment of meteorological and socioeconomic drought conditions in the Tekeze watershed, northern Ethiopia. Front. Environ. Sci. 2024, 12, 1506883. [Google Scholar] [CrossRef]
  9. Hao, Z.C.; AghaKouchak, A. Multivariate Standardized Drought Index: A parametric multi-index model. Adv. Water Resour. 2013, 57, 12–18. [Google Scholar]
  10. Huang, S.Z.; Huang, Q.; Leng, G.Y.; Liu, S.Y. A nonparametric multivariate standardized drought index for characterizing socioeconomic drought: A case study in the Heihe River Basin. J. Hydrol. 2016, 542, 875–883. [Google Scholar] [CrossRef]
  11. Shi, H.Y.; Chen, J.; Wang, K.Y.; Niu, J. A new method and a new index for identifying socioeconomic drought events under climate change: A case study of the East River basin in China. Sci. Total Environ. 2017, 616, 363–375. [Google Scholar] [CrossRef]
  12. Wang, J.Y.; Li, Z.; Chen, Y.N. The spatiotemporal evolution of socioeconomic drought in the Arid Area of Northwest China based on the Water Poverty Index. J. Clean. Prod. 2023, 401, 136719. [Google Scholar] [CrossRef]
  13. Guo, Y.; Huang, S.Z.; Huang, Q.; Leng, G.Y.; Zheng, X.D.; Fang, W.; Deng, M.J.; Song, S.B. Elucidating the effects of mega reservoir on watershed drought tolerance based on a drought propagation analytical method. J. Hydrol. 2021, 598, 125738. [Google Scholar]
  14. Kundu, A.; Dutta, D.; Patel, N.R.; Denis, D.M.; Chattoraj, K.K. Evaluation of Socio-Economic Drought Risk over Bundelkhand Region of India using Analytic Hierarchy Process (AHP) and Geo-Spatial Techniques. J. Indian Soc. Remote Sens. 2021, 49, 1365–1377. [Google Scholar] [CrossRef]
  15. Guo, Y.; Huang, S.Z.; Huang, Q.; Wang, H.; Wang, L.; Fang, W. Copulas-based bivariate socioeconomic drought dynamic risk assessment in a changing environment. J. Hydrol. 2019, 575, 1052–1064. [Google Scholar] [CrossRef]
  16. Wang, T.; Tu, X.; Singh, V.P.; Chen, X.; Lin, K.; Zhou, Z.; Tan, Y. Assessment of future socioeconomic drought based on CMIP6: Evolution, driving factors and propagation. J. Hydrol. 2023, 617, 129009. [Google Scholar] [CrossRef]
  17. Wang, T.; Tu, X.; Singh, V.P.; Chen, X.; Lin, K.; Zhou, Z.; Tan, Y. A CMIP6-based framework for propagation from meteorological and hydrological droughts to socioeconomic drought. J. Hydrol. 2023, 623, 129782. [Google Scholar] [CrossRef]
  18. Zhao, M.L.; Huang, S.Z.; Huang, Q.; Wang, H.; Leng, G.Y.; Xie, Y.Y. Assessing socio-economic drought evolution characteristics and their possible meteorological driving force. Geomat. Nat. Hazards Risk 2019, 10, 1084–1101. [Google Scholar] [CrossRef]
  19. Shiklomanov, I.A.; Shiklomanov, A.I.; Lammers, R.B.; Peterson, B.J.; Vorosmarty, C.J. The dynamics of river water inflow to the Arctic Ocean. In The Freshwater Budget of the Arctic Ocean; Springer: Dordrecht, The Netherlands, 2000; pp. 281–296. [Google Scholar]
  20. Guo, Y.; Huang, S.Z.; Huang, Q.; Wang, H.; Fang, W.; Yang, Y.Y.; Wang, L. Assessing socioeconomic drought based on an improved Multivariate Standardized Reliability and Resilience Index. J. Hydrol. 2019, 568, 904–918. [Google Scholar] [CrossRef]
  21. Tu, X.; Wu, H.; Singh, V.P.; Chen, X.; Lin, K.; Xie, Y. Multivariate design of socioeconomic drought and impact of water reservoirs. J. Hydrol. 2018, 566, 192–204. [Google Scholar] [CrossRef]
  22. Lu, Y.; Yan, D.; Qin, T.; Song, Y.; Weng, B.; Yuan, Y.; Dong, G. Assessment of Drought Evolution Characteristics and Drought Coping Ability of Water Conservancy Projects in Huang-Huai-Hai River Basin, China. Water 2016, 8, 378. [Google Scholar] [CrossRef]
  23. Pourmoghim, P.; Behboudian, M.; Kerachian, R. An uncertainty-based framework for evaluating and improving the long-term resilience of lakes under anthropogenic droughts. J. Environ. Manag. 2022, 301, 113900. [Google Scholar] [CrossRef]
  24. Wang, Y.; Yang, J.; Chang, J.; Zhang, R. Assessing the drought mitigation ability of the reservoir in the downstream of the Yellow River. Sci. Total Environ. 2019, 646, 1327–1335. [Google Scholar] [CrossRef] [PubMed]
  25. Shah, D.; Zhao, G.; Li, Y.; Singh, V.P.; Gao, H. Assessing global reservoir-based hydrological droughts by fusing storage and evaporation. Geophys. Res. Lett. 2024, 51, e2023GL106159. [Google Scholar] [CrossRef]
  26. Wang, G.; Pan, T.; Yan, D.; Qi, J.; Liu, S.; Zhao, J. Study on Drought Coping Ability Assessment of Hydraulic Engineering Projects: Quantitative Evaluation Method and a Case Study on Zhangwei River Basin. J. Catastrophol. 2015, 30, 56–63. [Google Scholar]
  27. Karamouz, M.; Araghinejad, S. Drought Mitigation through Long-Term Operation of Reservoirs: Case Study. J. Irrig. Drain. Eng. 2008, 134, 471–479. [Google Scholar] [CrossRef]
  28. SaberChenari, K.; Abghari, H.; Tabari, H. Application of PSO algorithm in short-term optimization of reservoir operation. Environ. Monit. Assess. 2016, 188, 667. [Google Scholar] [CrossRef]
  29. Cui, G.; Qi, Z.; Zhao, H.; Zhao, R.; Wang, H.; Zhao, J. Application of F-HGAPSO Algorithm in Reservoir Flood Control Optimal Operation. Water Resour. Manag. 2025, 39, 1763–1782. [Google Scholar] [CrossRef]
  30. Zhao, Q.; Cai, X.; Li, Y. Algorithm Design Based on Derived Operation Rules for a System of Reservoirs in Parallel. J. Water Resour. Plan. Manag. 2019, 146, 04020024. [Google Scholar] [CrossRef]
  31. Luo, C.; Ding, W.; Zhang, C.; Yang, X. Exploiting Multiple Hydrologic Forecasts to Inform Real-Time Reservoir Operation for Drought Mitigation. J. Hydrol. 2023, 618, 129232. [Google Scholar] [CrossRef]
  32. Wang, H.; Liu, J. Reservoir Operation Incorporating Hedging Rules and Operational Inflow Forecasts. Water Resour. Manag. 2013, 27, 1427–1438. [Google Scholar] [CrossRef]
  33. Hu, T.; Zhang, X.-Z.; Zeng, X.; Wang, J. A Two-Step Approach for Analytical Optimal Hedging with Two Triggers. Water 2016, 8, 52. [Google Scholar] [CrossRef]
  34. Spiliotis, M.; Mediero, L.; Garrote, L. Optimization of Hedging Rules for Reservoir Operation During Droughts Based on Particle Swarm Optimization. Water Resour. Manag. 2016, 30, 5759–5778. [Google Scholar] [CrossRef]
  35. Xu, B.; Zhong, P.-A.; Huang, Q.; Wang, J.; Yu, Z.; Zhang, J. Optimal Hedging Rules for Water Supply Reservoir Operations under Forecast Uncertainty and Conditional Value-at-Risk Criterion. Water 2017, 9, 568. [Google Scholar] [CrossRef]
  36. Soleimani, S.; Bozorg-Haddad, O.; Loáiciga, H.A. Reservoir Operation Rules with Uncertainties in Reservoir Inflow and Agricultural Demand Derived with Stochastic Dynamic Programming. J. Irrig. Drain. Eng. 2016, 142, 04016038. [Google Scholar] [CrossRef]
  37. Ge, Q.; Gu, S.; Wang, L.; Chen, G.; Chen, J. Optimal Determination and Dynamic Control Analysis of the Graded and Staged Drought Limit Water Level of Typical Plateau Lakes. Water 2023, 15, 2580. [Google Scholar] [CrossRef]
  38. Zhang, L.; Kang, C.; Wu, C.; Yu, H.; Jin, J.; Zhou, Y.; Zhou, T. Optimization of Drought Limited Water Level and Operation Benefit Analysis of Large Reservoir. Water Resour. Manag. 2022, 36, 4677–4696. [Google Scholar] [CrossRef]
  39. Ding, W.; Bao, A.; Lin, J.; Luo, C.; Cao, H.; Zhang, D. Drought Mitigation Operation of Water Conservancy Projects under Severe Droughts. Hydrol. Res. 2024, 55, 759–774. [Google Scholar] [CrossRef]
  40. He, S.; Wang, D.; Sang, X.; Niu, G. Water Resource Regulation and Evaluation Method Based on Optimization of Drought-Limited Water Level in Reservoir Group. Sustainability 2024, 16, 7015. [Google Scholar] [CrossRef]
  41. Feng, K.; Siu, Y.L.; Guan, D.; Hubacek, K. Assessing regional virtual water flows and water footprints in the Yellow River Basin, China: A consumption-based approach. Appl. Geogr. 2012, 32, 691–701. [Google Scholar]
  42. Pei, Y.; Qiao, X. Analysis of the impact of inflow and water usage on the flow interruption of the lower Yellow River. People’s Yellow River 1997, 19, 1–5. [Google Scholar]
  43. Shiau, J.-T.; Feng, S.; Nadarajah, S. Assessment of hydrological droughts for the Yellow River, China, using copulas. Hydrol. Process. 2007, 21, 2157–2163. [Google Scholar] [CrossRef]
  44. Sklar, A. Fonctions de répartition à marges données. Publ. Inst. Statist. Univ. Paris 1959, 8, 229–231. [Google Scholar]
  45. Liang, Z.; Wang, X.; Li, J.; Chang, W.; Li, A.; Hu, Y. Study of quantitative calculation of drought resistance capacity. J. Hohai Univ. Nat. Sci. 2014, 42, 471–475. [Google Scholar]
  46. Lan, Y.C.; Kang, E.S.; Ma, Q.J.; Zhang, J.S. Study on trend prediction and variation on the flow into the longyangxia reservoir. Chin. Geograph. Sci. 2001, 11, 35–41. [Google Scholar] [CrossRef]
  47. Jin, J.; Fei, Z.; Li, J.; Zhou, Y. Method for evaluating the regional drought resistance ability based on the analysis of water balance between supply and demand with different water frequencies. J. Hydraul. Eng. 2013, 44, 687–693. [Google Scholar]
Figure 1. Technical lines of this study.
Water 17 01002 g001
Figure 2. Overview of the study region.
Water 17 01002 g002
Figure 3. Particle swarm optimization reservoir scheduling model.
Water 17 01002 g003
Figure 4. Frame of water supply strategy restriction.
Water 17 01002 g004
Figure 5. Multi-scale socio-economic drought indices and truncation levels.
Water 17 01002 g005
Figure 6. Multi-scale socio-economic drought characteristics (duration and severity).
Water 17 01002 g006
Figure 7. Joint recurrence period of socio-economic drought at multiple time scales.
Water 17 01002 g007aWater 17 01002 g007b
Figure 8. Relationship curves between inflow frequency during drought periods and drought recurrence periods at SJDIs.
Water 17 01002 g008
Figure 9. Comparison of drought resistance capacity in pre-XLD, PSO-optimized reservoir scheduling, and reservoir scheduling with water supply restriction strategies.
Water 17 01002 g009
Table 1. Monthly water demand of downstream users in the DYRB (unit: 100 million cubic meters/month).
UsersJulyAugustSeptemberOctoberNovemberDecemberJanuaryFebruaryMarchAprilMayJune
XLD to HYK3.013.712.173.452.381.821.821.822.975.344.783.01
HYK to GC0.20.180.10.260.260.070.040.10.40.670.420.2
GC to AS3.244.052.14.864.572.052.042.196.489.065.593.24
AS to LJ0.10.090.050.130.130.030.020.050.20.340.210.1
Estuary0.060.050.020.080.080.0100.020.130.220.140.06
Total6.618.084.448.787.423.983.924.1810.1815.6311.146.61
Table 2. Parameter settings of the PSO algorithm.
Algorithm ParametersPSO
Maximum number of iterations1500
Population size (swarm size)500
Inertia weight1.05
Inertia weight damping ratio0.99
Personal learning coefficient2.0
Global learning coefficient2.0
Table 3. The basic characteristics of the XLD.
Basic CharacteristicsXLD
Normal water level (m)275
Flood limit level (m)235 (main flood season) 248 (secondary flood season)
Dead water level (m)230
Total storage capacity (108 m3)126.5
Regulating storage capacity (108 m3)51
Installed capacity (MW)1800
Guaranteed output (MW)354
Table 4. Socio-economic drought severity zones (from mild to severe).
SJDIsIIIIIIIVV
SJDI3(1, 37.4](37.4, 73.8](73.8, 110.2](110.2, 146.6](146.6, 183]
SJDI6(1, 22.1](22.1, 43.2](43.2, 64.3](64.3, 85.4](85.4, 106.5]
SJDI9(1, 21.6](21.6, 42.2](42.2, 62.8](62.8, 83.4](83.4, 104]
SJDI12(1, 15.7](15.7, 30.4](30.4, 45.2](45.2, 59.9](59.9, 74.6]
Table 5. Pre-XLD, PSO-RO, and OWSRS water supply, and RDI during socio-economic drought events at four time scale indices.
YearsMonthsDurationWater Supply (Million m3)Water Demand (Million m3)RDI
Pre-XLDPSO-ROOWSRS Pre-XLDPSO-ROOWSRS
SJDI319579869227028783878430.8820.8960.999
19603769916980712073550.9510.9490.968
19611313491511151115110.8931.0001.000
19658455955724626862680.8930.9131.000
19664551165229523352330.9780.9991.000
19697989459483967699550.8990.9530.972
19713889358979898389830.9951.0001.000
197291079858545926497650.8180.8750.949
19742664696566656665660.9851.0001.000
197710540754664515451540.7910.9051.000
19796336703670367036701.0001.0001.000
198031191349156938993890.9730.9751.000
19869863756821695074680.8540.9130.931
19879859876214745274680.8020.8320.998
19901227218268268440.8540.9780.978
19919745754745574666010.6930.7190.870
199311212071989198919990.6040.9950.995
199491512,03612,58713,53014,1120.8530.8920.959
19969648765378568759420.8210.9050.957
199810221032599265532040.6560.8110.829
1999102923,81625,00327,78029,0940.8190.8590.955
200291286388810938411,8340.7300.7440.793
20086567616669676167611.0000.9861.000
20091312721511151115110.8421.0001.000
201010747184827537858340.8090.8270.922
201311315302225222524200.6320.9190.919
SJDI6195771312,35012,56413,37413,3790.9230.9391.000
196031312,10112,56412,70412,9390.9350.9710.982
19627576667681781378130.9810.9831.000
19698980598597879090690.8890.9480.969
1972101185919156987010,3710.8280.8830.952
19746784038665876087600.9590.9891.000
19796336703670367036701.0001.0001.000
198061212,28512,81813,04813,0480.9410.9821.000
198612633473448344834970.9570.9860.986
198712633803481348134970.9660.9950.995
1994102015,55817,02317,95418,5350.8390.9180.969
1996121813,76114,26915,44317,3160.7950.8240.892
200022821,91122,39724,89726,3210.8320.8510.946
200291310,10010,27210,84613,2970.7600.7730.816
20046987169585958596120.9070.9970.997
2006710947610,65010,65010,6510.8901.0001.000
20086885259023918191810.9290.9831.000
20111529112837307430740.9470.9231.000
SJDI9195771312,35012,56413,37413,3790.9230.9391.000
196051110,16610,79110,93110,9670.9270.9840.997
196210230573080320432040.9540.9611.000
196512970407162716771670.9820.9991.000
196910856916237642267010.8490.9310.958
19716683378337833783371.0001.0001.000
1972111190259237970410,2060.8840.9050.951
19747993789653974897480.9620.9901.000
19782423622517251725170.9381.0001.000
198071414,19014,74814,98014,9800.9470.9851.000
19873322222222222222221.0001.0001.000
19883427462746274627461.0001.0001.000
199111957976237628771420.8120.8730.880
199511814,65715,68316,26216,4530.8910.9530.988
199722217,42817,83219,00620,8790.8350.8540.910
200034132,87833,53636,84040,7880.8060.8220.903
20047988529721972197480.9080.9970.997
200671110,13511,30911,30911,3110.8961.0001.000
2008710995910,45610,61510,6150.9380.9851.000
SJDI12195771312,35012,56413,37413,3790.9230.9391.000
196061211,03311,65811,79811,8340.9320.9850.997
19716891819181918191811.0001.0001.000
1972121211,29611,60711,83411,8340.9550.9811.000
19749977718069816481640.9520.9881.000
19785443664366436643661.0001.0001.000
198091211,04311,60211,83411,8340.9330.9801.000
19886220692069206920691.0001.0001.000
199534235,58237,40939,25041,5360.8570.9010.945
200034538,01738,80942,11246,0610.8250.8430.914
200410963297198719872250.8760.9960.996
2006101075958769876987700.8661.0001.000
20117231473147314731471.0001.0001.000
Table 6. Drought recurrence period and frequency of corresponding dry water for typical droughts of the socio-economic drought index at each time scale.
SJDIsDrought YearJRPsIFs
SJDI3199959.30.97
19949.60.77
SJDI6200049.90.97
199612.00.91
19949.60.89
SJDI9200045.00.98
199711.70.93
SJDI12200045.10.94
199534.50.90
Table 7. Maximum RDI of socio-economic drought at different time scales corresponding to drought period water frequency and corresponding joint recurrence period.
Pre-XLDPSO-ROOWSRS
IFMJRPMIFMJRPMIFMJRPM
SJDI30.704.80.8012.30.8621.5
SJDI60.571.70.772.150.854.5
SJDI90.653.10.694.60.813.8
SJDI120.542.30.644.80.7712.7
Disclaimer/Publisher’s Note: The statements, opinions and data contained in all publications are solely those of the individual author(s) and contributor(s) and not of MDPI and/or the editor(s). MDPI and/or the editor(s) disclaim responsibility for any injury to people or property resulting from any ideas, methods, instructions or products referred to in the content.

