Communication

Experimental Investigation on the Influence of Different Reservoir Water Levels on Landslide-Induced Impulsive Waves

1
PowerChina Huadong Engineering Corporation Limited, Hangzhou 311122, China
2
Key Laboratory of Ministry of Education for Geomechanics and Embankment Engineering, Hohai University, Nanjing 210098, China
3
Research Institute of Geotechnical Engineering, Hohai University, Nanjing 210098, China
*
Author to whom correspondence should be addressed.
Water 2025, 17(6), 890; https://doi.org/10.3390/w17060890
Submission received: 22 January 2025 / Revised: 4 March 2025 / Accepted: 18 March 2025 / Published: 19 March 2025

Abstract

:
Since the impoundment of the Baihetan Reservoir, water-involved landslides have become widespread. Existing studies on landslide-generated waves have rarely examined the impact of varying water levels on wave characteristics. This paper focuses on the Wangjiashan (WJS) landslide in the Baihetan Reservoir area of China, conducting geomechanical experiments to investigate the spatiotemporal evolution of landslide-generated waves under different water level conditions. Utilizing a self-developed experimental measurement system, this study accurately records key parameters during the generation, propagation, and run-up of landslide-generated waves. It captures the complete sliding process of the WJS landslide under various water level conditions and elucidates the spatiotemporal distribution patterns of waves throughout their entire lifecycle, from generation through propagation to run-up. The research results indicate that water level factors significantly influence key parameters such as initial wave height, run-up on the opposite bank, propagation characteristics along the course, and maximum run-up in the Xiangbiling residential area. Generally, wave height initially increases and then decreases as the water level drops. Furthermore, this study offers crucial experimental data to deepen the understanding of the physical mechanisms of landslide-generated waves, advancing landslide disaster early warning technologies and enhancing the scientific accuracy and precision of landslide risk management.

1. Introduction

The issue of landslide instability in reservoir areas has always been an important risk in the construction and operation of reservoirs, particularly during reservoir water level regulation. Since the impoundment of the Three Gorges Reservoir, more than 5000 new or reactivated landslide events have occurred in the Three Gorges Reservoir area [1,2,3,4], with fluctuations in water levels identified as the primary trigger for the initiation of new landslides and reactivation of old ones [5,6,7,8,9]. For example, the Wuli Slope Deformation Body [10,11], the Gongjia Village Landslide [7], and the Bazimen Landslide [12] are all closely related to fluctuations in reservoir water levels. Among the reactivated landslide deformations, both new landslides and the reactivation of ancient landslides have been observed [13,14]. On 9 October 1963, a catastrophic landslide occurred in the left-bank valley area of Italy’s Vajont Reservoir, where nearly 270 million cubic meters of soil and rock slid into the reservoir, triggering large-scale waves that submerged five surrounding towns and caused approximately 2000 fatalities. A large number of nascent landslides and bank failures were centrally generated in the Three Gorges Reservoir area within 3 to 5 years after the storage of water in the newly constructed reservoirs in 2012 to the initial period of high water level. The landslides were mainly in the Wanzhou to Wushan section of Chongqing. In Yunyang County, 16 people have been killed and 16 are unaccounted for as a result of landslide flash flooding. This tragedy remains one of the deadliest recorded landslide disasters in Europe [15,16,17,18]. This event sparked widespread global concern regarding the risks of reservoir-generated landslides and their associated wave hazards.
With the ongoing construction of hydropower stations worldwide, especially in the Jinsha River Basin in China, the issue of reservoir landslides has gradually become an important research area [19,20,21]. On 31 May 1970, the Yungay landslide [22] in Peru, in which 50–10 million m3 of debris, ice, and rocks slid downhill, killed 22,000 people and destroyed entire villages. On 23 November 2008, Gongjiafang landslide [23], located in the Three Gorges Reservoir area of the Yangtze River main stream Wuxia section of the landslide destabilization, released a volume of about 380,000 m3 of soil and rock, with a maximum movement speed of about 11.6 m/s fast into the reservoir, stirring up huge surges, resulting in a maximum height of 31.8 m surges, resulting in economic losses amounting to more than CNY 800 million. On 13 June 2009, in Yunnan Province, China, a large-scale landslide occurred at Xiaowan Hydropower Station in Arakan [24], causing partial siltation of the reservoir, although there were no casualties. The Baihetan Hydropower Station, located between Ningnan County in Liangshan Prefecture, Sichuan Province, and Qiaojia County in Zhaotong City, Yunnan Province, is the second hydropower station on the main stem of the Jinsha River. With a planned installed capacity of 16,000 MW, it is the second largest hydropower station in China, after the Three Gorges Dam. Since the phased impoundment commenced in April 2021, the Baihetan Reservoir area has experienced frequent landslides, many of which have exhibited rapid deformation and signs of instability. Among these, the WJS landslide is the most active and hazardous in the region. The regulation of reservoir water levels, which triggers landslide instability, has remained a critical issue affecting the safety of the reservoir area [25,26,27]. Therefore, systematically studying the impact of landslide instability under different reservoir water level conditions on wave generation is of vital importance for landslide risk assessment, prevention, and control [28,29,30].
In order to study the effects of different water levels on the key surge parameters of the Wangjiashan landslide as well as the spatial and temporal evolution of the surge, a large-scale three-dimensional geomechanical model was established based on the WJS landslide in the Baihetan reservoir area, and physical modeling experiments were carried out to test the waves generated by the WJS landslide. Under different water level conditions, the spatiotemporal evolution of the WJS landslide-generated impulsive waves was explored, and the influence of water level on key impulsive wave parameters was clarified. The findings provide scientific guidance for landslide early warning and prevention, as well as for the rational regulation of reservoirs in similar areas in the future.

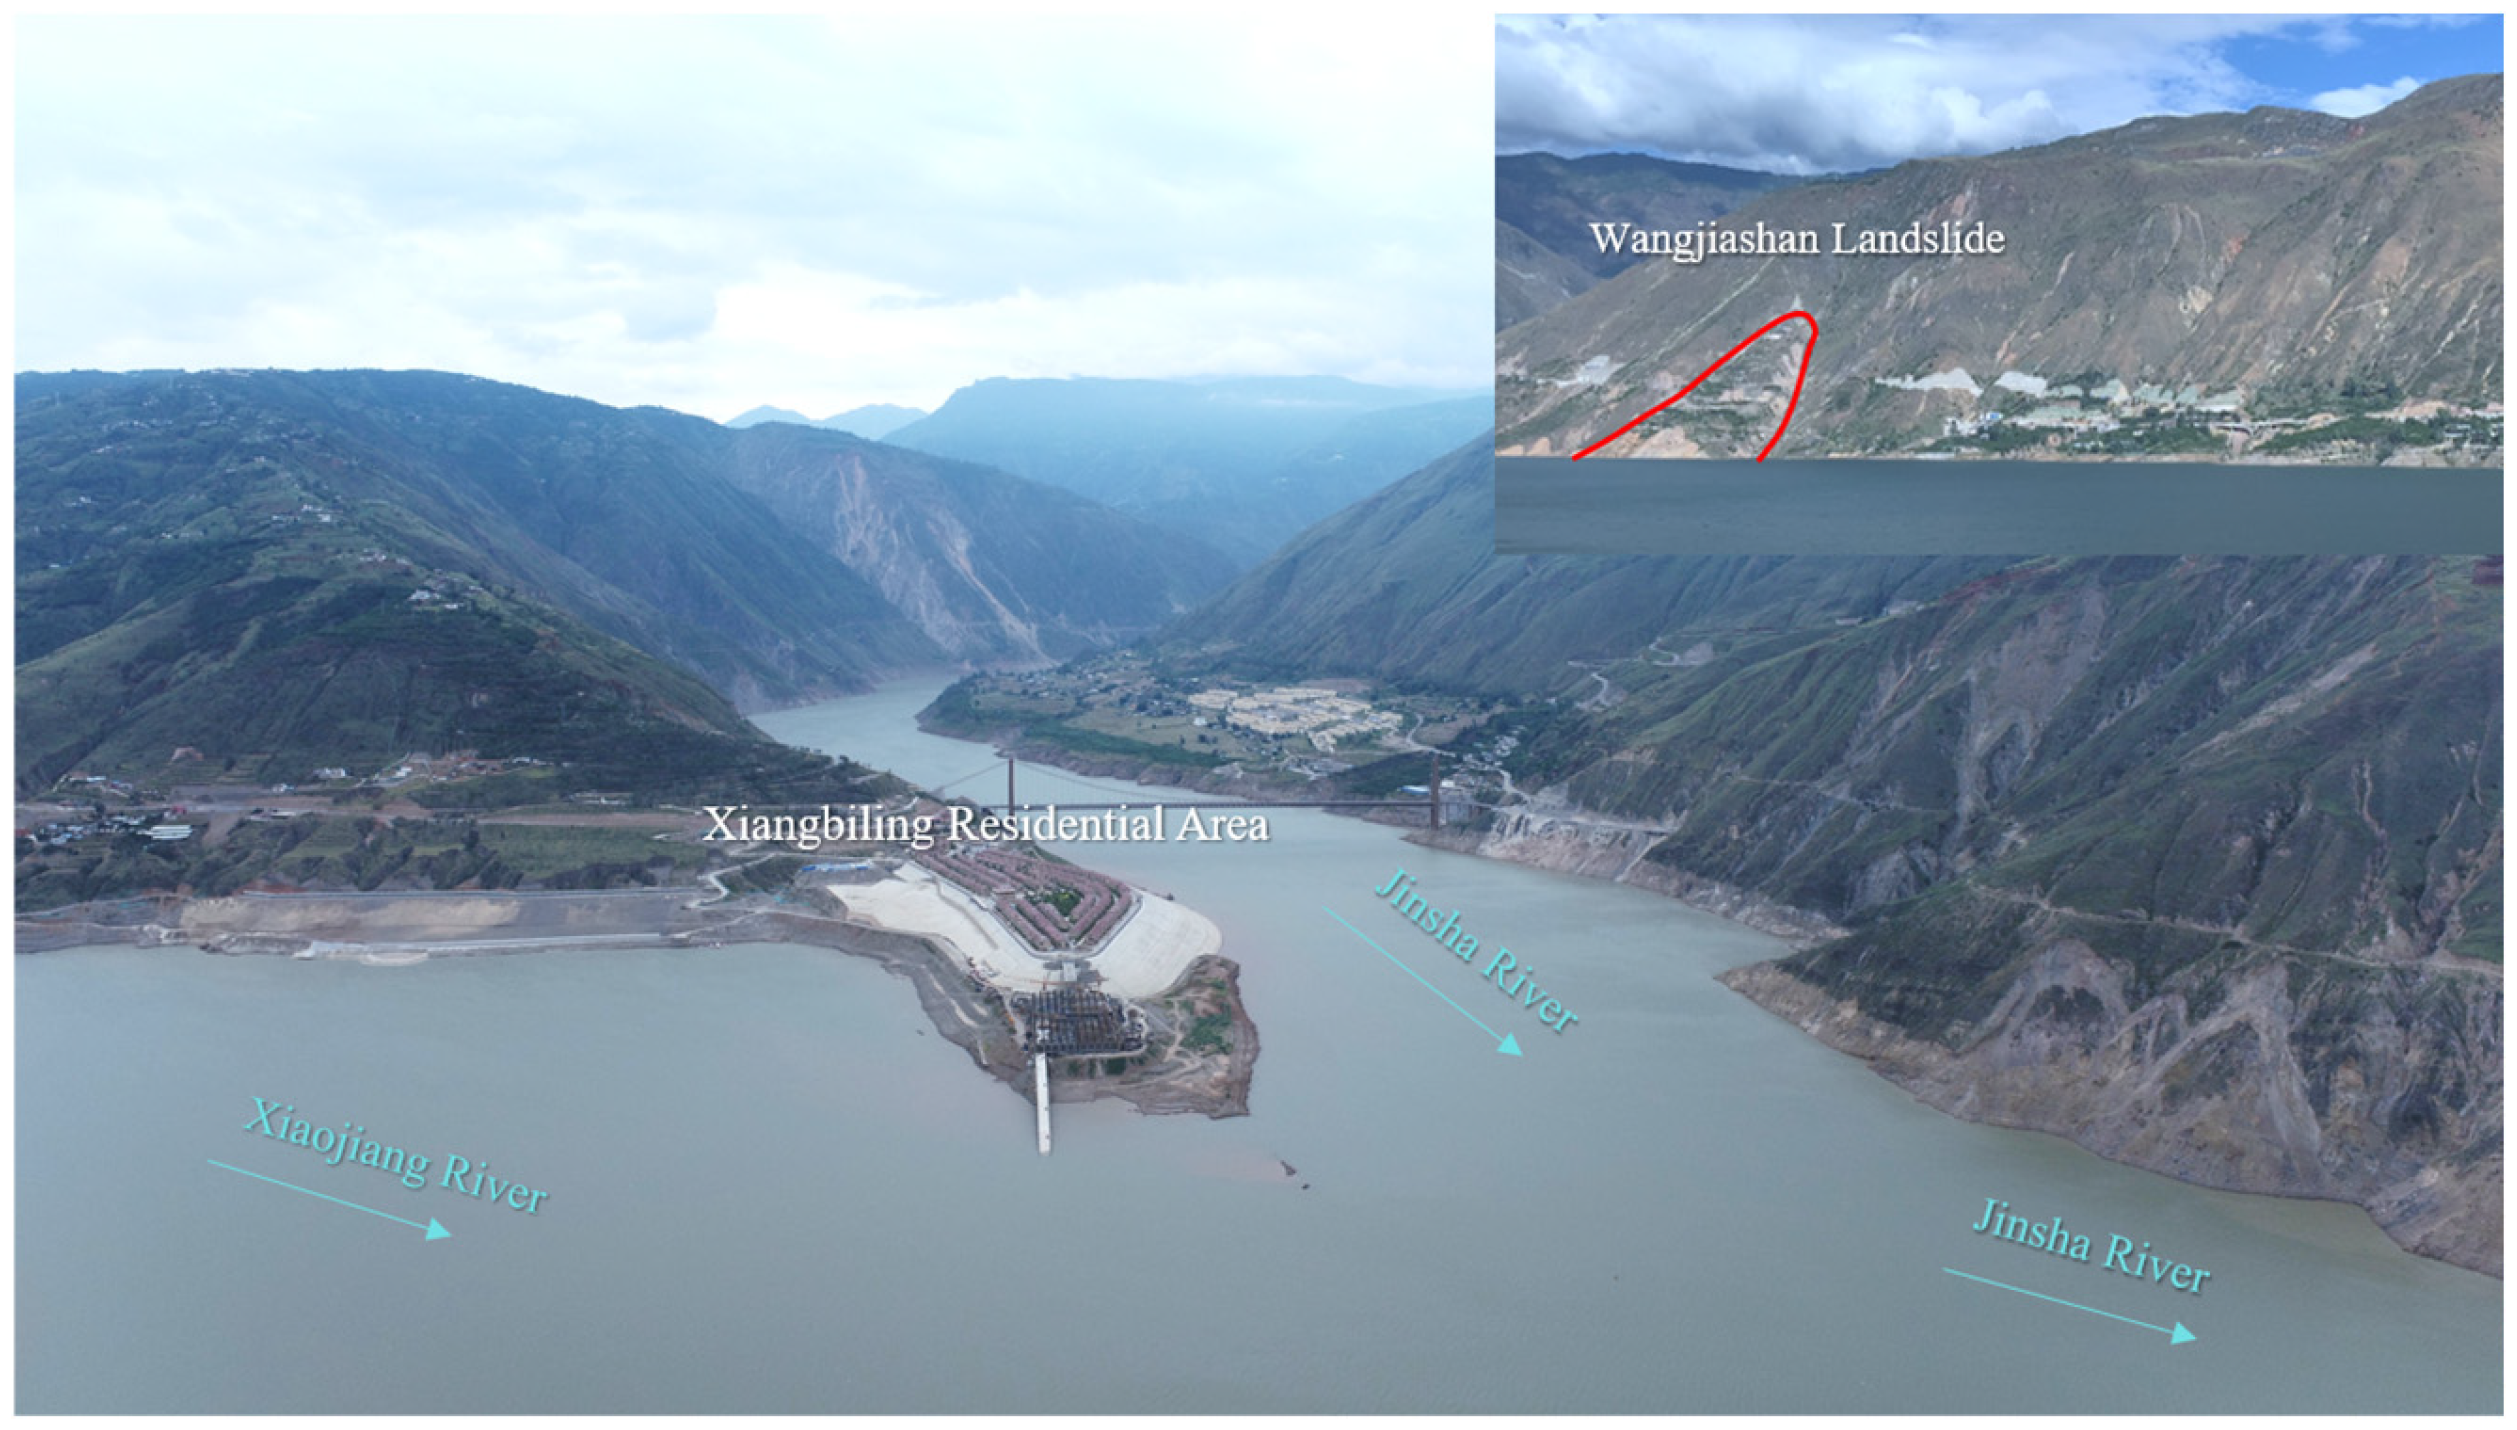
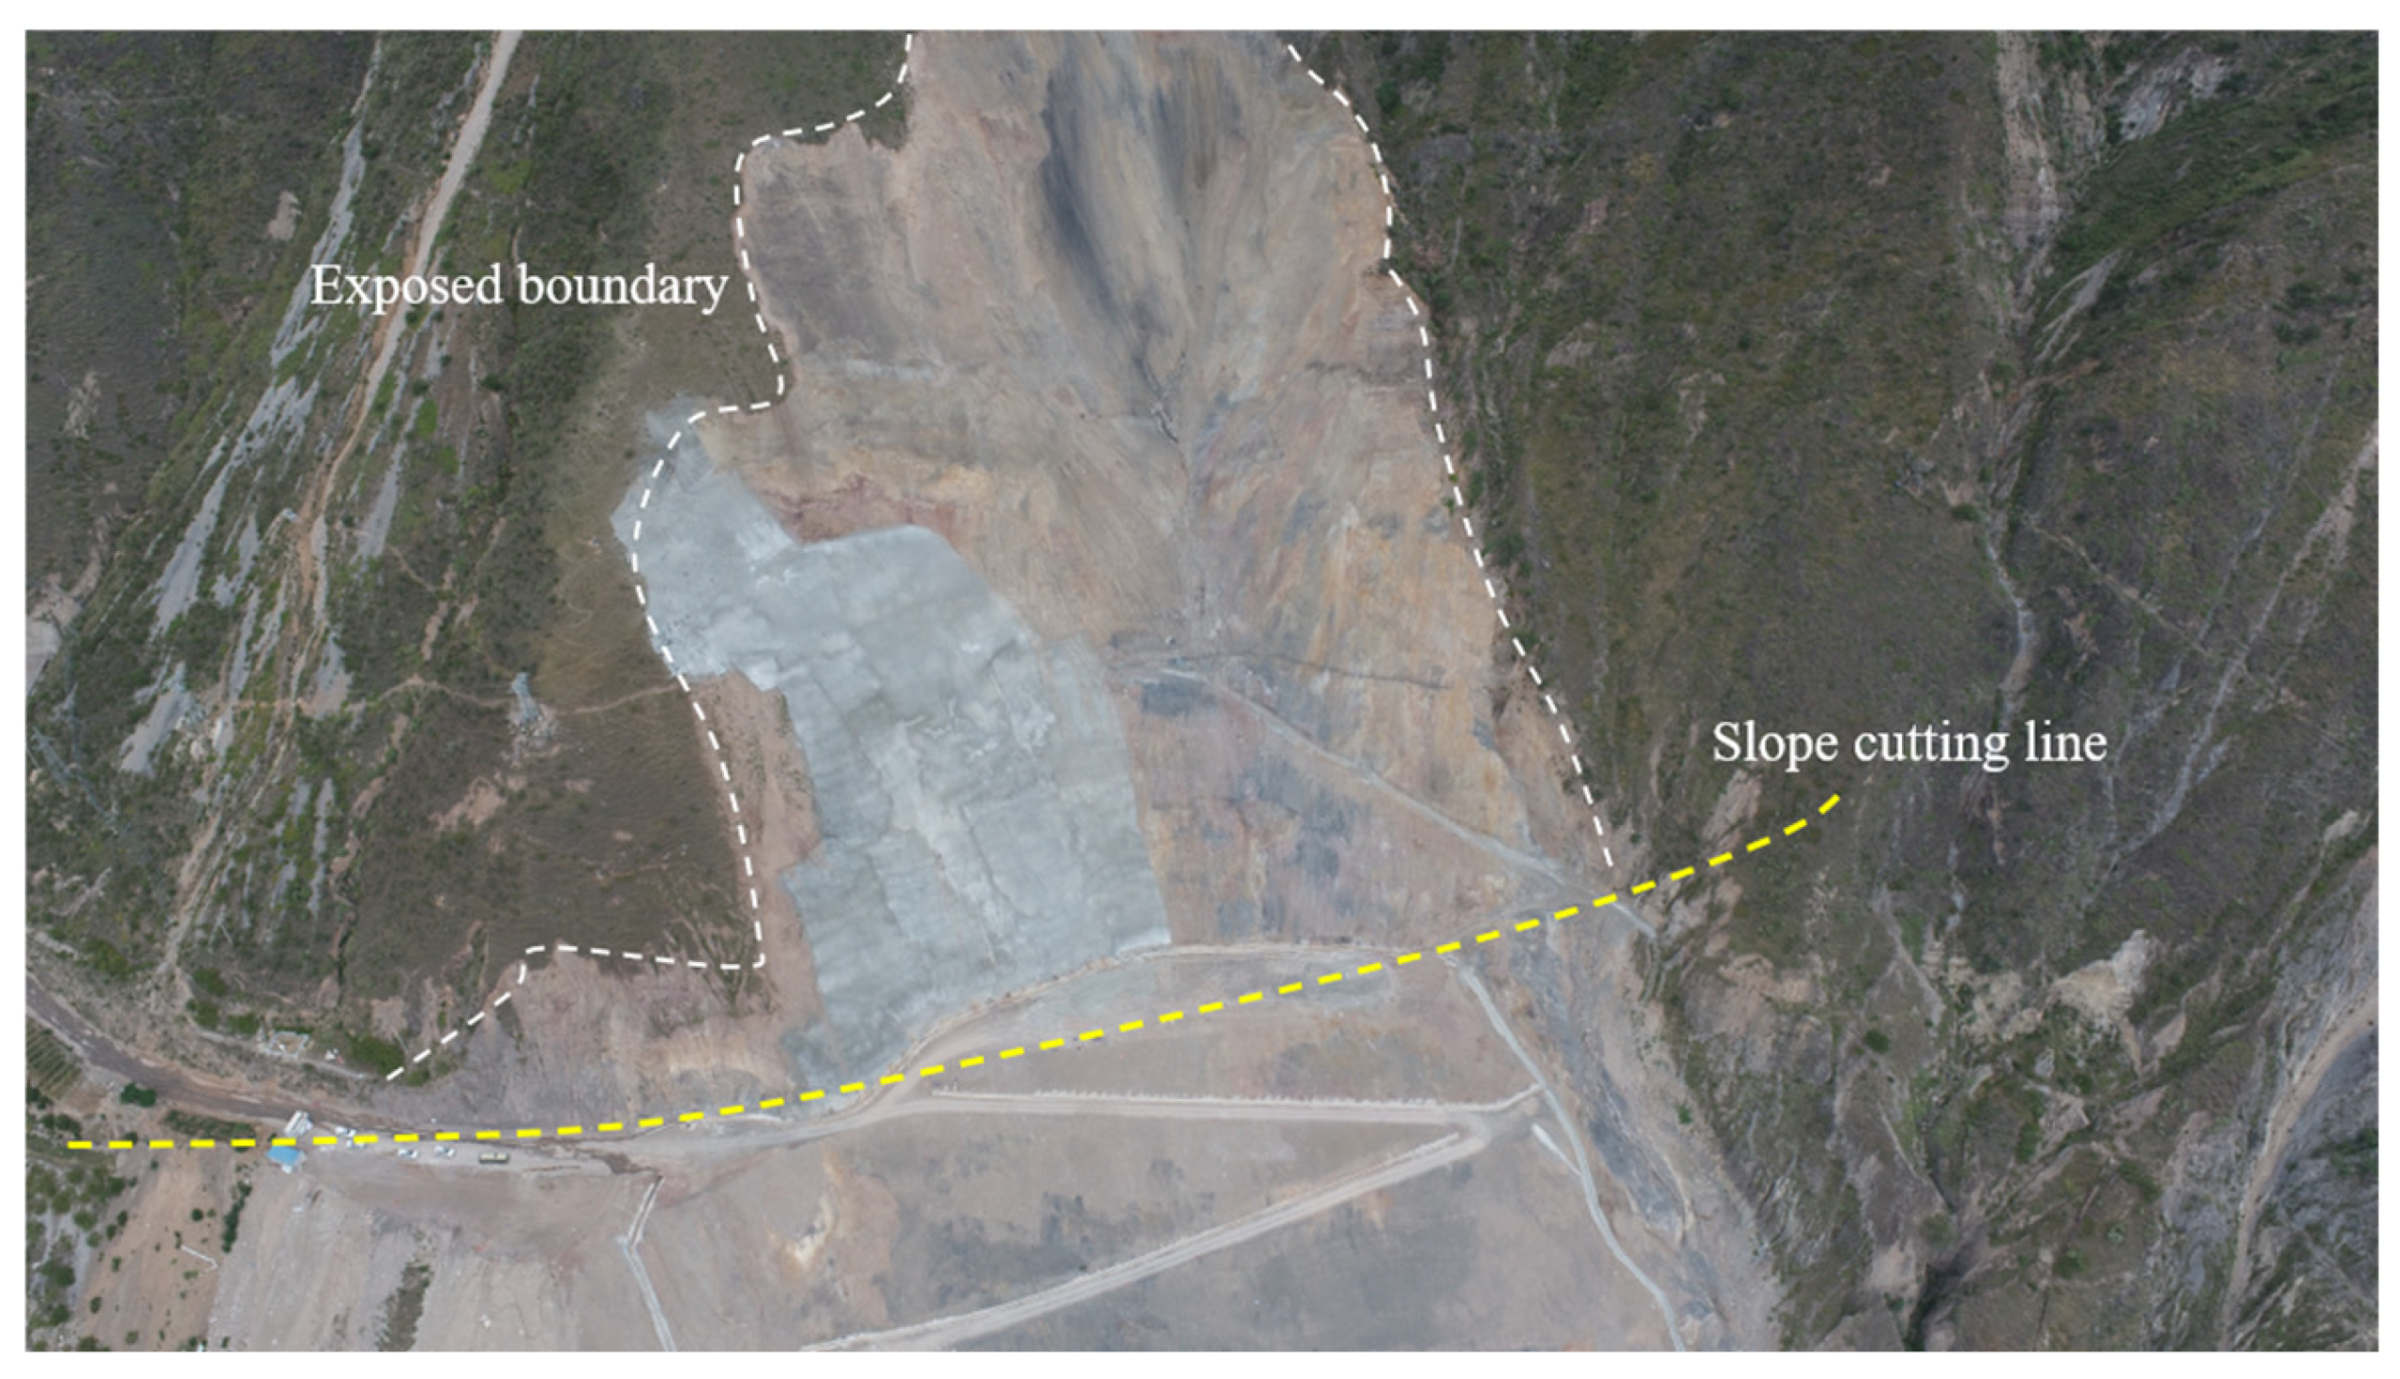
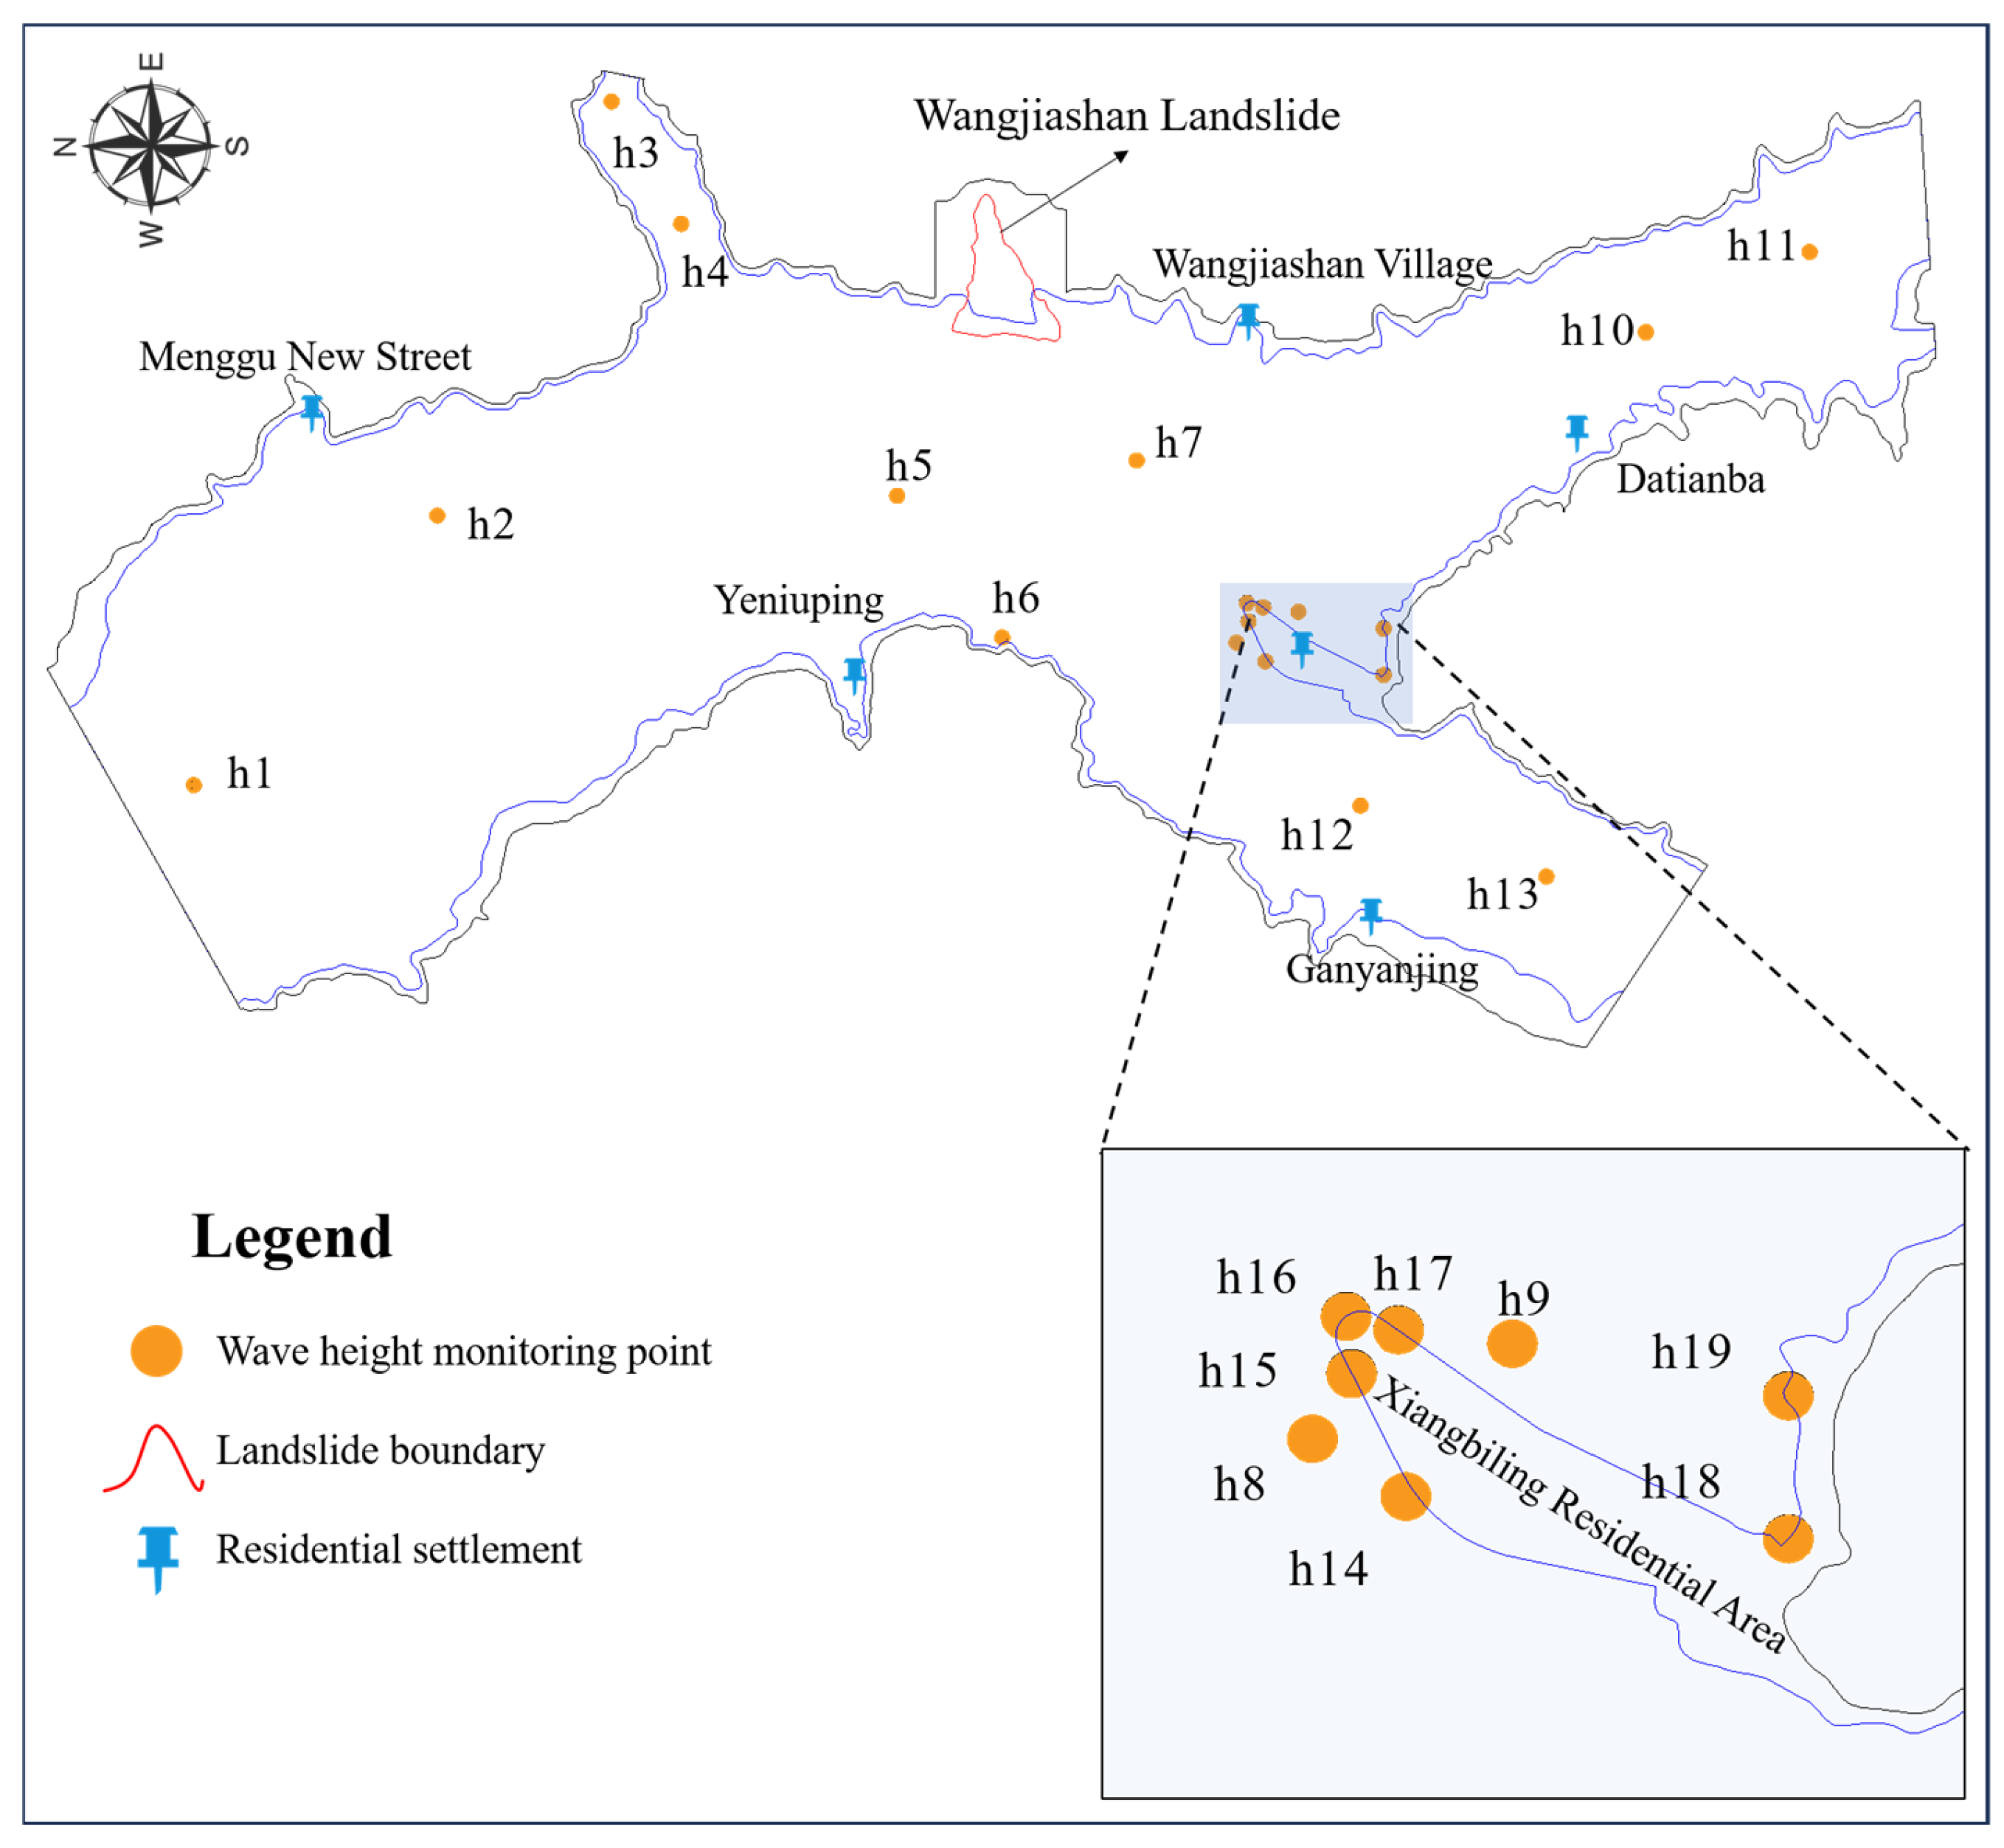
2. Overview of the WJS Landslide

The WJS landslide is located upstream of the Baihetan Hydropower Station reservoir, at the confluence of the Jinsha River and the Xiaojiang River. It is 92.4 km from the dam site and 1.3 km in a straight line from the Xiangbiling (XBL) residential area on the left bank of the Xiaojiang River (Figure 1). The landslide features a typical topography, including a landslide platform and a ring-chair-shaped geomorphology. The landslide has a triangular shape, with a height difference of approximately 400 m between the front and rear edges. The slope length is 800 m ASL, and its width ranges from 90 to 500 m. A winding mountain road passes through the slope, with elevations ranging from 870 to 1100 m along its route. The overall topography of the slope is incomplete, with water distributed across four gullies within the slope. These gullies typically contain seasonal streams, with flow volumes being higher during the rainy season. The landslide covers an area of approximately 23.5 × 10 4   m 2 , with a total volume of about 611 ×   10 4   m 3 , classifying it as a large-scale soil landslide.
During the phased impoundment of the Baihetan Reservoir, the water level can reach a maximum of 816.51 m, still 8.49 m below the expected final water level of 825 m ASL. The XBL residential area is located very close to the WJS landslide, with an elevation of approximately 827.5 m, only 2.5 m higher than the anticipated final water level of 825 m ASL. Once the reservoir water level reaches 825 m ASL, the WJS landslide may become unstable, and the resulting landslide-generated waves could pose a significant threat to the lives and property of residents in the XBL area and along the shoreline. To mitigate the potential risks of landslide-generated surges, measures such as slope reduction and load reduction were adopted. The volume of the landslide after slope reduction was 4.15 ×   10 4   m 3 (Figure 2). However, despite the implementation of mitigation measures, under the most unfavorable conditions of an earthquake, the stability safety factor of the Wangjiashan landslide is still less than 1.0. Therefore, there is still a risk of instability for the WJS landslide. Further analysis of landslide-generated wave prediction for the treated landslide is required, to explore the spatial and temporal distribution characteristics of surges under different water level conditions.

3. Methodology

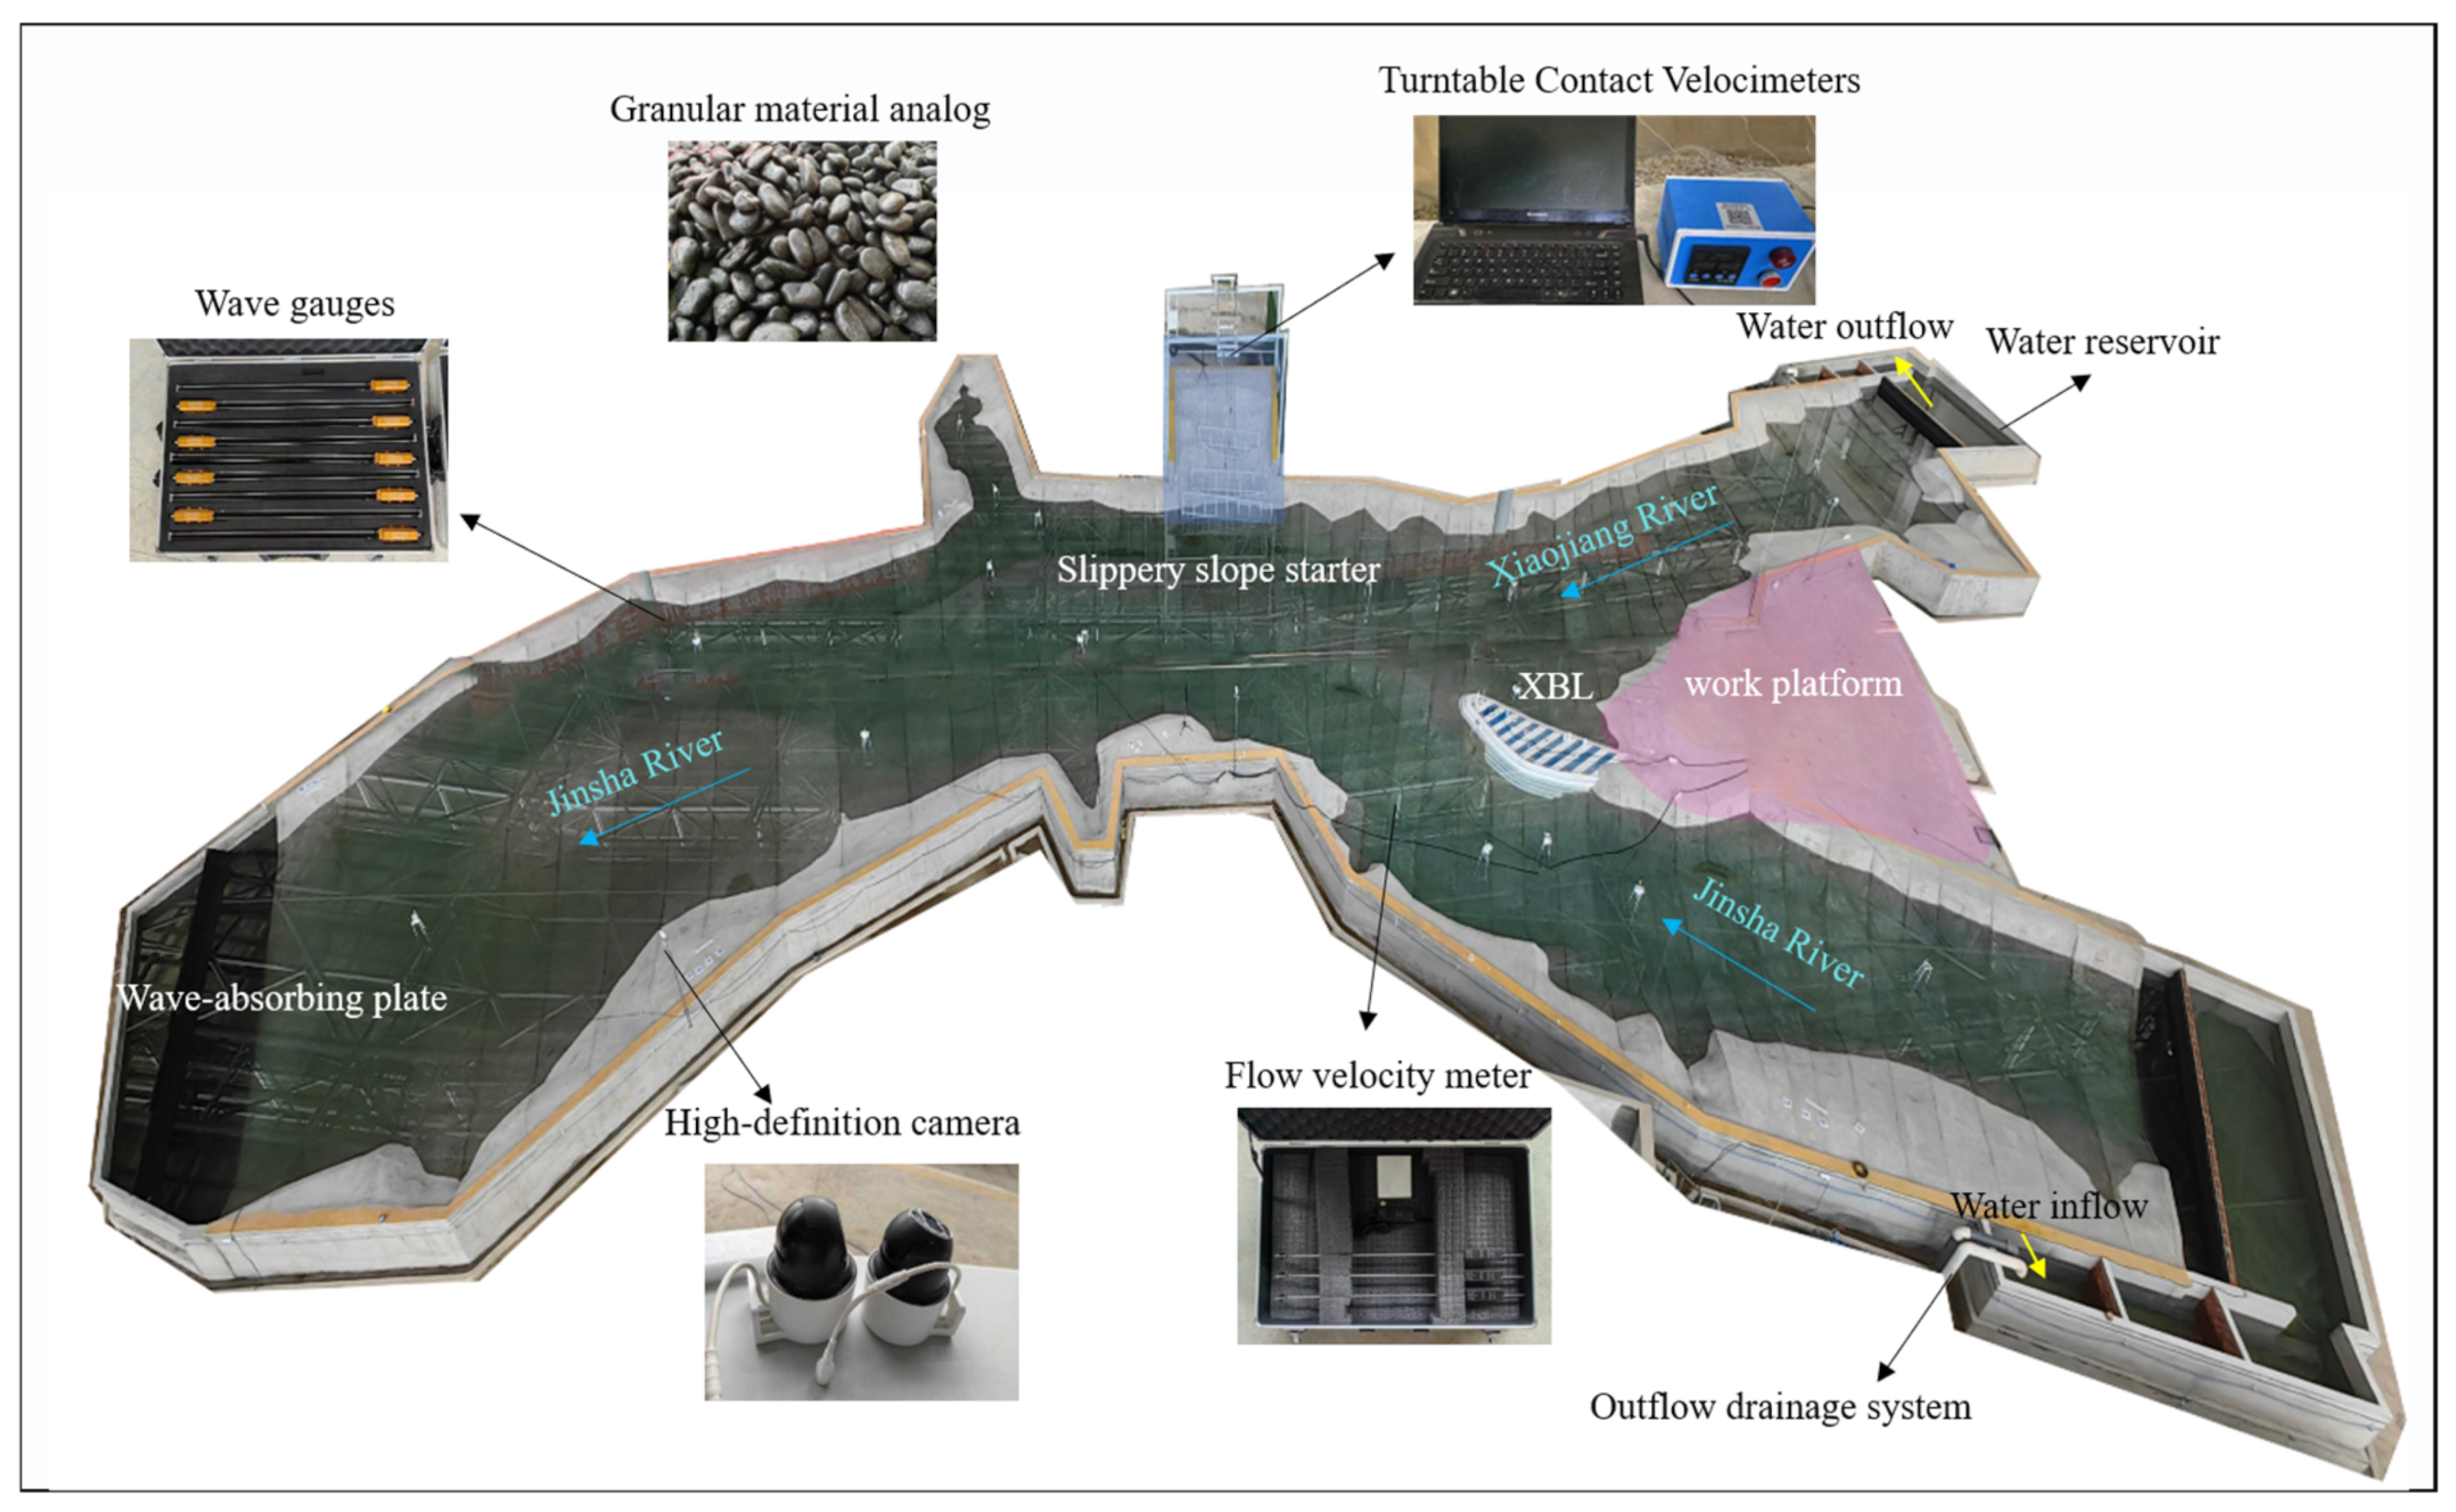
3.1. Geomechanical Model Experimental Methodology and Experimental Design

A large-scale three-dimensional physical model of the WJS landslide-generated waves was constructed in the Flow Laboratory at Hohai University (Figure 3). The model strictly follows the Froude similarity criterion, ensuring geometric similarity, flow motion similarity, and dynamic similarity. The geometric scale of the model is 1:150, with model dimensions of 65 m × 40 m × 3 m, simulating the actual river valley (9750 m × 5700 m × 650 m). The elevation range of the simulated topography spans from 650 m to 1100 m. According to the similarity criteria, the density and gravitational acceleration similarity ratios between the prototype and the model are both 1, while the time and velocity similarity ratios are 150 .
The WJS three-dimensional physical model was constructed in strict accordance with the actual topography of the engineering area, using materials such as cement, yellow sand, red bricks, and steel reinforcement. The model shape was controlled using the cross-section panel method, with key areas further refined by contour mapping, and the section spacing was approximately 60 cm. For areas with complex topography, the cross-section panels were densified, and cement mortar was used for plastering.
The sliding bed model was created in three dimensions based on the landslide cross-section diagram, forming a shallow concave slide path. The sliding surface of the landslide has the same dip angle as the actual landslide surface, with the slope bed bottom angle ranging from 5° to 7° and the upper-middle section between 33° and 35°. Landslide gates were installed at the shear outlet position, mid-elevation, and upper-elevation, using multiple baffles to control the center of mass height of the landslide body, while considering the shape of the landslide to allow sliding under the combined effects of gravity and frictional resistance. The landslide gates are located at the front end of the landslide body, serving as a barrier. The crane controls the landslide gate and is connected to it by ropes. Once the landslide gate is rapidly lifted, the landslide body will start to slide stably from its original position.
This study adopts model similarity based on landslide velocity rather than rheological similarity. Since the WJS landslide mainly exhibits a deformation motion of gravelly mixed soil after failure, the possibility of the landslide body completely disintegrating into debris is relatively low [31,32,33]. Therefore, this experiment uses bulk materials to simulate the landslide body, with the similar granular material being black pebbles. The black pebbles have a particle density of approximately 1.5–1.6 g/cm3, with a maximum particle size of 6–8 cm. To study the spatiotemporal distribution characteristics of granular landslide-generated waves, experiments were conducted under three different water levels: 800 m ASL, 815 m ASL, and 825 m ASL. The experimental landslide volume of 1.23 cubic meters corresponds to the prototype volume of 4.15 million cubic meters, or 68 percent of the original landslide volume. The data in the text are for the prototype landslide, and the experimental data for the model can be converted based on similarity ratios.

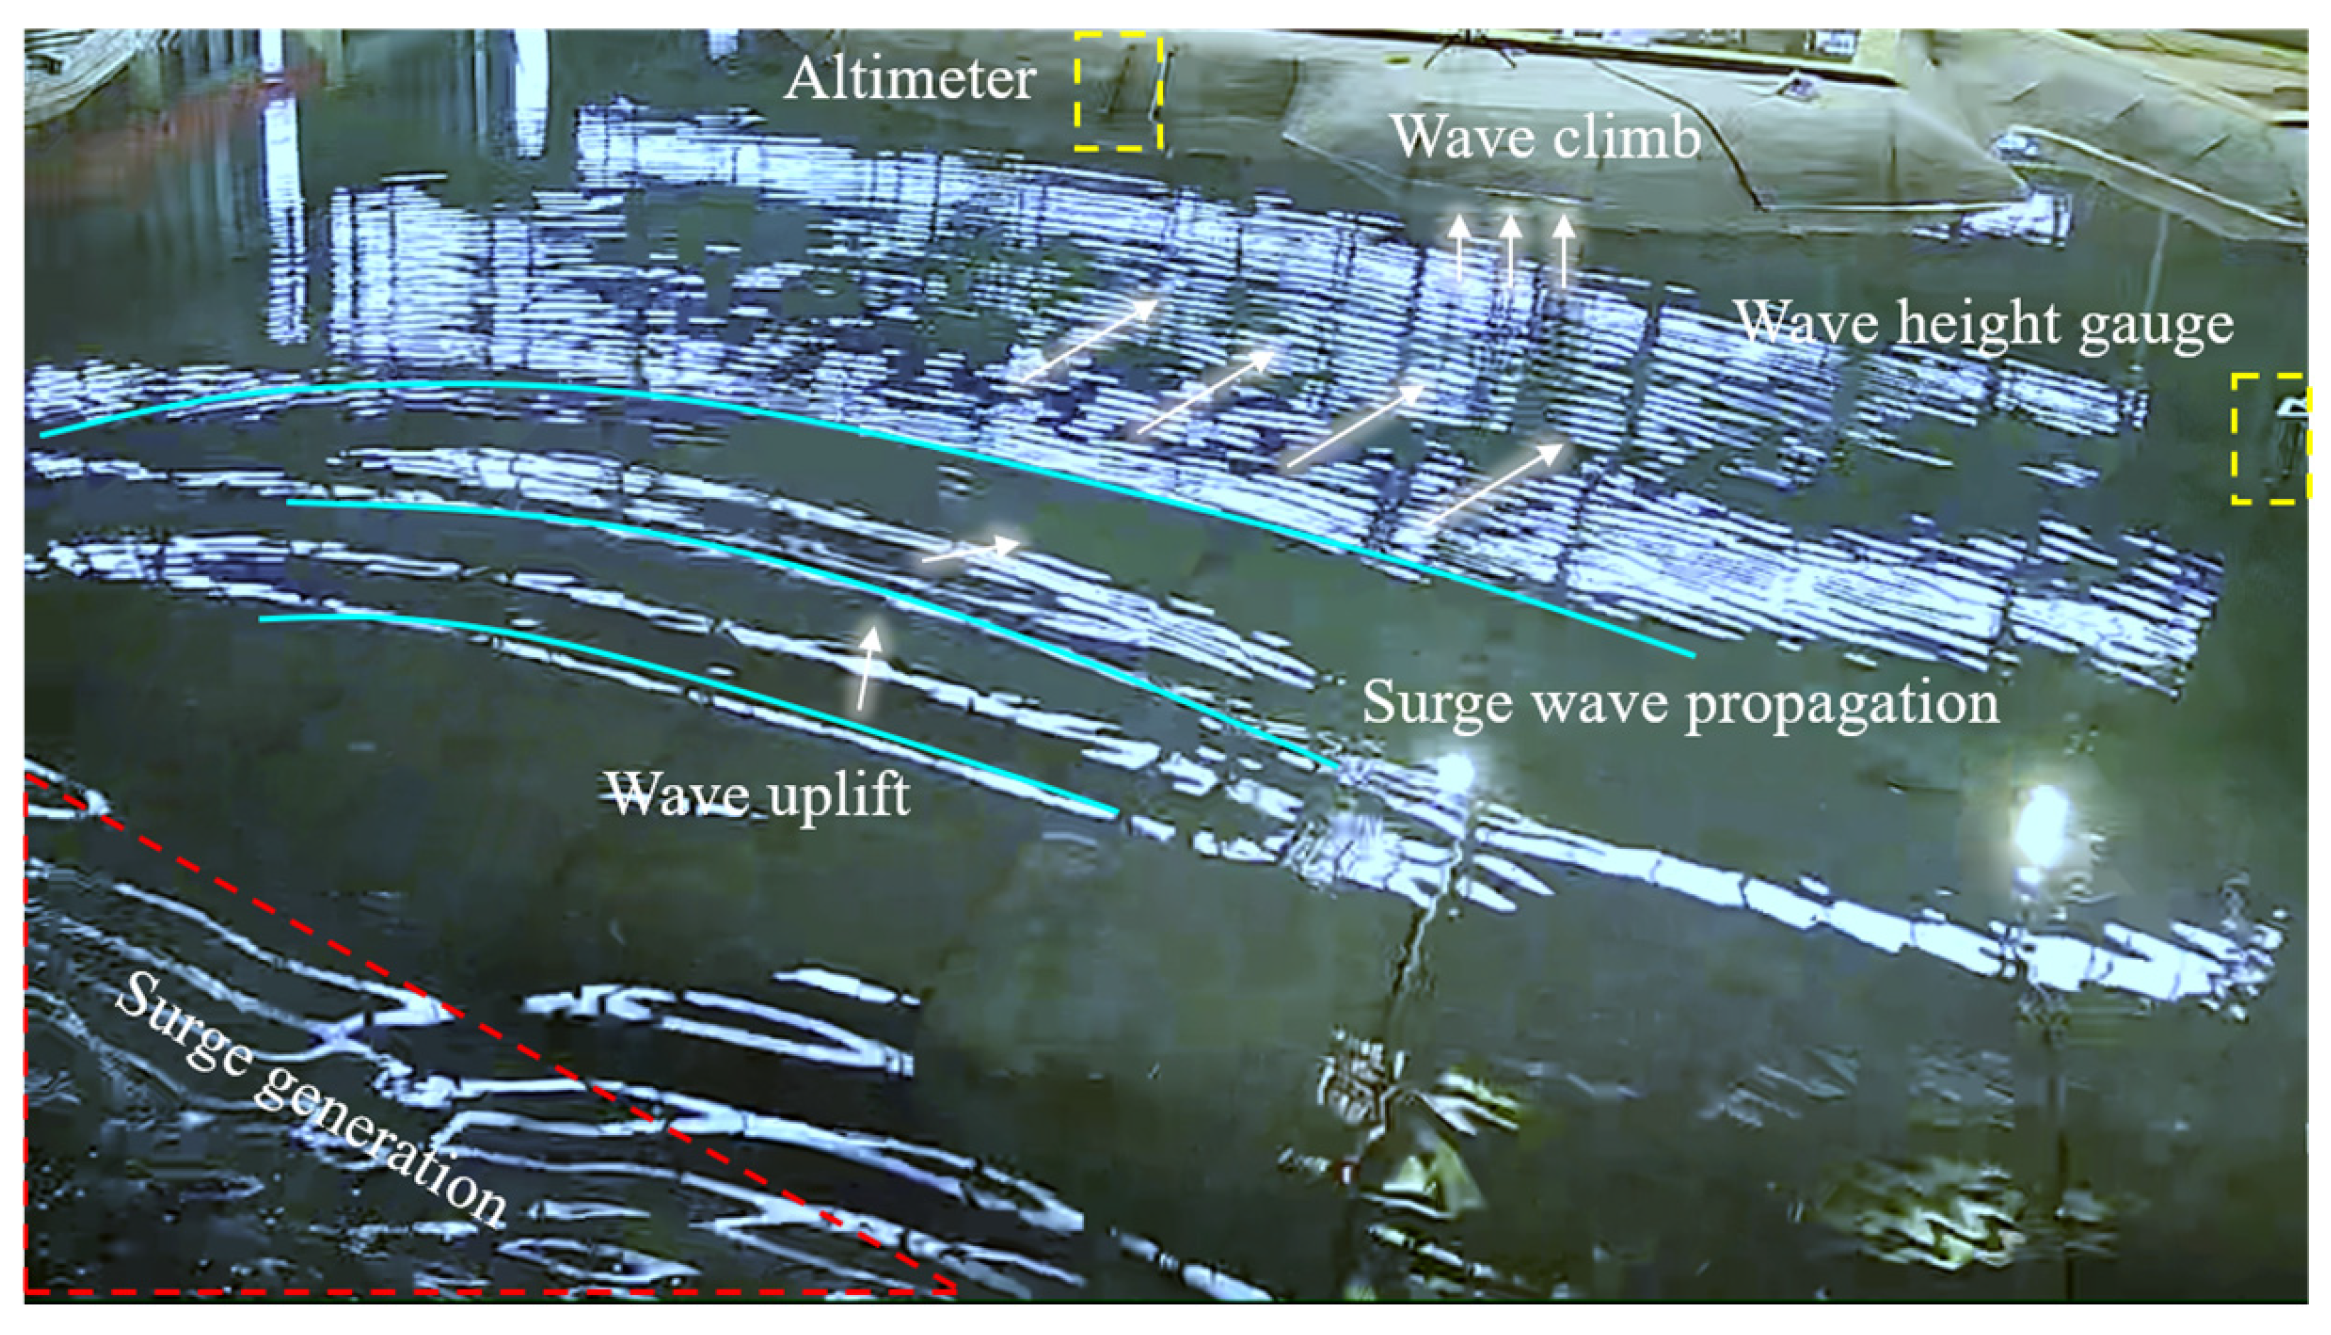
3.2. Testing Techniques for the Spatiotemporal Distribution of Landslide-Generated Waves

The experimental monitoring system includes wave height monitoring, landslide velocity monitoring, flow velocity testing, observational video collection, and water circulation systems. The wave height monitoring system uses the DYS50-3000 digital wave height acquisition system, consisting of a computer, wave height sensor, and wave height measurement rod. The wave height sensor has 32 channels with a sampling frequency of 50 Hz. The wave height measurement rod is 0.5 m in length, with a measurement error of 0.3 mm, and the error is less than 2% F.S.
The flow velocity monitoring system is a flow velocity sensor based on an optical-electrical spiral propeller. This system consists of a wireless flow velocity measurement rod, a wireless transmission gateway and measurement software. The two-dimensional velocity measurement accuracy is 0.5%. The physical model is equipped with 19 wave height measurement points and 3 flow velocity measurement points (see Figure 4). Eight wave height sensors are deployed in the XBL residential area, and eleven sensors are distributed along the Xiaojiang and Jinsha River channels, numbered h1 to h19, to monitor the wave characteristics in the XBL residential area and the upstream and downstream propagation of landslide-generated waves. Flow velocity measurement point 3 is located upstream of the Jinsha River, point 2 is located near the landslide area upstream of the Xiaojiang River, and point 1 is situated at the river center downstream of the Jinsha River, near the large gorge.
Contour scales are drawn on both sides of the river, with a scale precision of 0.01 m, to facilitate observation of the wave rise along the riverbanks. The landslide velocity monitoring system uses a turntable contact-type speedometer to measure the sliding velocity of the landslide body. The turntable contact-type speedometer consists of a computer, a line speed measurement device, and a guide roller. The device model is JK72S-RS. The speedometer is installed at the rear edge of the main cross-section of the landslide. An inclinometer is placed inside the sliding body to measure its acceleration.
The observational video collection system records the entire process of landslide-generated wave formation and propagation during the experiment. The cameras have a resolution of 400 MP, with 10 high-definition cameras covering the entire flow field area. Additionally, drones are used to assist in tracking the entire landslide-generated wave process. The water level in the river channel is controlled by pumping water from an underground reservoir, and internal water level measurements are regulated through preset level probes to meet different depth requirements.

4. Spatiotemporal Evolution of Landslide-Generated Waves Under Different Water Level Conditions

4.1. Movement Characteristics of Landslide-Generated Waves

The images captured by high-speed cameras provide fundamental data for analyzing the movement characteristics of granular landslide-generated waves. Although the reservoir water levels vary under different experimental conditions, the overall movement pattern of the landslide and the general characteristics of the generated waves remain largely consistent. The following analysis, based on the experimental results under the 825 m ASL water level condition, studies the impact process of landslide motion and wave generation. As shown in Figure 5, at t = 0 s, the landslide body has not yet started moving, and the river’s free surface remains calm. With the activation of the landslide control gate, the landslide begins to slide from a stationary state. At t = 12 s, after the landslide body loses the constraint of the side chutes at its front, it rapidly slides down, making contact with and impacting the water, generating the initial wave. After entering the water, the landslide displaces a large amount of water, forming a concave cavity at the point of entry. Under the pressure of the surrounding water, the water tends to flow into the cavity. At t = 36 s, the landslide continues to enter the water, creating a trend of pushing the water forward, forming a large semicircular wave in front of the entry point. At t = 60 s, the landslide fully enters the water, and the waves collide and overlap. After developing in the generation area, the waves begin to propagate and climb toward the opposite shore (Figure 6).

4.2. Characteristics of the Sliding Movement of the Landslide Mass

The movement process of the landslide mass is not a simple uniform acceleration or uniform deceleration, but a complex and dynamically changing physical process. The speed and acceleration change with time show significant phased characteristics.
During the entire movement process of the landslide mass, the trend of speed change is that it first increases and then decreases. The maximum speed reaches 8.91 m/s, which is consistent with the calculated potential speed. Specifically, the landslide mass gradually accelerates due to the release of gravitational potential energy in the initial stage, reaches a peak, and then the speed begins to gradually decrease and eventually stops.
The change of acceleration is more complex, presenting characteristics of first oscillation, then a sharp decline, and finally stabilization. In the initial stage of the movement, due to the inhomogeneity of the internal structure and sliding zone of the landslide mass, the acceleration will show obvious oscillation phenomena. As the movement of the landslide mass gradually becomes stable, the acceleration begins to sharply decline and finally tends to zero under the action of various resistances.
Although air resistance always exists throughout the movement process, its influence on the movement of the landslide mass can be ignored. This is because the movement of the landslide mass mainly occurs on the ground or water bodies, and air resistance is relatively small compared to other forces (such as gravity, friction, water resistance, etc.), so it can be disregarded when analyzing the movement of the landslide mass.
The water-infiltration stage of the landslide mass can be further divided into three different stages, each with its unique dynamic manifestation and dominant force:
  • Slow acceleration stage: During this stage, the gravitational potential energy of the landslide mass begins to gradually be converted into kinetic energy. As a large amount of sliding material breaks away from the shear zone, the landslide mass starts to accelerate slowly along the sliding zone. The acceleration in this stage is relatively gentle, mainly driven by the release of gravitational potential energy. At this time, the movement of the landslide mass is mainly influenced by gravity, and other forces (such as frictional force, water resistance, etc.) have not yet significantly exerted their influence.
  • Acceleration Phase: During this phase, the potential energy of the landslide mass is almost completely converted into kinetic energy. Under the combined action of gravity, friction, buoyancy, and water resistance, the landslide mass continues to move forward rapidly. Despite the influence of various forces, gravity remains the main driving force for the acceleration of the landslide mass. At this time, the speed of the landslide mass reaches its maximum value and the movement is the most intense.
  • Rapid Deceleration Phase: In the final stage, the landslide mass decelerates rapidly under the combined effect of frictional resistance and water resistance, eventually coming to a stop. As the speed of the landslide mass decreases, its kinetic energy gradually transforms into other forms of energy, such as thermal energy and wave energy. A part of the landslide mass will impact the riverbed, causing topographic changes, while the remaining part will accumulate at the lower end of the landslide mass, forming new landform features.

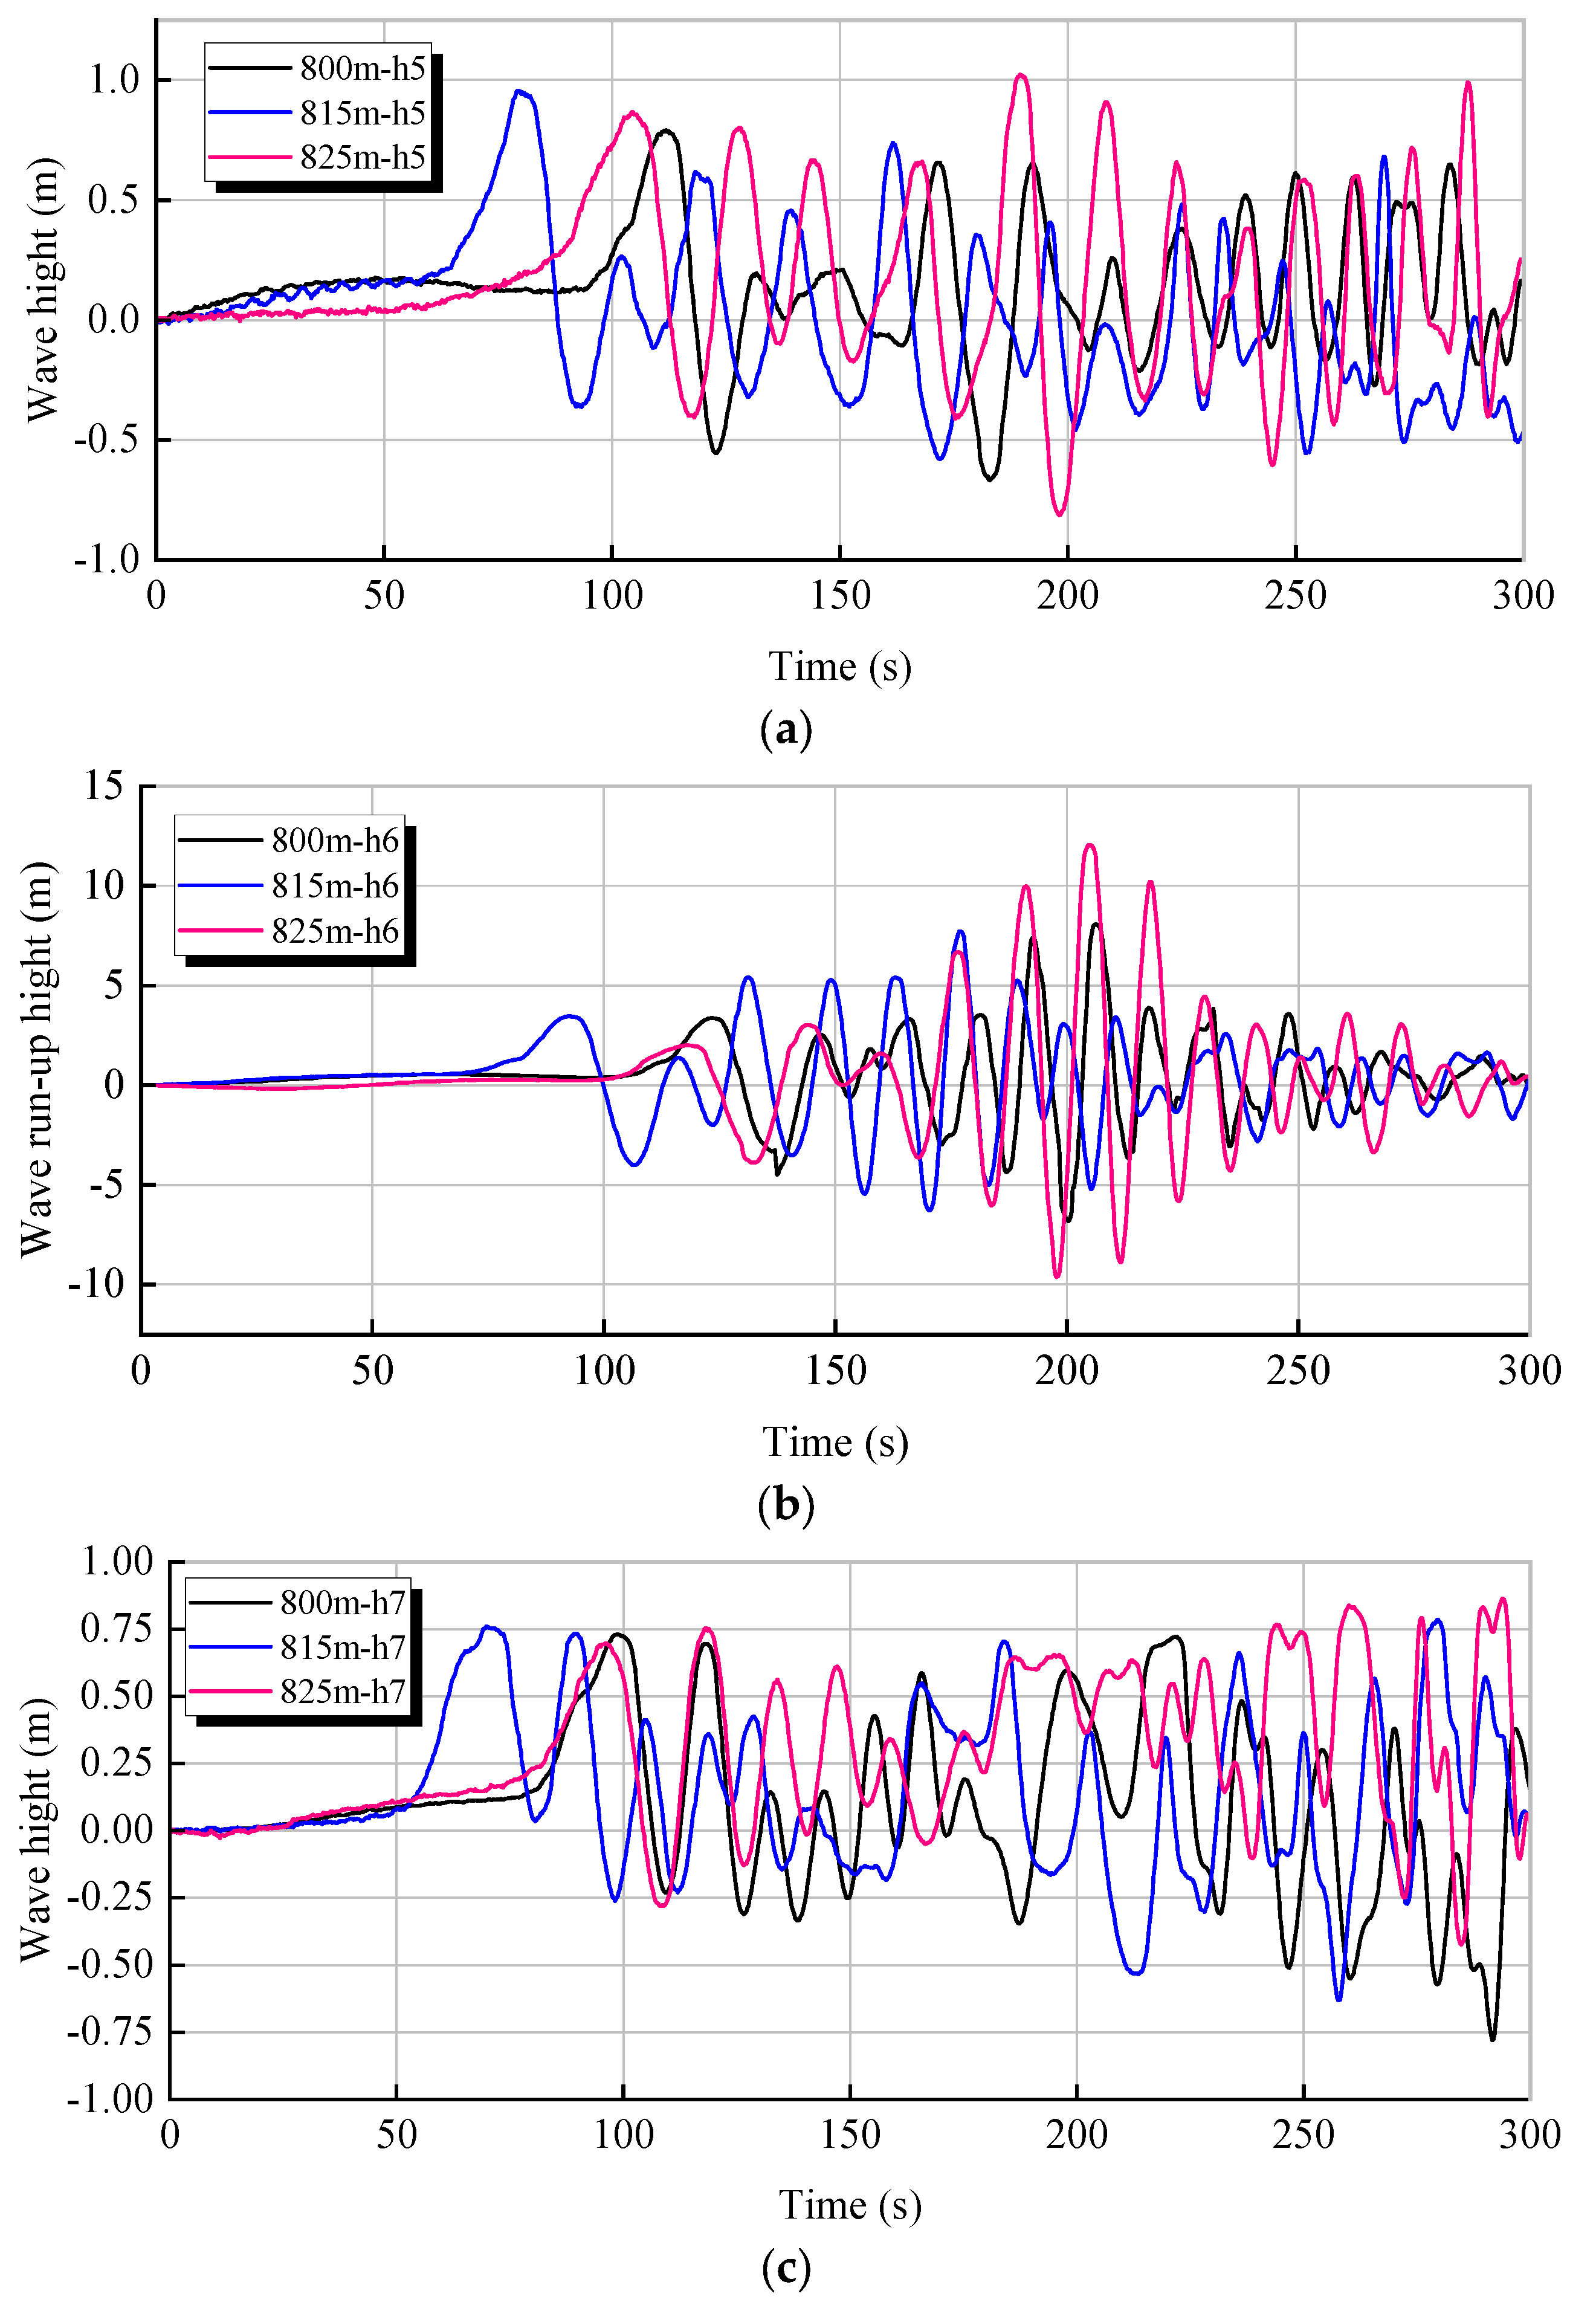
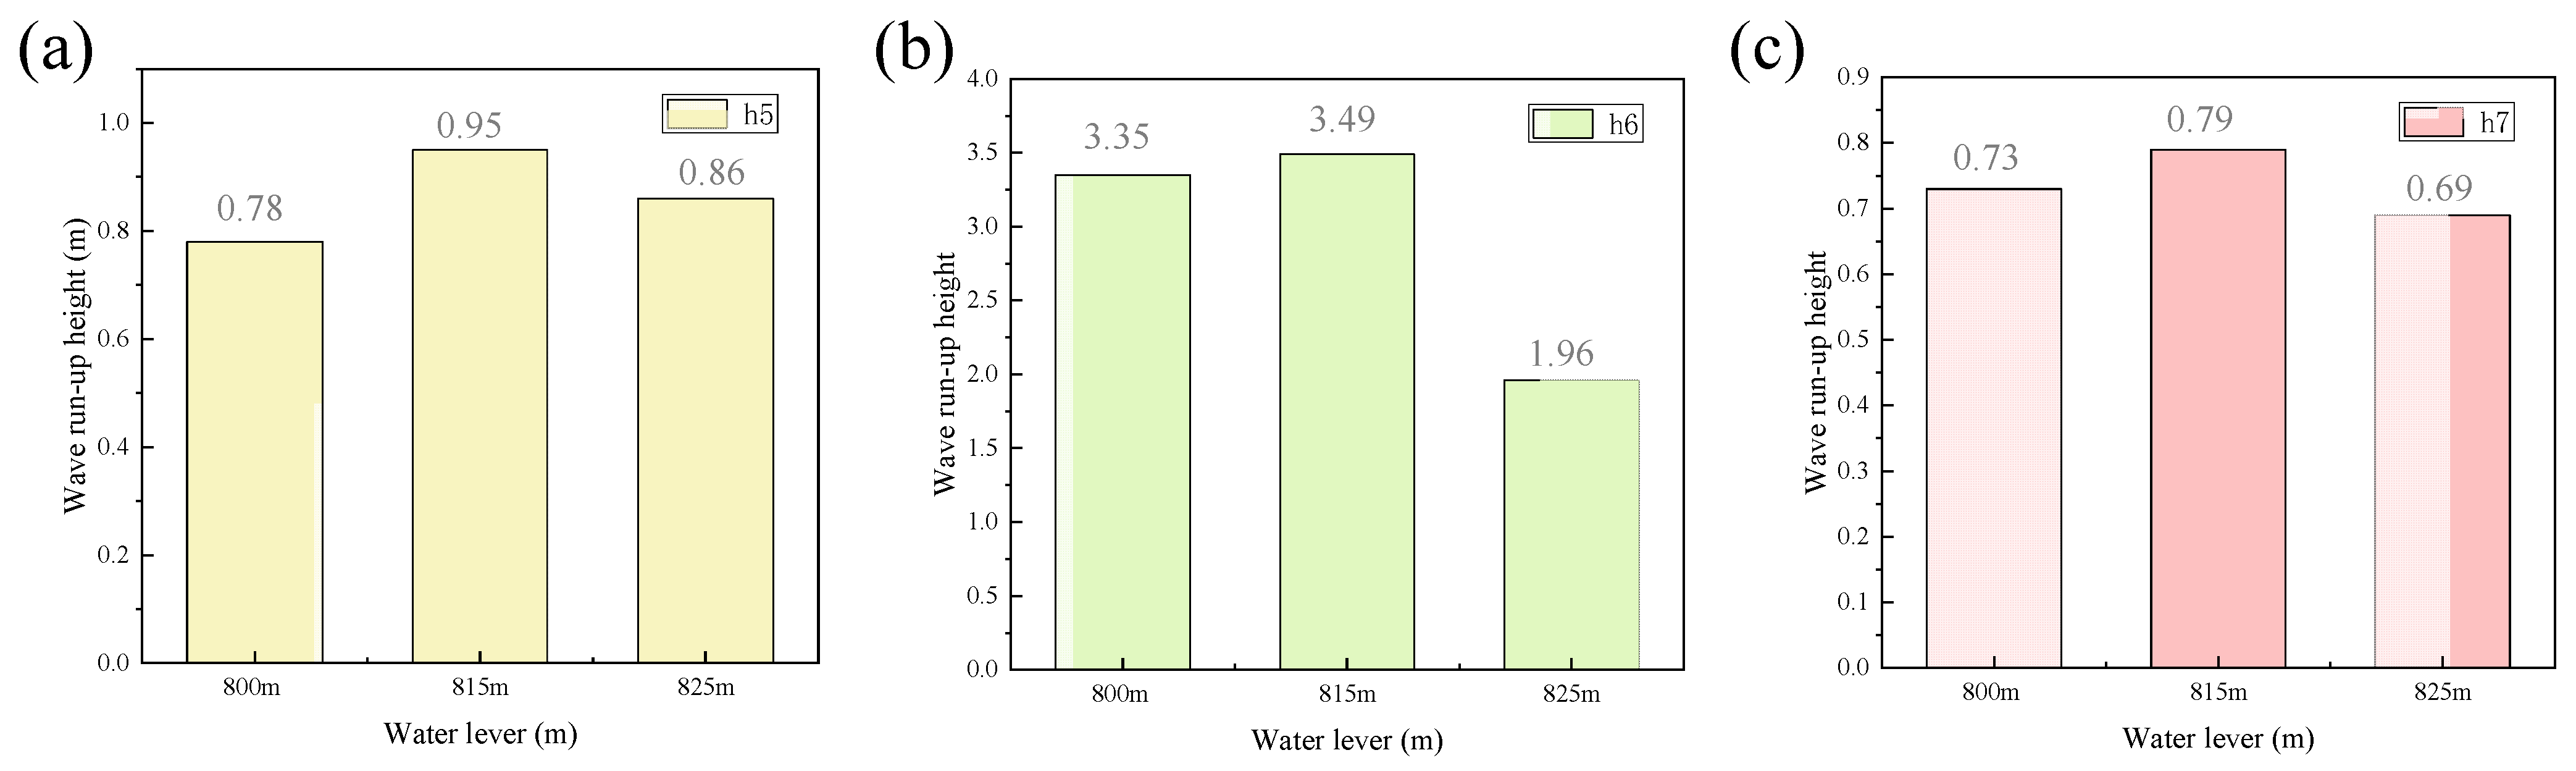
4.3. First Wave Height and Opposite Shore Climb of Near-Field Landslide-Generated Waves

The height of the first wave generated by the landslide sliding down reflects the severity of the landslide-generated wave disaster to some extent. The higher the first wave, the stronger its potential for disaster. To monitor the characteristics of the generated waves during the landslide’s descent, we placed measurement points h5 and h7 in the near field to record the height of the first wave triggered by the landslide movement. Meanwhile, measurement point h6 is used to record the wave run-up on the opposite shore during the landslide descent.
Figure 7 illustrates the temporal variation curves of wave heights at different measurement points under varying water level conditions. Analysis of the wave height curves at measurement points h5 and h7 in the wave generation area reveals that as the reservoir water level decreases from 825 m ASL to 815 m ASL, the first wave height at these points increases. This increase is attributed to the reduced contact area between landslide particles and water, leading to decreased interfacial friction and an enhanced volume uplift effect, which collectively result in a higher first wave height. However, as the water level further decreases from 815 m ASL to 800 m ASL, the first wave height at h5 and h7 diminishes. This phenomenon can be explained by the water depth effect, where the increased energy is insufficient to compensate for the reduction in the initial potential energy of the waves, thereby causing the first wave height to decrease. Under different water level conditions, the first wave generated exhibits distinct waveform characteristics: in shallow water environments, the first wave is taller and narrower with a lower propagation speed, while in deeper water, the first wave is shorter and broader with a higher propagation speed. Despite these differences, the total energy transferred from the landslide to the water remains approximately constant.
The temporal variation curve of the wave run-up at measurement point h6 in the wave generation area under different water level conditions shows that the run-up on the opposite shore increases and then decreases as the reservoir water level lowers. Figure 8 shows the variation in first wave height and opposite shore run-up under different water level conditions in the near field. As shown in the figure, as the water level decreases from 825 m ASL to 815 m ASL, the first wave height at h5 and h7 increases from 0.86 m and 0.69 m to 0.95 m and 0.89 m, respectively, while the opposite shore run-up at h7 increases from 1.96 m to 3.49 m. However, as the water level further decreases from 815 m ASL to 800 m ASL, the wave heights at the three measurement points decrease to 0.78 m, 3.35 m, and 1.96 m, respectively, showing a trend of wave height increasing first and then decreasing as the water level lowers.

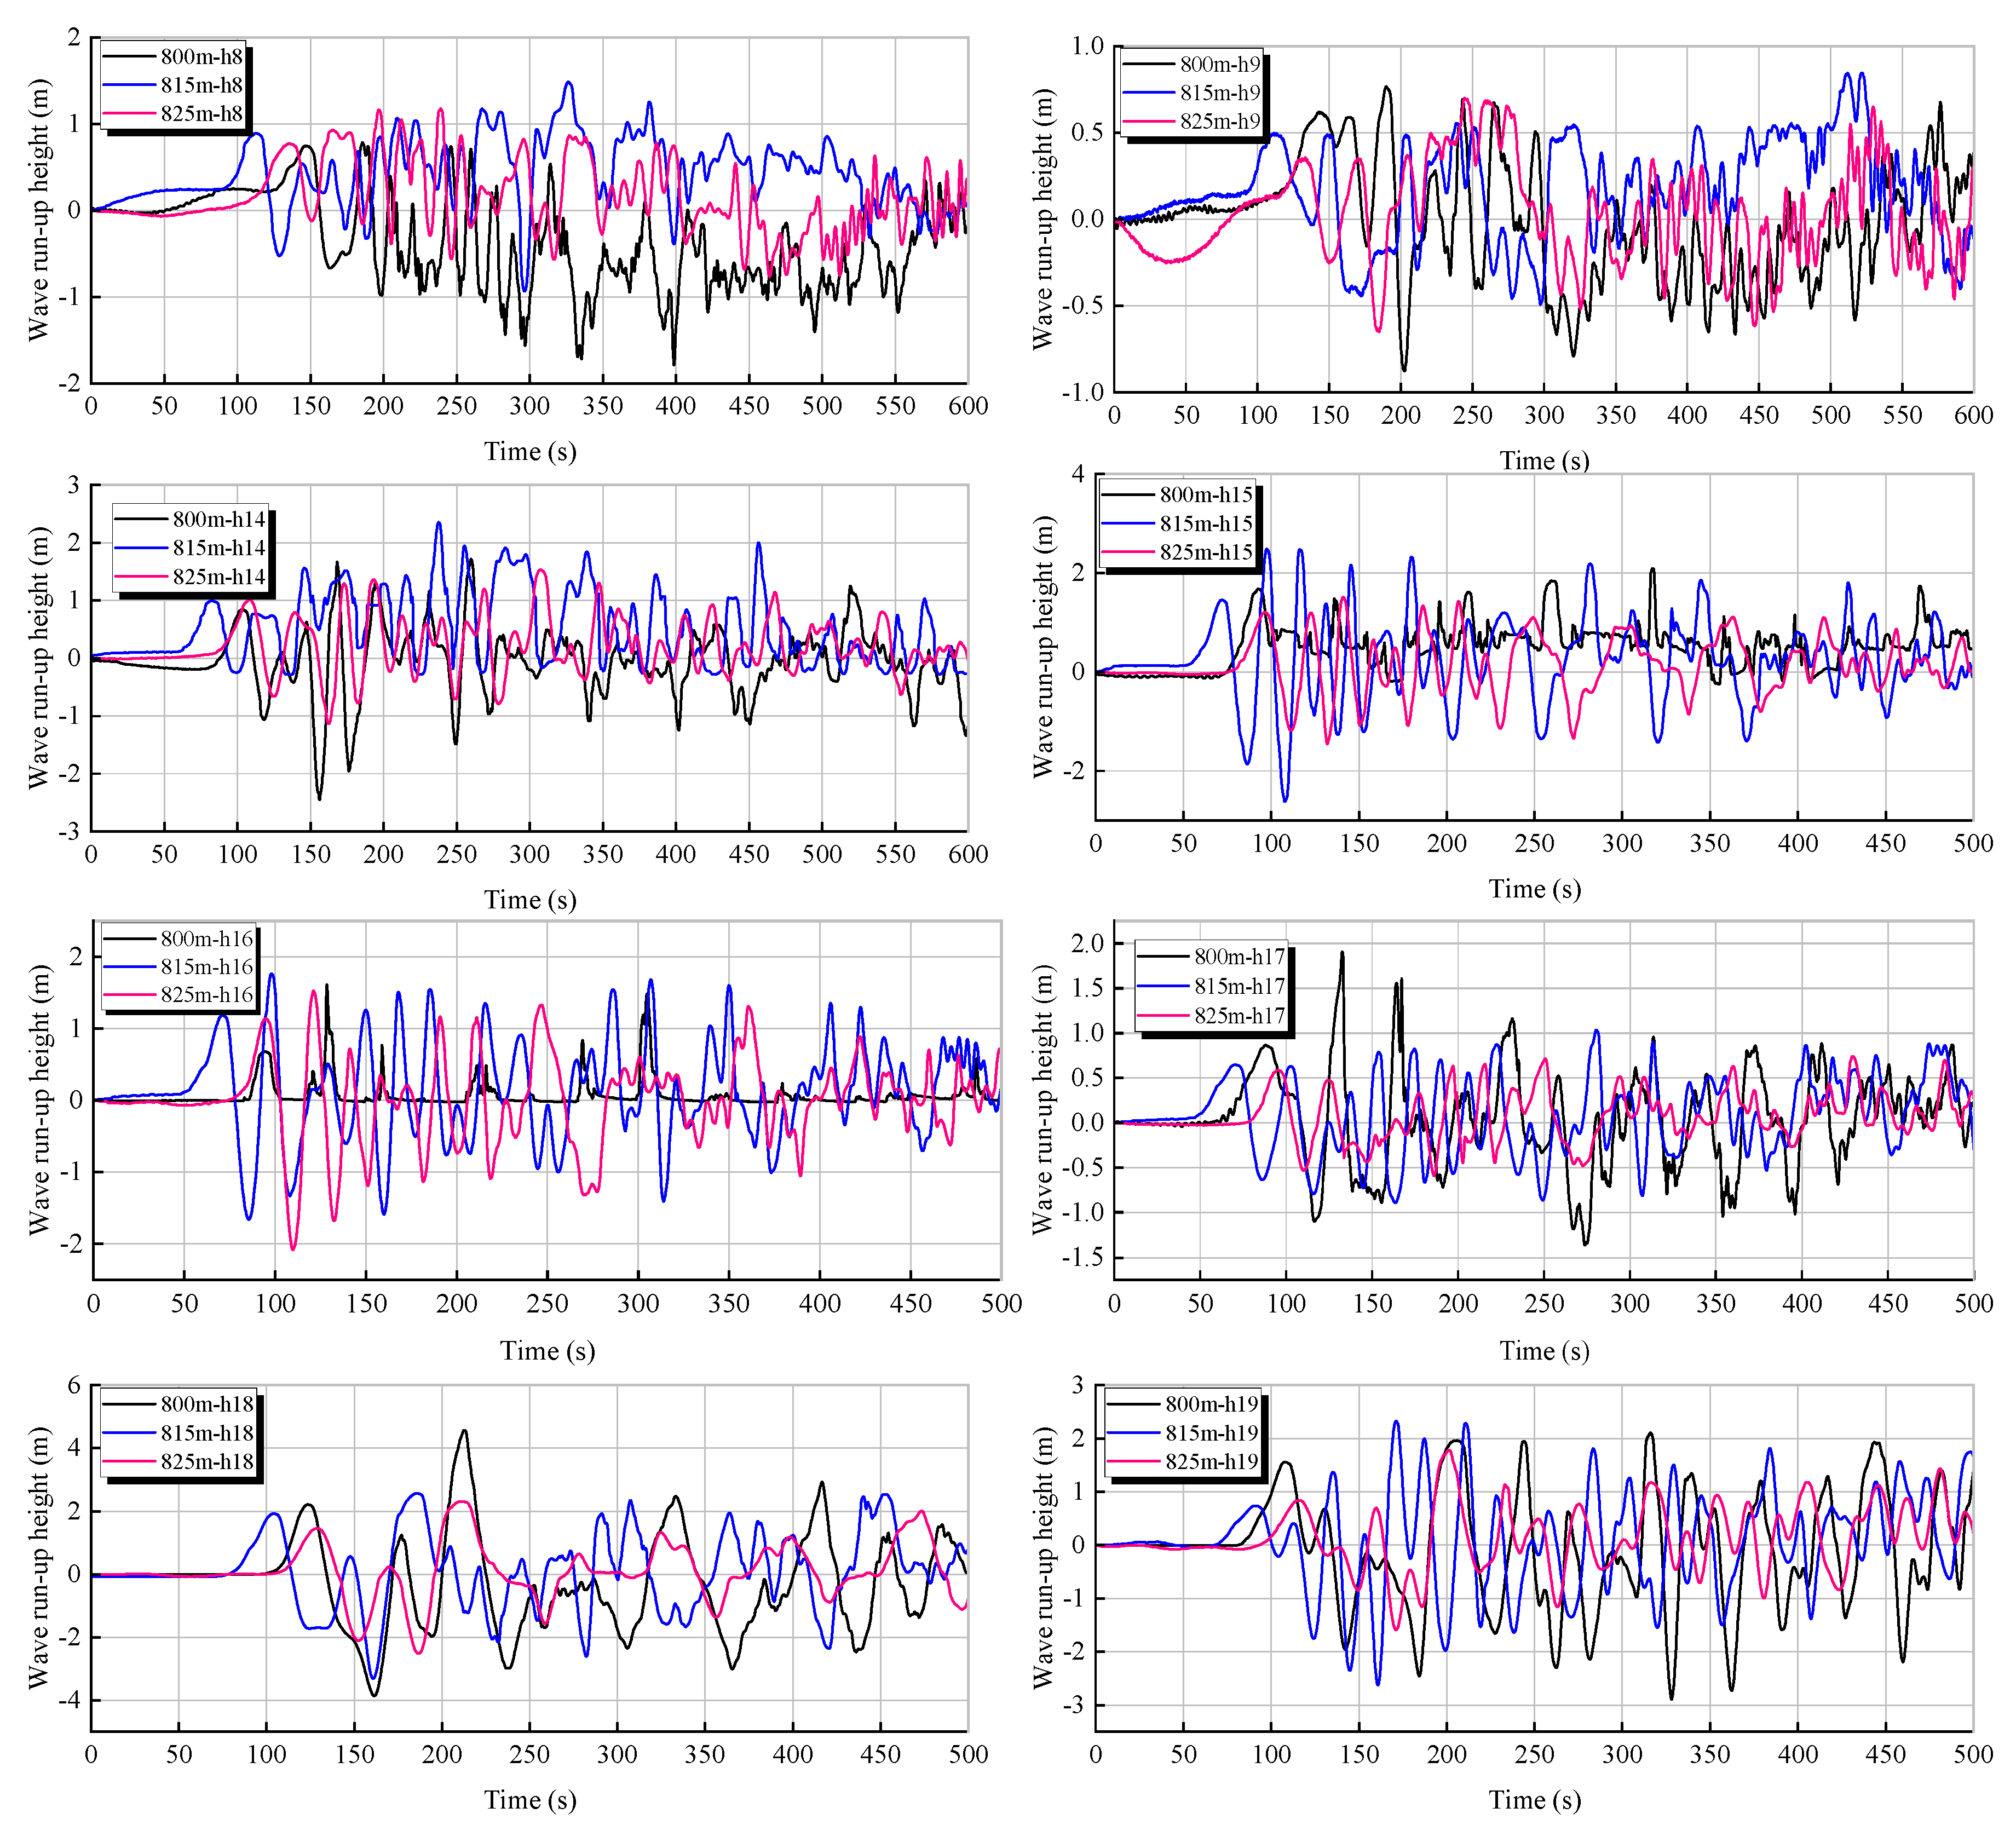
4.4. Wave Propagation Characteristics Along the Flow Path

In the wave propagation area, eight measurement points (h1–h4, h10–h13) were deployed to monitor the wave characteristics as the waves propagate upstream and downstream along the river channel. The specific arrangement is as follows: wave height measurement points h10 and h11 are located along the Xiaojiang River, h12 and h13 are located upstream of the Jinsha River, h1 and h2 are located downstream of the Jinsha River, and h3 and h4 are located in tributary valleys. To better observe the propagation characteristics of the impulsive waves along the flow path, wave height data were recorded for 1000 s, which is sufficient to capture the entire process of impulsive waves propagation in the reservoir’s river channels.
Figure 9a–c show the temporal variation curves of wave heights at each measurement point under different water level conditions. As shown in Figure 9, from a spatial perspective, as the distance from the disturbance point increases, the waveform at the next measurement point is generally similar to that at the previous point, with the first wave height gradually decreasing. From a temporal perspective, as time progresses, the arrival time of the first wave is gradually delayed (gray area). Subsequently, the impulsive waves collide and overlap during their propagation along the river channel (white area), with the waveform changing from a simple wave form to a wave group, and eventually evolving into a high-frequency, low-amplitude irregular waveform (purple area). Due to the dispersion effect, the scattered leading waves enhance the subsequent tail waves within a short period. Even after traveling longer distances, the wave height can still maintain a certain level of propagation.
Overall, under different water level conditions, the propagation of the impulsive waves along the flow path exhibited continuity in spatial extent and consistency in temporal range.

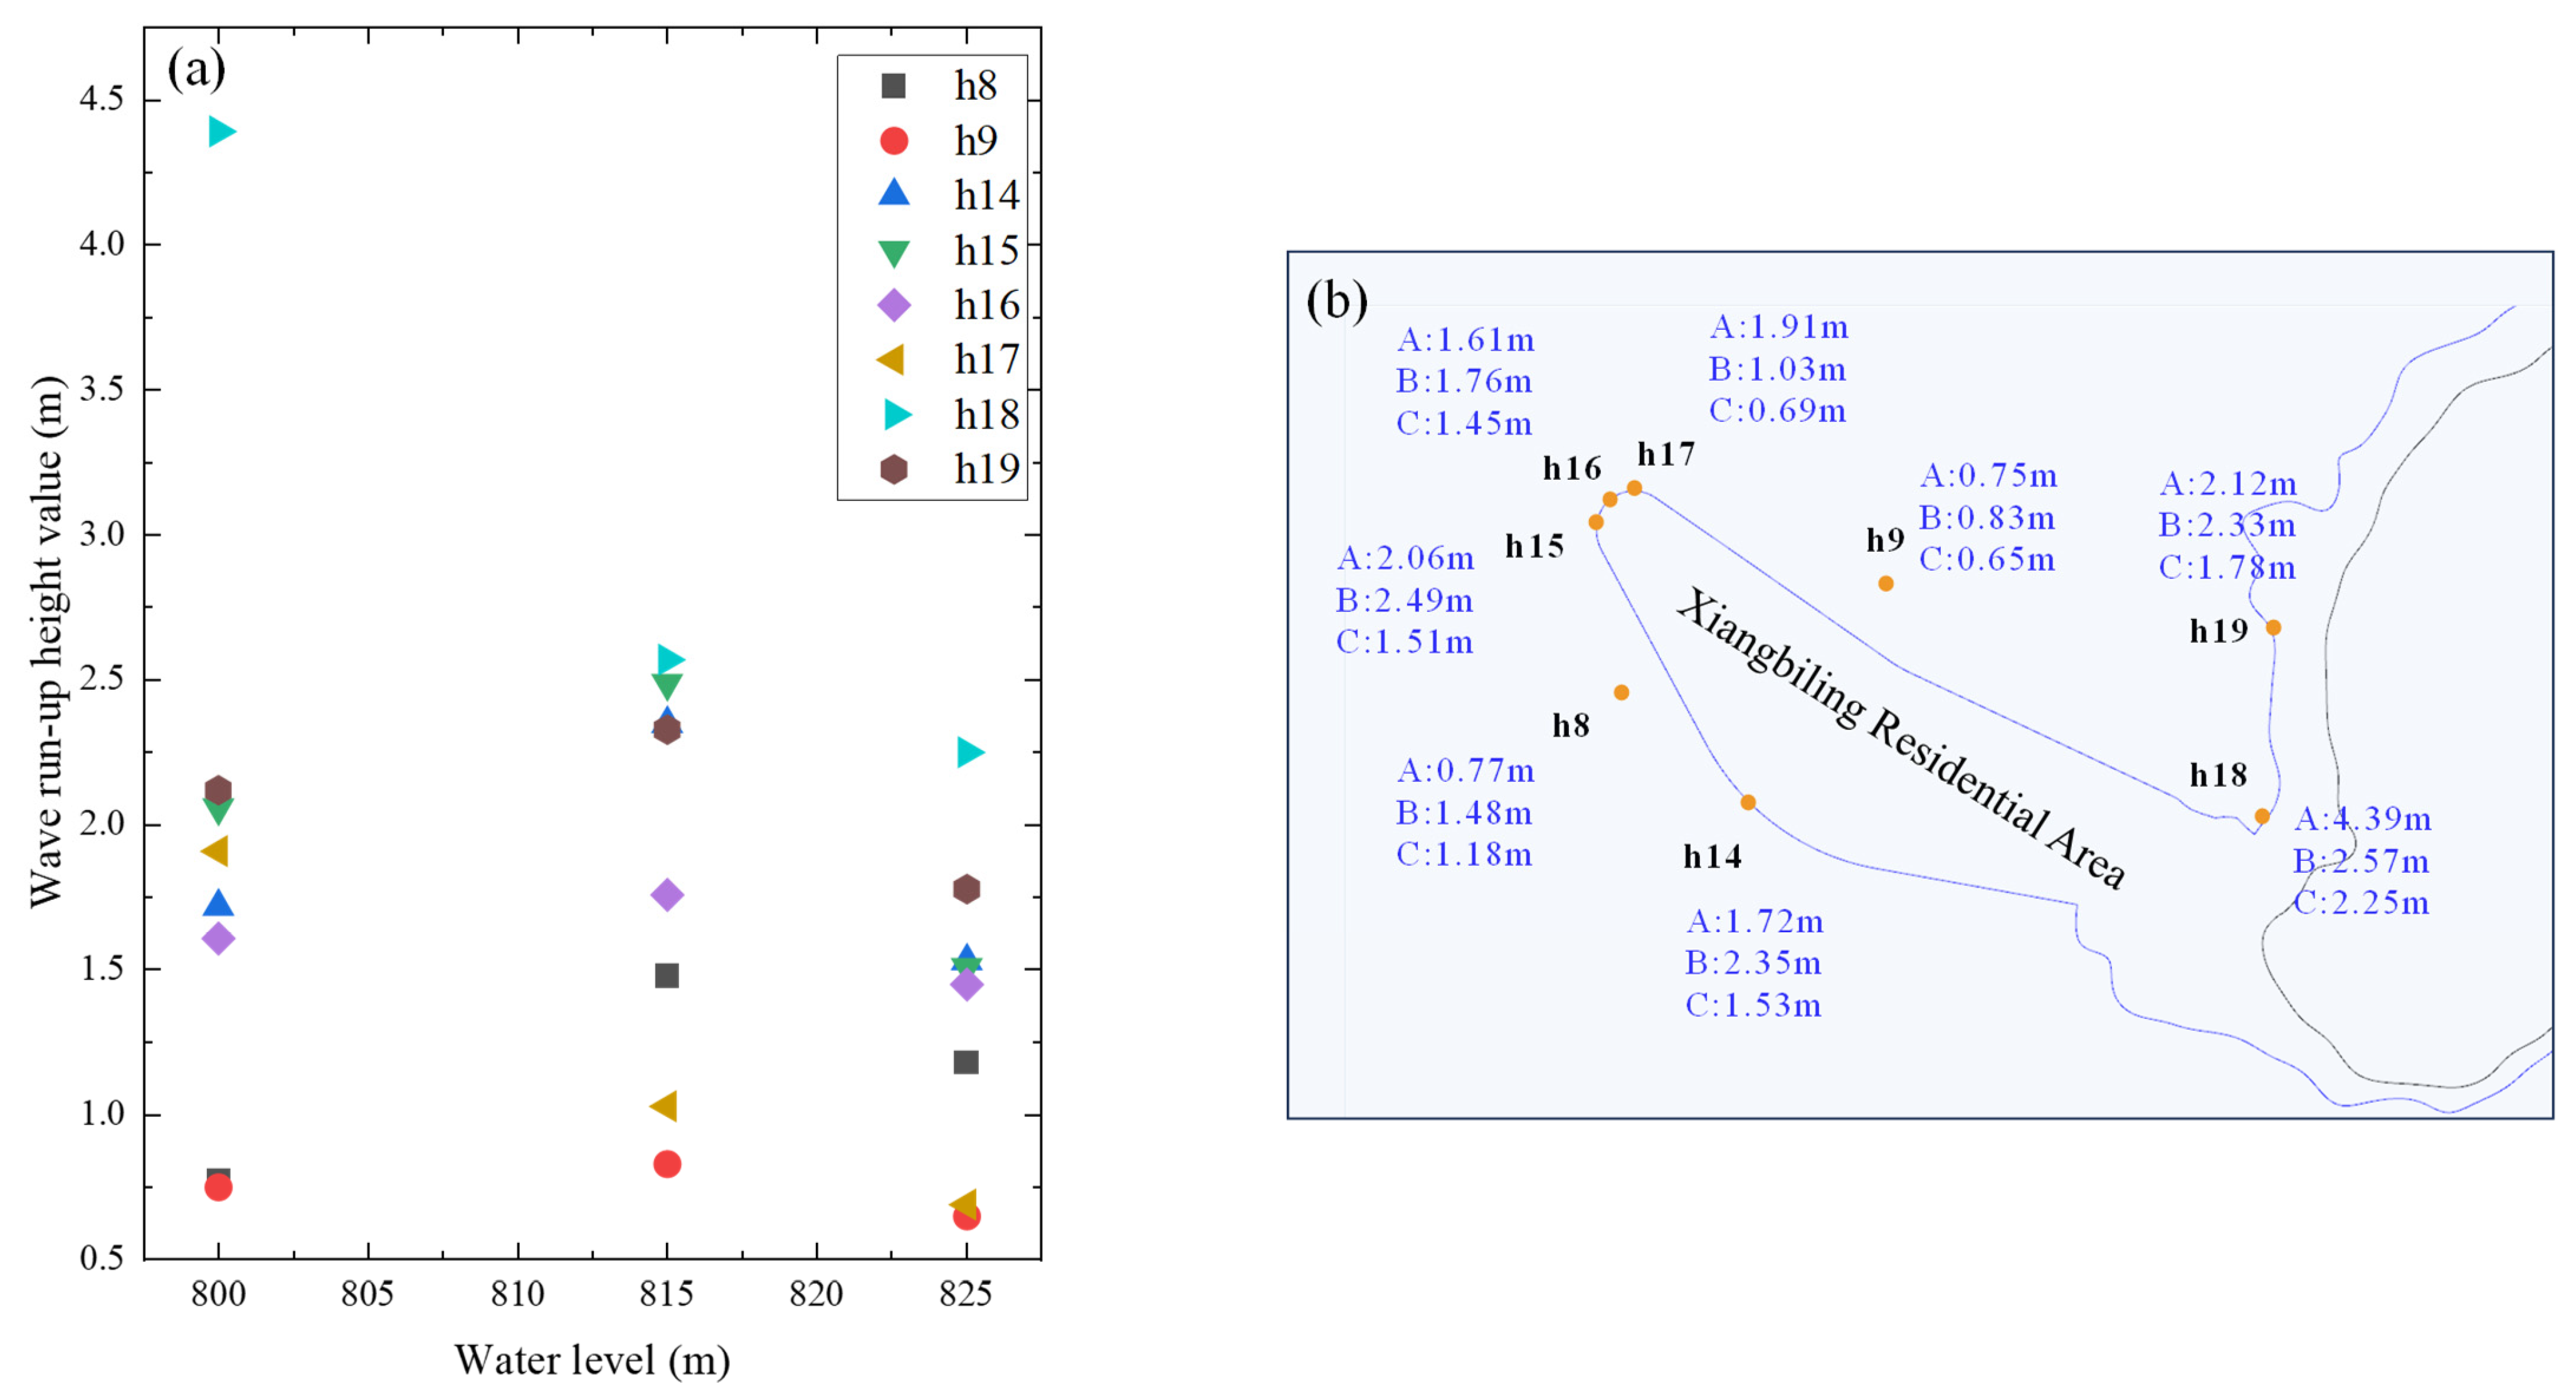
4.5. Climbing Height at XBL Residential Area

Around the XBL residential area, a total of eight digital wave amplitude collector measurement points have been deployed, basically covering all the potentially hazardous points where the impulsive wave may impact the XBL residential area. The specific deployment is as follows: h15, h16, and h17 measurement points are located at the front of XBL, facing the WJS landslide; h8 and h14 measurement points are located on the left bank of the XBL residential area, upstream of the Jinsha River; and h18 and h19 measurement points are located on the right bank of XBL residential area, in the Xiaojiang River Basin. In order to observe as comprehensively as possible the climb of the surge in the XBL residential area, the wave height data were recorded for 600 s, which can show the possible impact process of the surge on the XBL residential area.
Figure 10 shows the temporal variation curves of wave height climb at each measurement point in the XBL residential area under different water level conditions. By comparing the maximum run-up of the surge wave at each measurement point, it is found that the maximum run-up of the impulsive wave shows a trend of increasing and then decreasing as the water level decreases. This change is mainly due to the fact that within a certain water level range, the lowering of the water level helps the accumulation and transfer of surge energy. However, measuring points h17 and h18 behaved abnormally and did not follow this pattern. Specifically, gauge h18 is located in a depression within the XBL residential area, and gauge h18 is located at a narrow confluence of the river channel and the bank slope in the reservoir area (in the shape of an “L”). The change in water level affects the shape and slope of the topography and shoreline, which leads to the reflection and convergence of waves when approaching the shoreline, thus enhancing the climbing effect of surges.
When the water level is high, the depth and volume of the water body is greater, which may lead to dispersion of energy, thus reducing the height of climb of the surge. Comparing the spatial and temporal evolution characteristics of the run-up in the near-field area, it can be found that the overall surge runup characteristics are basically the same as that of the XBL residential area, except for the topographic differences.
After analyzing the changes in the maximum impulsive waves run-up at the XBL residential area under different water levels from a micro perspective, as well as the influence of water level on the maximum impulsive waves run-up, a quantitative comparative analysis of the impulsive wave magnitude is now conducted from a macro perspective. Figure 11 presents the trend curves of the maximum impulsive waves run-up values and their magnitudes at the XBL residential area under different water level conditions. As shown in Figure 11a, the maximum impulsive waves run-up curves at points h17 and h18 differ from those at other measurement points, exhibiting a downward convex shape with a linear decreasing trend. In contrast, maximum impulsive waves run-up curves at other points show an upward convex shape, with the maximum impulsive waves run-up initially increasing and then decreasing as the water level rises.
Figure 11b illustrates the spatial distribution characteristics of the maximum impulsive waves run-up values at various measurement points around the XBL residential area. This figure provides a clear quantitative representation of the extent to which water level changes influence the maximum impulsive waves run-up, and helps identify abnormal patterns of maximum impulsive waves run-up at specific locations with unique riverbed topography. Among the eight wave amplitude measurement points in the XBL residential area, the potential risk points under all three water level conditions occur at point h8, with maximum impulsive waves run-up values of 4.39 m, 2.57 m, and 2.25 m, respectively.
Specifically, at a reservoir water level of 825 m ASL, the maximum impulsive waves run-up could reach 827.25 m, but it remains below the elevation of the XBL residential area (827.5 m). Therefore, within this water level range, the potential wave amplitude at the residential area is within a safety margin, indirectly confirming the effectiveness of the mitigation measures.

5. Conclusions

This paper takes the Wangjiashan landslide in the Baihetan Reservoir area as an example and conducts large-scale three-dimensional physical model experiments under different water levels to systematically analyze the spatiotemporal evolution laws of landslide-generated surges from their generation, to propagation, to climbing. Through the analysis of the physical model test data, this paper discusses the influence of water level factors on the spatiotemporal evolution of key surge parameters such as the height of the first wave in the near field, climbing, the propagation characteristics of surges along the course, and the maximum climbing height in the Xiangbiling residential area. The study elaborates on the influence mechanism of water level factors in the fork-shaped river channel of the reservoir, providing a theoretical basis for water level scheduling and allocation in the reservoir area, and offering a reference for the prediction and early warning methods of landslide-generated surges. It has achieved certain research results and reached the following conclusions:
  • The generation, propagation, and climbing process of landslide-generated surges involves complex water–soil interaction and wave dynamics problems. This paper only considers the influence of a single variable (water level) on the spatiotemporal distribution of surges, and does not deeply explore other effects related to the water level effect, such as volume effect and velocity effect. Future research should further expand to cover these more complex factors.
  • The test conditions of this paper only designed three water level conditions, and the influence of water level factors on the spatiotemporal distribution of surges generated by the Wangjiashan landslide is not sufficient. In particular, the critical water level cannot be determined. In subsequent research, it is recommended to design more gradient water level conditions to enhance the rigor and typicality of the content, and further analyze the influence of subtle changes in water level on the spatiotemporal evolution of surges.
  • The physical model test can simulate the surge phenomenon after the landslide enters the water in the laboratory conditions, and directly display the formation, propagation, and climbing process of landslide-generated surges. By observing the water flow and wave motion in the model, the dynamic behavior of surges can be intuitively understood, and real visual effects and data support for further research are provided.
  • Water level changes have a significant impact on the generation, propagation, and climbing of landslide-generated surges, and are important factors for predicting and evaluating the characteristics of surges. Water level, as one of the key parameters affecting the characteristics of landslide-generated surges, directly determines the energy transfer, wave height changes, and climbing ability of surges. Overall, the influence of water level on wave climbing is a non-linear relationship. With the increase in water level, the frictional resistance of waves in the propagation process decreases, energy loss reduces, and the kinetic energy and climbing ability of waves increase. Under high water level conditions, waves can more effectively convert kinetic energy into potential energy, resulting in higher wave peaks and greater climbing distances. However, when the water level exceeds a certain critical level, the depth and volume of the water body become too large, which may lead to energy dispersion and weaken the climbing effect of surges.
  • Taking the Wangjiashan landslide in the Baihetan Reservoir area as an example, under three different water level conditions, the maximum climbing elevation of the potential surge impact waves generated by the Wangjiashan landslide in the Xiangbiling residential area is 827.25 m, which is lower than the elevation of 827.5 m of the Xiangbiling residential area. Within the water level scheduling range, the potential surge wave amplitude in the Xiangbiling residential area is within the safety margin.
  • This study provides key experimental data and theoretical insights for the formation and propagation mechanism of landslide-generated surges, and offers a scientific basis and support for the risk prediction and prevention of landslide-generated surges.

Author Contributions

Conceptualization, A.S. and J.L.; methodology, A.S., J.L., L.T., C.L. and P.M.; software, J.L.; formal analysis J.L. and C.L.; investigation, J.L. and A.S.; writing original draft preparation, A.S. and J.L.; writing review and editing, A.S. and J.L. All authors have read and agreed to the published version of the manuscript.

Funding

This work was supported by the Natural Science Foundation of China (Grant No. 51939004) and the Key Science and Technology Plan Project of PowerChina Huadong Engineering Corporation Limited (Grant No. KY2021-ZD-03).

Data Availability Statement

The data that support the findings of this study are available from the corresponding author upon reasonable request.

Acknowledgments

PowerChina Huadong Engineering Corporation Limited is gratefully acknowledged for providing the study site and geological data.

Conflicts of Interest

Author Anchi Shi was employed by the company PowerChina Huadong Engineering Corporation Limited. The remaining authors declare that the research was conducted in the absence of any commercial or financial relationships that could be construed as a potential conflict of interest. The authors declare that this study received funding from PowerChina Huadong Engineering Corporation Limited. The funder was not involved in the study design, collection, analysis, interpretation of data, the writing of this article or the decision to submit it for publication.

References

  1. Tang, H.M.; Wasowski, J.; Juang, C.H. Geohazards in the three Gorges Reservoir Area, China Lessons learned from decades of research. Eng. Geol. 2019, 261, 16. [Google Scholar] [CrossRef]
  2. Zhang, Y.G.; Zhang, Z.; Xue, S.; Wang, R.J.; Xiao, M. Stability analysis of a typical landslide mass in the Three Gorges Reservoir under varying reservoir water levels. Environ. Earth Sci. 2020, 79, 14. [Google Scholar] [CrossRef]
  3. Zhang, S.L.; Yin, Y.P.; Hu, X.W.; Wang, W.P.; Zhang, N.; Zhu, S.N.; Wang, L.Q. Dynamics and emplacement mechanisms of the successive Baige landslides on the Upper Reaches of the Jinsha River, China. Eng. Geol. 2020, 278, 13. [Google Scholar] [CrossRef]
  4. Fu, Z.Y.; Li, D.Q.; Wang, S.; Zhang, L.M.; Du, W.Q. Causes of episodic movement of the Baijiabao landslide based on multiple-time scale analysis. Landslides 2024, 21, 1069–1082. [Google Scholar] [CrossRef]
  5. Dai, Z.; Zhang, Y.; Zhang, C.; Luo, J.; Yao, W. Interpreting the Influence of Reservoir Water Level Fluctuation on the Seepage and Stability of an Ancient Landslide in the Three Gorges Reservoir Area: A Case Study of the Outang Landslide. Geotech. Geol. Eng. 2022, 40, 4551–4561. [Google Scholar] [CrossRef]
  6. Zhang, X.; Tu, G.X.; Luo, Q.F.; Tang, H.; Zhang, Y.L.; Li, A.R. Failure mechanism of a large-scale composite deposits caused by the water level increases. J. Mt. Sci. 2023, 20, 1369–1384. [Google Scholar] [CrossRef]
  7. Hou, T.-S.; Xu, G.-L.; Zhang, D.-Q.; Liu, H.-Y. Stability analysis of Gongjiacun landslide in the three Gorges Reservoir area under the action of reservoir water level fluctuation and rainfall. Nat. Hazards 2022, 114, 1647–1683. [Google Scholar] [CrossRef]
  8. Cheng, Z.; Liu, S.; Fan, X.; Shi, A.; Yin, K. Deformation behavior and triggering mechanism of the Tuandigou landslide around the reservoir area of Baihetan hydropower station. Landslides 2023, 20, 1679–1689. [Google Scholar] [CrossRef]
  9. Sun, G.; Zheng, H.; Tang, H.; Dai, F. Huangtupo landslide stability under water level fluctuations of the Three Gorges reservoir. Landslides 2016, 13, 1167–1179. [Google Scholar] [CrossRef]
  10. Yi, X.; Feng, W.; Li, B.; Yin, B.; Dong, X.; Xin, C.; Wu, M. Deformation characteristics, mechanisms, and potential impulse wave assessment of the Wulipo landslide in the Baihetan reservoir region, China. Landslides 2023, 20, 615–628. [Google Scholar] [CrossRef]
  11. Li, Z.-H.; Jiang, N.; Shi, A.-C.; Zhao, L.-Y.; Xian, Z.; Luo, X.-L.; Li, H.-B.; Zhou, J.-W. Reservoir landslide monitoring and mechanism analysis based on UAV photogrammetry and sub-pixel offset tracking: A case study of Wulipo landslide. Front. Earth Sci. 2024, 11, 1333815. [Google Scholar] [CrossRef]
  12. Zhou, C.; Yin, K.L.; Cao, Y.; Ahmed, B. Application of time series analysis and PSO-SVM model in predicting the Bazimen landslide in the Three Gorges Reservoir, China. Eng. Geol. 2016, 204, 108–120. [Google Scholar] [CrossRef]
  13. Huang, R.Q.; Li, W.L. Development and distribution of geohazards triggered by the 5.12 Wenchuan Earthquake in China. Sci. China Ser. E-Technol. Sci. 2009, 52, 810–819. [Google Scholar] [CrossRef]
  14. Sun, L.; Li, C.; Shen, F.; Zhang, H. Reactivation mechanism and evolution characteristics of water softening-induced reservoir-reactivated landslides: A case study for the Three Gorges Reservoir Area, China. Bull. Eng. Geol. Environ. 2023, 82, 66. [Google Scholar] [CrossRef]
  15. Panizzo, A.; De Girolamo, P.; Di Risio, M.; Maistri, A.; Petaccia, A. Great landslide events in Italian artificial reservoirs. Nat. Hazards Earth Syst. Sci. 2005, 5, 733–740. [Google Scholar] [CrossRef]
  16. Boon, C.W.; Houlsby, G.T.; Utili, S. New insights into the 1963 Vajont slide using 2D and 3D distinct-element method analyses. Geotechnique 2014, 64, 800–816. [Google Scholar] [CrossRef]
  17. Wolter, A.; Stead, D.; Ward, B.C.; Clague, J.J.; Ghirotti, M. Engineering geomorphological characterisation of the Vajont Slide, Italy, and a new interpretation of the chronology and evolution of the landslide. Landslides 2016, 13, 1067–1081. [Google Scholar] [CrossRef]
  18. Barla, G.; Paronuzzi, P. The 1963 Vajont Landslide: 50th Anniversary. Rock Mech. Rock Eng. 2013, 46, 1267–1270. [Google Scholar] [CrossRef]
  19. Tang, W.Z.; Li, Z.Y.; Qiang, M.S.; Wang, S.L.; Lu, Y.M. Risk management of hydropower development in China. Energy 2013, 60, 316–324. [Google Scholar] [CrossRef]
  20. Chen, S.; Shi, A.; Xu, W.; Yan, L.; Wang, H.; Tian, L.; Xie, W.-C. Numerical investigation of landslide-induced waves: A case study of Wangjiashan landslide in Baihetan Reservoir, China. Bull. Eng. Geol. Environ. 2023, 82, 110. [Google Scholar] [CrossRef]
  21. Fang, K.; Tang, H.; Li, C.; Su, X.; An, P.; Sun, S. Centrifuge modelling of landslides and landslide hazard mitigation: A review. Geosci. Front. 2023, 14, 101493. [Google Scholar] [CrossRef]
  22. Mergili, M.; Frank, B.; Fischer, J.T.; Huggel, C.; Pudasaini, S.P. Computational experiments on the 1962 and 1970 landslide events at Huascaran (Peru) with r.avaflow: Lessons learned for predictive mass flow simulations. Geomorphology 2018, 322, 15–28. [Google Scholar] [CrossRef]
  23. Huang, B.; Yin, Y.; Liu, G.; Chen, X.; Wang, S. A comparative study on the physical prototype test and numerical simulation of the swell of the Gongjiafang landslide in the Three Gorges Reservoir area. Rock. Mech. Eng. J. 2014, 2677–2684. [Google Scholar] [CrossRef]
  24. Shi, C.; An, Y.; Yang, J. A SPH based numerical method of landslide induced impulse wave and its application on Huangtian landslide event. Sci. Sin. Phys. Mech. Astron. 2015, 45, 104706. [Google Scholar]
  25. Sun, G.; Yang, Y.; Jiang, W.; Zheng, H. Effects of an increase in reservoir drawdown rate on bank slope stability: A case study at the Three Gorges Reservoir, China. Eng. Geol. 2017, 221, 61–69. [Google Scholar] [CrossRef]
  26. Luo, S.L.; Huang, D.; Peng, J.B.; Tomás, R. Influence of permeability on the stability of dual-structure landslide with different deposit-bedding interface morphology: The case of the three Gorges Reservoir area, China. Eng. Geol. 2022, 296, 22. [Google Scholar] [CrossRef]
  27. Huang, X.; Guo, F.; Deng, M.; Yi, W.; Huang, H. Understanding the deformation mechanism and threshold reservoir level of the floating weight-reducing landslide in the Three Gorges Reservoir Area, China. Landslides 2020, 17, 2879–2894. [Google Scholar] [CrossRef]
  28. Fell, R.; Cororninas, J.; Bonnard, C.; Cascini, L.; Leroi, E.; Savage, W.Z.; JTC-1 Joint Technical Committee on Landslides and Engineered Slopes. Guidelines for landslide susceptibility, hazard and risk-zoning for land use planning. Eng. Geol. 2008, 102, 85–98. [Google Scholar] [CrossRef]
  29. Dai, F.C.; Lee, C.F.; Ngai, Y.Y. Landslide risk assessment and management: An overview. Eng. Geol. 2002, 64, 65–87. [Google Scholar] [CrossRef]
  30. van Westen, C.J.; Castellanos, E.; Kuriakose, S.L. Spatial data for landslide susceptibility, hazard, and vulnerability assessment: An overview. Eng. Geol. 2008, 102, 112–131. [Google Scholar] [CrossRef]
  31. Ataie-Ashtiani, B.; Nik-Khah, A. Impulsive waves caused by subaerial landslides. Environ. Fluid Mech. 2008, 8, 263–280. [Google Scholar] [CrossRef]
  32. Yavari-Ramshe, S.; Ataie-Ashtiani, B. On the effects of landslide deformability and initial submergence on landslide-generated waves. Landslides 2019, 16, 37–53. [Google Scholar] [CrossRef]
  33. Huang, B.; Yin, Y.; Li, R.; Zhang, P.; Qin, Z.; Li, Y.; Cheng, S.; Li, Q.; Xu, K. Three-dimensional experimental investigation on hazard reduction of landslide-generated impulse waves in the Baihetan Reservoir, China. Landslides 2023, 20, 2017–2028. [Google Scholar] [CrossRef]
Figure 1. XBL residential area and the WJS landslide on the opposite bank.
Water 17 00890 g001
Figure 2. Aerial view of the WJS landslide after slope reduction mitigation.
Water 17 00890 g002
Figure 3. Large-scale three-dimensional geomechanical model testing facility for WJS landslide-generated waves.
Water 17 00890 g003
Figure 4. Layout of experimental monitoring points.
Water 17 00890 g004
Figure 5. Movement process of WJS landslide-generated waves under the 825 m water level condition. (ad) Images of landslide slides at different moments.
Water 17 00890 g005
Figure 6. Propagation process of WJS landslide-generated waves toward the opposite shore.
Water 17 00890 g006
Figure 7. Temporal variation curves of wave heights at different measurement points under different water level conditions. (a) Measurement point h5. (b) Measurement point h6. (c) Measurement point h7.
Water 17 00890 g007
Figure 8. Variation in first wave height and opposite shore run-up at different measurement points under different water level conditions. (a) First wave height at measurement point h5. (b) Opposite shore run-up at measurement point h6. (c) First wave height at measurement point h7.
Water 17 00890 g008
Figure 9. Temporal variation curves of wave height along the flow path under different water level conditions. (a) Water level condition of 800 m ASL. (b) Water level condition of 815 m ASL. (c) Water level condition of 825 m ASL.
Water 17 00890 g009
Figure 10. Temporal variation curves of wave run-up at various measurement points around the Elephant Nose Ridge residential area under different water levels.
Water 17 00890 g010
Figure 11. Maximum impulsive waves run-up at the XBL residential area under different water level conditions. (a) Trend curve of maximum impulsive waves run-up value changes. (b) Magnitude of maximum impulsive waves run-up. A represents 800 m ASL, B represents 815 m ASL, C represents 825 m ASL.
Water 17 00890 g011
Disclaimer/Publisher’s Note: The statements, opinions and data contained in all publications are solely those of the individual author(s) and contributor(s) and not of MDPI and/or the editor(s). MDPI and/or the editor(s) disclaim responsibility for any injury to people or property resulting from any ideas, methods, instructions or products referred to in the content.

