
CO2 Reactivation of Activated Carbon to Improve Its Adsorption Capacity and Rate Toward Chlorpheniramine

 , , and
Abstract

1. Introduction
2. Diffusional Model
2.1. External Mass Transfer Model
2.2. Pore Volume and Surface Diffusion Model
3. Materials and Methods
3.1. CO2-Reactivation of Activated Carbons
3.2. Chemical Reagents
3.3. Characterization of Modified Activated Carbons
3.4. Determination of CPA in Aqueous Solutions
3.5. Adsorption Equilibrium Experiments
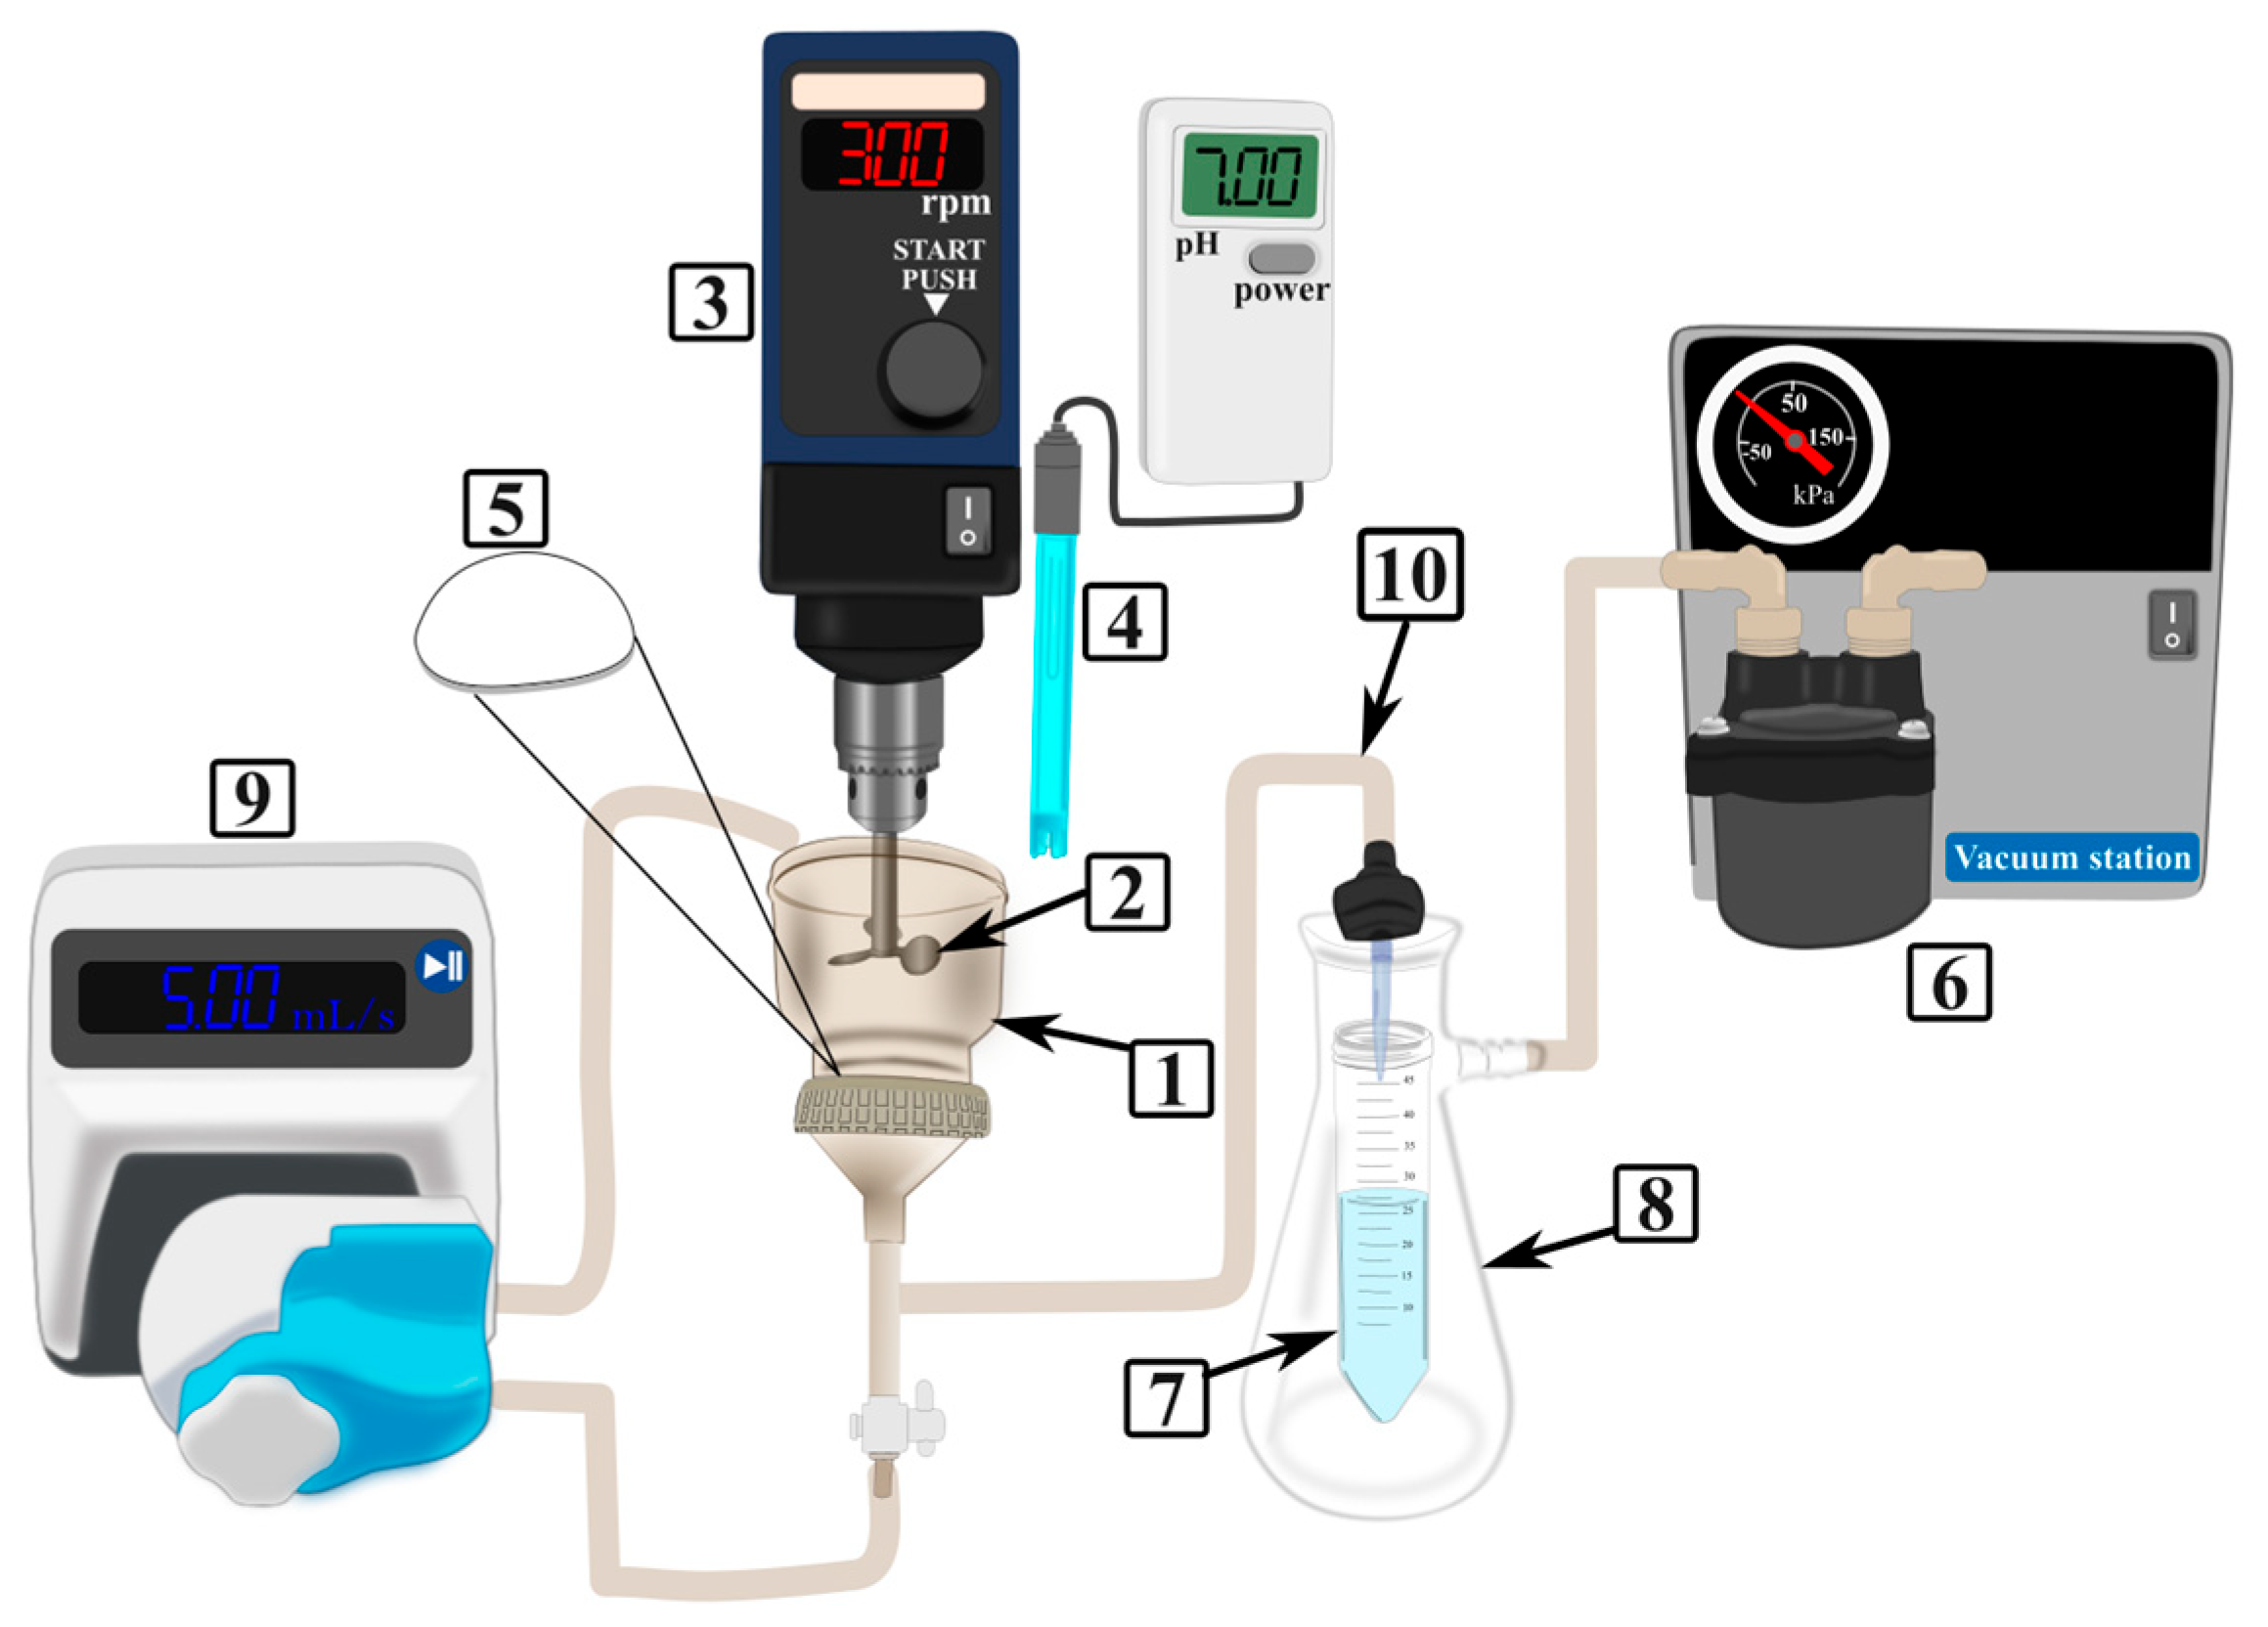
3.6. Adsorption Rate Experiments
4. Results and Discussion
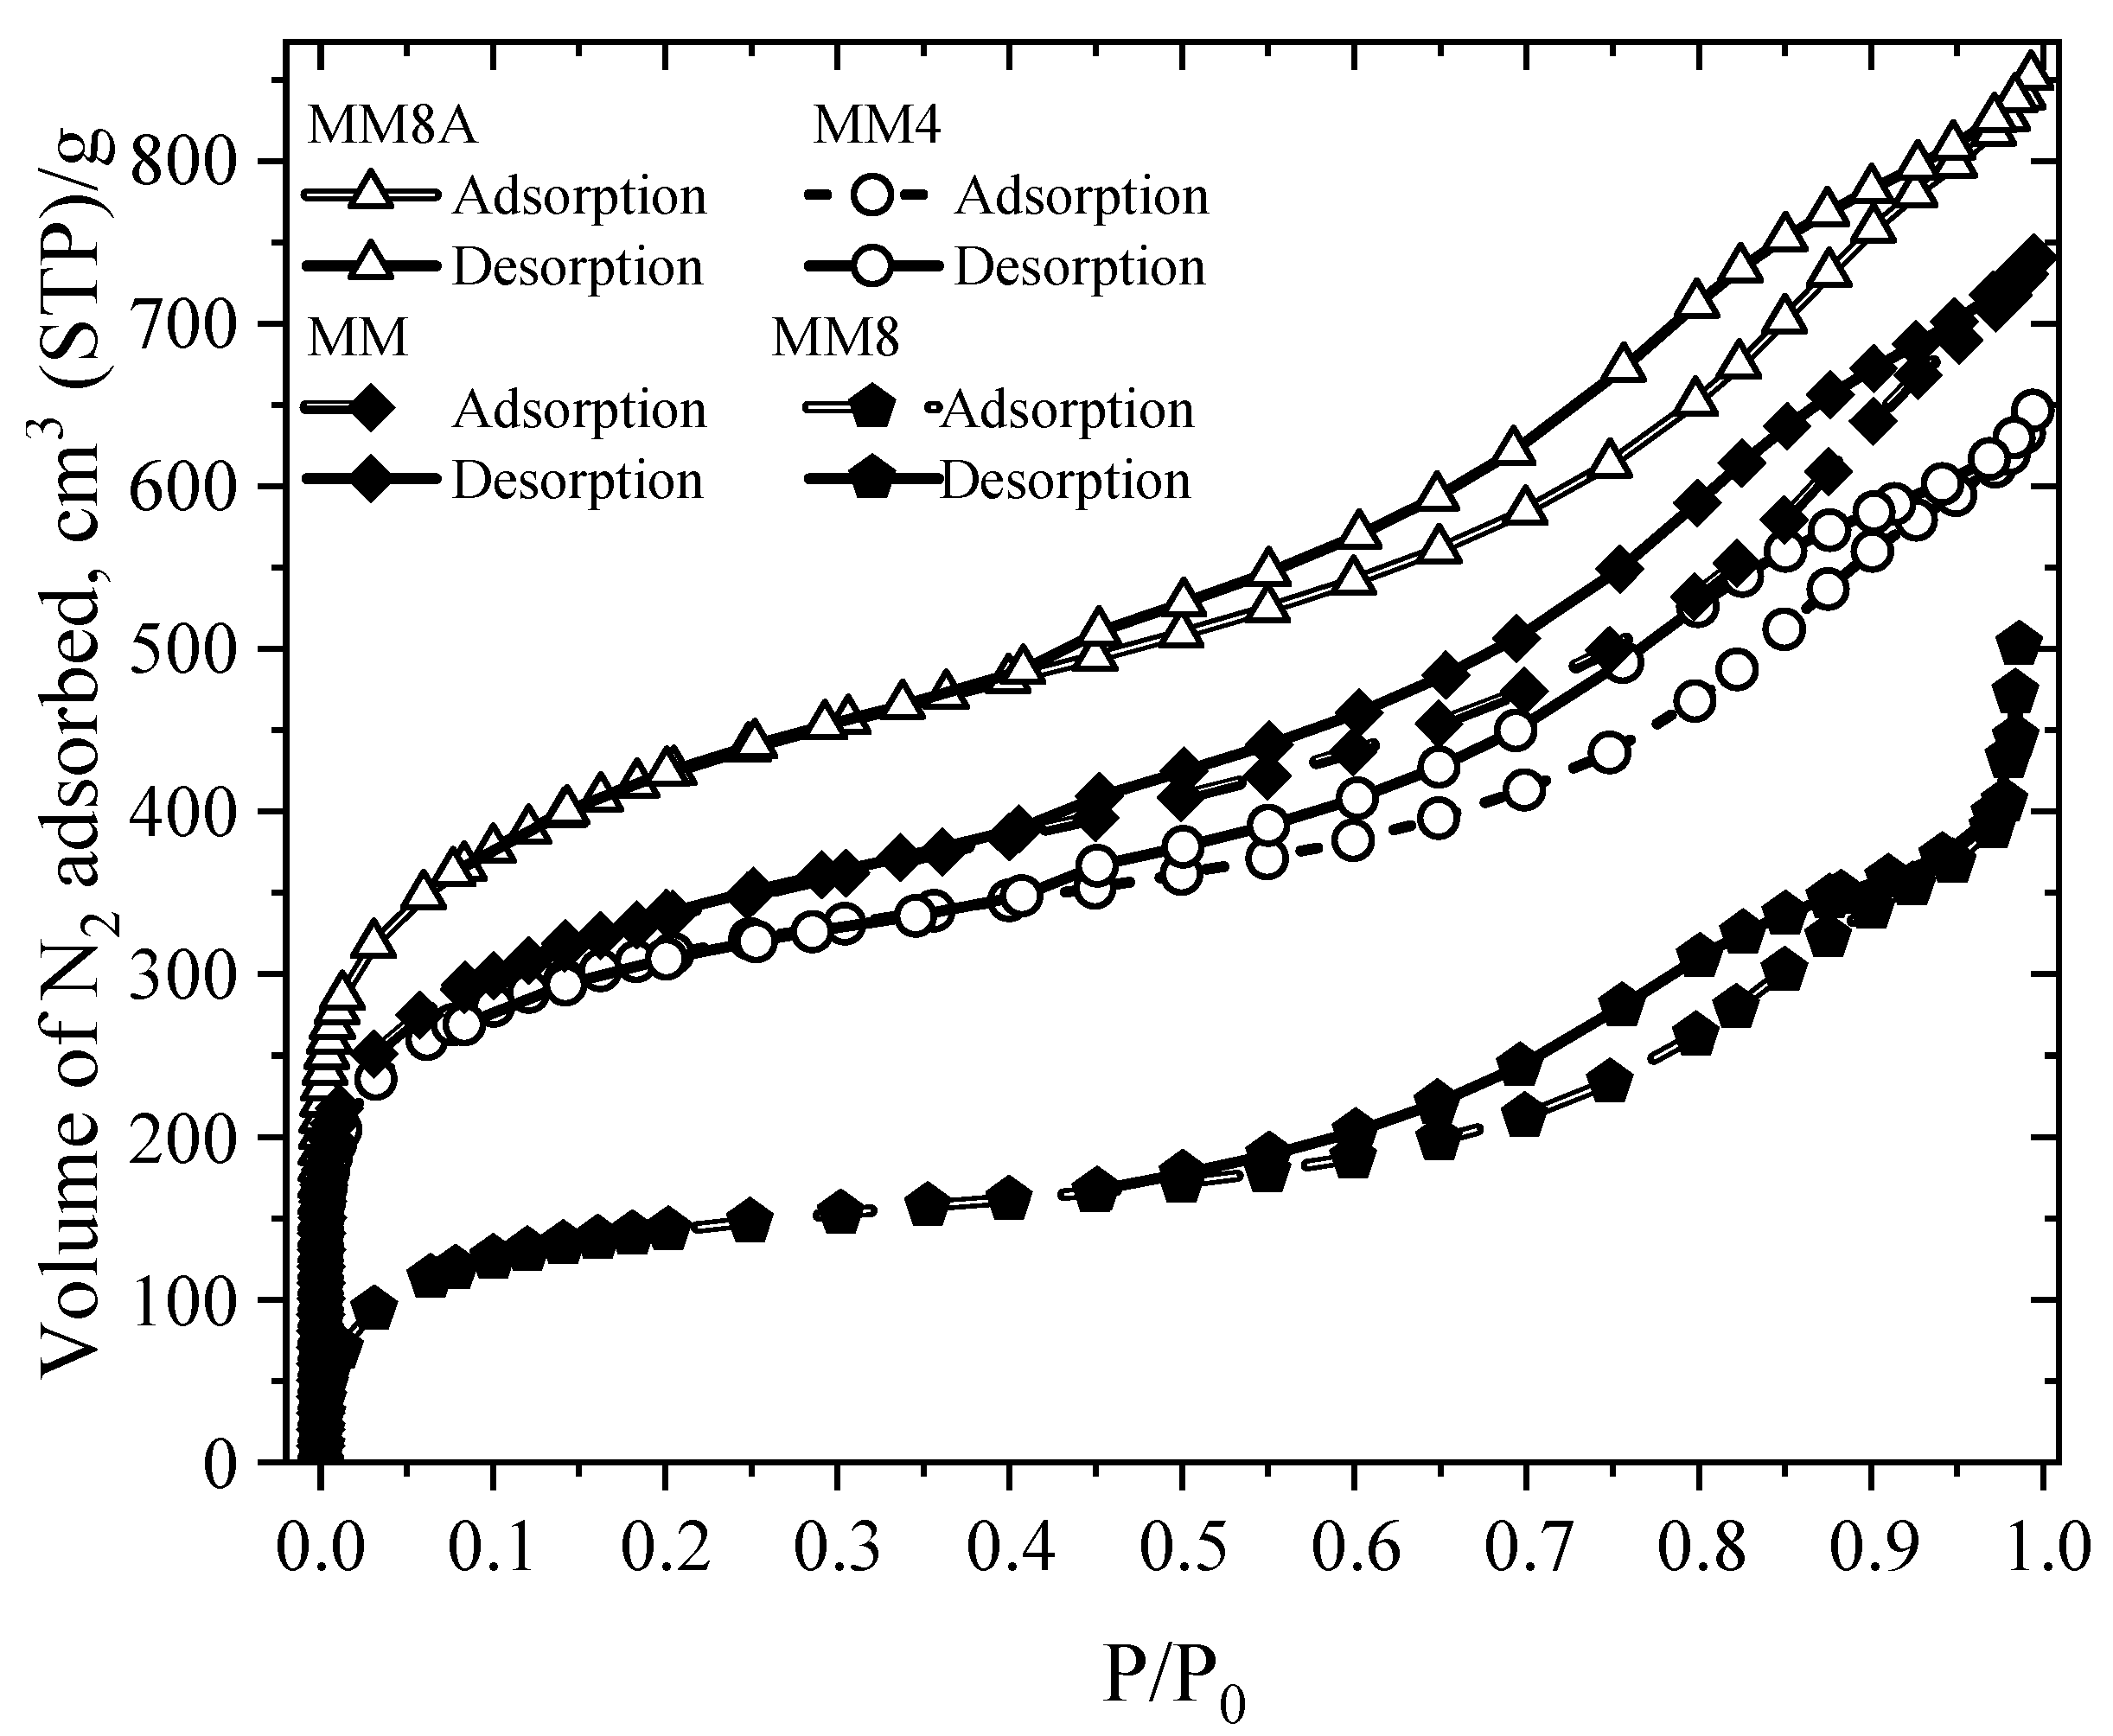
4.1. Textural Properties of Modified Activated Carbons
4.2. Quantification of the Active Sites on MM, MM4, MM8, and MM8A
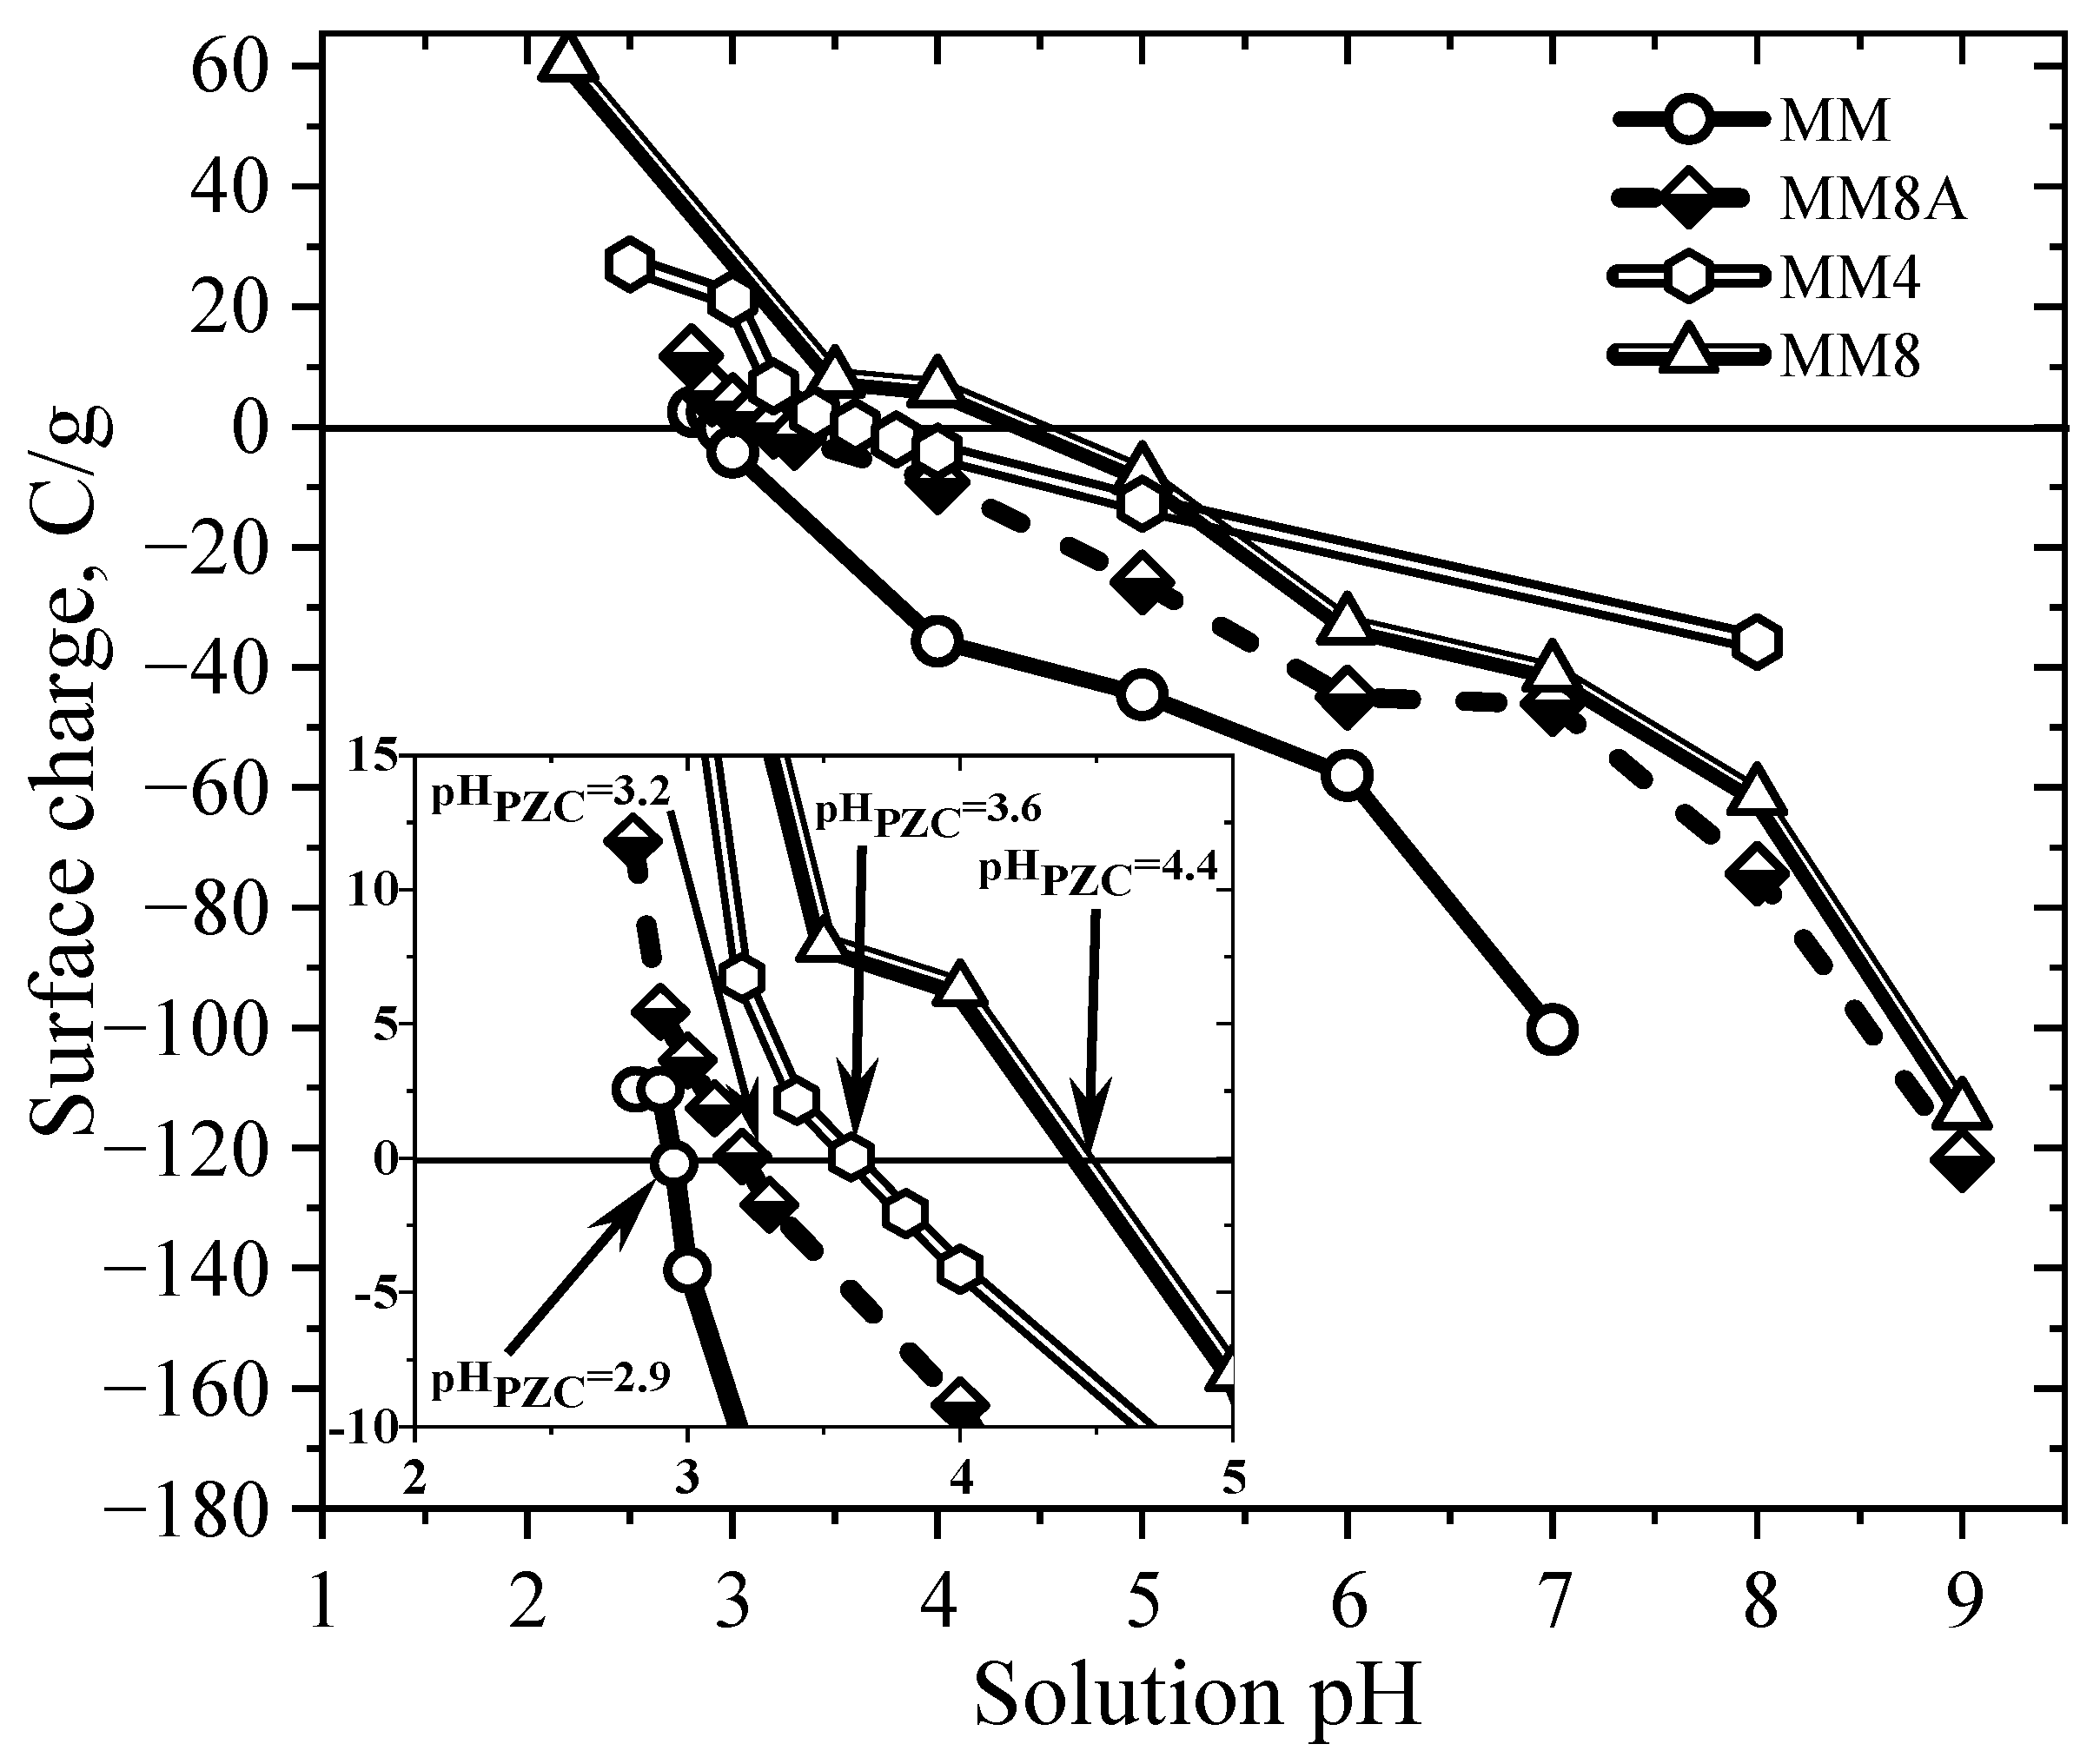
4.3. Surface Charge Distribution and Point of Zero Charge of Activated Carbons
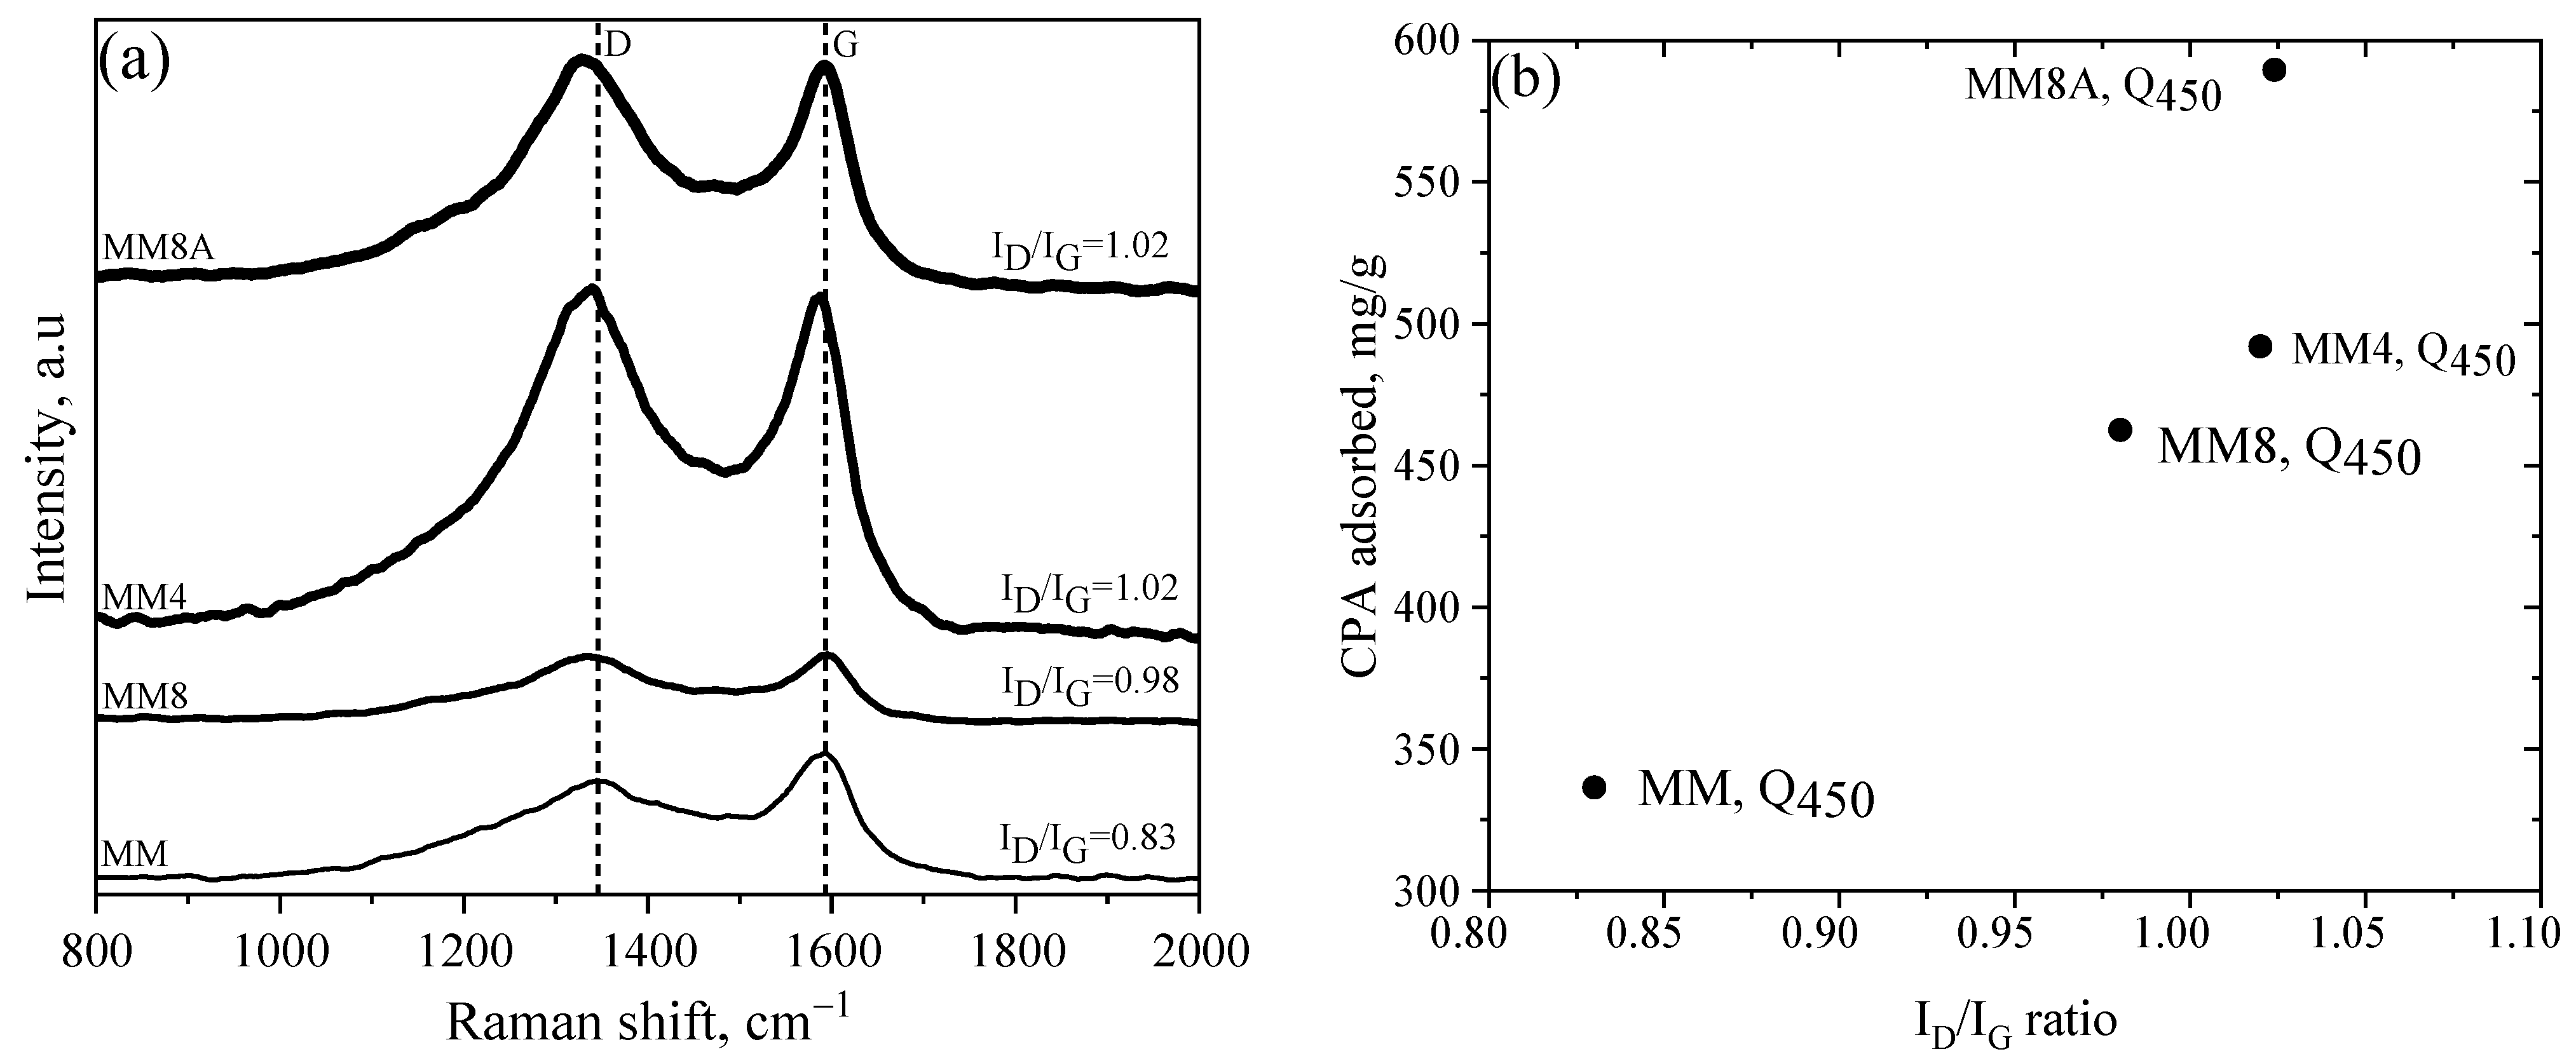
4.4. Surface Morphology and Raman Spectra of ACs
4.5. Adsorption Equilibrium of CPA on ACs
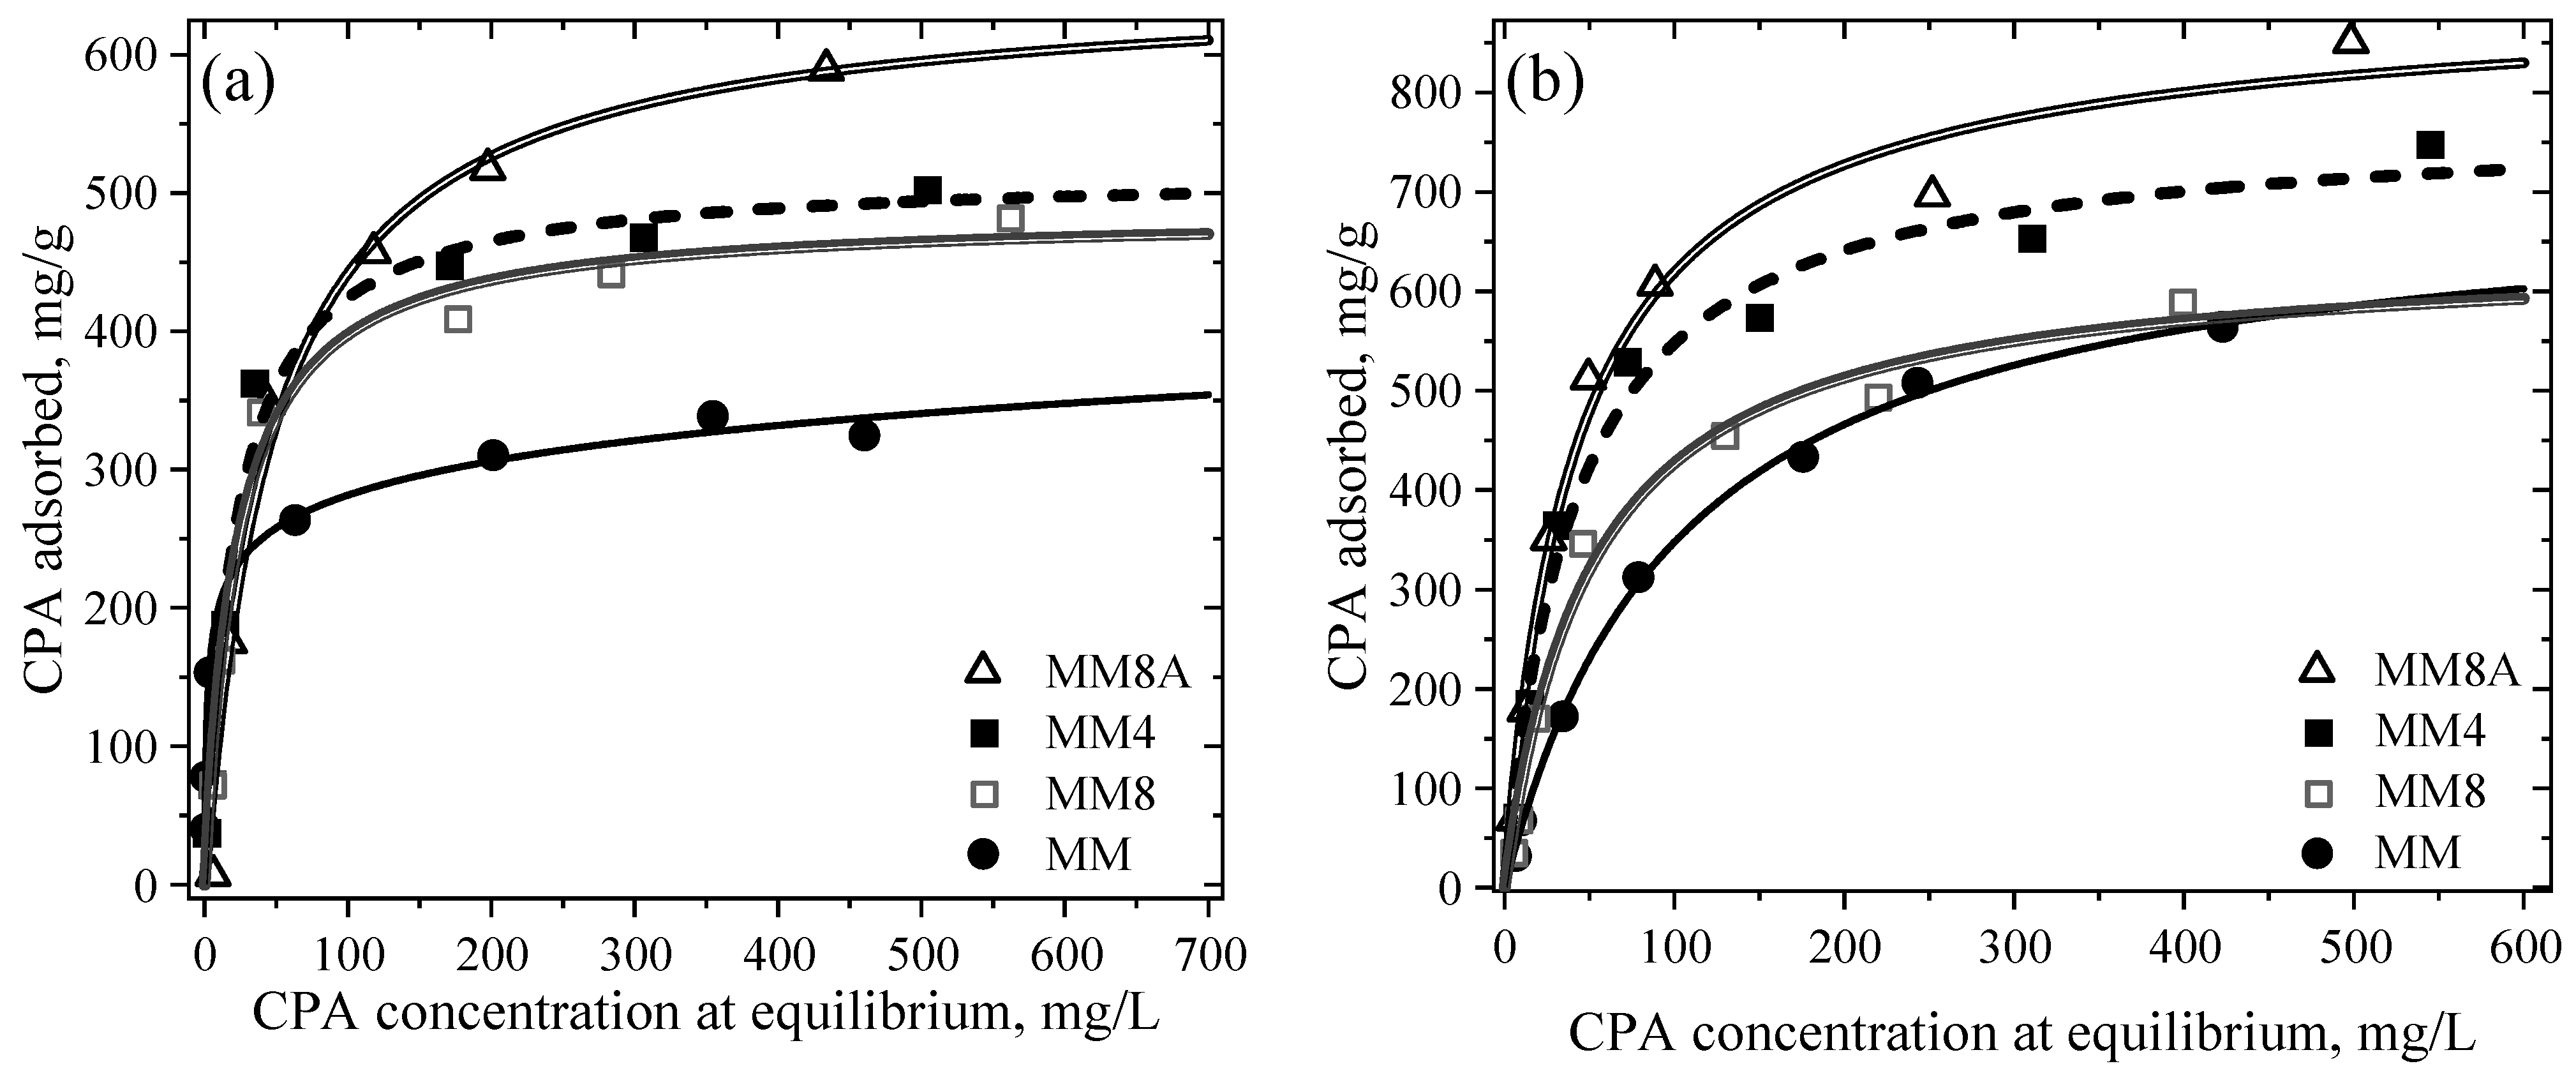
4.5.1. Adsorption Isotherms of CPA on MM, MM4, MM8 and MM8A
4.5.2. Adsorption Capacity of MM, MM4, MM8, and MM8A Toward CPA
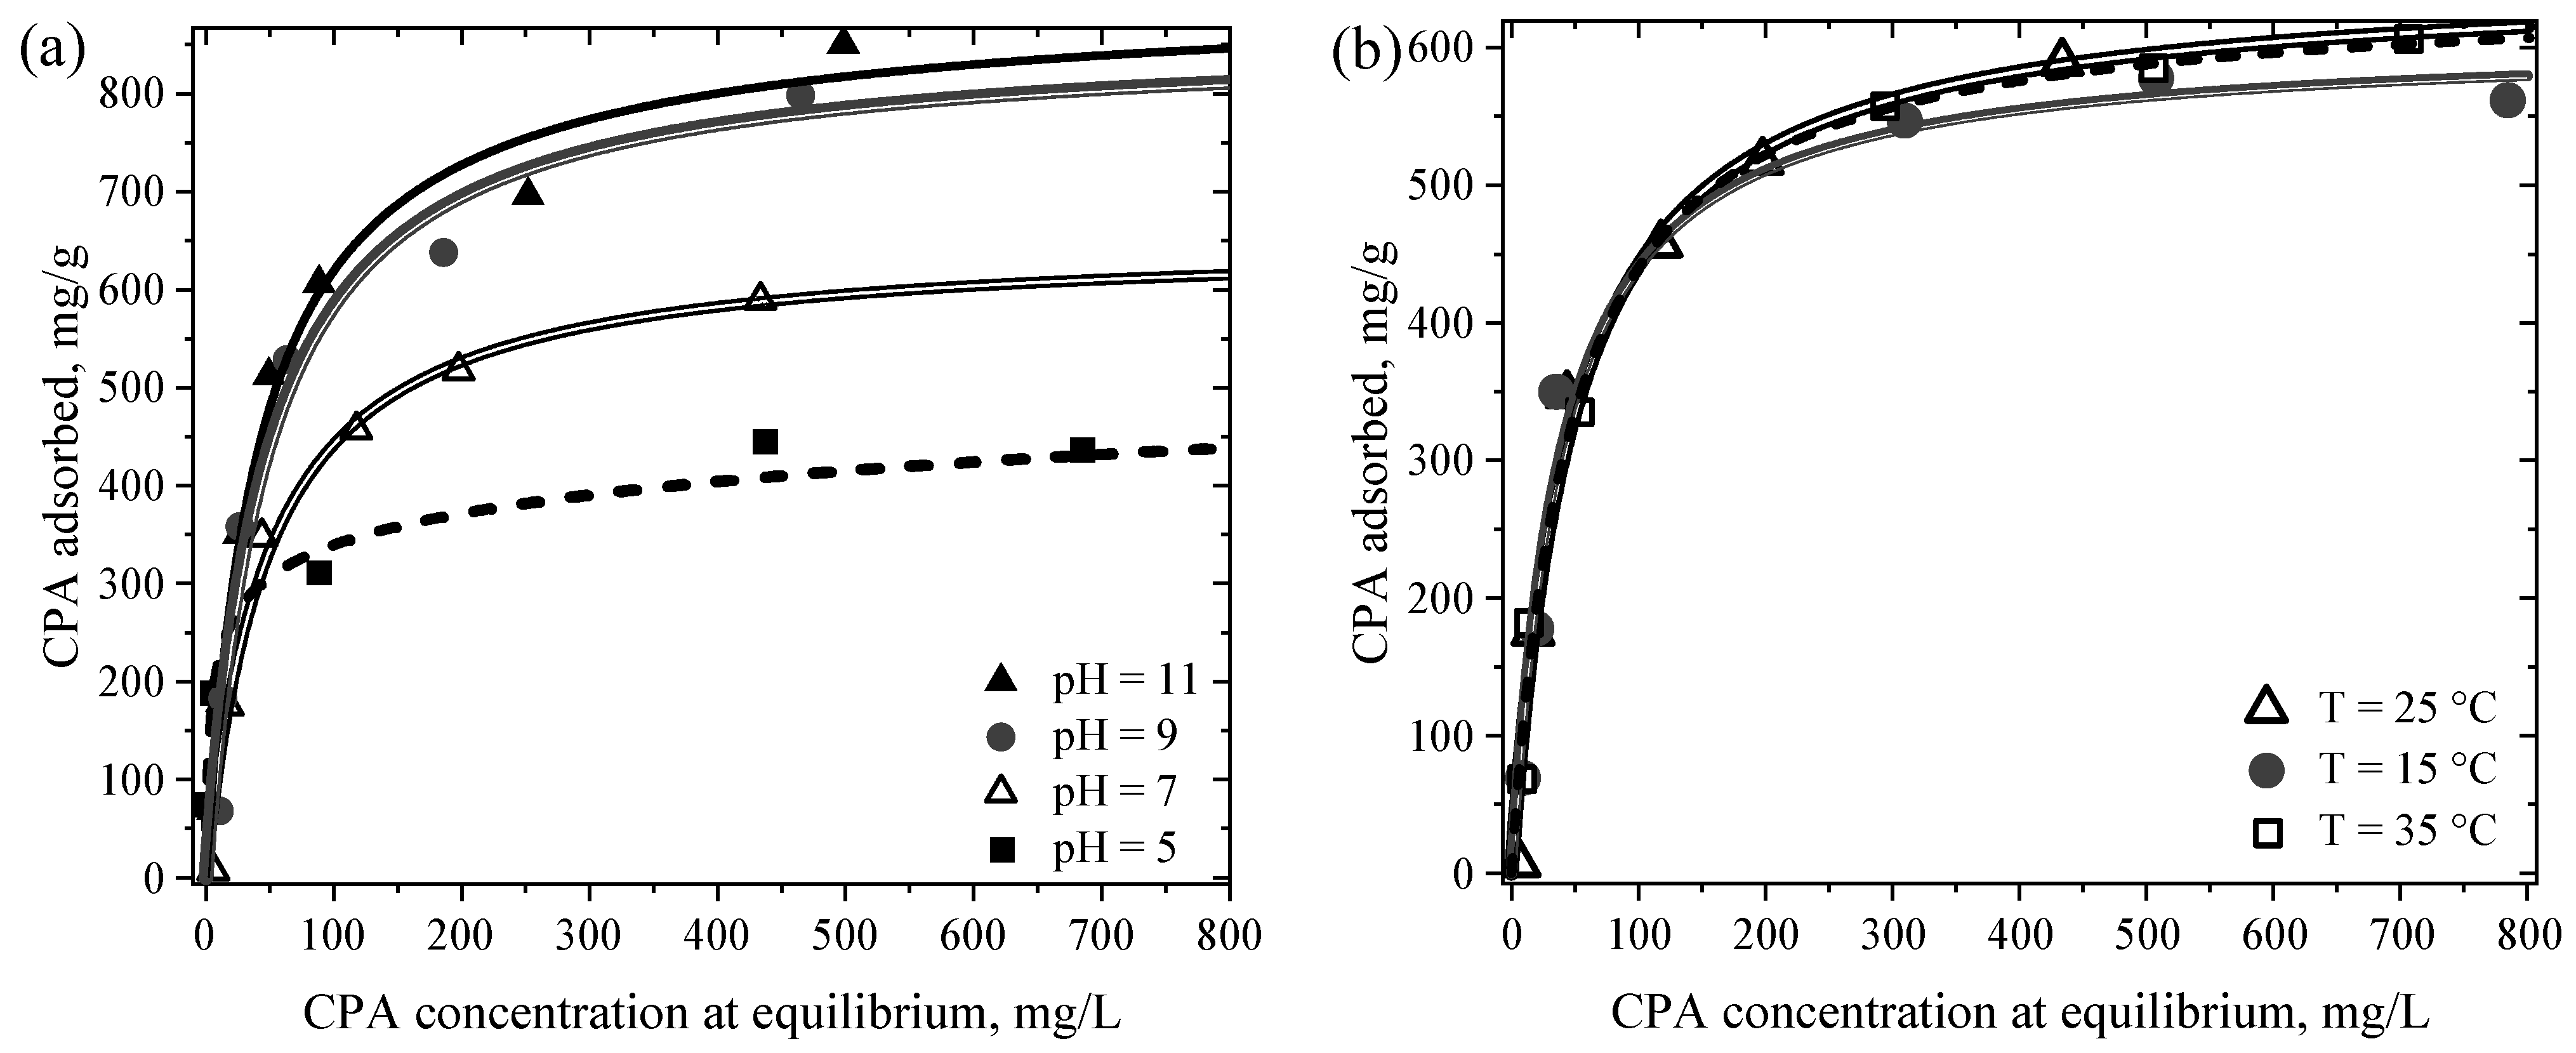
4.5.3. Solution pH and Temperature Effects on the Adsorption Capacity of MM8A Toward CPA
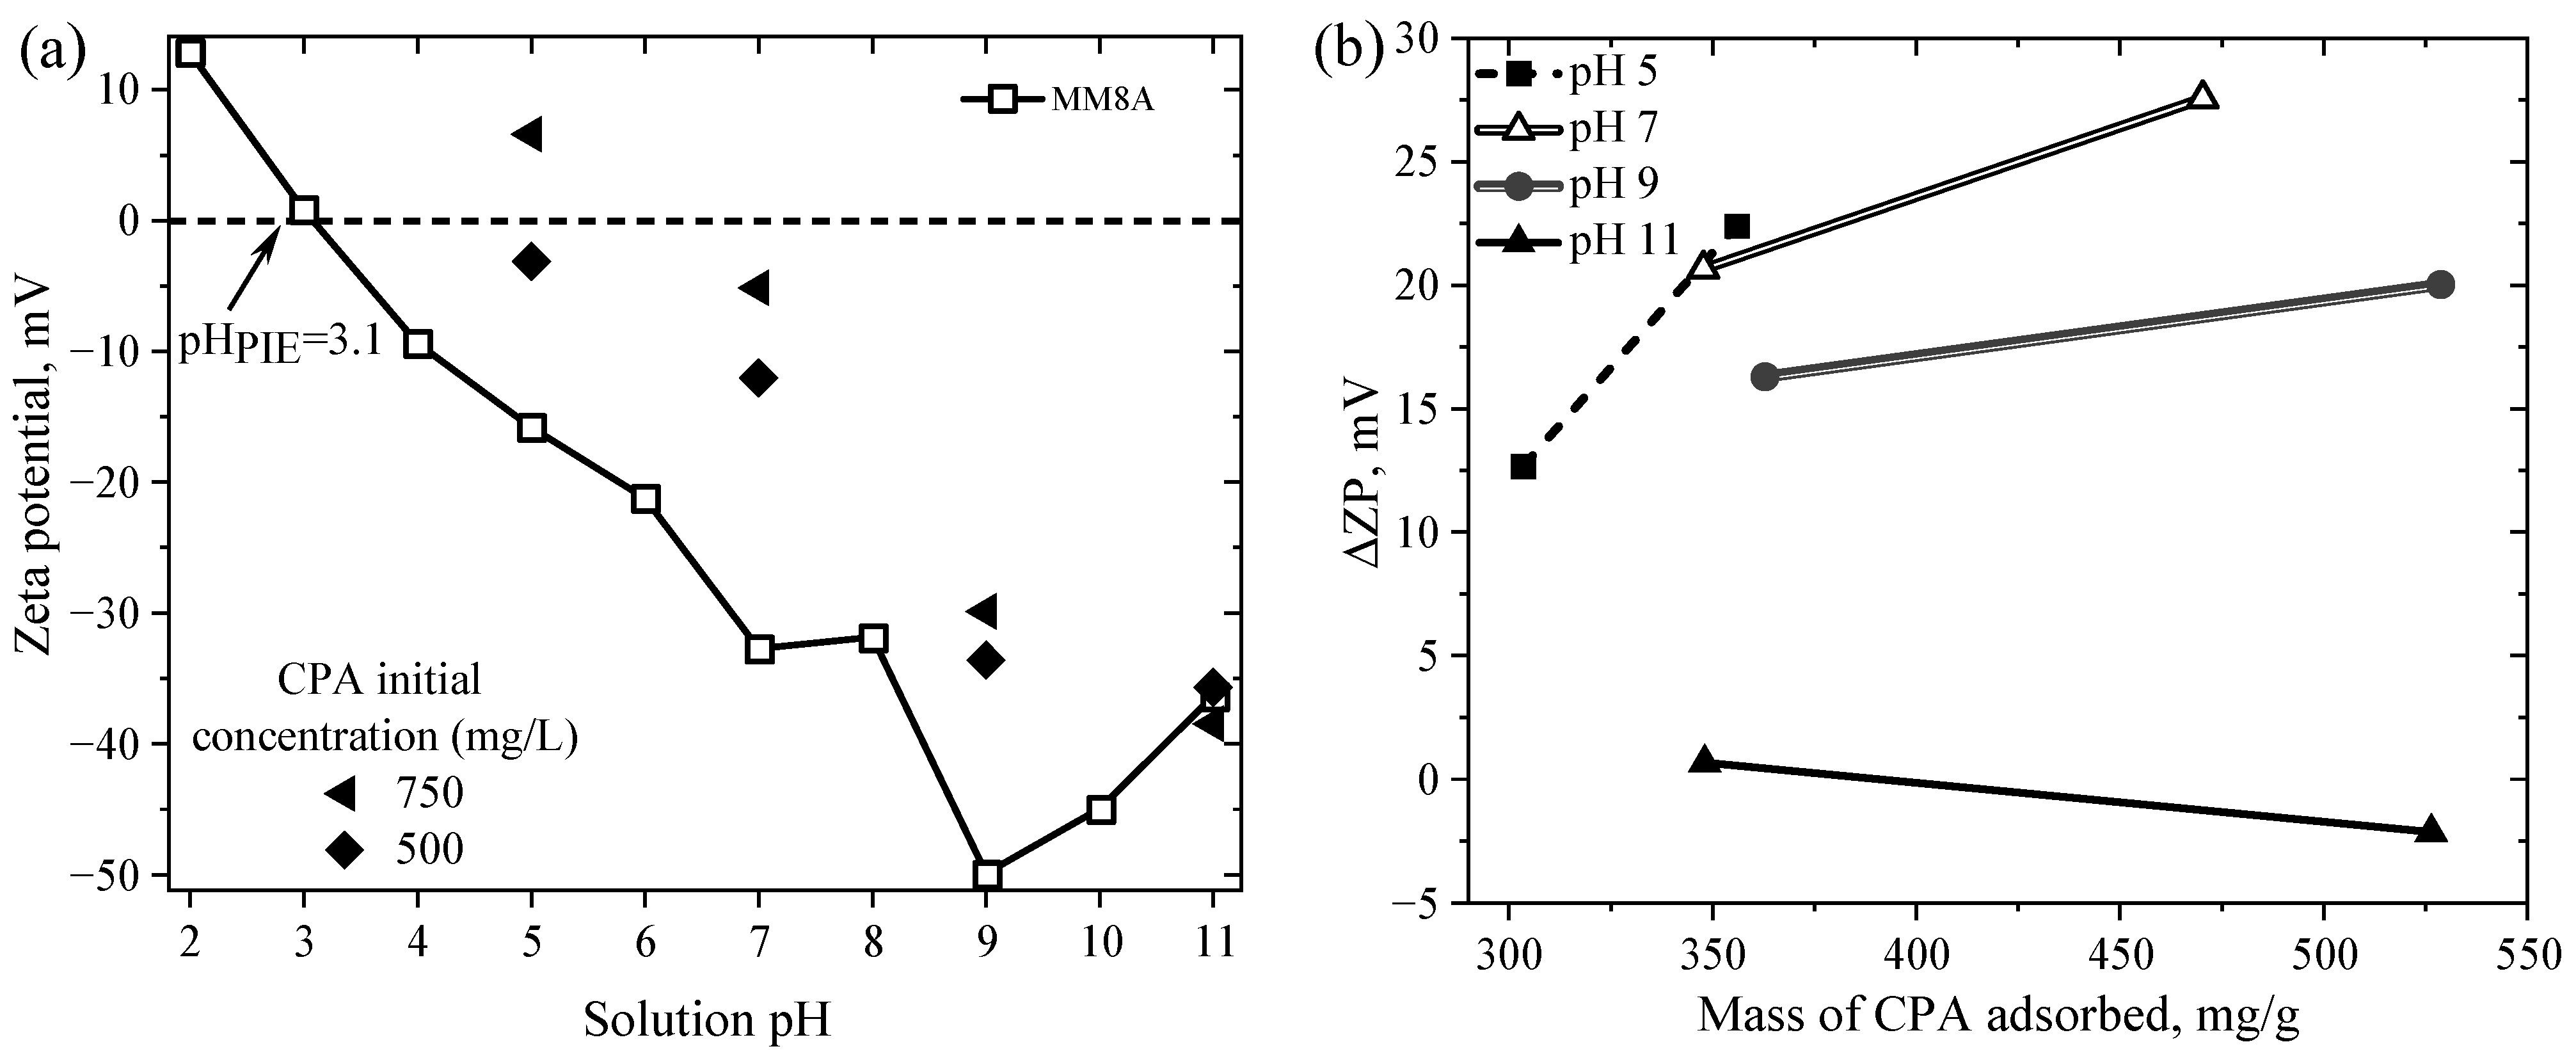
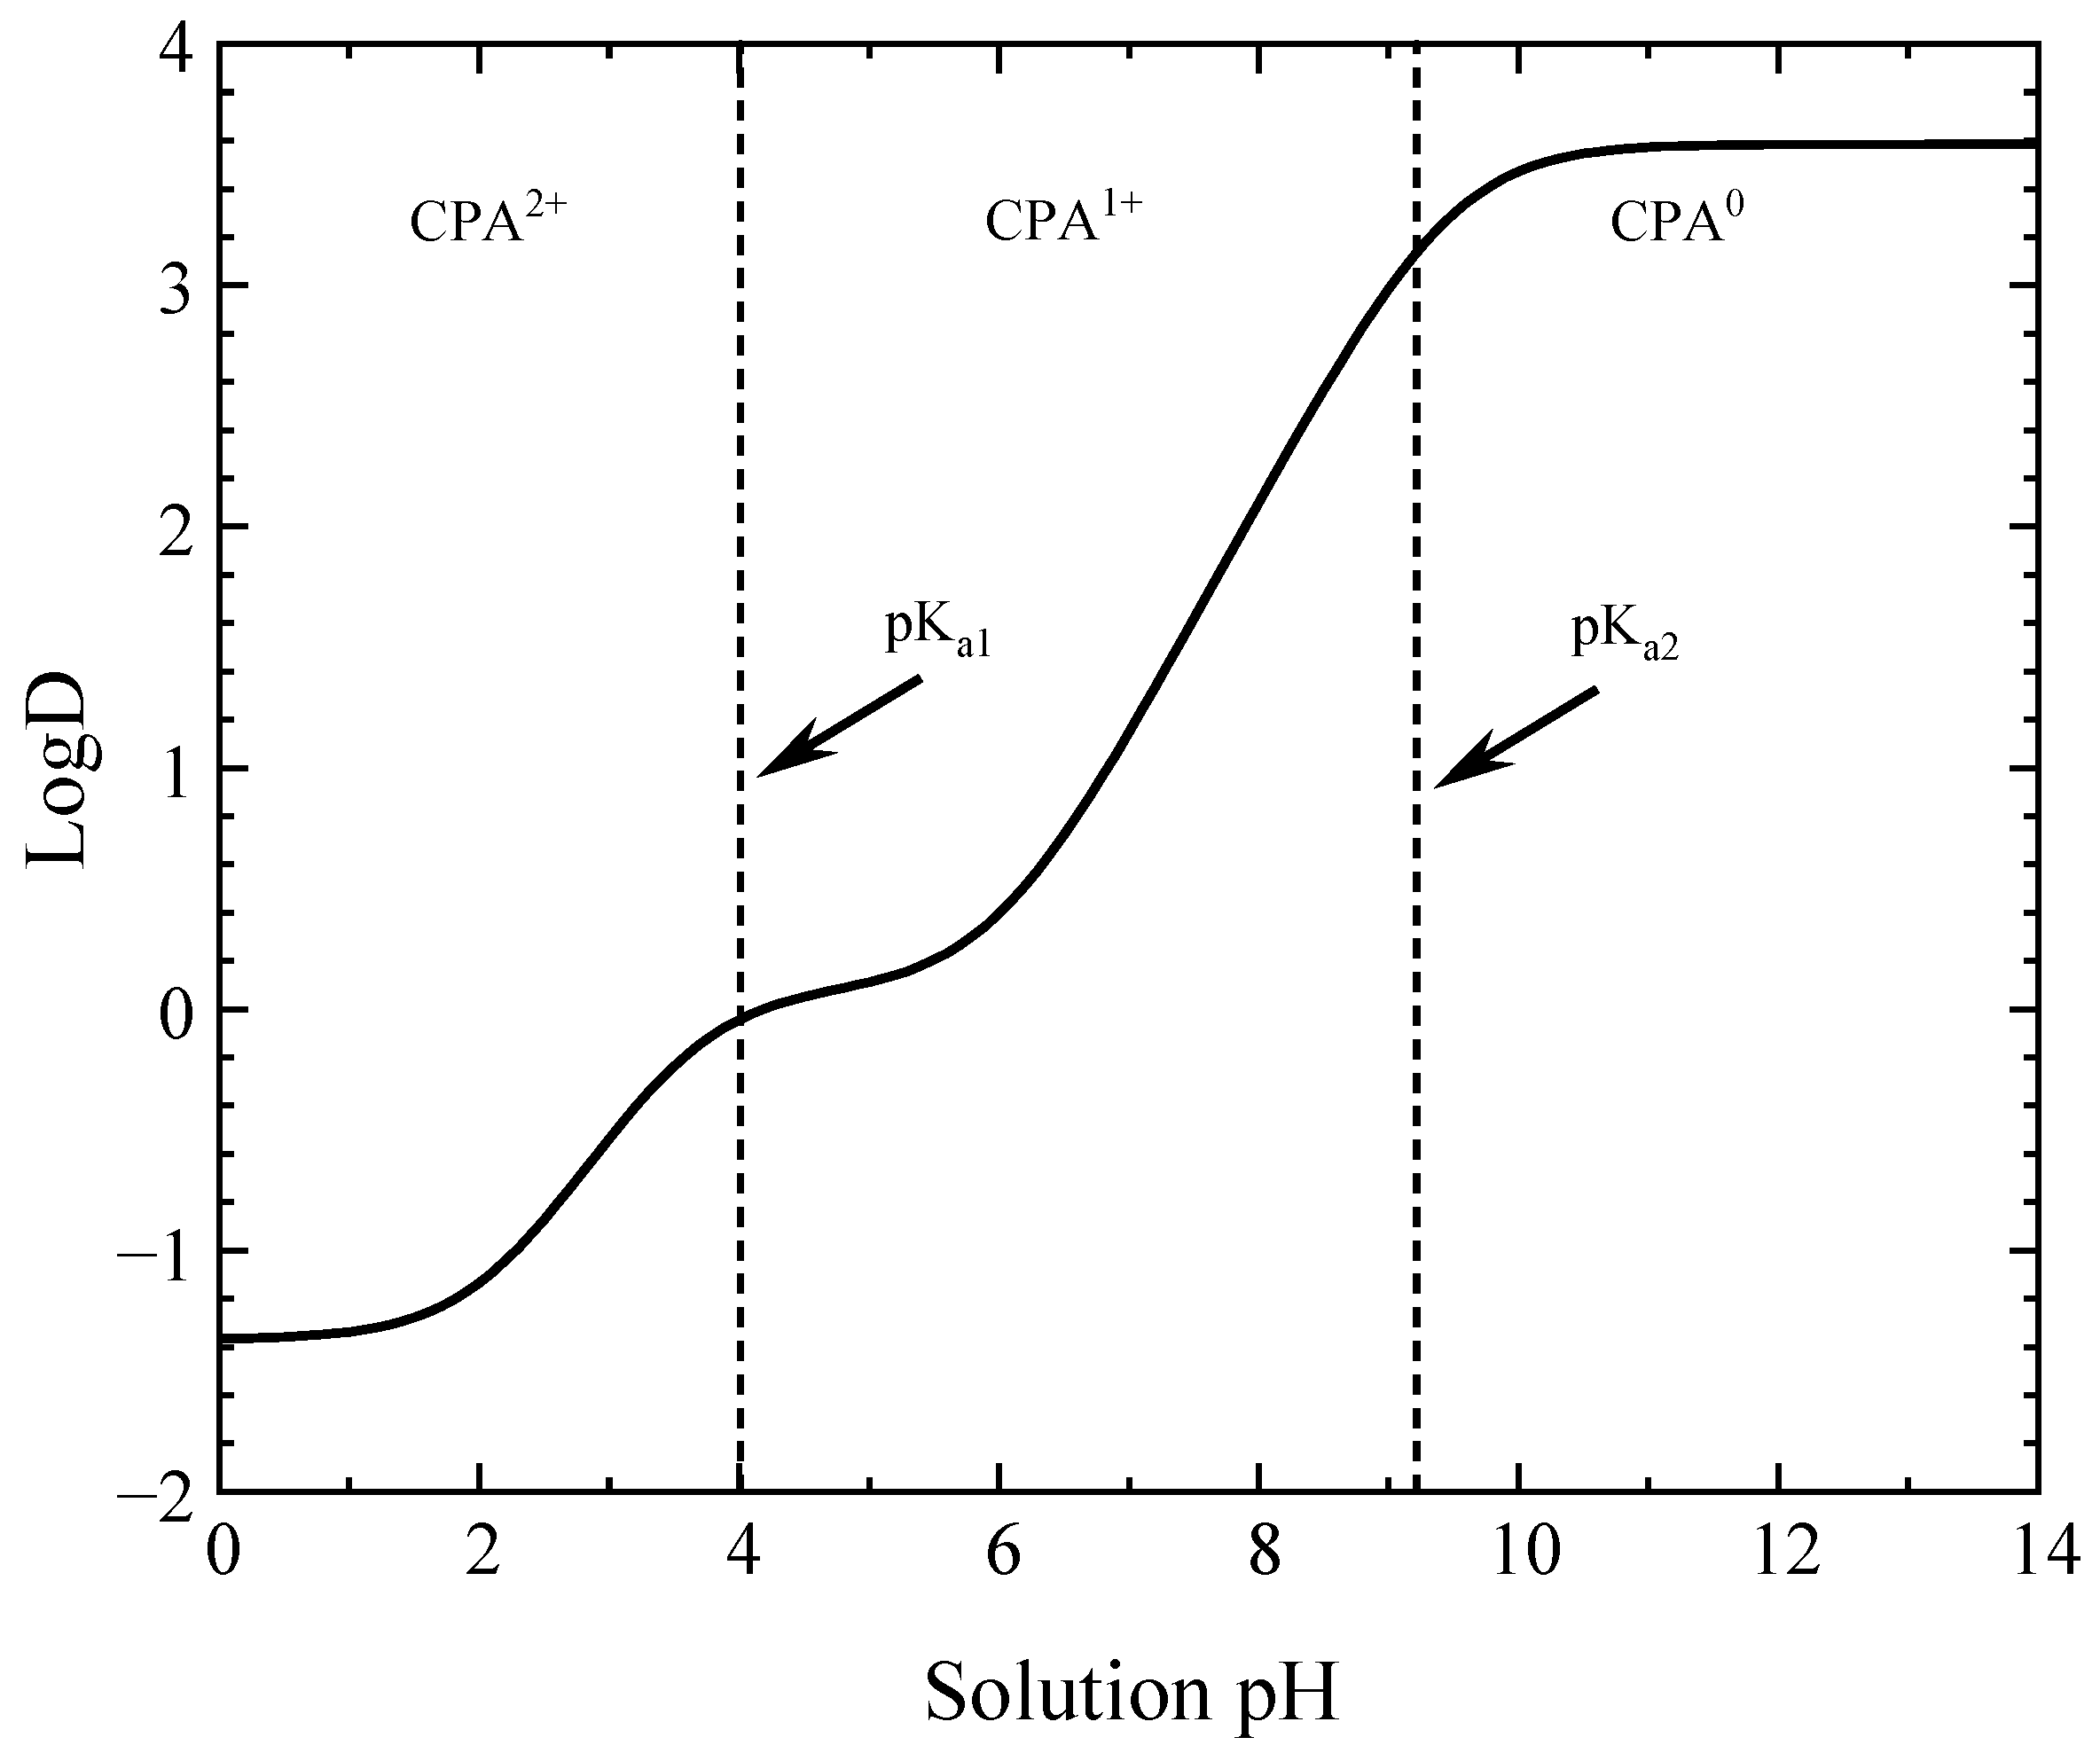
4.5.4. Mechanisms of CPA Adsorption on MM8A
4.6. Rate of CPA Adsorption on MM8A
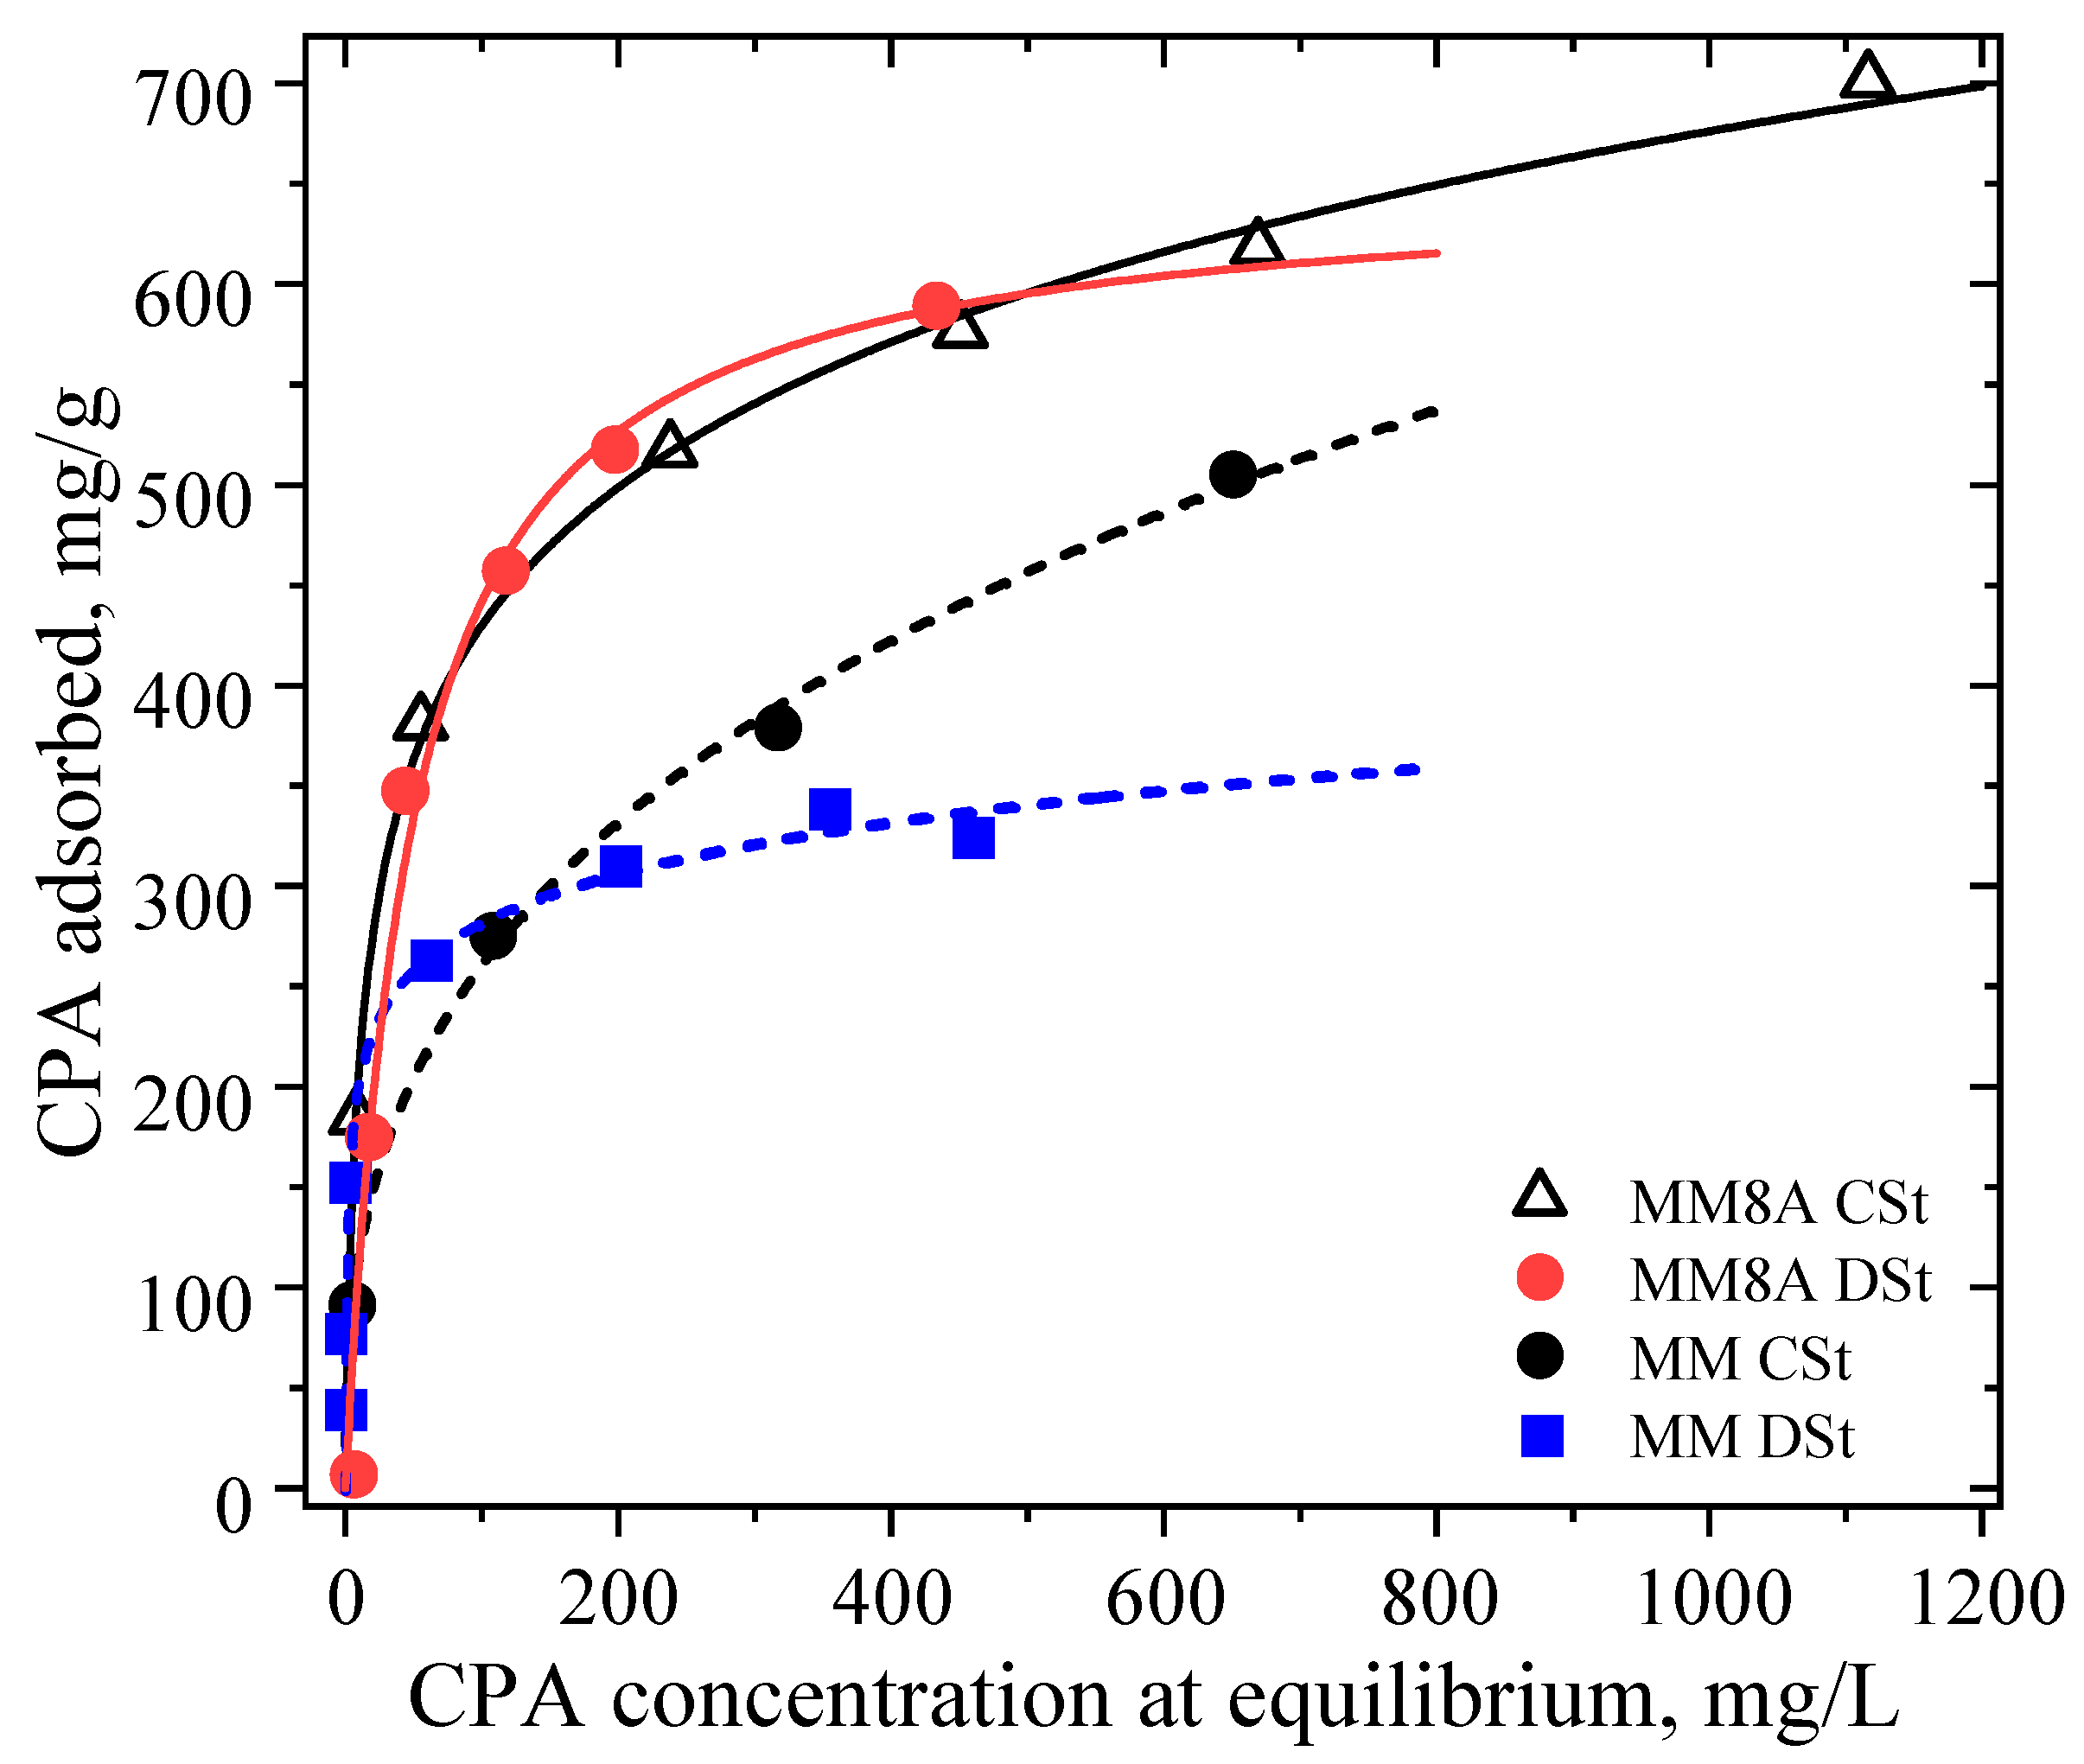
4.6.1. CPA-Adsorption Isotherm on MM8A and MM for Continuous Stirring
4.6.2. Parameters for the Mass Transfer Evaluation
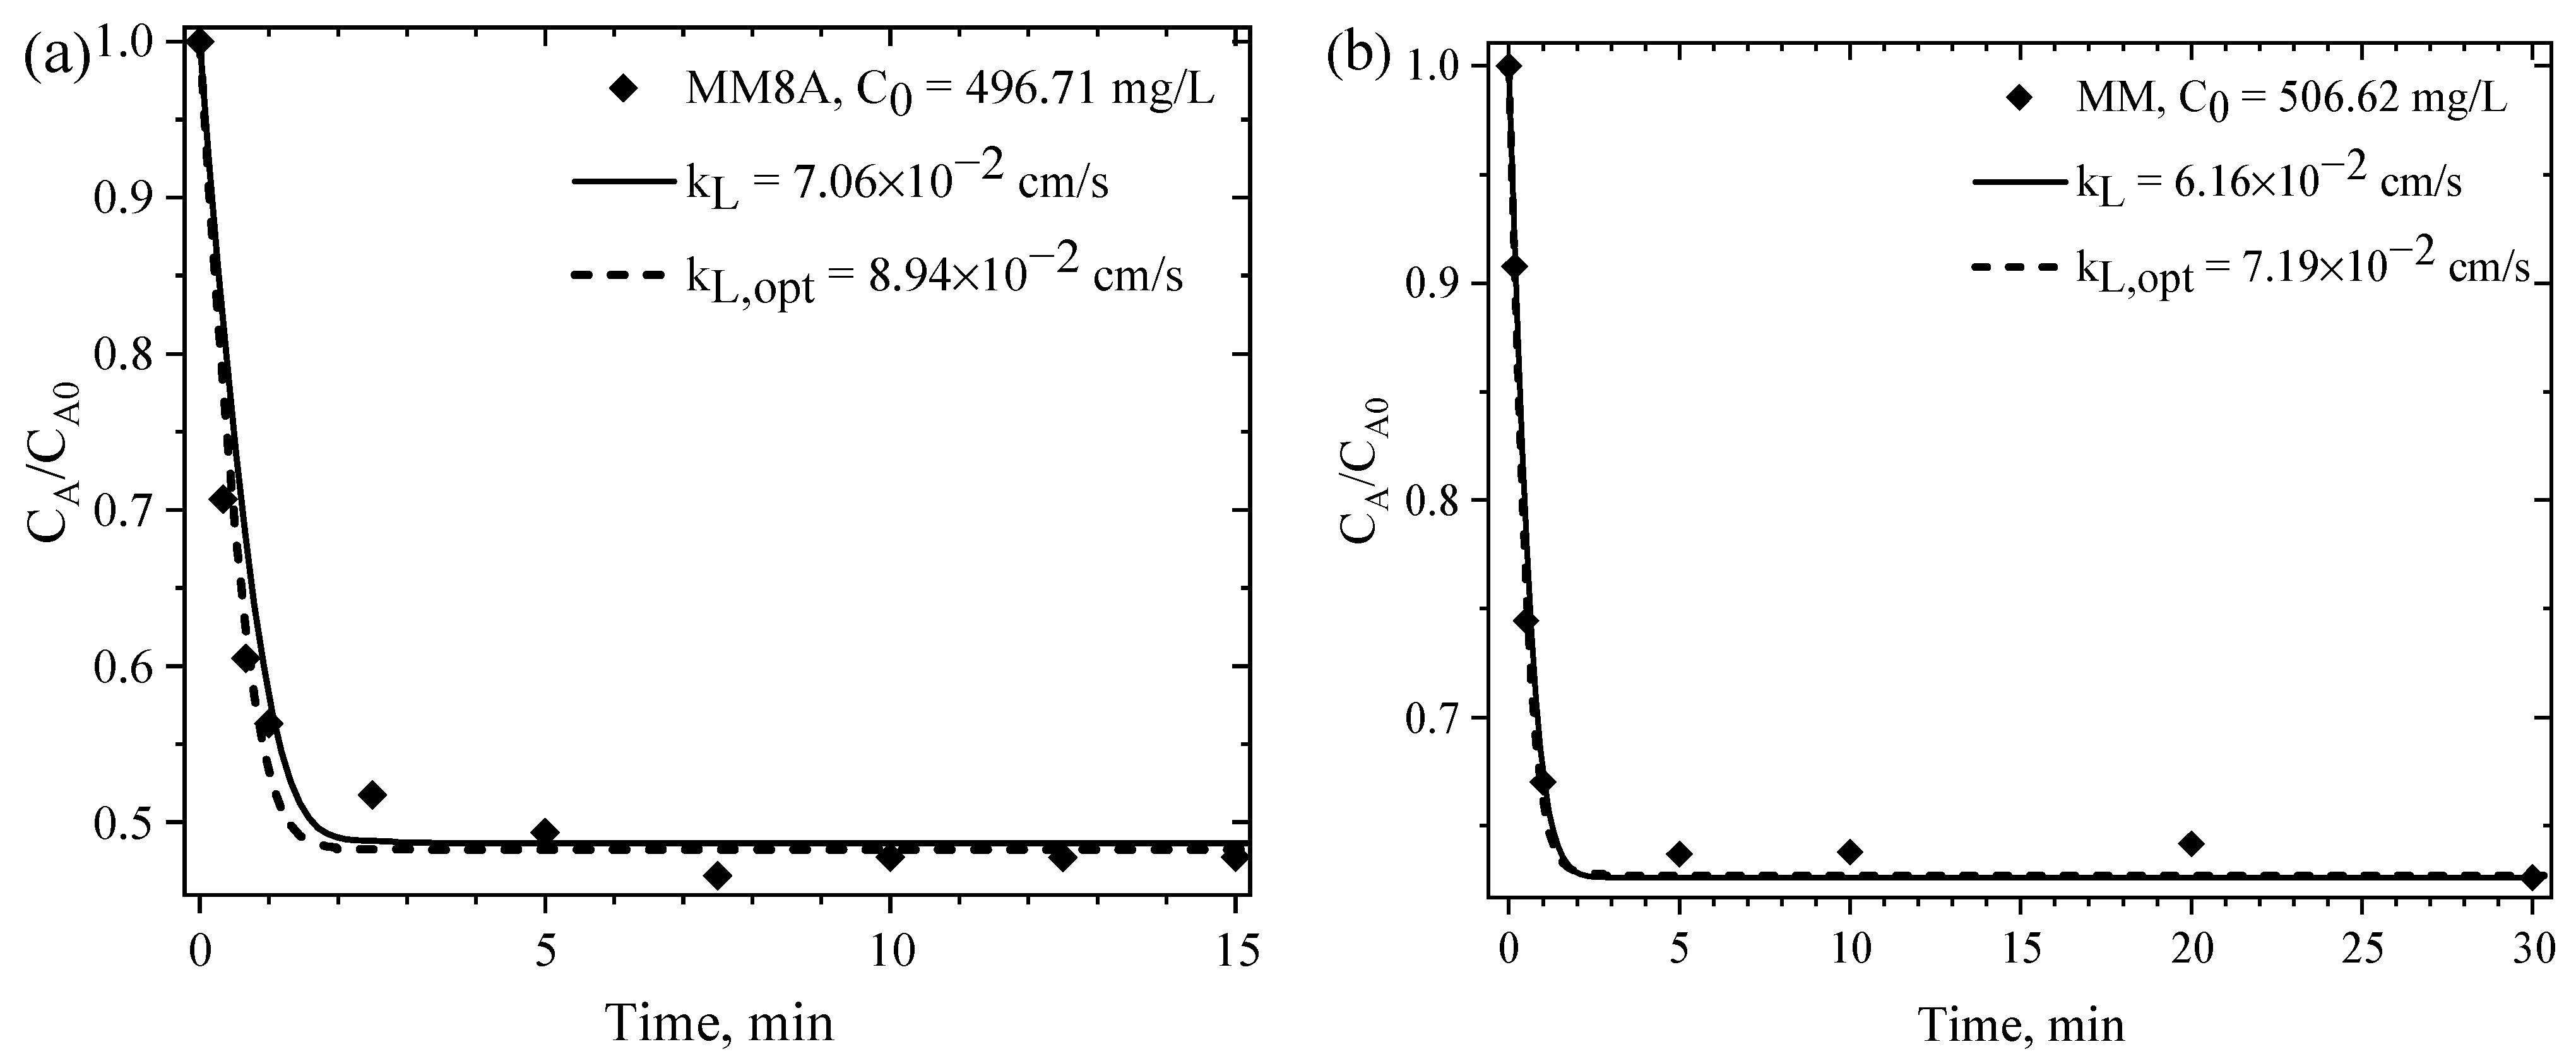
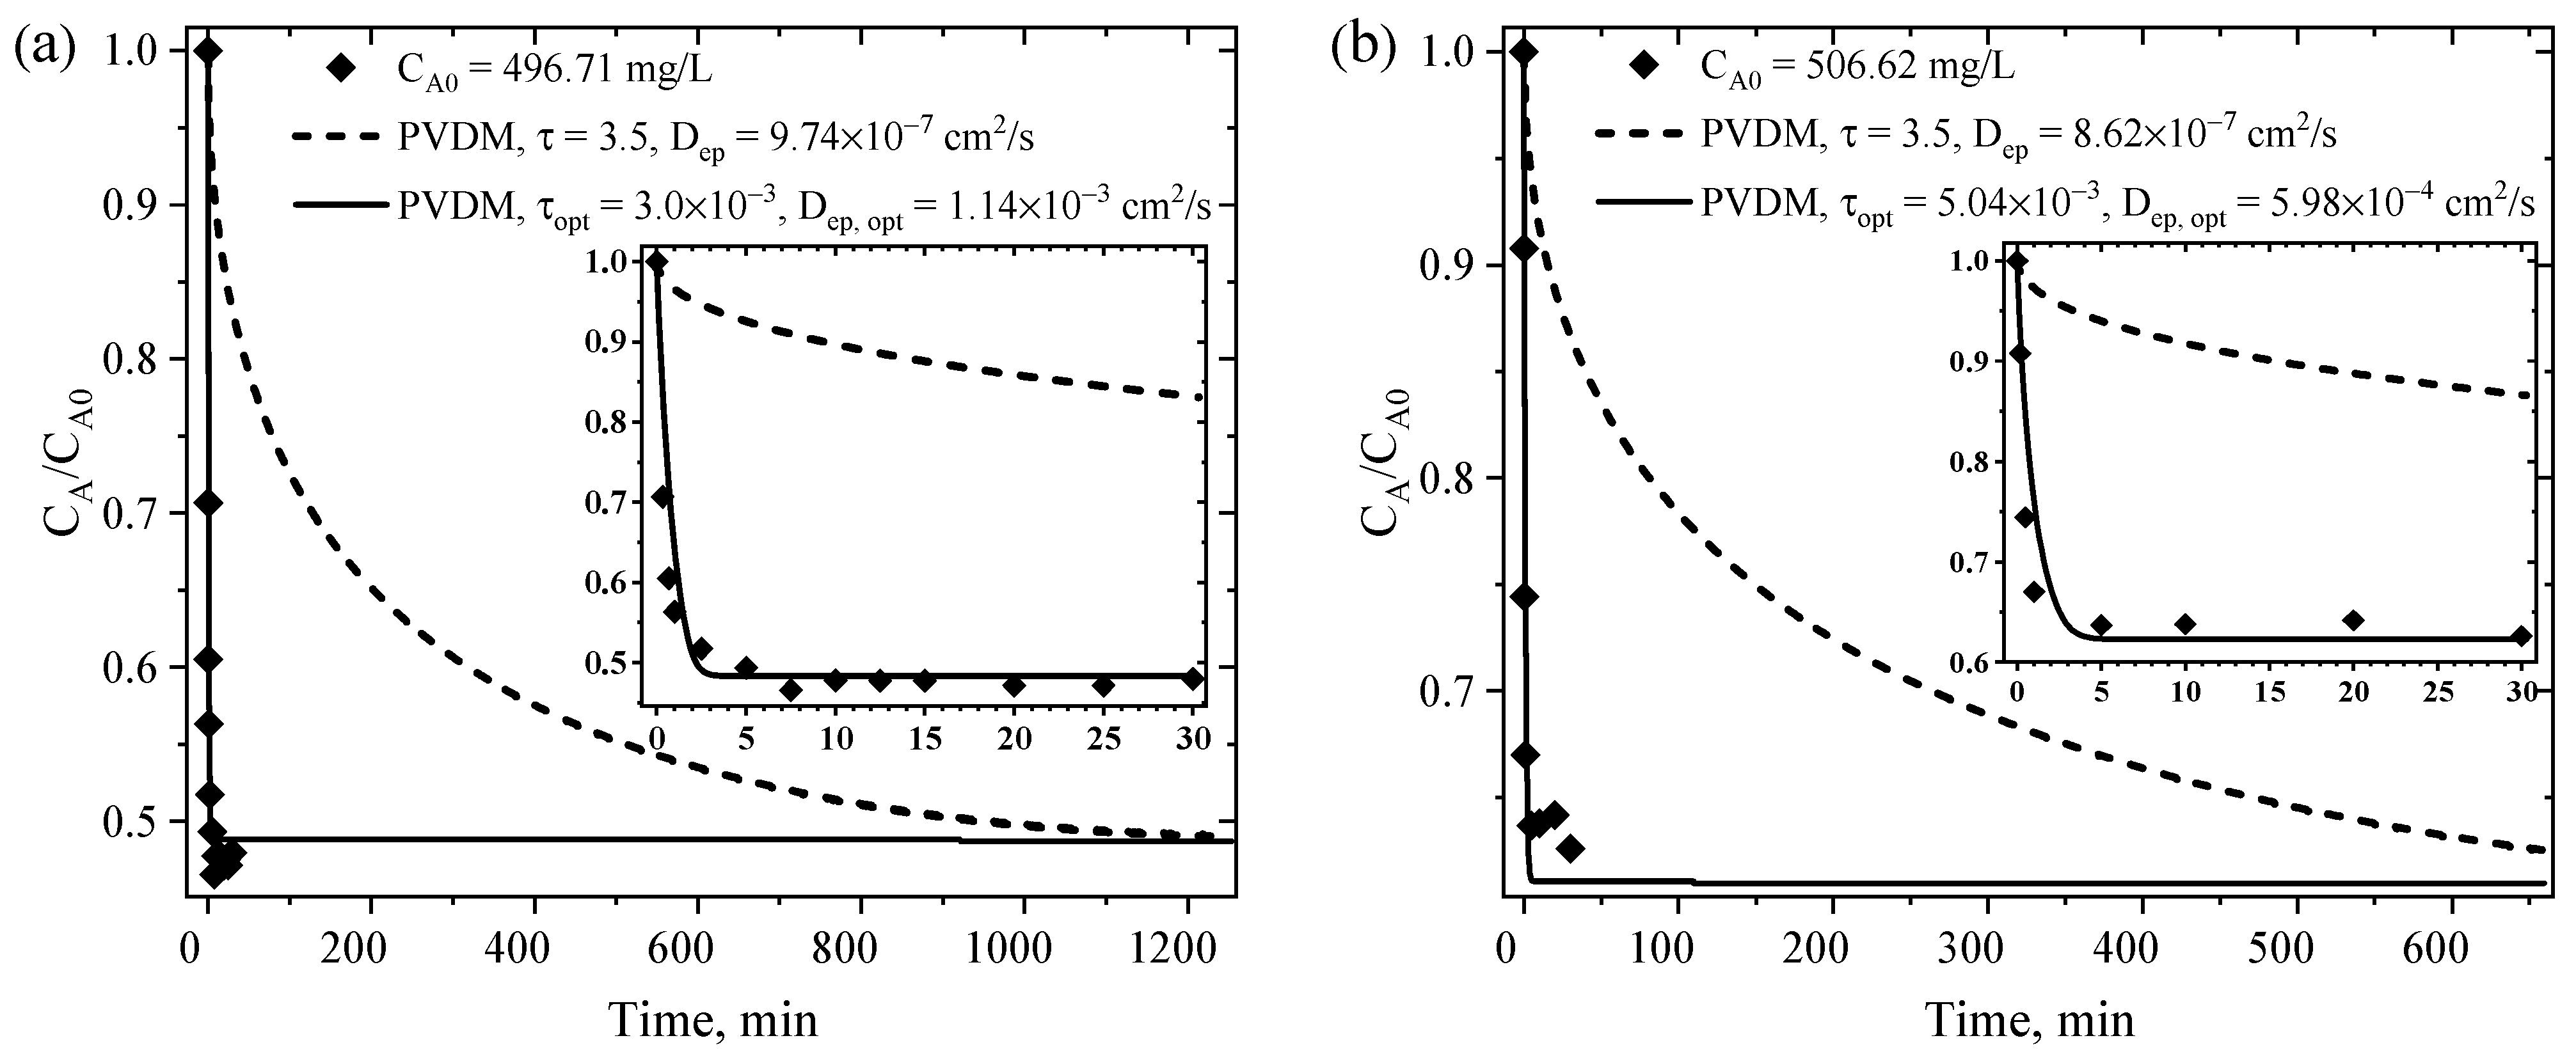
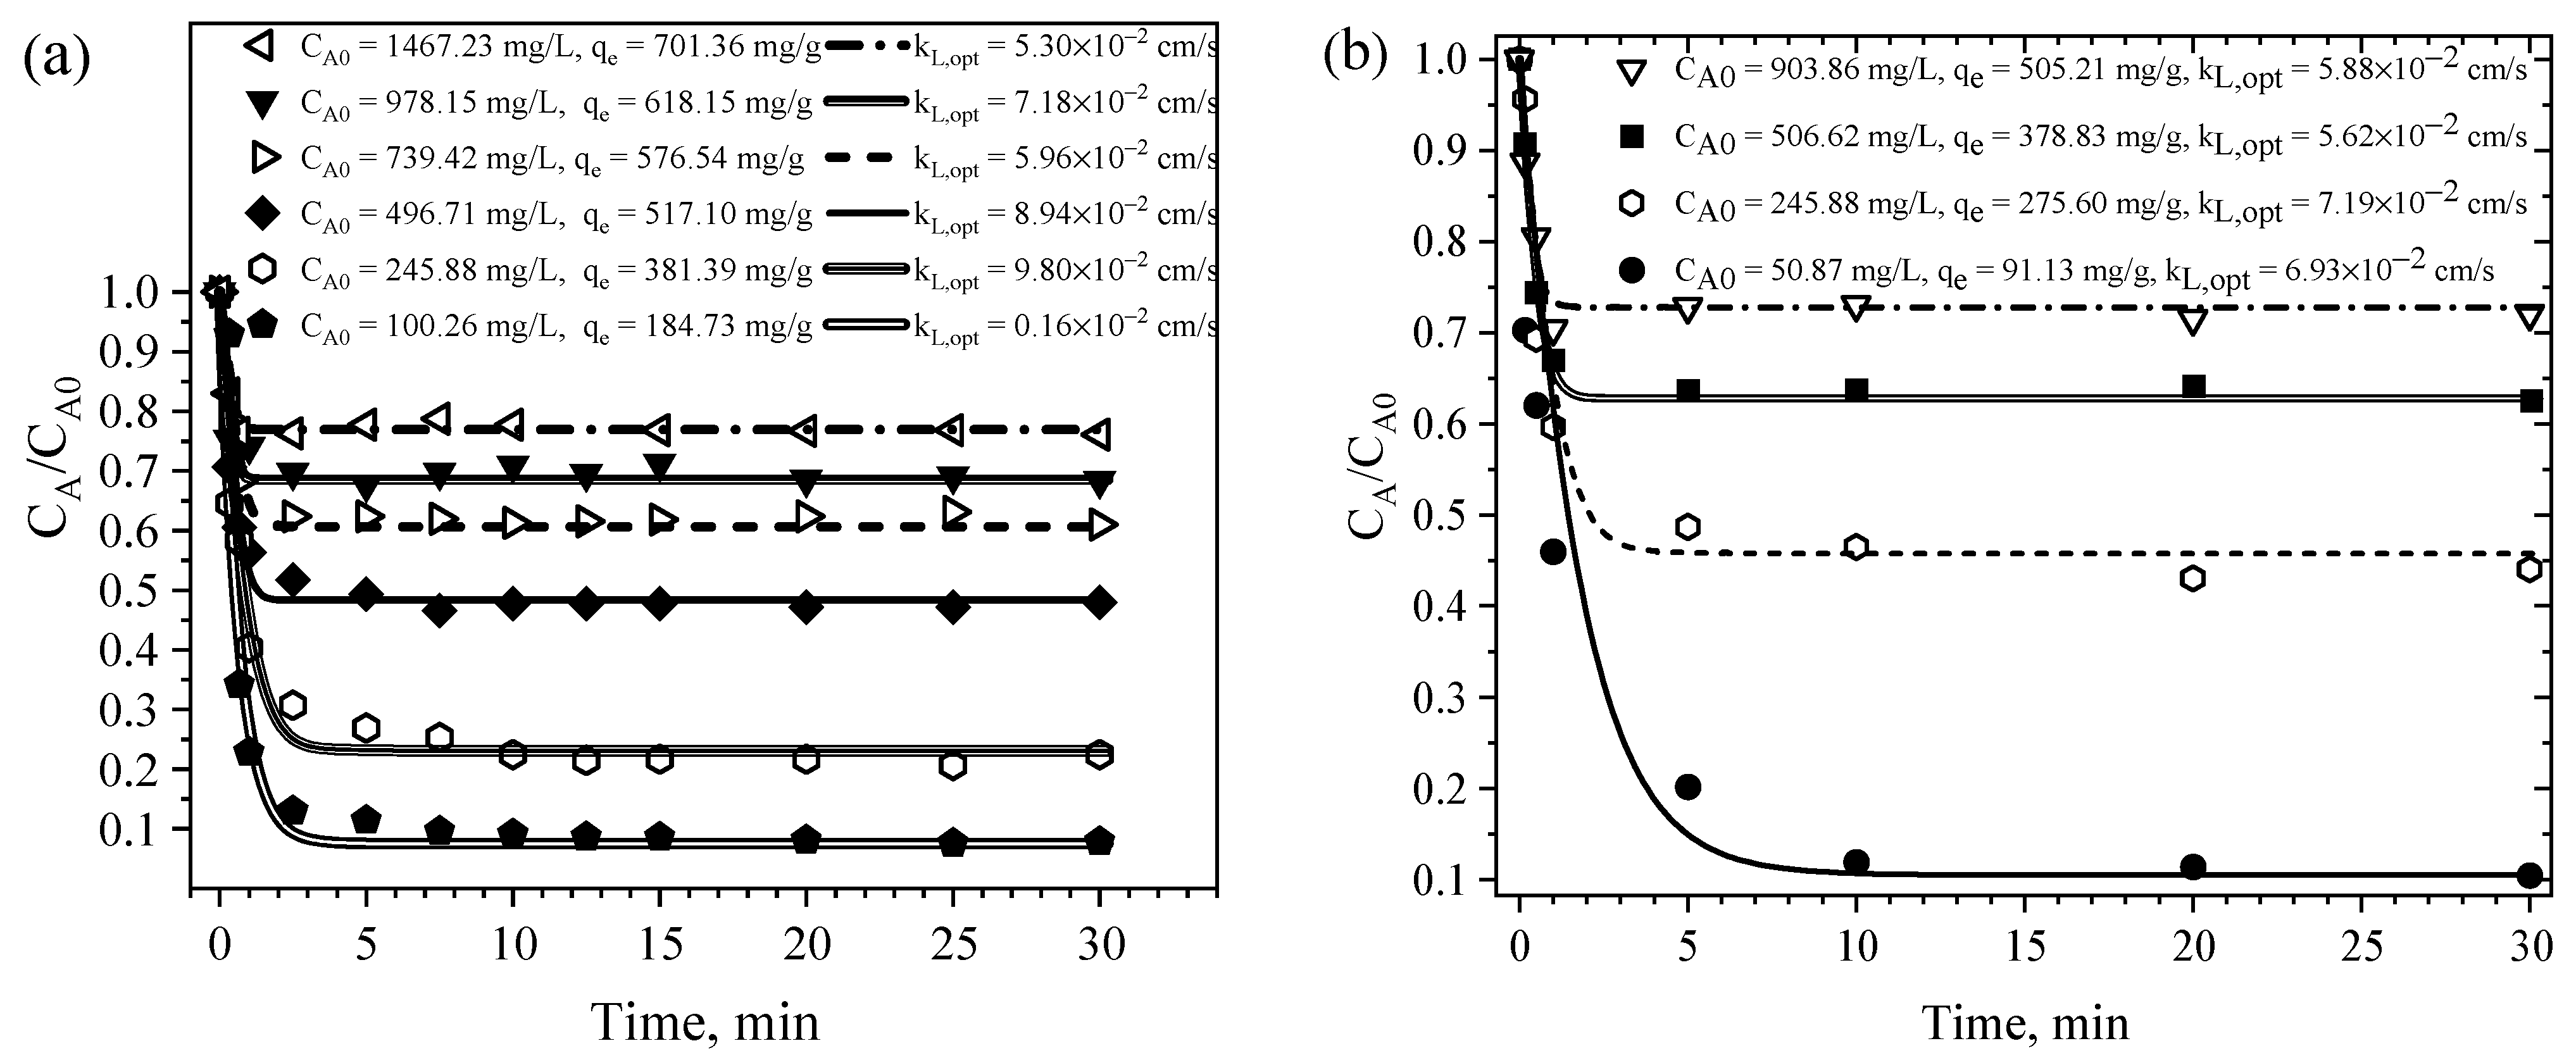
4.6.3. EMTM- and PVDM-Based Interpretation of the Rate of CPA Adsorption on MM8A and MM
5. Conclusions
Supplementary Materials
Author Contributions
Funding
Data Availability Statement
Acknowledgments
Conflicts of Interest
References
- Tarafdar, A.; Sirohi, R.; Balakumaran, P.A.; Reshmy, R.; Madhavan, A.; Sindhu, R.; Binod, P.; Kumar, Y.; Kumar, D.; Sim, S.J. The Hazardous Threat of Bisphenol A: Toxicity, Detection and Remediation. J. Hazard. Mater. 2022, 423, 127097. [Google Scholar] [CrossRef] [PubMed]
- Ehiguese, F.O.; Alam, M.R.; Pintado-Herrera, M.G.; Araújo, C.V.M.; Martin-Diaz, M.L. Potential of Environmental Concentrations of the Musks Galaxolide and Tonalide to Induce Oxidative Stress and Genotoxicity in the Marine Environment. Mar. Environ. Res. 2020, 160, 105019. [Google Scholar] [CrossRef]
- Gomes, M.P.; Rocha, D.C.; Moreira de Brito, J.C.; Tavares, D.S.; Marques, R.Z.; Soffiatti, P.; Sant’Anna-Santos, B.F. Emerging Contaminants in Water Used for Maize Irrigation: Economic and Food Safety Losses Associated with Ciprofloxacin and Glyphosate. Ecotoxicol. Environ. Saf. 2020, 196, 110549. [Google Scholar] [CrossRef] [PubMed]
- Jackson, C.M.; Esnouf, M.P.; Winzor, D.J.; Duewer, D.L. Defining and Measuring Biological Activity: Applying the Principles of Metrology. Accredit. Qual. Assur. 2007, 12, 283–294. [Google Scholar] [CrossRef]
- Chander, V.; Sharma, B.; Negi, V.; Aswal, R.S.; Singh, P.; Singh, R.; Dobhal, R. Pharmaceutical Compounds in Drinking Water. J. Xenobiotics 2016, 6, 5774. [Google Scholar] [CrossRef]
- Rizvi, S.A.A.; Ferrer, G.; Khawaja, U.A.; Sanchez-Gonzalez, M.A. Chlorpheniramine, an Old Drug with New Potential Clinical Applications: A Comprehensive Review of the Literature. Curr. Rev. Clin. Exp. Pharmacol. 2024, 19, 137–145. [Google Scholar] [CrossRef]
- Kristofco, L.A.; Brooks, B.W. Global Scanning of Antihistamines in the Environment: Analysis of Occurrence and Hazards in Aquatic Systems. Sci. Total Environ. 2017, 592, 477–487. [Google Scholar] [CrossRef]
- Monte, A.A.; Chuang, R.; Bodmer, M. Dextromethorphan, Chlorphenamine and Serotonin Toxicity: Case Report and Systematic Literature Review. Br. J. Clin. Pharmacol. 2010, 70, 794–798. [Google Scholar] [CrossRef]
- Lv, J.; Wang, L.; Song, Y.; Li, Y. N-Nitrosodimethylamine Formation from Ozonation of Chlorpheniramine: Influencing Factors and Transformation Mechanism. J. Hazard. Mater. 2015, 299, 584–594. [Google Scholar] [CrossRef]
- Wang, L.; Yang, J.; Li, Y.; Lv, J.; Zou, J. Removal of Chlorpheniramine in a Nanoscale Zero-Valent Iron Induced Heterogeneous Fenton System: Influencing Factors and Degradation Intermediates. Chem. Eng. J. 2016, 284, 1058–1067. [Google Scholar] [CrossRef]
- Bonilla-Petriciolet, A.; Mendoza-Castillo, D.I.; Reynel-Ávila, H.E. Adsorption Processes for Water Treatment and Purification. In Adsorption Processes for Water Treatment and Purification; Springer: Berlin/Heidelberg, Germany, 2017; pp. 1–256. [Google Scholar] [CrossRef]
- Bernal, V.; Giraldo, L.; Moreno-Piraján, J.C. Physicochemical Properties of Activated Carbon: Their Effect on the Adsorption of Pharmaceutical Compounds and Adsorbate—Adsorbent Interactions. C 2018, 4, 62. [Google Scholar] [CrossRef]
- Carrales-Alvarado, D.H.; Ocampo-Pérez, R.; Leyva-Ramos, R.; Rivera-Utrilla, J. Removal of the Antibiotic Metronidazole by Adsorption on Various Carbon Materials from Aqueous Phase. J. Colloid Interface Sci. 2014, 436, 276–285. [Google Scholar] [CrossRef] [PubMed]
- Martín-Lara, M.A.; Calero, M.; Ronda, A.; Iáñez-Rodríguez, I.; Escudero, C. Adsorptive Behavior of an Activated Carbon for Bisphenol A Removal in Single and Binary (Bisphenol A—Heavy Metal) Solutions. Water 2020, 12, 2150. [Google Scholar] [CrossRef]
- El-Shafey, E.S.I.; Al-Lawati, H.A.J.; Al-Saidi, W.S.H. Adsorption of Lisinopril and Chlorpheniramine from Aqueous Solution on Dehydrated and Activated Carbons. Carbon Lett. 2016, 19, 12–22. [Google Scholar] [CrossRef]
- Sharma, A.; Thakur, K.K.; Mehta, P.; Pathania, D. Efficient Adsorption of Chlorpheniramine and Hexavalent Chromium (Cr (VI)) from Water System Using Agronomic Waste Material. Sustain. Chem. Pharm. 2018, 9, 1–11. [Google Scholar] [CrossRef]
- Cavazos-Cuello, L.A.; Dávila-Guzmán, N.E.; Botello-González, J.; Ocampo-Pérez, R.; Leura-Vicencio, A.K.; Salazar Rábago, J.J. Mechanistic Evaluation in the Removal of Chlorpheniramine and Ciprofloxacin on Activated Carbons. Environ. Res. 2023, 238, 117196. [Google Scholar] [CrossRef]
- Ali, S.N.F.; El-Shafey, E.I.; Al-Busafi, S.; Al-Lawati, H.A.J. Adsorption of Chlorpheniramine and Ibuprofen on Surface Functionalized Activated Carbons from Deionized Water and Spiked Hospital Wastewater. J. Environ. Chem. Eng. 2019, 7, 102860. [Google Scholar] [CrossRef]
- Moral-Rodríguez, A.I.; Leyva-Ramos, R.; Ania, C.O.; Ocampo-Pérez, R.; Isaacs-Páez, E.D.; Carrales-Alvarado, D.H.; Parra, J.B. Tailoring the Textural Properties of an Activated Carbon for Enhancing Its Adsorption Capacity towards Diclofenac from Aqueous Solution. Environ. Sci. Pollut. Res. 2019, 26, 6141–6152. [Google Scholar] [CrossRef]
- Largitte, L.; Pasquier, R. A Review of the Kinetics Adsorption Models and Their Application to the Adsorption of Lead by an Activated Carbon. Chem. Eng. Res. Des. 2016, 109, 495–504. [Google Scholar] [CrossRef]
- González-Fernández, L.A.; Medellín-Castillo, N.A.; Ocampo-Pérez, R.; Hernández-Mendoza, H.; Berber-Mendoza, M.S.; Aldama-Aguilera, C. Equilibrium and Kinetic Modelling of Triclosan Adsorption on Single-Walled Carbon Nanotubes. J. Environ. Chem. Eng. 2021, 9, 106382. [Google Scholar] [CrossRef]
- Leyva-Ramos, R.; Geankoplis, C.J. Diffusion in Liquid-Filled Pores of Activated Carbon. I. Pore Volume Diffusion. Can. J. Chem. Eng. 1994, 72, 262–271. [Google Scholar] [CrossRef]
- Leyva-Ramos, R.; Ocampo-Perez, R.; Mendoza-Barron, J. External Mass Transfer and Hindered Diffusion of Organic Compounds in the Adsorption on Activated Carbon Cloth. Chem. Eng. J. 2012, 183, 141–151. [Google Scholar] [CrossRef]
- Lowell, S.; Shields, J.E.; Thomas, M.A.; Thommes, M. Characterization of Porous Solids and Powders: Surface Area, Pore Size and Density; Springer Science & Business Media: Berlin/Heidelberg, Germany, 2004; Volume 16. [Google Scholar] [CrossRef]
- Stoeckli, F.; López-Ramón, M.V.; Hugi-Cleary, D.; Guillot, A. Micropore Sizes in Activated Carbons Determined from the Dubinin–Radushkevich Equation. Carbon 2001, 39, 1115–1116. [Google Scholar] [CrossRef]
- Rouquerol, J.; Rouquerol, F.; Llewellyn, P.; Maurin, G.; Sing, K.S.W. Adsorption by Powders and Porous Solids: Principles, Methodology and Applications, 2nd ed.; Academic Press: Cambridge, MA, USA, 2013; pp. 1–626. [Google Scholar] [CrossRef]
- Barrett, E.P.; Joyner, L.G.; Halenda, P.P. The Determination of Pore Volume and Area Distributions in Porous Substances. I. Computations from Nitrogen Isotherms. J. Am. Chem. Soc. 1951, 73, 373–380. [Google Scholar] [CrossRef]
- Fidel, R.B.; Laird, D.A.; Thompson, M.L. Evaluation of Modified Boehm Titration Methods for Use with Biochars. J. Environ. Qual. 2013, 42, 1771–1778. [Google Scholar] [CrossRef]
- Babić, B.M.; Milonjić, S.K.; Polovina, M.J.; Kaludierović, B.V. Point of Zero Charge and Intrinsic Equilibrium Constants of Activated Carbon Cloth. Carbon 1999, 37, 477–481. [Google Scholar] [CrossRef]
- Baquero, M.C.; Giraldo, L.; Moreno, J.C.; Suárez-García, F.; Martínez-Alonso, A.; Tascón, J.M.D. Activated Carbons by Pyrolysis of Coffee Bean Husks in Presence of Phosphoric Acid. J. Anal. Appl. Pyrolysis 2003, 70, 779–784. [Google Scholar] [CrossRef]
- Ahmad, A.A.; Ahmad, M.A.; Md Ali, U.F.; Ken, K. Gasification Char Residues Management: Assessing the Characteristics for Adsorption Application. Arab. J. Chem. 2023, 16, 104993. [Google Scholar] [CrossRef]
- Yang, K.; Peng, J.; Xia, H.; Zhang, L.; Srinivasakannan, C.; Guo, S. Textural Characteristics of Activated Carbon by Single Step CO2 Activation from Coconut Shells. J. Taiwan Inst. Chem. Eng. 2010, 41, 367–372. [Google Scholar] [CrossRef]
- Yang, T.; Lua, A.C. Characteristics of Activated Carbons Prepared from Pistachio-Nut Shells by Physical Activation. J. Colloid Interface Sci. 2003, 267, 408–417. [Google Scholar] [CrossRef]
- Chun, S.E.; Choi, J.; Whitacre, J.F. Tailoring the Porous Texture of Activated Carbons by CO2 Reactivation to Produce Electrodes for Organic Electrolyte-Based EDLCs. Ionics 2018, 24, 2055–2061. [Google Scholar] [CrossRef]
- Lawtae, P.; Tangsathitkulchai, C. A New Approach for Controlling Mesoporosity in Activated Carbon by the Consecutive Process of Air Oxidation, Thermal Destruction of Surface Functional Groups, and Carbon Activation (The OTA Method). Molecules 2021, 26, 2758. [Google Scholar] [CrossRef] [PubMed]
- Zhu, Y.; Gao, J.; Li, Y.; Sun, F.; Gao, J.; Wu, S.; Qin, Y. Preparation of Activated Carbons for SO2 Adsorption by CO2 and Steam Activation. J. Taiwan Inst. Chem. Eng. 2012, 43, 112–119. [Google Scholar] [CrossRef]
- Shimodaira, N.; Masui, A. Raman Spectroscopic Investigations of Activated Carbon Materials. J. Appl. Phys. 2002, 92, 902–909. [Google Scholar] [CrossRef]
- Wang, X.; Hui, W.; Hu, A.; Li, X.; Li, Y.; Wang, H. A Synthesis of Porous Activated Carbon Materials Derived from Vitamin B9 Base for CO2 Capture and Conversion. Mater. Today Chem. 2021, 20, 100468. [Google Scholar] [CrossRef]
- Salame, I.I.; Bandosz, T.J. Role of Surface Chemistry in Adsorption of Phenol on Activated Carbons. J. Colloid Interface Sci. 2003, 264, 307–312. [Google Scholar] [CrossRef]
- Nguyen, D.T.; Tran, H.N.; Juang, R.S.; Dat, N.D.; Tomul, F.; Ivanets, A.; Woo, S.H.; Hosseini-Bandegharaei, A.; Nguyen, V.P.; Chao, H.P. Adsorption process and mechanism of acetaminophen onto commercial activated carbon. J. Environ. Chem. Eng. 2020, 8, 104408. [Google Scholar] [CrossRef]
- ChemAxon. Chemicalize. Available online: https://chemicalize.com (accessed on 21 September 2024).
- Csizmadia, F.; Tsantili-Kakoulidou, A.; Panderi, I.; Darvas, F. Prediction of Distribution Coefficient from Structure. 1. Estimation Method. J. Pharm. Sci. 1997, 86, 865–871. [Google Scholar] [CrossRef]
- Sekar, M.; Sakthi, V.; Rengaraj, S. Kinetics and equilibrium adsorption study of lead (II) onto activated carbon prepared from coconut shell. J. Colloid Interface Sci. 2004, 279, 307–313. [Google Scholar] [CrossRef]
- Wilke, C.R.; Chang, P. Correlation of Diffusion Coefficients in Dilute Solutions. AIChE J. 1955, 1, 264–270. [Google Scholar] [CrossRef]


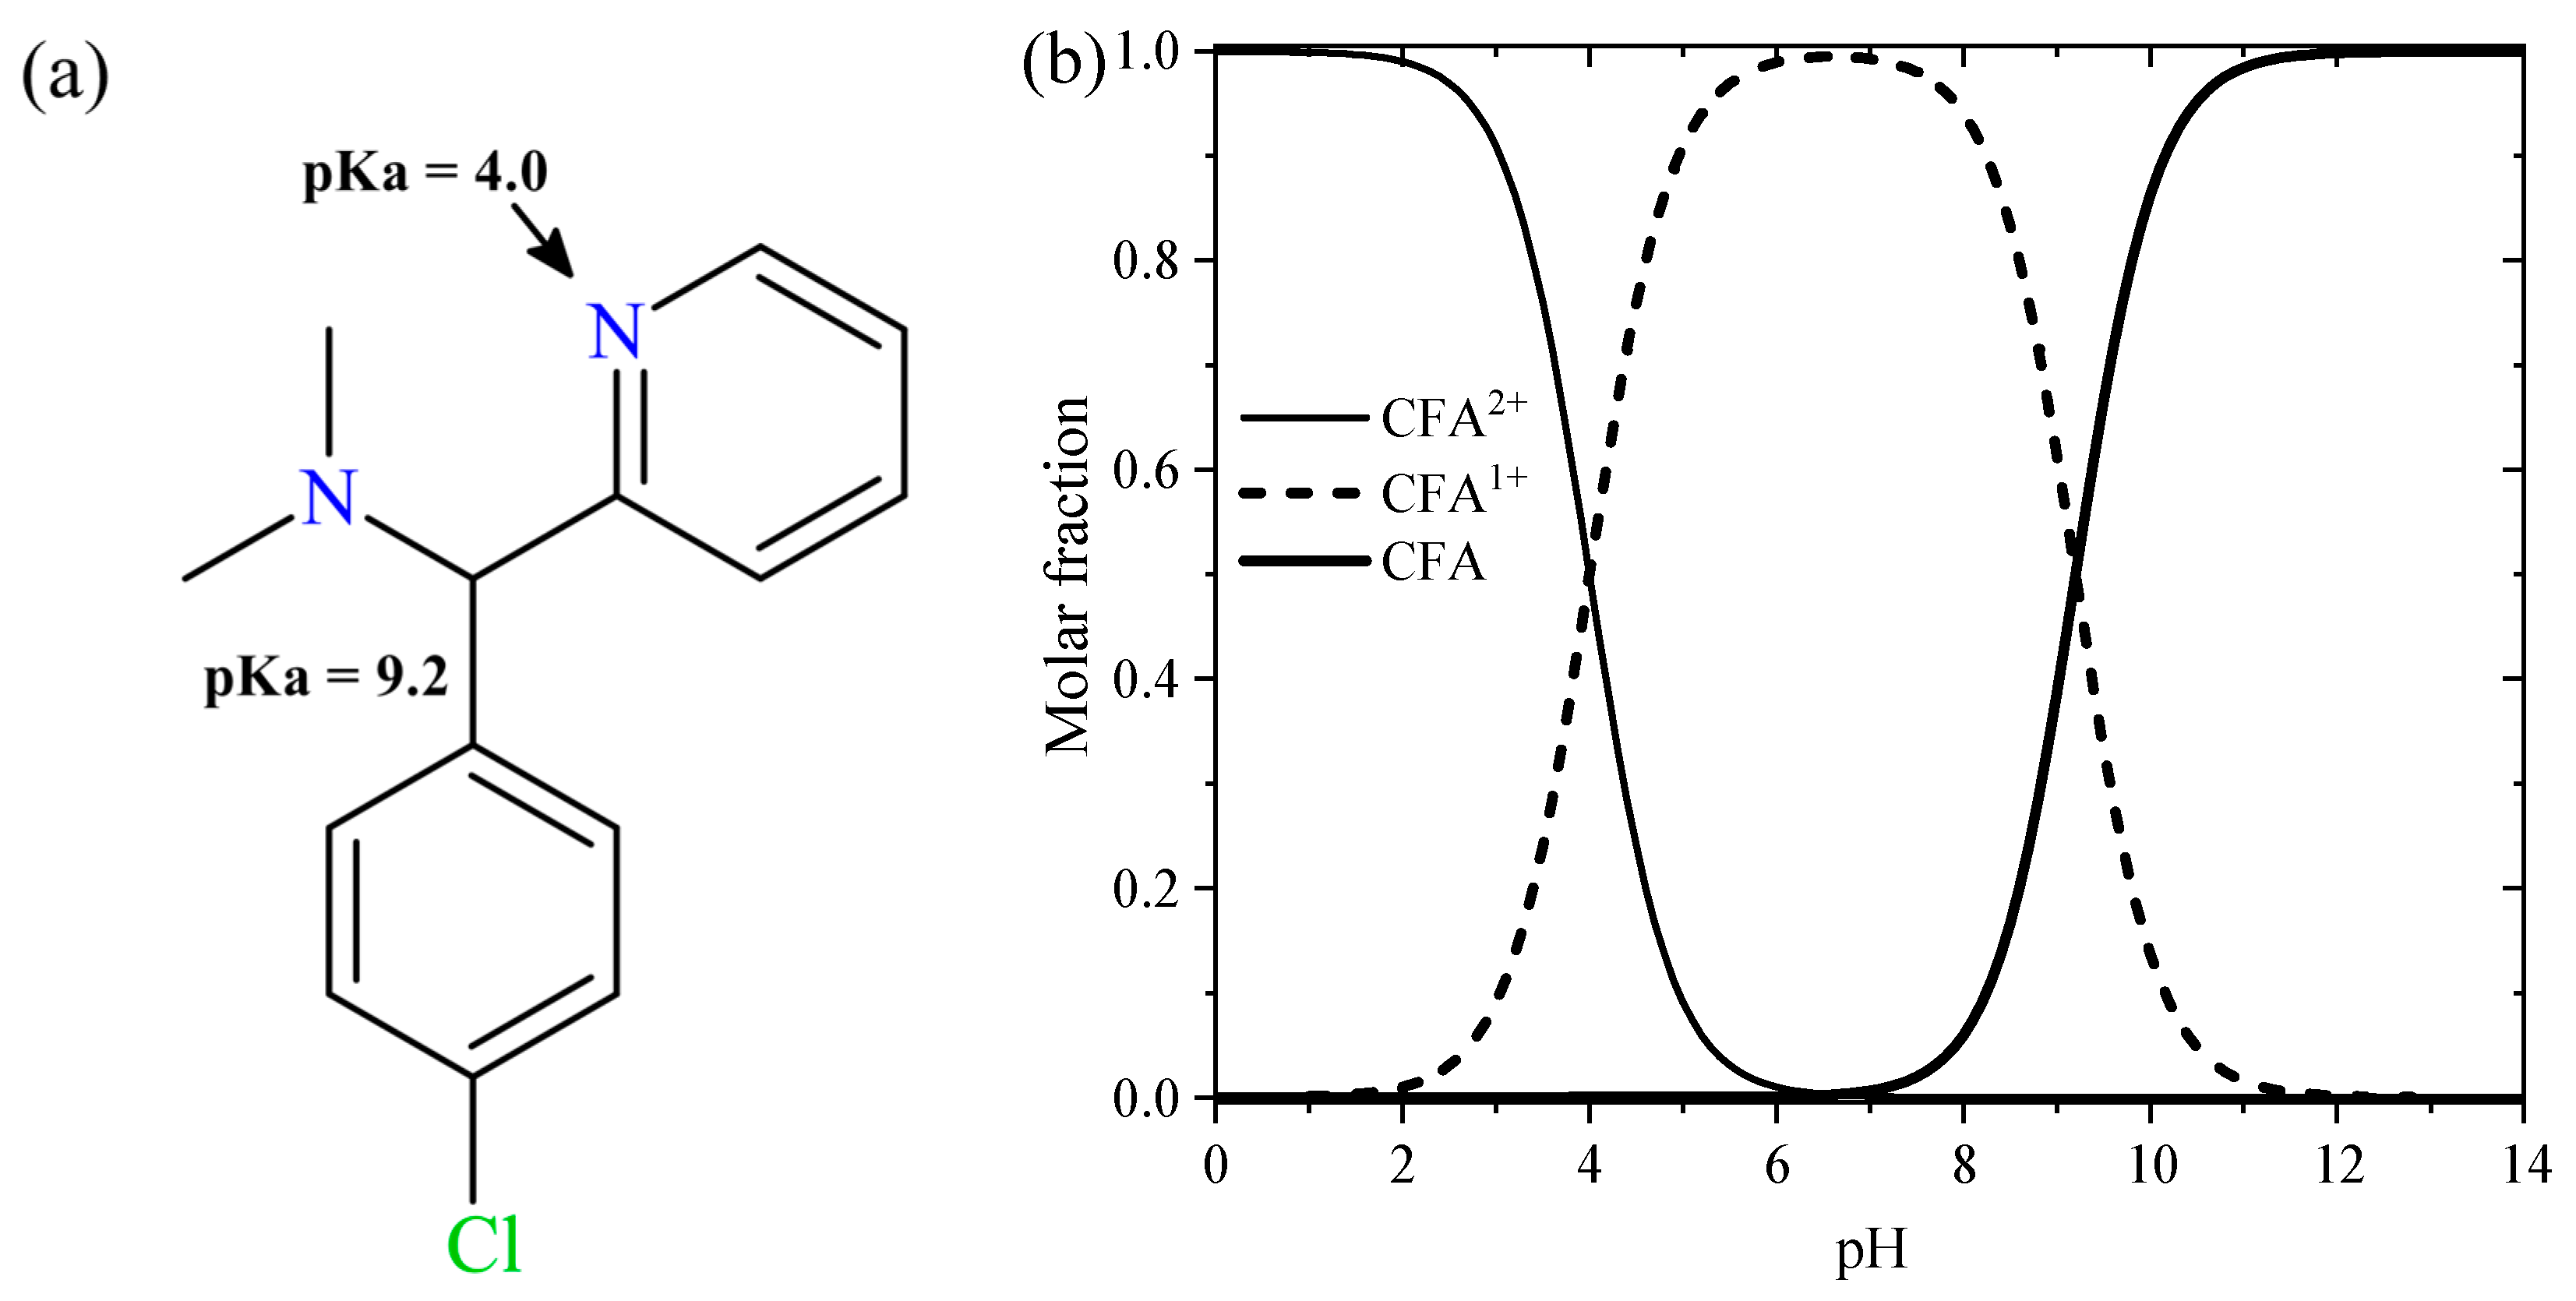
| Molecular Structure | Dimensions (nm) | pKa | Solubility (g/L) | DAB × 106 (cm2/s) |
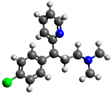 | x = 1.25 y = 0.54 z = 1.44 | pKa1 = 4.0 pKa2 = 9.2 | 5.5 | 4.54 |
| AC | (m2 g−1) | a (m2 g−1) | Smeso (m2 g−1) | b (cm3 g−1) | c (cm3 g−1) | Vmeso d (cm3 g−1) | e (nm) | f (nm) | (g/cm3) | |
|---|---|---|---|---|---|---|---|---|---|---|
| MM | 1107 | 984 | 123 | 1.15 | 0.43 | 0.71 | 4.15 | 0.87 | 0.57 | 0.66 |
| MM4 | 1048 | 898 | 150 | 1 | 0.43 | 0.59 | 3.82 | 0.96 | - | - |
| MM8 | 474 | 152 | 320 | 0.78 | 0.25 | 0.49 | 6.58 | 3.24 | - | - |
| MM8A | 1393 | 1343 | 50 | 1.32 | 0.58 | 0.75 | 3.79 | 0.86 | 0.57 | 0.75 |
| AC | Total Acidic Sites (meq/g) | Total Basic Sites (meq/g) | Carboxylic Sites (meq/g) | Lactonic Sites (meq/g) | Phenolic Sites (meq/g) | pHPZC | pHPIE |
|---|---|---|---|---|---|---|---|
| MM | 0.626 | 0.002 | 0.456 | 0.086 | 0.083 | 2.9 | - |
| MM4 | 0.396 | 0.142 | 0.141 | 0.075 | 0.179 | 3.6 | - |
| MM8 | 0.349 | ND | 0.136 | 0.072 | 0.141 | 4.4 | - |
| MM8A | 0.351 | ND | 0.169 | 0.065 | 0.117 | 3.2 | 3.1 |
| AC | pH | T (°C) | Freundlich | Langmuir | Radke–Prausnitz | |||||||
|---|---|---|---|---|---|---|---|---|---|---|---|---|
| kF (mg1−1/nL1/n/g) | qm (mg/g) | KL (L/mg) | a (L/g) | b (L1−β/mg1−β) | β | |||||||
| MM | 7 | 25 | 102.6 | 4.96 | 15.7 | 315.0 | 0.34 | 7.82 | 241.4 | 1.42 | 0.11 | 6.5 |
| 11 | 25 | 34.36 | 2.10 | 12.8 | 706.4 | 0.01 | 3.75 | 6.85 | 0.97 × 10⁻² | 0.0 | 3.8 | |
| MM4 | 7 | 25 | 90.06 | 3.45 | 22.0 | 515.5 | 0.047 | 4.85 | 24 | 0.047 | 0.0 | 4.9 |
| 11 | 25 | 104.78 | 3.11 | 14.18 | 811.24 | 0.021 | 6.59 | 18.81 | 0.024 | 0.0 | 6.7 | |
| MM8 | 7 | 25 | 97.10 | 3.78 | 12.3 | 485.1 | 0.046 | 4.55 | 22.11 | 0.046 | 0.0 | 4.6 |
| 11 | 25 | 55.10 | 2.46 | 17.66 | 642.44 | 0.020 | 8.36 | 12.75 | 0.020 | 0.0 | 8.4 | |
| MM8A | 5 | 25 | 123.25 | 5.15 | 7.54 | 417.83 | 0.14 | 7.98 | 120.84 | 0.58 | 0.11 | 5.5 |
| 7 | 15 | 90.96 | 3.44 | 16.60 | 607 | 0.027 | 7.98 | 16.00 | 0.026 | 0.0 | 7.9 | |
| 25 | 69.25 | 2.72 | 13.25 | 651.855 | 0.021 | 3.13 | 13.72 | 0.021 | 0.0 | 3.1 | ||
| 35 | 80.06 | 3.13 | 7.79 | 641.87 | 0.021 | 5.63 | 13.99 | 0.021 | 0.0 | 5.6 | ||
| 9 | 25 | 91.97 | 2.77 | 16.0 | 859.36 | 0.021 | 7.05 | 18.20 | 0.021 | 0.0 | 7.1 | |
| 11 | 25 | 111.86 | 2.99 | 14.75 | 881.54 | 0.024 | 5.84 | 21.83 | 0.027 | 0.01 | 6.0 | |
| Continuous Stirring | ||||||||||||
| MM8A | 7 | 25 | 138.89 | 4.30 | 5.58 | 650 | 0.029 | 13.67 | 64.75 | 0.31 | 0.17 | 1.5 |
| MM | 7 | 25 | 51.82 | 2.85 | 2.11 | 568.58 | 8.42 × 10⁻³ | 72.49 | 645.13 | 12.17 | 0.34 | 1.8 |
| AC | Experiment No. | m (g) | CA0 (mg/L) | CAe (mg/L) | qe (mg/g) | kL,opt × 102 (cm/s) | %D | Dep,opt × 104 (cm2/s) | %D |
|---|---|---|---|---|---|---|---|---|---|
| RMM8A_1 | 0.1 | 100.3 | 7.90 | 184.73 | 16.20 | 13.41 | 11.4 | 12.0 | |
| RMM8A_2 | 0.1 | 245.9 | 55.19 | 381.39 | 9.80 | 8.54 | 12.9 | 8.6 | |
| MM8A | RMM8A_3 | 0.1 | 496.7 | 238.16 | 517.10 | 8.94 | 2.51 | 11.4 | 2.6 |
| RMM8A_4 | 0.1 | 739.4 | 451.15 | 576.54 | 5.96 | 2.22 | 9.39 | 1.4 | |
| RMM8A_5 | 0.1 | 978.2 | 669.08 | 618.15 | 7.18 | 1.62 | 8.70 | 1.3 | |
| RMM8A_6 | 0.1 | 1467.2 | 1116.55 | 701.36 | 5.30 | 0.81 | 13.4 | 0.8 | |
| RMM_1 | 0.1 | 50.87 | 5.30 | 91.13 | 5.88 | 12.19 | 5.11 | 4.1 | |
| MM | RMM_2 | 0.1 | 245.88 | 108.33 | 275.60 | 5.62 | 4.83 | 3.91 | 3.7 |
| RMM_3 | 0.1 | 506.62 | 317.20 | 378.83 | 7.19 | 1.68 | 5.98 | 3.9 | |
| RMM_4 | 0.1 | 903.86 | 651.25 | 505.21 | 6.93 | 1.07 | 30.1 | 0.9 |
Disclaimer/Publisher’s Note: The statements, opinions and data contained in all publications are solely those of the individual author(s) and contributor(s) and not of MDPI and/or the editor(s). MDPI and/or the editor(s) disclaim responsibility for any injury to people or property resulting from any ideas, methods, instructions or products referred to in the content. |
© 2025 by the authors. Licensee MDPI, Basel, Switzerland. This article is an open access article distributed under the terms and conditions of the Creative Commons Attribution (CC BY) license (https://creativecommons.org/licenses/by/4.0/).
Share and Cite
Martínez-Espinosa, J.A.; Leyva-Ramos, R.; Villela-Martínez, D.E.; Carrales-Alvarado, D.H.; Medina, D.I. CO2 Reactivation of Activated Carbon to Improve Its Adsorption Capacity and Rate Toward Chlorpheniramine. Water 2025, 17, 874. https://doi.org/10.3390/w17060874
Martínez-Espinosa JA, Leyva-Ramos R, Villela-Martínez DE, Carrales-Alvarado DH, Medina DI. CO2 Reactivation of Activated Carbon to Improve Its Adsorption Capacity and Rate Toward Chlorpheniramine. Water. 2025; 17(6):874. https://doi.org/10.3390/w17060874
Chicago/Turabian StyleMartínez-Espinosa, Jesus A., Roberto Leyva-Ramos, Diana E. Villela-Martínez, Damarys H. Carrales-Alvarado, and Dora I. Medina. 2025. "CO2 Reactivation of Activated Carbon to Improve Its Adsorption Capacity and Rate Toward Chlorpheniramine" Water 17, no. 6: 874. https://doi.org/10.3390/w17060874
APA StyleMartínez-Espinosa, J. A., Leyva-Ramos, R., Villela-Martínez, D. E., Carrales-Alvarado, D. H., & Medina, D. I. (2025). CO2 Reactivation of Activated Carbon to Improve Its Adsorption Capacity and Rate Toward Chlorpheniramine. Water, 17(6), 874. https://doi.org/10.3390/w17060874