Article

Willingness to Pay for Renewably Sourced Irrigation with Solar Water Pumping (SWP) Systems in Drought-Prone Areas of Thailand

by
Nilubon Luangchosiri
1,2,*,
Chatchawan Chaichana
3,*,
Parichat Yalangkan
4,
Samuel Matthew G. Dumlao
1,
Hideyuki Okumura
1 and
Keiichi N. Ishihara
5
1
Graduate School of Energy Science, Kyoto University, Yoshida-honmachi, Sakyo-ku, Kyoto 606-8501, Japan
2
Office of Administration Research, Chiang Mai University, Chiang Mai 50200, Thailand
3
Department of Mechanical Engineering, Faculty of Engineering, Chiang Mai University, 239 Huay Kaew Road, Muang Distinct, Chiang Mai 50200, Thailand
4
Energy Technology for Environment Research Center, Faculty of Engineering, Chiang Mai University, 239 Huay Kaew Road, Muang Distinct, Chiang Mai 50200, Thailand
5
Institutional Advancement and Communications (IAC), Kyoto University, Yoshida-honmachi, Sakyo-ku, Kyoto 606-8501, Japan
*
Authors to whom correspondence should be addressed.
Water 2025, 17(6), 858; https://doi.org/10.3390/w17060858
Submission received: 9 February 2025 / Revised: 4 March 2025 / Accepted: 13 March 2025 / Published: 17 March 2025

Abstract

:
In Thailand, droughts severely impact agriculture, particularly in non-irrigated areas, which comprise 76.4% of the country’s farmland. This highlights the need for sustainable energy solutions to mitigate environmental impacts. Despite government efforts, including over 900 Solar Water Pumping (SWP) demonstration units, many farmers remain hesitant to adopt this technology. This study examines the factors influencing farmers’ willingness to invest in SWP in Thailand’s drought-prone north and northeast regions, the most affected areas. Data were collected from 210 families—127 in the north (NC) and 83 in the northeast (NEC)—through surveys, interviews, and observations. Results show that 75.6% of NC and 77.1% of NEC farmers are willing to invest. However, barriers include financial constraints, reliance on government aid, uncertainty about returns, and lack of information. The estimated willingness-to-pay per household is USD 1438 in NC and USD 1518 in NEC, both exceeding the cost of a basic SWP system. Education, land ownership, and debt influence investment decisions, while the cultivation area impacts the amount invested. To increase adoption and combat climate change, tailored financial support, such as loan programs and leasing options, are needed for farmers in non-irrigated regions.

1. Introduction

1.1. Background

Droughts are a common natural disaster that negatively impacts farmers, cultivation systems, plant production, and society [1,2]. They hinder agricultural growth and reduce output. In Thailand, droughts in 2013 affected approximately 3850 km2 of agricultural land and 9 million people, causing damages of USD 90 million. In 2014, damages increased to USD 550 million, affecting 6800 km2 and the same 9 million people [3]. Droughts significantly impact agricultural communities, threatening livelihoods, food security, and the economy.
Thailand’s total agricultural area covers about 23.88 million hectares (46.5% of the country) [4], but only 23.6% is irrigated. Farmers in non-irrigated areas regularly face drought. According to the Land Development Department, Ministry of Agriculture, Thailand’s drought severity is classified into three levels, as shown in Figure 1 [5]. Over 80% of drought-affected areas are in northern and northeastern Thailand, which also have the country’s lowest Gross Provincial Product (GPP) [6,7].
The Thai government promotes small Solar Water Pumping (SWP) systems to address drought in non-irrigated areas. The system consists of on-ground solar panels, an inverter, and a submersible pump, capable of supplying water to about 5–8 hectares (Figure 2). A 4–6 m3 water tank may also store excess water, and the system does not include a chemical battery. The Ministry of Energy (MOEN) is a leading agency promoting this technology. By 2019, around 916 systems were operating nationwide, covering only 7000 hectares, or 0.038% of non-irrigated areas.
A major obstacle to implementing this technology is funding [8,9]. The Thai government provided the system free to farmer groups to demonstrate its benefits, hoping others would later adopt it independently. However, few farmers installed the system themselves. Most are either unable or unwilling to pay, preferring to wait for free government support.

1.2. Willingness to Pay (WTP)

Willingness-to-pay (WTP) is an important metric reflecting consumers’ maximum value for products or services, influencing pricing and perceived value [10,11]. While WTP surveys may introduce biases, they offer a straightforward way to assess consumer valuation [10].
WTP has been studied across sectors, showing consumer payment preferences for products or services. In healthcare, Kaonga et al. [12] surveyed WTP for social health insurance in Zambia. In food and beverage, Ogbeide et al. [13] studied WTP for organic wine in Australia. In forestry, WTP for certified forestland was investigated in the USA [14]. In service, WTP was applied to seat selection pricing in China [15]. Public services research includes WTP for integrated ticketing systems in Sweden [16] and garbage recycling in China [17]. In Germany, studies assessed WTP for local wind energy [18] and regional electricity generation [19], including a survey of 838 households. In the USA, research in Georgia [20] examined WTP for electric vehicles, rooftop solar, and heat pumps, while a study in England explored WTP for uninterrupted electricity service [21].
In agriculture, few studies have explored WTP for SWP technology and irrigation services, mainly in low-income countries like Pakistan, Nigeria, and Rwanda. In Pakistan, over two-thirds of farmers were unwilling to pay for renewable electricity from SWP [22], favoring cheaper diesel pumps despite environmental and health risks [23]. Wealthier, younger, and more educated farmers were more likely to adopt green energy [22,23]. In Nigeria, rice farmers were reluctant to pay for climate-smart technologies but preferred water-saving options like drip irrigation. Key factors influencing WTP included occupation, credit access, and proximity to markets [24]. In Rwanda, Meunier et al. [25] found that the average marginal WTP (mWTP) for improved domestic water was influenced by household size, business ownership, and satisfaction with water quantity and quality. At the same time, mWTP for irrigation was shaped by education level, business ownership, and farm size.
When assessing WTP, offering apparent alternatives for participants is crucial. The logit model, specifically the Mixed Logit (ML) model, analyzes stated preference data in WTP studies. In several studies, the logit model is employed to estimate random parameters [26] and discrete choices [27]. A study in the Canary Islands applied this model to evaluate preferences for electricity suppliers, focusing on service reliability, renewable energy share, and access to energy audits [28]. These studies highlight the usefulness of logit models in identifying factors influencing WTP in target groups.
The literature shows that WTP is applicable across various sectors to gauge target groups’ willingness to pay for new, often more expensive, premium-quality products or services. Factors influencing willingness vary, and these findings can help policymakers develop new measures to support or activate relevant policies.

1.3. Problem Identification and Research Objective

Farmers know the SWP system can provide water from underground sources to farming areas. The technology is available in Thailand, with online and offline shops in every province. A Google search reveals over 120,000 Thai-language videos on SWP systems, indicating that SWP technology is mature in Thailand.
The challenge of water access goes beyond improving water supply technologies. Households’ WTP for such technology is crucial for finding a sustainable irrigation solution in drought-prone areas. Understanding why farmers avoid purchasing systems is essential, with economic challenges as a primary factor. In Pakistan, Ali et al. [23] found that younger, educated, and wealthier farmers were more likely to adopt SWP technology. Additionally, access to credit and frequent power outages influenced WTP. Zhou and Abdullah [29] identified factors affecting SWP adoption, including education, age, gender, awareness, cost tolerance, facilitating conditions, ease of use, and perceived usefulness.
Farmers in Thailand often face low income, high debt, and limited education. The aging farmer population, compounded by severe drought conditions, adds complexity [30,31]. Understanding farmers’ motivation and budget constraints is crucial for assessing the long-term success of solar technology adoption and mitigating drought impacts. Policymakers and marketers should recognize the key variables influencing the adoption of green energy technologies to support the successful diffusion of SWP technology in rural drought-prone areas. This study aims to identify the factors affecting Thai farmers’ decisions to invest in SWP systems and assess their WTP for the SWP system.

2. Materials and Methods
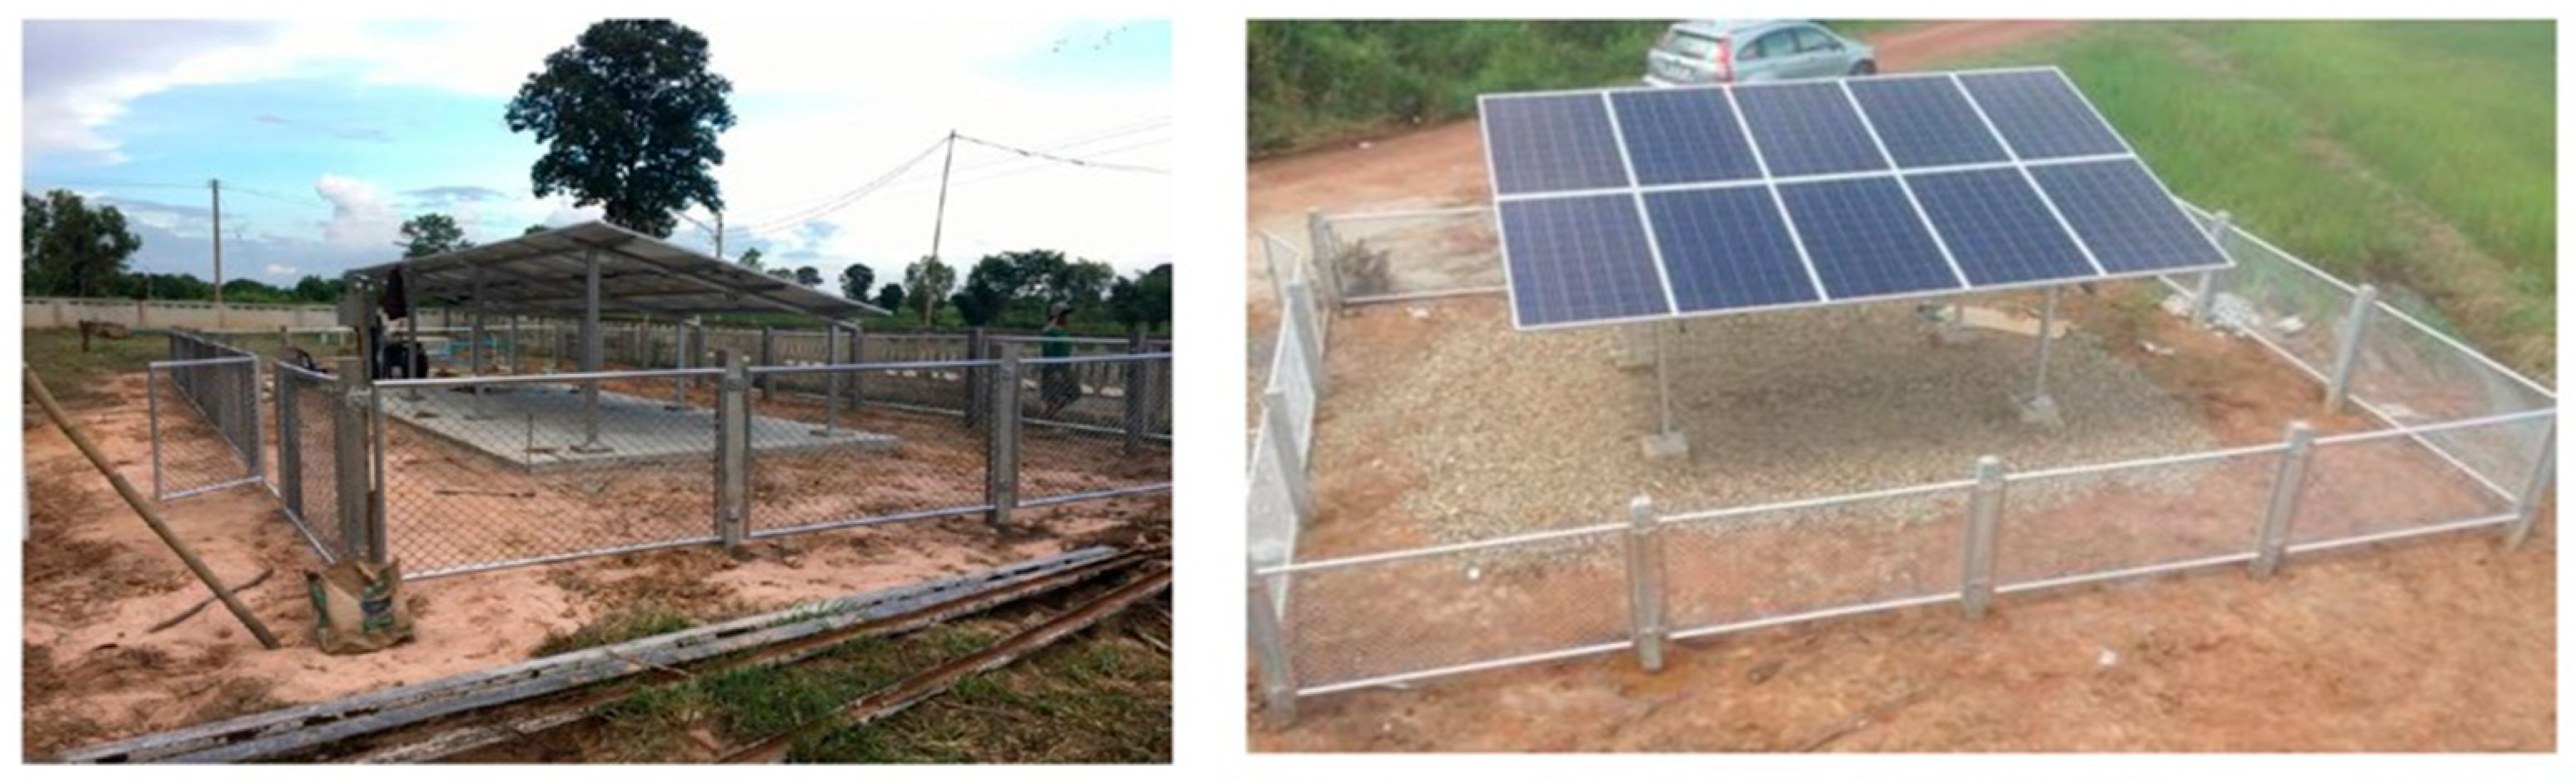
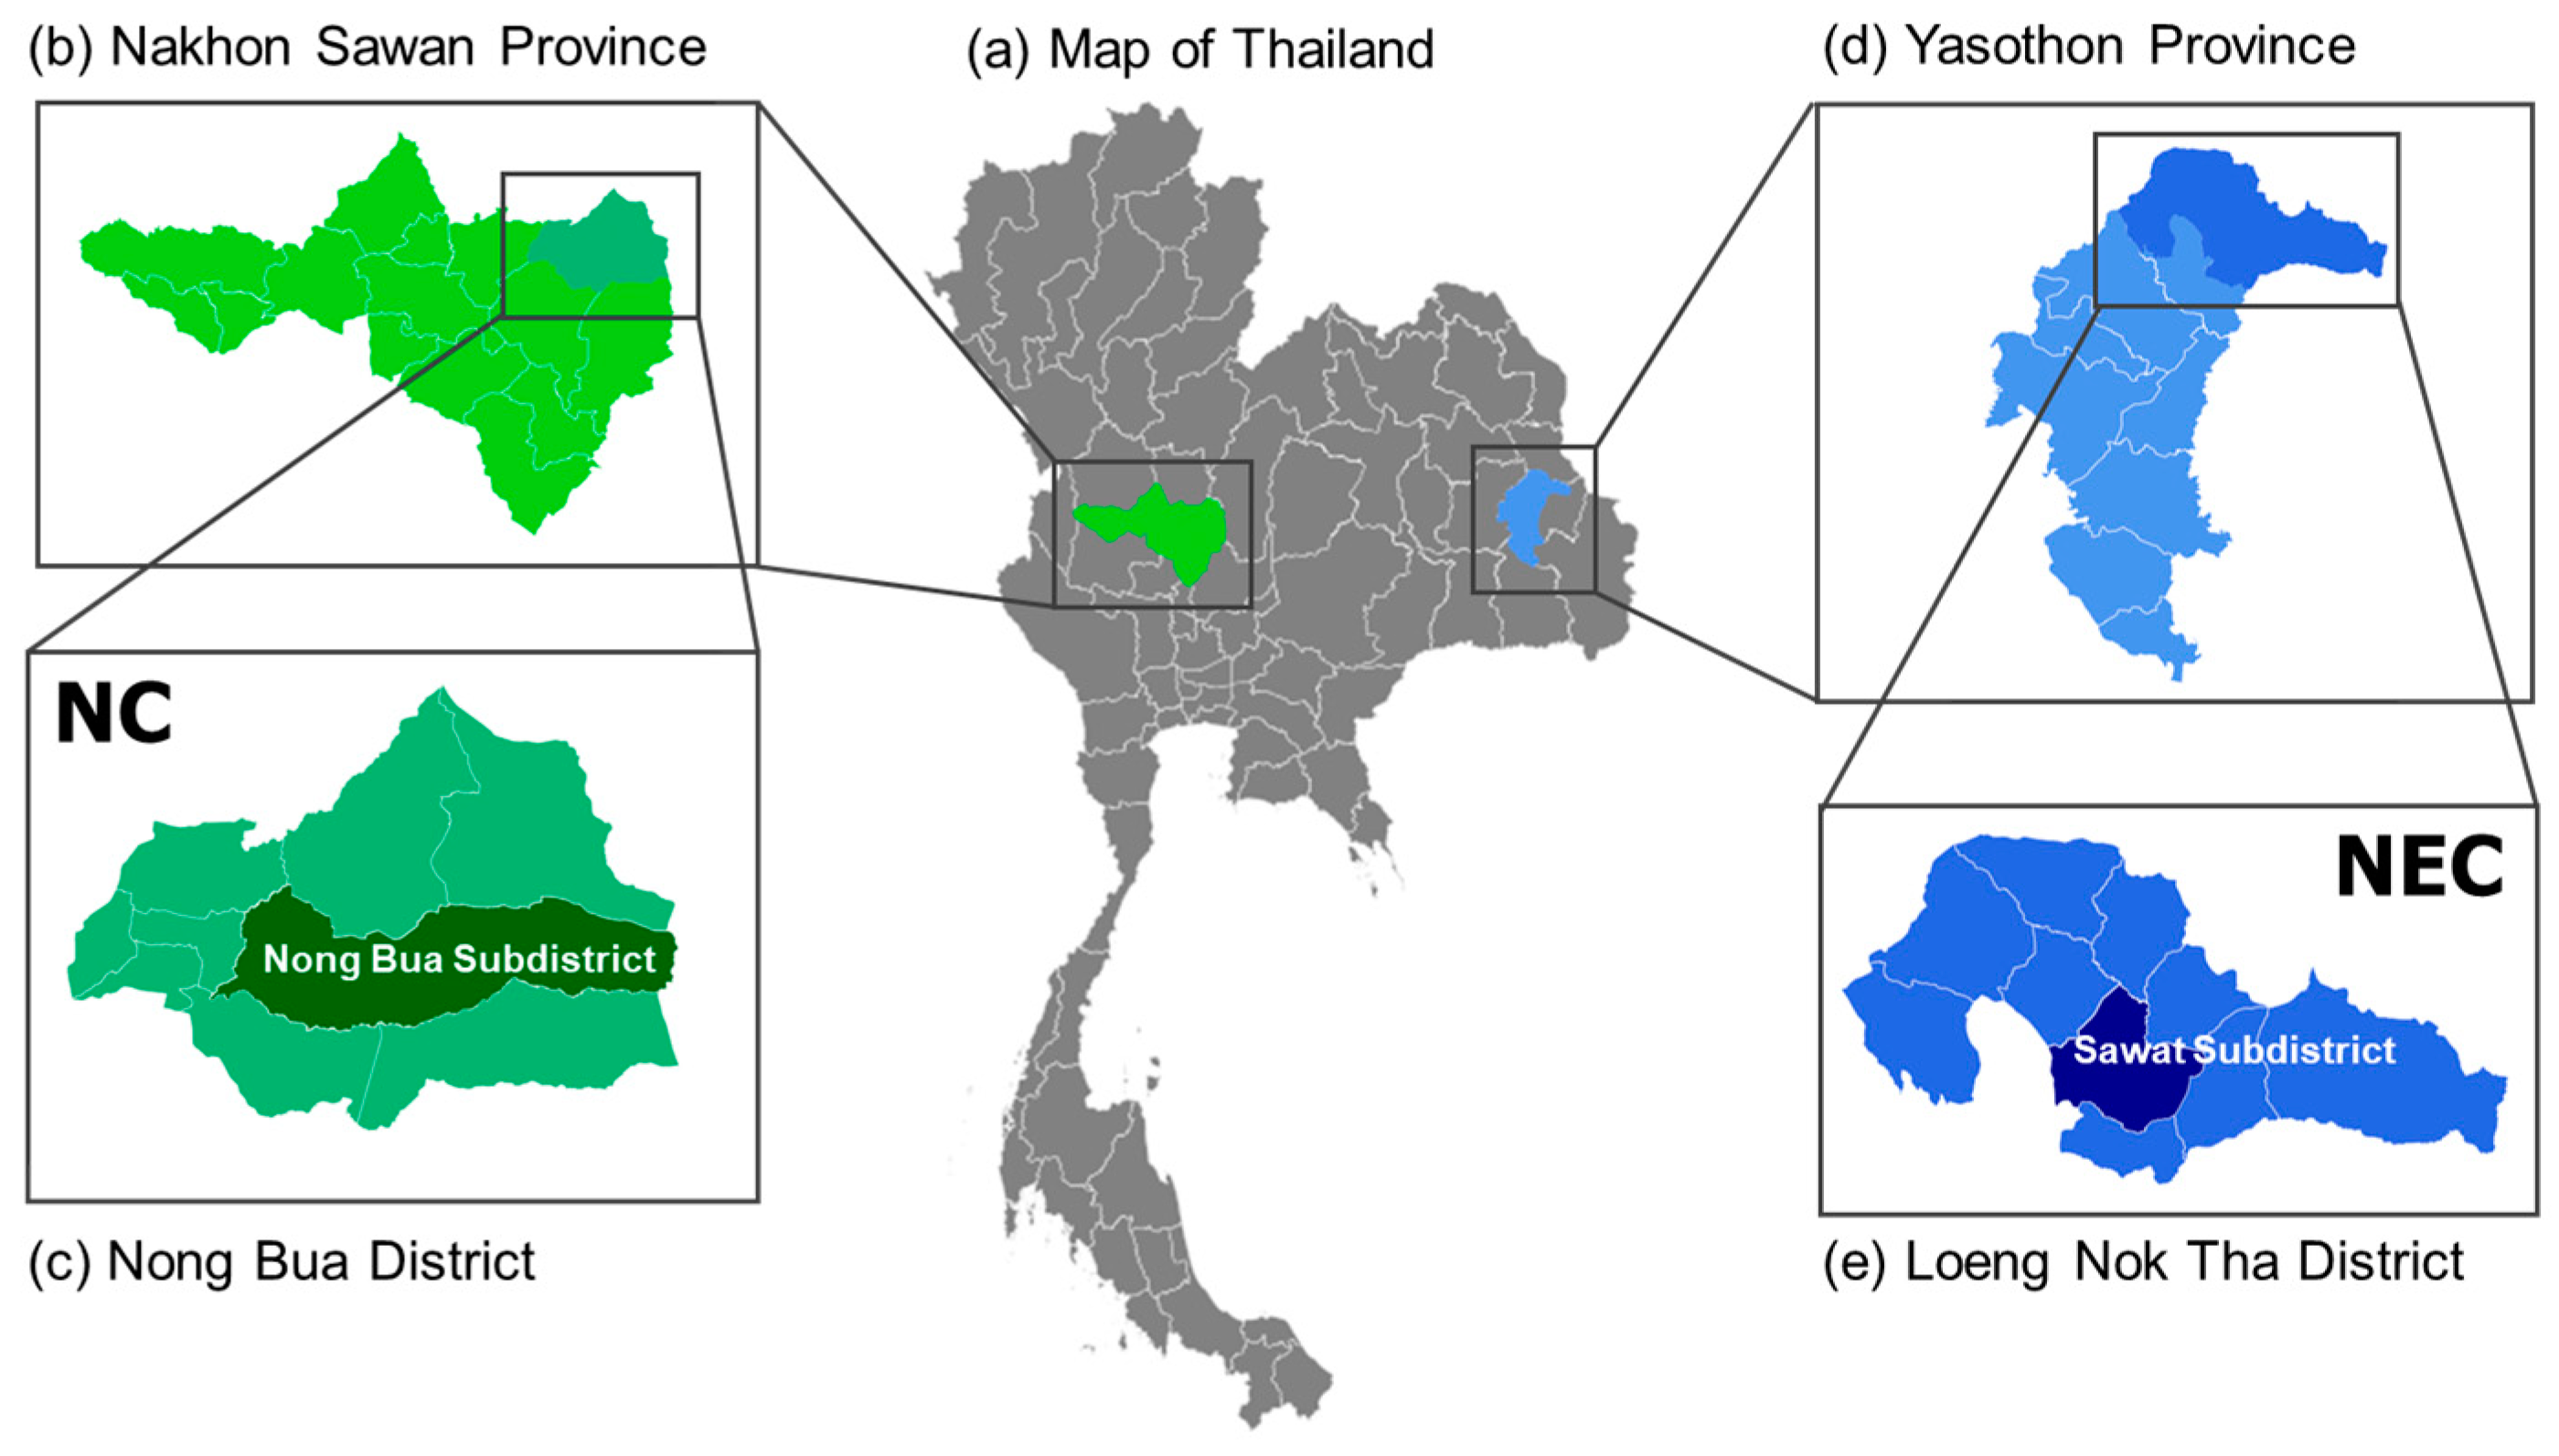
2.1. Study Area

Since the significant drought areas are in the north and northeast of Thailand, this study focuses on these two areas. One selected agricultural community is situated in Nakhon Sawan province in the north, while the other is in Yasothon province in northeast Thailand. Both farming communities are in non-irrigated areas. The study areas’ locations are depicted in Figure 3.
The selected community in Nakhon Sawan province is Wang thong village (NC), an agricultural community consisting of 158 households. Economic crops in this area include maize, cassava, and sugarcane. Farmers are performing intensive farming practices. The intensive agrarian system prioritizes commercial production, employs advanced technology, utilizes carefully selected plant varieties, and demands significant production inputs. The average farming area per household is about 4.83 hectares.
The other selected community in Yasothon province is an organic rice cultivation enterprise group (NEC), with members residing in several villages in Sawat subdistrict. This group has 104 households. This community enterprise is involved in organic rice farming, adhering to organic farming practices, utilizing natural resources for agricultural production, nourishing the soil with animal manure, and employing modest technology. The average farming area per household is about 2.03 hectares.

2.2. Survey Design

A preliminary survey, encompassing interviews with key informants, discussions in focus groups, and direct observations in the field, was conducted in 44 communities across five provinces in the north and three in the northeast of Thailand from January to April 2022. The survey aimed to identify study areas, understand current activities, assess drought impact, and determine the best practices for addressing drought in renewable energy technologies (RETs). Given that community characteristics vary across locations, influencing social acceptance and the effectiveness of intervention, two out of forty-four agricultural communities in two severely drought-affected areas were selected—one in Nakhon Sawan province (North) and the other in Yasothon province (Northeast).
A detailed survey in the selected areas was conducted from August to September 2022 using a questionnaire. A team of trained enumerators, who were community representatives appointed by the community’s leader, administered the survey face-to-face to the head of the household or a responsible member. The authors conducted a two-day training workshop for the enumerators, covering project objectives, questionnaire terminologies, and data collection techniques. Mock interviews were conducted to avoid bias during data collection. To test the questionnaire, we conducted two pilot surveys with a few households to refine the questionnaire’s quality by identifying ambiguous, complex, and repetitive questions.

2.3. Survey Content

The questionnaire was divided into two parts. Part 1 aimed to determine farmers’ demographic and socioeconomic profiles and knowledge of RETs. Part 2 focused on identifying farmers’ WTP for the SWP system, exploring the reasons behind their willingness or unwillingness to pay, and understanding their preferences regarding loan conditions for the deployment of SWP. Due to the high illiteracy rate in the research locations, questions were designed to be simple and easy to understand.
A hypothetical scenario was presented to assess farmers’ WTP: “Suppose a project evaluating the economic viability of investing in renewable energy technology like SWP, offering additional income during the dry season and providing drought solutions. With a payback period of less than 5 years and access to low-interest loans, would you invest in this technology?” If the answer is ‘Yes’, the questionnaire prompts farmers to select the corresponding investment form and maximum payment of WTP. Conversely, if the answer is ’No,’ the questionnaire asks about the reasons for this choice. A 5-point Likert scale measures respondents’ agreement level for “Yes” and “No” questions. Based on the responses obtained, a few ranges of WTP bids, precisely “below USD 857”, “USD 857 to USD 1714”, “USD 1714 to USD 2857”, and “above USD 2857”, were provided for farmers to choose from.

2.4. Sample and Sampling Design

After the preliminary survey, household questionnaires were designed. The purposeful selection of households for interviews was determined by their registered location or membership in the selected communities. Since the focused areas are known for their population, the number of households in NC and NEC is 158 and 104, respectively. Yamane’s formula was employed to calculate the sample size, as shown in Equation (1).
n = N 1 + N e 2 ,
where n is the sample size, N represents the population of the study, and e denotes the margin of error in the calculation. A margin of error of 0.05 was applied to determine a statistically representative sample of 113 in NC and 79 in NEC. Households for interviews were chosen randomly using the directory provided by the NC village head and the NEC community enterprise leader.

2.5. Data Processing

Primary data from farmers to the questionnaire was analyzed via Excel and a statistics package for social scientists, more specifically, the IBM SPSS version 29.0.1.0.
The survey information was coded, applying binominal, ordinal, and scaled categories to each question or variable. Binary coding (0, 1) was used for the binominal category. Ordinal variables were coded as 1, 2, 3, etc. Scaled variables, rated on a scale of 1 to 5, were coded based on the degree of assessment, where 1 represented the lowest and 5 represented the highest level. The incomplete or non-farmers’ answer sheets were excluded from the analysis.
The two models were used to analyze WTP. The first model is a binary logistic regression model that evaluates the effect of each explanatory variable on households’ willingness to invest in the SWP system. The logistic regression model is commonly used for binary classification problems, where the dependent variable has two categories [22,33]. The two categories are “Yes” and “No” for SWP investment. The general form of logistic regression can be expressed as
ln p 1 p = β 0 + β 1 X 1 + β 2 X 2 + + β n X n
where p represents the probability of the dependent variable being 1 (Yes), 1 − p denotes the probability of the dependent variable being 0 (No), β0 is a constant, β1, β2, …, βn are the coefficients corresponding to the independent variables X1, X2, …, Xn. The left side of the equation, ln p 1 p , is the log odds or logit, and the right side represents a linear combination of independent variables with their respective coefficients. The logistic function is then applied to the log odds to obtain predicted probabilities.

2.6. Estimation of Willingness to Pay (WTP)

The second model is a multiple regression that analyzes the factors that affect the WTP amount [34,35]. The model’s dependent variable was the amount the participant indicated as their WTP. For the representative value of WTP in the community, the simple mean formula is employed [12]:
W T P ¯ = 1 n i = 1 n V i   ,
where Vi denotes the amount of a household’s WTP and n represents the total number of households. The W T P ¯ was calculated using 429 for “below USD 857”, 1286 for “USD 857 to USD 1714”, 2286 for “USD 1714 to USD 2857”, and 2857 for “above USD 2857”.

3. Results

3.1. General Characteristics of the Respondents

Table 1 outlines the distribution of socioeconomic characteristics among farmers. The survey collected 210 responses, 127 from NC and 83 from NEC, surpassing the statistically representative sample size in both cases.
Over 40% of farmers in both communities identified agriculture as their primary income source. The majority relied on a combination of agricultural and other income sources, accounting for 59.8% (NC) and 53% (NEC). More than half of the respondents earned an annual income below the average national income of Thai farmers (USD 5143 per year estimated using the data from 2015 to 2019) reported by the Office of Agricultural Economics [18]. Additionally, approximately 8% of farmers in NC and 34% in NEC earned below Thailand’s poverty line, around USD 914 per year [36]. The mean annual income per household in NE is USD 7327, while in NEC is USD 2158. Consequently, over 80% of samples in NC and NEC are in debt, with only 13.3% and 14.5%, respectively, being debt-free. In NC, many farmers (44.9%) had debts ranging from USD 2857 to USD 14,286. For NEC, the majority (38.5%) had debts ranging from USD 2857 to lower.
As for land ownership, the results indicate that, on average, farmers own more than 0.8 hectares of land; however, farmers in NC and NEC reported “no land”, constituting 17.3% and 12%, respectively. The mean cultivation area per household in NE is double that of NEC because of different farming practices. Moreover, an overwhelming majority (90%) of the respondents would realize the benefits of SWP technology.

3.2. Analysis of the Rate of Farmers’ Willingness-to-Pay (WTP) Amount

Table 2 presents WTP responses. In the cases of NC and NEC, approximately 75.6% and 77.1% of farmers, respectively, accepted the SWP system. This high acceptance rate underscores the perceived value of the technology among farmers, indicating a significant acknowledgment of its benefits. The most frequent range of WTP amount answers in NC and NEC are (USD 857–USD 1714) and (<USD 857), respectively, while W T P ¯ in Equation (3) were USD 1438 and USD 1518 per household, respectively. The W T P ¯ in NEC is larger than NE, possibly because rice cultivation requires more water during specific periods, which could impact the overall yield of the product.
The study also explored farmers’ willingness to share investments in the system, recognizing that sharing the SWP could offer an additional solution for technology adoption. The results reveal that farmers in NEC were more inclined to share the system, accounting for 42.2%, whereas only 11.5% of farmers in NC expressed a willingness to share.

3.3. Reasons for Consumers’ Willingness to Pay

The results show that the reasons influencing willingness and unwillingness to pay exhibit the same pattern in both cases. Economic considerations such as “increasing family income”, “sustaining livelihood”, and “mitigating drought impacts” were widely agreed upon among those expressing positive responses. Reasons such as “access to low-interest loans” and “facing prolonged drought” received moderate agreement, while others garnered less attention.
Conversely, negative responses predominantly cited “waiting for government assistance” and “financial constraints”. Reasons like “uncertainly about return on investment” and “lack of information on what to change” were moderately agreed upon, with the rest receiving minimal attention. Further details on the reasons behind positive and negative responses in both communities can be found in Appendix A, Table A1 and Table A2.

3.4. Analysis of the Factors Influencing Consumers’ Willingness to Pay

The results demonstrate no multicollinearity problem, and none of the explanatory variables overlap, suggesting that these variables are suitable for inclusion in the logistic regression model. Details of multicollinearity among the explanatory variables considered in the model can be found in Appendix A, Table A3 and Table A4.
Table 3, columns (a) and (b), present the binary logistic model estimation of the willingness to invest in the SWP system in NC and NEC, respectively, which is influenced by a number of socio-economic characteristics. In NC, education (Edu), debt amount (DebA), and land ownership (LO) significantly affect farmers’ willingness to invest in SWP. The positive coefficients, i.e., the numerical figures more significant than unity, for these variables indicate that higher education, more incredible debt amount, and larger land ownership size positively influenced farmers’ decision to invest in SWP in this drought-prone area.
In contrast, in NEC, only Edu and DebA variables significantly impacted farmers’ decision to invest in SWP. The negative coefficient, i.e., the numerical figure less than unity, for DebA suggests that a greater debt amount led to a lower acceptance rate. Thus, common factors like Edu and DebA influenced farmers’ investment decisions in both NC and NEC.

3.5. Determinants of WTP Amounts

Table 3 shows the multiple regression model results for NC and NEC in columns (c) and (d). The findings reveal that Edu, DebA, LO, and cultivation area (CulA) significantly impact the WTP amounts in NC, while in NEC, only CulA demonstrates a statistically significant effect.

4. Discussion

This study delves into the extent and determinants of farmers’ willingness to pay for SWP in drought-prone areas in Thailand. The goal is to understand the demand and barriers related to SWP adoption to address challenges posed by drought effectively. Two key findings are highlighted.
The study reveals a high level of adaptation to SWP systems, with 75.6% and 77.1% of respondents in NC and NEC, respectively, expressing a willingness to invest in SWP. Our finding contrasts with a previous study in Pakistan [22], where only one-third of the sample stated acceptance. Disagreement in findings may be attributed to household socioeconomic characteristics. Previous studies reported a low average annual household income in Pakistan, approximately USD 637.2 [23], whereas Thai farmers earn more, with a minimum average yearly household income of USD 5279. Moreover, Pakistani farmers lack awareness and information about SWP systems, hindering their adaptation [22,23]. Thai farmers, on the other hand, recognize the benefits of SWP (RETk), constituting over 80% of the total, as shown in Table 1, owing to MOEN’s demonstration of the SWP system. Additionally, farmers in drought-prone areas in Thailand are generally open to investing more to mitigate the impacts of drought.
The decision to invest in NC and NEC is influenced by various factors, as depicted in Table 3. Two common factors, namely education (Edu) and debt amount (DebA), are found to be statistically significant in affecting WTP in both communities, while land ownership (LO) impacts only NC. For the Edu, the coefficient is positive in both communities, implying that better-educated farmers are more likely to express willingness to invest in SWP. This finding aligns with the results of previous studies [22,23].
In contrast, the coefficient of the DebA variable is positive in NC but harmful in NEC, suggesting that households in NC with higher debt are more likely to pay for SWP but unlikely in NEC. The data in Table 1 demonstrates a significant reliance of farmers’ households in NC on loans, indicating that positive loan experiences may encourage them to seek additional loans for increased profits. Previous studies argue that access to financial sources is likely to promote the adoption of RETs [23,37]. On the other hand, the negative DebA coefficient in NEC can be explained by the socioeconomic characteristics of NEC, exhibiting an older demographic (over 80%) and a higher proportion of women (about 63%) compared to NC. Ponchio M [38] reported that older individuals are less inclined to incur debt due to lower materialism, where a linear association is established between materialism and attitude towards debt. Additionally, older Thai women reportedly have lower debt levels than men [39]. Flores and Vieira [40] observed that females generally exhibit a less favorable attitude toward debt than males, credited to women’s higher tendency towards risk perception [40]. During the survey, observers noted that older women farmers in NEC expressed concerns about repaying debt due to their age, indicating an awareness of their indebtedness. Hence, in a younger society with a balanced gender distribution, the farmers with substantial debt are more willing to pay for SWP (positive DebA), while in an aging women’s society, they are less willing to pay (negative DebA).
Regarding land ownership (LO), it serves as an indicator of farmers’ wealth. The analysis reveals that the more prominent landowners in NC are more willing to pay for SWP. In contrast, the positive effect of this factor on the decision is only expected for NC. In contrast, the coefficient of this factor is negative in NEC, indicating that smaller land areas are associated with increased WTP, although this is not statistically significant. This contrast can be attributed to the distinct farming practices between NC and NEC, as explained in Section 2.1. Intensive farming in NC requires larger areas for increased income. Conversely, organic rice farming in NEC thrives in small to medium spaces, ensuring meticulous care for optimal quality. Therefore, the impact of the LO factor on WTP depends on the characteristics of community farming practices.
The WTP amount was influenced by various household socioeconomic characteristics. In NE and NEC, a significant association was observed with the household’s cultivation area. The positive coefficient in both cases suggested that households with a larger cultivation area demonstrated a higher WTP amount, likely due to limited water resources in drought-affected areas. This finding is consistent with the outcomes of earlier research in Rwanda [25]. However, in NC, households with a high level of education, an intensive debt amount, and larger land ownership were more likely to pay a higher WTP amount. These variables were not statistically significant in NEC, possibly due to the aging women society character. Thus, the larger cultivation area remains a common factor affecting the high WTP amount for SWP systems in both cases.
In the second finding, we highlight the value of the W T P ¯ for SWP, estimated at USD 1438 per household in NC and USD 1518 in NEC, averaging USD 1470 across both communities. This W T P ¯ level suggests that farmers favor a SWP system for covering extensive farming areas. However, when considering the installation cost of SWP presented in Table 4, the estimated W T P ¯ from both communities falls short of covering the installation cost, mainly due to the large average farming area in both communities, which is 4.83 hectares in NC and 2.03 hectares in NEC, as mentioned in Section 2.1 and Table 1.
However, considering the SWP demonstration carried out by the Thai government, sharing the system could be a viable solution for installing an extensive SWP system, provided farmers are willing to pool their investment. While sharing RETs may lead to managerial and benefit-sharing issues [41], implementing collective decision-making and establishing a written agreement regarding the shared SWP system could help address these concerns. Additionally, Table 2 reveals that 42.2% of farmers in NEC and 11.5% in NC have expressed their willingness to share the investment cost of the system. Therefore, collaborative investment emerges as a practical solution for adopting a larger system suitable for extensive farming areas.
Despite the levels of W T P ¯ , farmers may consider choosing a basic SWP system consisting solely of a 1 kW solar PV set with a 1.2 kW submersible pump, necessitating manual irrigation through various methods. The average market cost of such a system is USD 1036, as obtained from five company websites. Initiating a simple SWP system allows farmers to mitigate the impact of drought on smaller farm areas and helps them sustain some income. Given the limited water resources in drought-prone regions, focusing on smaller farming areas would be more feasible than larger ones.
Although the technology has a high acceptance rate and the W T P ¯ could cover the installation cost of small SWP systems, widespread adoption is limited, attributed to various reasons. Firstly, unlike other technologies that increase their income, such as motorcycles and computers, limited loan schemes or leasing packages are available for the SWP system. Motorcycles are a popular choice among Thai individuals and can be utilized for various purposes, such as taxi services, goods delivery services, mobile vending units, and agricultural produce. Despite the small SWP system and the similar costs, buying a motorcycle is simpler due to the availability of various credit systems and loan packages in the local market, a feature not found in SWP products. As discussed earlier, larger cultivation areas influence the WTP amount for SWP, indicating that farmers with extensive cultivation areas are willing to pay more. With 5.9 million farms averaging 4.04 hectares per farm (or 25.26 rai) in Thailand [42], like the average size in NC, widespread adoption is feasible. If most farmers receive subsidies or low-interest loans as part of the SWP system, they are more likely to embrace it, mitigating the impact of drought and boosting productivity. Therefore, the credit system is crucial in promoting and adopting the SWP system in local Thailand.
Secondly, SWP systems are highly vulnerable to theft due to the remote location of farming areas, which makes tracking difficult compared to motorcycles. Motorcycles can be kept at home, and there is a registration system for traceability; this feature is absent in SWP installations. Reports of stolen SWP components, including inverters, control boxes, solar panels, and submersible pumps, have been documented in NC and NEC areas. This problem was also mentioned in a previous study [43]. Since farms are often far from residential areas, farmers cannot easily transport these systems home daily, increasing concerns over untraceable losses. Therefore, it is essential to establish credit systems in local markets and develop effective security measures to protect installed systems from theft.

5. Conclusions

This study investigates farmers’ willingness-to-pay (WTP) for installing a Solar Water Pumping (SWP) system in drought-prone areas in Thailand to understand farmers’ demand and adoption barriers. The results reveal a high SWP adaptation potential in the agricultural communities, with over 75% of samples in the northern community (NC) and the northeastern community (NEC). Two common factors, namely education (Edu) and debt amount (DebA), significantly impact WTP in both communities, while the land ownership (LO) factor has a significant effect only in NC. Accordingly, higher education, more outstanding debt, and more extensive land ownership would increase WTP in NC, whereas, with an aging population and a high proportion of women in NEC, higher education and lower debt amount likely promote WTP. Less than 25% were unwilling to pay, mainly due to reliance on government support, financial constraints, uncertainty about returns on investment, and lack of information. The analysis further reveals that households with more extensive cultivation areas offer higher WTP amounts.
The average household willingness to pay ( W T P ¯ ) for an SWP system is estimated at USD 1438 per household in NC and USD 1518 in NEC, averaging USD 1470 overall. This suggests strong potential for small-scale SWP adoption. For larger systems, community cooperation through shared investment is crucial. Farmers’ preferences for either individual or shared investment models depend on their socioeconomic conditions. Adequate loan programs and security measures are essential to support adoption, with government and financial institutions playing a key role. These findings may guide policymakers and organizations to promote SWP technology, enhance climate resilience, and strengthen local economies.
The study enhances the understanding of farmers’ intentions to adopt SWP systems and provides policy recommendations; however, it has several limitations. Self-reported data from drought-affected areas may introduce biases like social desirability and reporting errors. Farmers’ stated WTP may not fully reflect their actual payment behavior [22]. Future research should explore broader social factors and policy influences on SWP adoption across different regions and cultures.

Author Contributions

Conceptualization, K.N.I., C.C. and N.L.; methodology, K.N.I., C.C. and N.L.; validation, N.L., S.M.G.D. and H.O.; formal analysis, N.L. and P.Y.; investigation, K.N.I. and N.L.; resources, C.C.; writing—original draft preparation, N.L.; writing—review and editing, K.N.I., C.C., S.M.G.D., H.O. and N.L.; visualization, N.L. and P.Y.; supervision, K.N.I., C.C. and H.O.; project administration, C.C. and N.L.; funding acquisition, K.N.I. All authors have read and agreed to the published version of the manuscript.

Funding

This research received funding from the Toyota Foundation, Japan, grant number D21-N2-0072.

Data Availability Statement

All data generated or analyzed during this study are included in this published article.

Acknowledgments

This work was partially supported by Chiang Mai University. The authors sincerely thank the Ministry of Energy of Thailand for generously providing the necessary information for this study. Grateful acknowledgment is extended to the Energy Technology for Environment Research Center at Chiang Mai University for their invaluable cooperation in obtaining additional data. Special thanks go to Parimol Tippayamalee for her dedicated efforts in the data collection process. The authors also extend their heartfelt gratitude to the communities of Ban Wang Thong and the organic rice cultivation enterprise for their enthusiastic and invaluable participation throughout the data collection process.

Conflicts of Interest

The authors declare no conflicts of interest. The funders were not involved in the study’s design; data collection, analysis, or interpretation; the writing of the manuscript; or the decision to publish the results.

Appendix A

Table A1. Reasons for WTP.
NCNEC
NMeanStd.
Deviation
NMeanStd.
Deviation
Want to increase family income963.450.806643.520.519
Can sustain a livelihood consistently, even during drought periods963.390.944643.721.039
Help mitigate the impacts of drought, such as reducing agricultural production losses963.321.081643.421.124
Having access to low-interest loan sources962.111.840643.111.460
The government offering guarantees961.731.750641.981.517
Having experts assist in preparing loan documents961.541.788641.971.671
Having ownership of cultivated land961.531.806642.281.768
Increasing and prolonged occurrences of droughts961.501.704642.981.634
Community environmental restoration961.071.578642.061.607
The presence of experts or relevant organizations recommending investment and utilization of energy technology equipment961.001.629642.451.798
Self-knowledge/experience in the field of renewable energy technology equipment960.971.572642.081.821
The size of the agricultural land is manageable960.901.566641.951.709
Having a successful community network for mentoring and consultation960.831.567642.111.750
Valid N (listwise)96 64
Table A2. Reasons for not being WTP.
NCNEC
NMeanStd.
Deviation
NMeanStd.
Deviation
Waiting for government promotion (to be provided)312.291.553193.371.499
Does not have money311.651.473193.161.675
Uncertain about savings or return on investment311.421.409191.371.892
No information or knowledge about what to change311.421.455191.051.810
No knowledge/experience in the field of renewable energy technology equipment311.101.2741900
Does not have ownership of land310.941.2371900
Valid N (listwise)31 19
Table A3. Correlation matrix of explanatory variables of NC.
ConstantGenEduSIDebALORETkCulA
Constant1.000−0.017−0.427−0.210−0.343−0.170−0.804−0.198
Gender (Gen)−0.0171.0000.1640.0590.2490.128−0.206−0.159
Education (Edu)−0.4270.1641.000−0.0540.4330.2380.061−0.109
Source of income (SI)−0.2100.059−0.0541.0000.0370.254−0.1170.172
Debt amount (DebA)−0.3430.2490.4330.0371.0000.191−0.036−0.233
Land ownership (LO)−0.1700.1280.2380.2540.1911.000−0.258−0.121
RET knowledge (RETk)−0.804−0.2060.061−0.117−0.036−0.2581.0000.210
Cultivated area (CulA)−0.198−0.159−0.1090.172−0.233−0.1210.2101.000
Table A4. Correlation matrix of explanatory variables of NEC.
ConstantGenEduSIDebALORETkCulA
Constant1.000−0.148−0.287−0.416−0.019−0.496−0.494−0.254
Gender (Gen)−0.1481.0000.030−0.0510.0630.132−0.1010.043
Education (Edu)−0.2870.0301.000−0.128−0.400−0.0130.0040.356
Source of income (SI)−0.416−0.051−0.1281.000−0.1630.0660.0850.062
Debt amount (DebA)−0.0190.063−0.400−0.1631.0000.035−0.291−0.448
Land ownership (LO)−0.4960.132−0.0130.0660.0351.000−0.062−0.185
RET knowledge (RETk)−0.494−0.1010.0040.085−0.291−0.0621.0000.227
Cultivated area (CulA)−0.2540.0430.3560.062−0.448−0.1850.2271.000

References

  1. Prabnakorn, S.; Maskey, S.; Suryadi, F.X.; de Fraiture, C. Assessment of drought hazard, exposure, vulnerability, and risk for rice cultivation in the Mun River Basin in Thailand. Nat. Hazards 2019, 97, 891–911. [Google Scholar] [CrossRef]
  2. Forotaghe, Z.A.; Souri, M.K.; Jahromi, M.G.; Torkashvand, A.M. Physiological and Biochemical Responses of Onion Plants to Deficit Irrigation and Humic Acid Application. Open Agric. 2021, 6, 728–737. [Google Scholar] [CrossRef]
  3. Department of Water Resources of Thailand. สรุปผลการป้องกันและบรรเทาสถานการณ์ภัยแล้ง ปี 2015–2016 (Summary of Drought Prevention and Mitigation Efforts in 2015–2016). Bangkok. 2016. Available online: http://mekhala.dwr.go.th/imgbackend/doc_file/document_125313.pdf (accessed on 19 December 2023). (In Thai).
  4. Royal Irrigation Department. ข้อมูลสารสนเทศ: โครงการชลประทาน 2565 (Information: Irrigation Project 2022). 2022. Available online: https://www.rid.go.th/_data/documents/rid_annual_conclusion/02_conclusion/2565/Book.pdf (accessed on 23 November 2023). (In Thai).
  5. Department of Land Development. คาดการณ์พื้นที่ที่มีโอกาศเกิดภัยแล้ง (Forecast of Areas at Risk of Drought). Available online: http://irw101.ldd.go.th/index.php/2017-05-26-02-51-44 (accessed on 18 November 2023). (In Thai).
  6. Office of the National Economic and Social Development Council. ผลิตภัณฑ์ภาคและจังหวัดแบบปริมาณลูกโซ่ ปี 2564 (Gross Regional and Provincial Product, Chain Volume Measures 2021). Available online: https://www.nesdc.go.th/nesdb_en/main.php?filename=index (accessed on 23 November 2023). (In Thai).
  7. Wikipedia List of Thai Provinces by GPP. 19 March 2023. Available online: https://en.wikipedia.org/wiki/List_of_Thai_provinces_by_GPP (accessed on 23 November 2023).
  8. Terang, B.; Baruah, D.C. Techno-economic and environmental assessment of solar photovoltaic, diesel, and electric water pumps for irrigation in Assam, India. Energy Policy 2023, 183, 113807. [Google Scholar] [CrossRef]
  9. Niajalili, M.; Mayeli, P.; Naghashzadegan, M.; Poshtiri, A.H. Techno-economic feasibility of off-grid solar irrigation for a rice paddy in Guilan province in Iran: A case study. Sol. Energy 2017, 150, 546–557. [Google Scholar] [CrossRef]
  10. Breidert, C.; Hahsler, M.; Reutterer, T. A review of methods for measuring willingness-to-pay. Innov. Mark. 2006, 2, 8–32. [Google Scholar]
  11. Voelckner, F. An empirical comparison of methods for measuring consumers’ willingness to pay. Mark. Lett. 2006, 17, 137–149. [Google Scholar] [CrossRef]
  12. Kaonga, O.; Masiye, F.; Kirigia, J.M. How viable is social health insurance for financing health in Zambia? Results from a national willingness to pay survey. Soc. Sci. Med. 2022, 305, 115063. [Google Scholar] [CrossRef]
  13. Ogbeide, O.A.; Stringer, R.; Ford, C. Consumer Willingness to Pay a Premium for the Health Benefits of Organic Wine. Mayfair J. Agribus. Manag. 2015, 1, 1–23. Available online: https://www.researchgate.net/publication/272510176 (accessed on 2 December 2024).
  14. Tian, N.; Rubino, E.C.; Gan, J.; Gutierrez-Castillo, A.; Pelkki, M. Private landowners’ willingness-to-pay for certifying forestland and influencing factors: Evidence from Arkansas, United States. Environ. Chall. 2022, 9, 100600. [Google Scholar] [CrossRef]
  15. Ren, X.; Pan, N.; Jiang, H. Differentiated pricing for airline ancillary services considering passenger choice behavior heterogeneity and willingness to pay. Transp. Policy 2022, 126, 292–305. [Google Scholar] [CrossRef]
  16. Alhassan, I.B.; Matthews, B.; Toner, J.P.; Susilo, Y.O. Public transport users’ willingness-to-pay for a multi-county and multi-operator integrated ticket: Valuation and policy implications. Res. Transp. Bus. Manag. 2022, 45, 100836. [Google Scholar] [CrossRef]
  17. Bai, R.; Lin, B. Are residents willing to pay for garbage recycling: Evidence from a survey in Chinese first-tier cities. Environ. Impact. Assess. Rev. 2022, 95, 106789. [Google Scholar] [CrossRef]
  18. Groh, E.D. Exposure to wind turbines, regional identity and the willingness to pay for regionally produced electricity. Resour. Energy Econ. 2022, 70, 101332. [Google Scholar] [CrossRef]
  19. Lehmann, N.; Sloot, D.; Ardone, A.; Fichtner, W. Willingness to pay for regional electricity generation—A question of green values and regional product beliefs? Energy Econ. 2022, 110, 106003. [Google Scholar] [CrossRef]
  20. Brown, M.A.; Kale, S.; Kyeong-Cha, M.; Chapman, O. Exploring the willingness of consumers to electrify their homes. Appl. Energy 2023, 338, 120791. [Google Scholar] [CrossRef]
  21. Morrissey, K.; Plater, A.; Dean, M. The cost of electric power outages in the residential sector: A willingness to pay approach. Appl. Energy 2018, 212, 141–150. [Google Scholar] [CrossRef]
  22. Elahi, E.; Khalid, Z.; Zhang, Z. Understanding farmers’ intention and willingness to install renewable energy technology: A solution to reduce the environmental emissions of agriculture. Appl. Energy 2022, 309, 118459. [Google Scholar] [CrossRef]
  23. Ali, A.; Rahut, D.B.; Behera, B. Factors influencing farmers׳ adoption of energy-based water pumps and impacts on crop productivity and household income in Pakistan. Renew. Sustain. Energy Rev. 2016, 54, 48–57. [Google Scholar] [CrossRef]
  24. Osuafor, O.O.; Ude, K.D. Valuation of Rice Farmers’ Preferences and Willingness to Pay for Climate-Smart Agricultural Technologies in Southeast, Nigeria. Asian J. Econ. Model. 2021, 9, 48–57. [Google Scholar] [CrossRef]
  25. Meunier, S.; Manning, D.T.; Quéval, L.; Cherni, J.A.; Dessante, P.; Zimmerle, D. Determinants of the marginal willingness to pay for improved domestic water and irrigation in partially electrified Rwandan villages. Int. J. Sustain. Dev. World Ecol. 2019, 26, 547–559. [Google Scholar] [CrossRef]
  26. Sillano, M.; de Dios Ortúzar, J. Willingness-to-pay estimation with mixed logit models: Some new evidence. Environ. Plan A 2005, 37, 525–550. [Google Scholar] [CrossRef]
  27. Hole, A.R.; Kolstad, J.R. Mixed logit estimation of willingness to pay distributions: A comparison of models in preference and WTP space using data from a health-related choice experiment. Empir. Econ. 2012, 42, 445–469. [Google Scholar] [CrossRef]
  28. Amador, F.J.; González, R.M.; Ramos-Real, F.J. Supplier choice and WTP for electricity attributes in an emerging market: The role of perceived past experience, environmental concern and energy saving behavior. Energy Econ. 2013, 40, 953–966. [Google Scholar] [CrossRef]
  29. Zhou, D.; Abdullah. The acceptance of solar water pump technology among rural farmers of northern Pakistan: A structural equation model. Cogent. Food Agric. 2017, 3, 1280882. [Google Scholar] [CrossRef]
  30. Poungchompu, S.; Tsuneo, K. Aspects of the Aging Farming Population and Food Security in Agriculture for Thailand and Japan. Int. J. Environ. Rural. Dev. 2012, 3, 102–107. [Google Scholar]
  31. Jansuwan, P.; Zander, K.K. What to do with the farmland? Coping with ageing in rural Thailand. J. Rural. Stud. 2021, 81, 37–46. [Google Scholar] [CrossRef]
  32. OCHA Regional Office for Asia and the Pacific (ROAP). Thailand—Subnational Administrative Boundaries. Available online: https://data.humdata.org/dataset/cod-ab-tha (accessed on 14 March 2025).
  33. Benedict, B.E.O.; Edward, D.; Benedict, E.O.; Edward, D. A Research Study to Determine If Solar Dryer Technology for Preservation of Agro-Produce Is Needed in Botswana. Glob. J. Res. Eng. A Mech. Mech. Eng. 2020, 20, 23–34. Available online: https://engineeringresearch.org/index.php/GJRE/article/view/2059 (accessed on 24 November 2023).
  34. Togridou, A.; Hovardas, T.; Pantis, J.D. Determinants of visitors’ willingness to pay for the National Marine Park of Zakynthos, Greece. Ecol. Econ. 2006, 60, 308–319. [Google Scholar] [CrossRef]
  35. Surendran, A.; Sekar, C. An economic analysis of willingness to pay (WTP) for conserving the biodiversity. Int. J. Soc. Econ. 2010, 37, 637–648. [Google Scholar] [CrossRef]
  36. Office of Agricultural Economics. ตัวชี้วัด ภาวะเศรษฐกิจ สังคม ครัวเรือนเกษตร (Indicators of Economic and Social Conditions of Agricultural Households). Available online: https://www.oae.go.th/assets/portals/1/files/econ/Socio-econ2018-22.pdf (accessed on 19 November 2023). (In Thai).
  37. Andriamanohiarisoamanana, F.J.; Randrianantoandro, T.N.; Ranaivoarisoa, H.F.; Kono, H.; Yoshida, G.; Ihara, I.; Umetsu, K. Integration of biogas technology into livestock farming: Study on farmers’ willingness to pay for biodigesters in Madagascar. Biomass Bioenergy 2022, 164, 106557. [Google Scholar] [CrossRef]
  38. Ponchio, M.C. The Influence of Materialism on Consumption Indebtedness in the Context of Low Income Consumers from the City of Sao Paulo; the Getulio Vargas Foundation—FGV-EAESP: Sao Paulo, Brazil, 2006. [Google Scholar]
  39. Sobieszczyk, T.; Knodel, J.; Chayovan, N. Gender and wellbeing among older people: Evidence from Thailand. Ageing Soc. 2003, 23, 701–735. [Google Scholar] [CrossRef]
  40. Flores, S.A.M.; Vieira, K.M. Propensity toward indebtedness: An analysis using behavioral factors. J. Behav. Exp. Financ. 2014, 3, 1–10. [Google Scholar] [CrossRef]
  41. Luangchosiri, N.; Dumlao, S.M.G.; Ogawa, T.; Okumura, H.; Ishihara, K.N. Optimum scheduling of shared greenhouse solar dryer in Thai community. Solar Energy 2023, 264, 112031. [Google Scholar] [CrossRef]
  42. Kwanmuang, K.; Pongputhinan, T.; Jabri, A.; Chitchumnung, P. Small-Scale Farmers Under Thailand’s Smart Farming System; FFTC Agricultural Policy Platform: Taipei, Taiwan, 2020; Available online: https://www.researchgate.net/publication/353680690 (accessed on 5 January 2024).
  43. Winrock International. Empowering Agriculture: Energy Options for Horticulture. 2009. Available online: https://ucdavis.app.box.com/s/y2zx9txzi8m3xbbz6zglnifc0igcqn26 (accessed on 1 December 2024).
Figure 1. Drought areas in Thailand, orange (severe drought—more than 6 times in 10 years), yellow (moderate drought—4–5 times in 10 years), and green (mild drought—less than 3 times in 10 years).
Water 17 00858 g001
Figure 2. Example of Solar Water Pumping systems in Thailand.
Water 17 00858 g002
Figure 3. Geographic location of the study areas: (a) Map of Thailand, (b) Nakhon Sawan Province, (c) Nong Bua District, indicating the specific area of Nong Bua Subdistrict where NC is located, (d) Yasothon Province, and (e) Loeng Nok Tha District, indicating the specific area of Sawat Subdistrict where NEC is located. GIS data sourced from the Humanitarian Data Exchange [32].
Water 17 00858 g003
Table 1. Socioeconomic profile of the respondents.
VariablesCategoryNCNEC
N%N%
GenderFemale6450.45262.7
(Gen)Male6349.63137.3
Total127100.083100.0
Age<31 years64.700
(Age)31–40 years2318.100
41–50 years2418.91416.9
51–60 years2822.02631.3
>60 years4636.24351.8
EducationElementary level or lower8365.45060.2
(Edu)Secondary level or higher4434.63339.8
Source of incomeAgriculture5140.23947.0
(SI)Agriculture and non-agriculture7659.84453.0
Annual income<USD 914107.92833.7
(AI)USD 914–USD 25712116.53643.4
USD 2571–USD 42862116.51315.7
>USD 42867559.167.2
MeanUSD 7327USD 2158
SDUSD 6784USD 2890
Debt amount01713.41113.3
(DebA)<USD 285786.33238.5
USD 2857–USD 14,2865744.92631.3
>USD 14,2864535.41315.7
Land ownershipNo land ownership2217.31012.0
(LO)Land ownership < 0.8 ha53.91720.5
Land ownership > 0.8 ha10078.75667.5
Cultivation area<3.20 ha3930.77185.5
(CulA)3.20–7.04 ha6450.41012.1
7.20–11.04 ha1612.611.2
>11.04 ha86.311.2
Mean4.83 ha2.03 ha
SD4.57 ha2.43 ha
RET knowledgeUnawareness33.91619.3
(RETk)Awareness12496.16780.7
Note: 35 THB = USD 1.
Table 2. The results of WTP of respondents.
OptionsNCNECTotal
N%N%N%
WTPNo3124.41922.95023.8
Yes9675.66477.116076.2
Total127100.083100.0210100.0
WTP amount≤USD 8571212.52132.83320.6
USD 857–USD 1714 6264.61726.67949.4
USD 1714–USD 28571717.71421.93119.4
≥USD 285755.21218.81710.6
Total96100.064100.0160100.0
W T P ¯ MeanUSD 1438USD 1518USD 1470
SDUSD 615USD 940USD 760
Investment formIndividual8588.53757.812276.3
(IF)Sharing1111.52742.23823.8
Total96100.064100.0160100.0
Table 3. Determinants of willingness to pay.
Explanatory VariablesLogistic: WTP (1 = Yes; 0 = No)Multiple Regression: WTP Amount
NC
(a)
NEC
(b)
NC
(c)
NEC
(d)
Gender (Gen)1.472 1.1280.9730.940
(0.533)(0.619)(0.177)(0.326)
Education (Edu)3.374 *5.615 **1.368 *1.492
(0.635)(0.754)(0.185)(0.337)
Source of income (SI)1.9810.8171.1731.457
(0.542)(0.600)(0.183)(0.314)
Debt amount (DebA)3.660 ***0.389 **1.616 ***0.975
(0.303)(0.410)(0.092)(0.177)
Land ownership (LO)1.918 *0.8671.273 **0.815
(0.341)(0.411)(0.119)(0.231)
RET knowledge (RETk)3.8482.8071.8491.115
(1.604)(0.688)(0.593)(0.305)
Cultivation area (CulA)1.0121.0821.006 *1.027 **
(0.013)(0.050)(0.003)(0.010)
Constant4.648 × 10−5 ***0.5260.081 **2.001
(3.572)(1.992)(1.194)(1.098)
Number of observations1278312783
Notes: *, **, and *** represent the significance levels of parameters at 90%, 95%, and 99%, respectively. All coefficients are exponentiated. The standard errors are given in parentheses.
Table 4. Estimation cost of SWP system in different sizes of cultivation areas. Unit: USD.
Items<1 ha1 ha2 ha4 ha
Solar pumping system (1 kW) and submersible (1.2 kW)1036
Solar pumping system (2 kW) and submersible (1.5 kW) 184618452769
Storage tank and foundation 156431286256
Water distribution system 3907801560
Pump for distribution (1.12 kW) 58911782356
Total10364389693212,941
Notes: the installation cost of the SWP system for 1 ha is based on the actual installation cost; the installation cost for 2 ha and 4 ha were estimated based on the real cost of 1 ha; the installation cost of basic SWP system for less than 1 ha is average market price obtained from five company websites.
Disclaimer/Publisher’s Note: The statements, opinions and data contained in all publications are solely those of the individual author(s) and contributor(s) and not of MDPI and/or the editor(s). MDPI and/or the editor(s) disclaim responsibility for any injury to people or property resulting from any ideas, methods, instructions or products referred to in the content.

