1. Introduction
Permafrost is a heterogeneous and anisotropic multiphase composite soil material composed of solid soil particles, ice, liquid water, and gases [
1]. Perennial permafrost refers to soil and rock layers that remain frozen for multiple years. With the rise in global temperatures, the thawing of permafrost could result in the emission of greenhouse gases, further exacerbating global warming. The stability and changes of permafrost have profound impacts on terrestrial plant ecosystems, carbon cycling, and engineering stability. High-temperature permafrost, also known as near-phase-transition zone permafrost, differs significantly in mechanical properties from low-temperature permafrost due to its higher unfrozen water content [
2]. There is an urgent need to study its melting process and evolution factors. Investigating how temperature variations and the changes in unfrozen water content within permafrost occur during freeze–thaw cycles is crucial for a thorough understanding and forecasting of permafrost degradation in Northeast China, and for comprehending the effects of permafrost deterioration on ecological systems and structural integrity. Variations in unfrozen water content throughout freeze–thaw cycles in permafrost can lead to changes in soil mechanical properties, affecting the stability of cold-region engineering structures. In addition, changes in soil mechanical properties due to temperature-related moisture changes can also affect the bearing capacity and safety of foundations in cold regions.
During the freezing process, permafrost may exhibit supercooling [
3]. Supercooling in soil denotes the occurrence where soil temperature falls below freezing; however, the moisture in the soil stays liquid during the freezing process [
4,
5]. For wet soils that exhibit supercooling, the supercooling temperature refers to the starting crystallization temperature of soil water, rather than the freezing temperature. Once the temperature hits the supercooling threshold, the pore water starts to experience a phase transition [
6], releasing the latent heat of the phase change [
7], thereby raising the soil temperature. However, external cooling lowers the temperature. This contradiction dictates the duration for which the soil remains at freezing temperature and establishes the temperature range for the phase transition during freezing.
The soil freezing process involving supercooling typically encompasses four phases: the supercooling phase, jump phase, constant phase, and decline phase [
8]. During the supercooling stage, the soil temperature drops without crystallization in the soil, and the liquid water remains in its current state without phase change [
9]. In the jump stage, when the temperature attains a specific level, the temperature curve shows an inflection point. Some water molecules begin to aggregate to form tiny nuclei, and subsequently, more water molecules arrange around the nuclei, allowing the nuclei to grow stably [
10]. The crystallization process releases latent heat, causing the soil temperature to rise. After entering the constant stage, ice crystals continue to grow, and free water freezes rapidly. Under the combined effects of external cooling and internal latent heat release from the phase change, the soil temperature balances at a certain point. This point’s temperature value is the freezing temperature, and its duration relies on the quantity of freezable water within the unfrozen portion [
11]. In the declining stage, the soil’s bound water freezes, and after a significant portion has solidified, the soil cools without the release of latent heat from phase change [
12]. Therefore, the supercooling temperature of soil denotes the first crystallization temperature of soil water, distinct from the initial freezing point. Once the temperature attains the supercooling threshold, the water in the soil that has not frozen starts to change phase while concurrently releasing latent heat.
The melting process of permafrost is different from the freezing process [
13]. Within a lower temperature range, ice crystals in the small pores of the soil begin to melt, absorbing the heat of melting, which gradually transforms the ice phase into the liquid phase with minimal temperature change within the soil. With the continuous increase in temperature, the ice in the larger pores of the soil begins to melt, with a sharp increase in heat absorption until all the soil ice has fully dissolved. During the thawing of high-temperature permafrost [
14], substantial phase changes happen in the soil–water system beneath the freezing temperature. By observing the temperature–initial water content relationship, the temperature at which permafrost fully melts shows a slight increase as the initial water content rises. This is due to the fact that when the ice attains the melting point, it is in a state of the ice–water mixture, and further heat absorption is required for complete melting.
This manuscript reviews several key studies that have explored the characteristics of unfrozen water in permafrost. These studies provide an essential background for understanding the complex thermal and physical behaviors of soil water during freeze–thaw cycles. Tomasz Kozlowski [
15], in his study of unfrozen water in permafrost, numerically examined the thermogram acquired through Differential Scanning Calorimetry (DSC) during the heating process and proposed a method for analyzing soil-unfrozen water curves [
16]. He established key parameters, including supercooling temperature, freezing temperature, and melting temperature, throughout the freeze–thaw cycle [
17]. Focusing on clay as the primary subject of his research, he introduced a formula that was both semi-theoretical and semi-empirical, aimed to investigate changes in the unfrozen water amount within permafrost [
18]. Tsytovich [
19] related the unfrozen water content to the plasticity index of the soil, plastic limit water content, and negative temperature. Tice et al. [
20] proposed an exponential empirical expression for the non-frozen water content of reshaped clay, primarily by determining the parameters in the expression through the specific surface area of soil particles. Their approach emphasized the importance of soil texture and structure in determining unfrozen water content, which aligns with our focus on the impact of initial water content and soil type. Akayawa [
21] experimentally studied the parameter values of various soil samples and accumulated a large amount of data, but these parameter values varied. Michalowskia [
22] proposed a three-parameter model to explain the features of alterations in the unfrozen water content of permafrost. This model offered a valuable structure for comprehending the dynamic behavior of unfrozen water during freeze–thaw cycles, a phenomenon that we investigate in detail. For the same type of soil, differences in soil structure and composition can lead to fluctuations in parameter values associated with unfrozen water content. Although the empirical formulas presented above aim to estimate the unfrozen water content in permafrost and contribute to a comprehensive comprehension of the elements affecting the amount of unfrozen water in permafrost, thereby providing a solid foundation for our research, their applicability varies significantly in different regions, resulting in insufficient accuracy and universality of the simulation results.
The most fundamental issue in studying unfrozen water is how to accurately measure its content. Currently, methods for assessing unfrozen water content primarily consist of the calorimetric technique [
23,
24] developed based on the changes in the hydrogen ion volume density of liquid water in permafrost, pulse nuclear magnetic resonance (NMR) [
25], free water determination (FDR) [
26], finite difference time-domain (FDT) [
27], time-domain reflectometry (TDR) [
28] and time-domain transmission (TDT) [
29]. Most current models aimed at determining unfrozen water content tend to emphasize the freezing phase while overlooking the influence of supercooling that can occur during this process [
30]. They usually select a few temperature points for measurement, which is neither accurate nor capable of explaining the details of the freeze–thaw process.
Differential Scanning Calorimetry (DSC) represents a form of thermal analysis that measures a substance’s phase-transition temperature and the correlation between heat flow and temperature or time. It can record the heat-flow changes caused by phase transitions such as crystallization, melting, and polymorphic transitions that occur in samples as the temperature changes. Using NMR and DSC, two new technologies, it is possible to observe continuous phase transitions in a single sample during the freeze–thaw process [
31].
In this study, we explored the thermal response and phase-change heat-flow patterns of soil under freeze–thaw conditions by Differential Scanning Calorimeter (DSC) experiments and developed a frozen soil temperature–unfrozen water content model [
32]. It investigated the phase-transition process and the variation of non-frozen water content in permafrost during freeze–thaw cycles. This study is important for understanding the hydrodynamics, physical properties, and thermodynamic properties of freeze–thaw cycles in soils in permafrost regions. We not only focused on the thermal characteristics of permafrost but also comprehensively analyzed the parameters of the temperature–unfrozen water content model and looked forward to future research directions in the field of high-temperature permafrost. We emphasize the importance of understanding unfrozen water content to offer a theoretical foundation for forecasting the permafrost degradation trend and the factors affecting permafrost degradation, which is of great significance for hydrological studies and engineering uses in frigid areas.
2. Research Process and Methods
2.1. Principle of Differential Scanning Calorimetry (DSC) Experiment
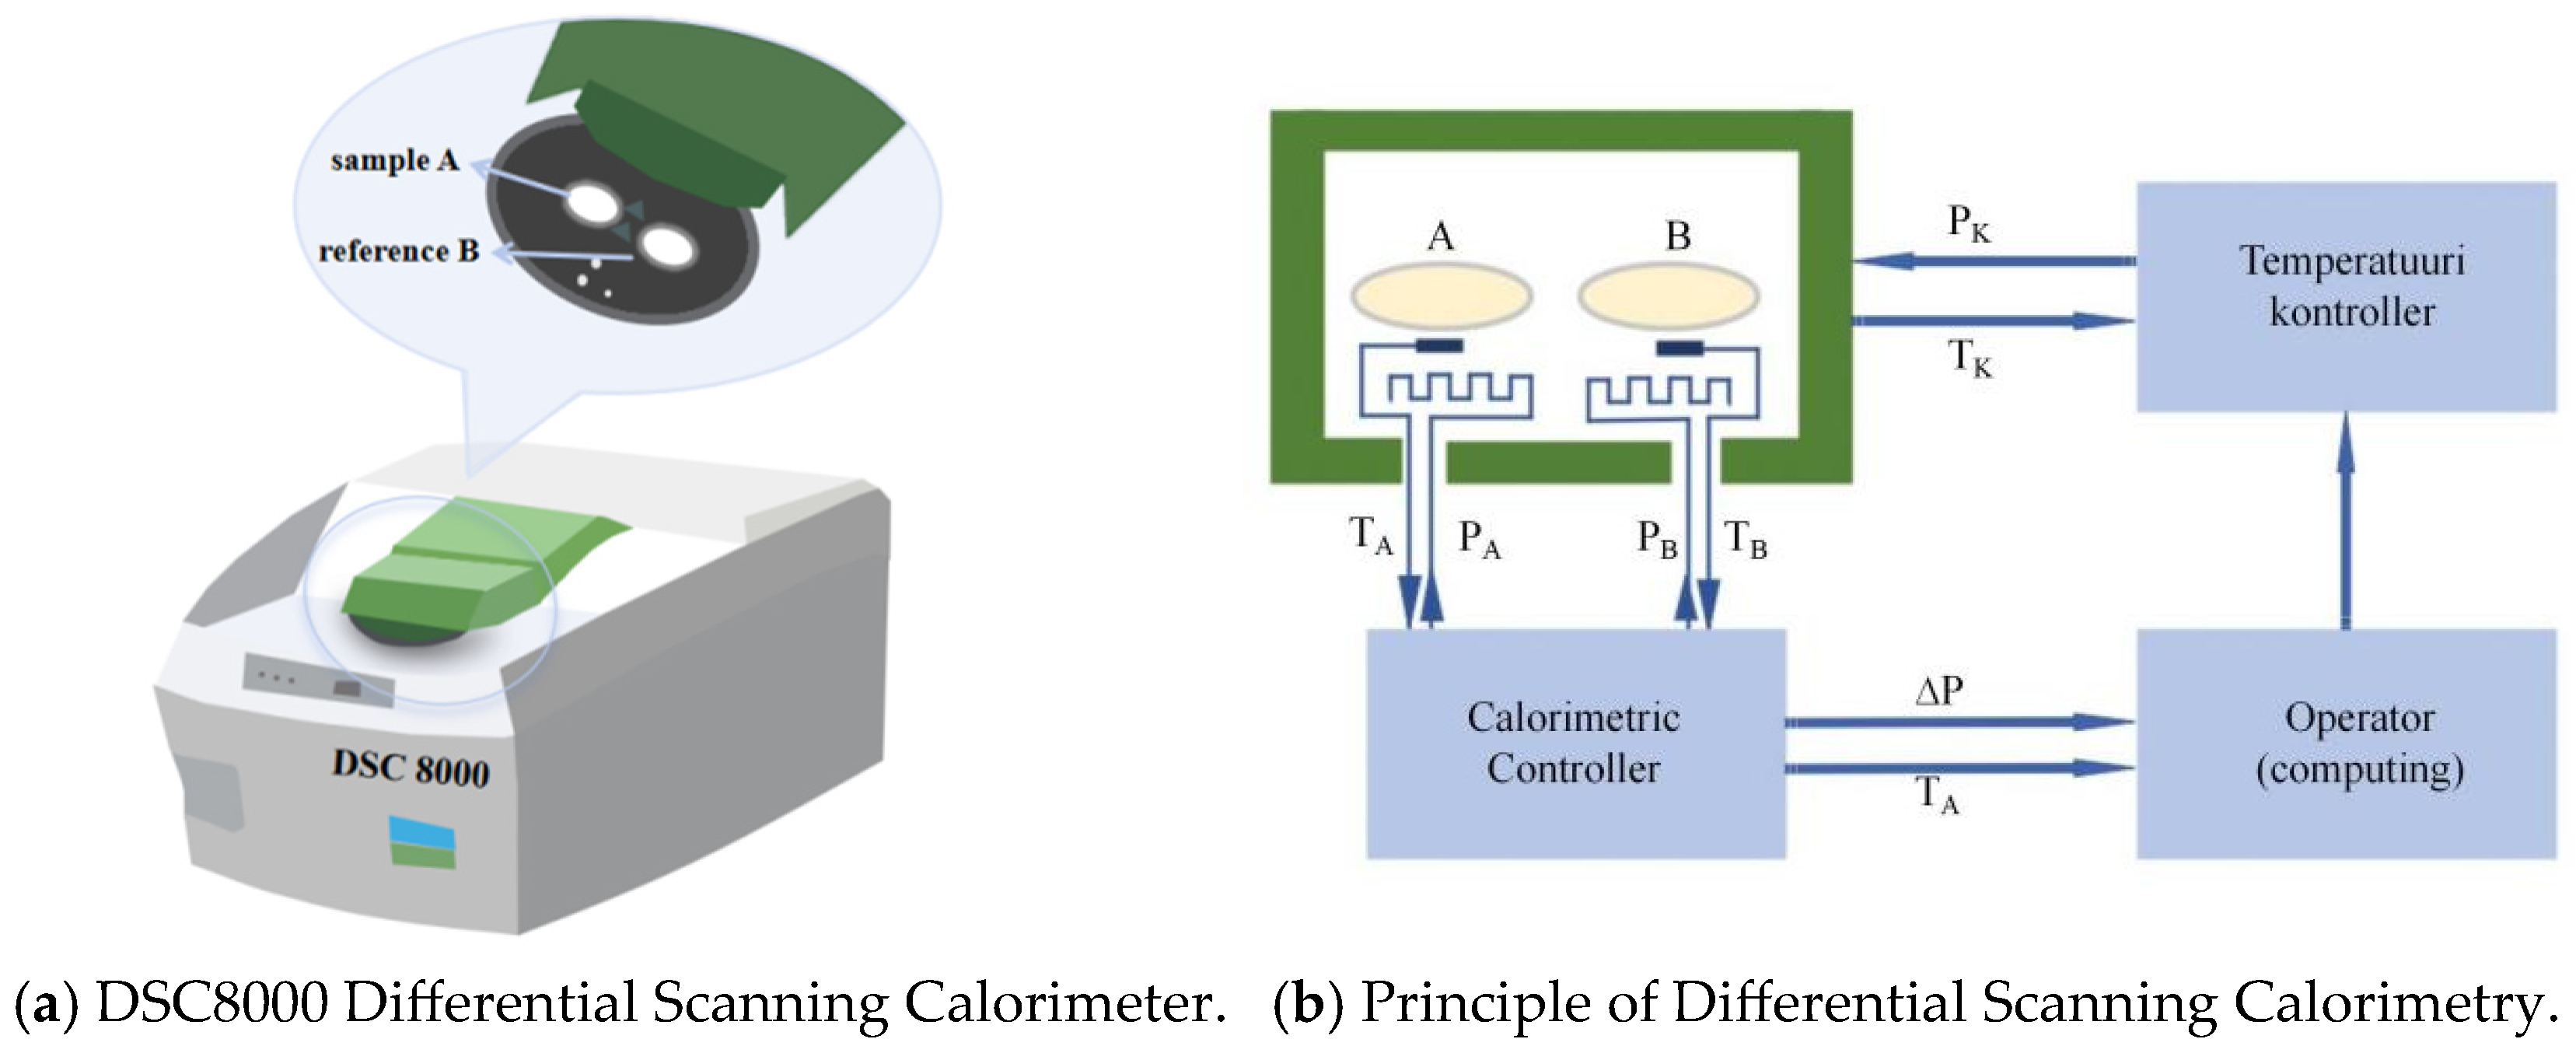
This research employed a DSC8000 Differential Scanning Calorimeter (Shanghai, China) featuring a cooling mechanism to analyze the thermal properties of soil. The instrument operates effectively across a broad temperature spectrum, from −180 to 750 °C, with a scanning rate set at 100 points per second. As shown in
Figure 1a, the DSC8000 employs dual-furnace technology and a power-compensation principle, enabling direct measurement of the heat flow between two independent furnaces. This design is vital for obtaining the soil’s thermal response during freezing and thawing.
The Tzero™ technology (PerkinElmer, Sheltonwas, CT, USA) utilized to precisely determine the temperature disparity between the sample and the reference using a temperature probe, as shown in
Figure 1b. The experiment involved two identical sample containers (aluminum pans), where container A held the soil sample to be tested, while container B was empty. These containers were placed in two calorimetric cells to assess the temperature variation between the sample and the reference, capable of changing their temperatures at a constant rate. The temperature controller regulated the environmental temperature control power P
k and the experimental environmental temperature T
k. The presence of the sample in container A caused a temperature difference between containers A and B. During the heating process, due to the difference in specific heat capacity, the temperature of container A (T
A) lagged behind that of container B (T
B). To compensate for this temperature difference, the calorimeter control unit provided additional power g to the heater in container A. This power change g was recorded by the computer and formed a heat-flow signal as a function of sample temperature. Specifically, phase transitions occurring in container A, such as the endothermic process during ice melting, led to an increase in g, which appeared as a peak in the heat-flow diagram.
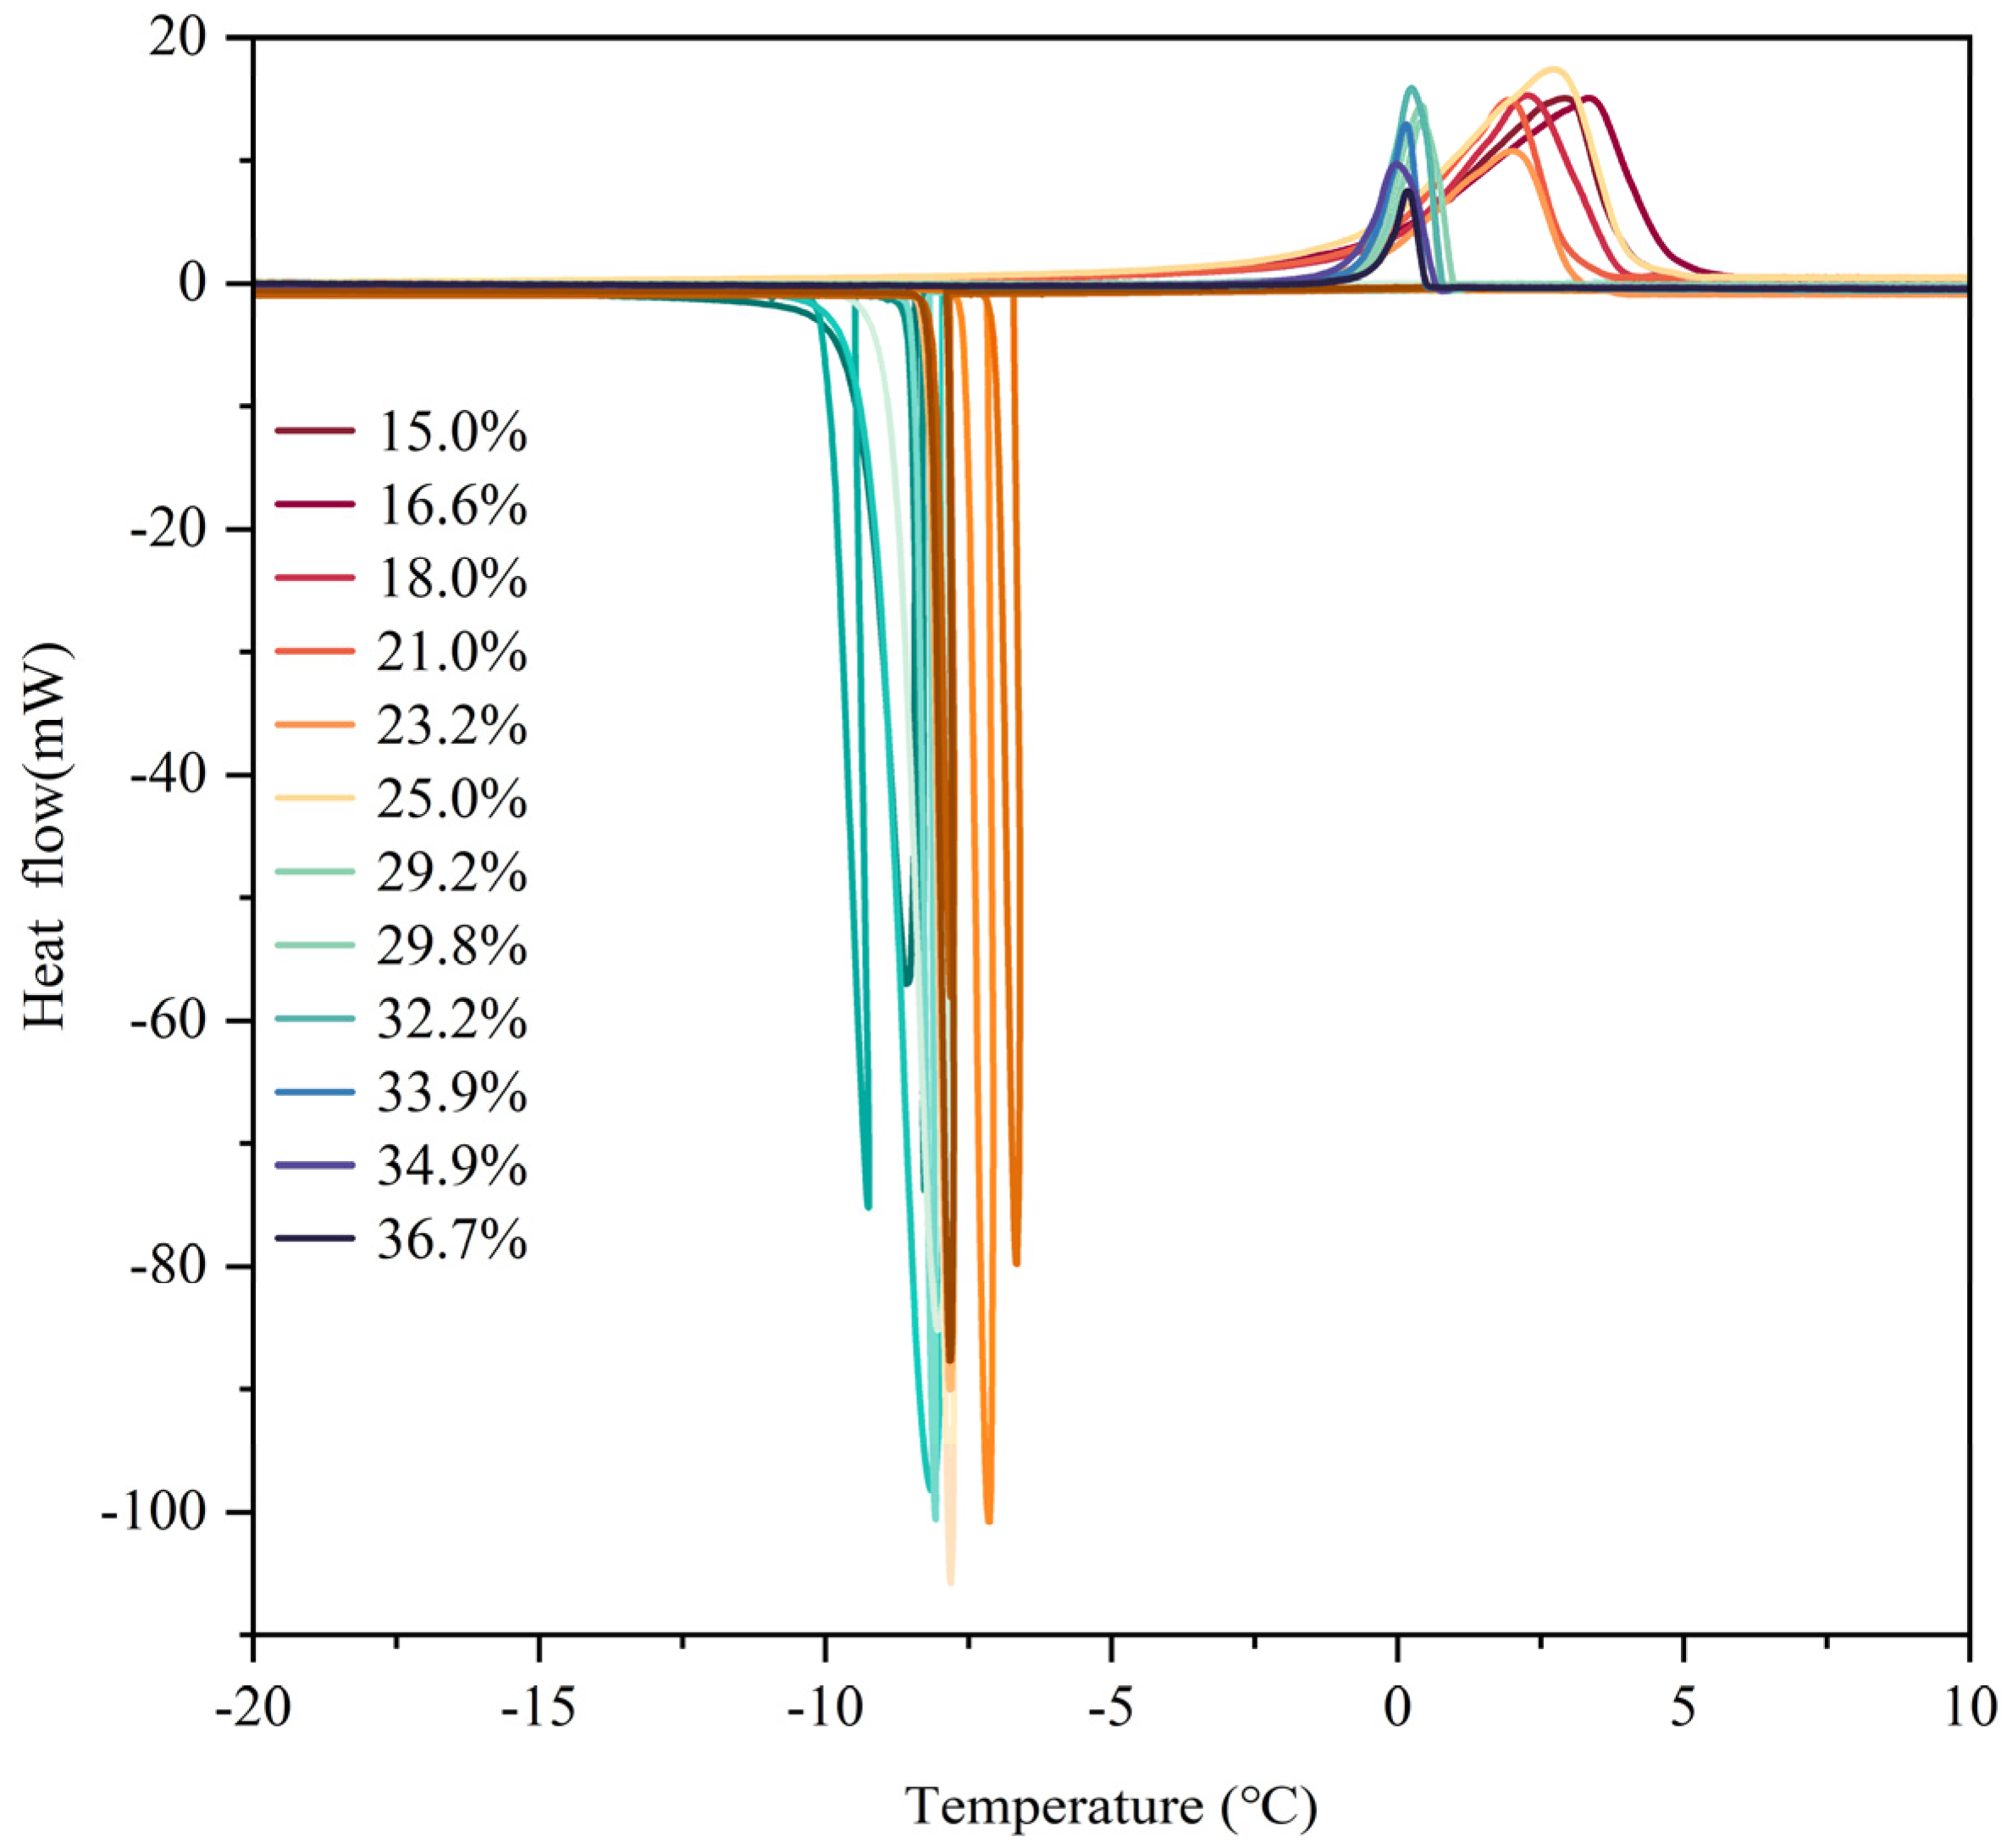
Differential Scanning Calorimetry (DSC) can record the heat-flow rate or heat-flow data of the enthalpy changes of a sample over a certain period [
32]. The program can record real-time heat-flow–time curves or heat-flow–temperature curves. Following the acquisition of the heat-flow–time curve from the instrument’s response, the area of the peak can be obtained by assimilating the heat-flow–time curve throughout the phase-change duration from
t1 to
t2. This region indicates the overall heat variation of the soil sample throughout the temperature loading phase. Then, by dividing the calculated heat value by the sample mass, the enthalpy change curve of the freezing or melting process with temperature can be obtained. The heat-flow signal was recorded by DSC. During the freeze–thaw process, the latent heat of frozen soil was used to determine its unfrozen water content.
In Equation (1),
TR denotes the reference temperature, °C; is the sample temperature, °C;
T represents the temperature along the curve’s horizontal axis, °C;
t is the time on the horizontal axis of the curve, s;
V is the manually set heating or cooling rate, °C/s.
Equation (2) represents the heat transfer value on the time–heat-flow graph, mW; ΔH is the peak area or the heat change produced by the phase change of the sample from t1 to t2, mJ.
In accordance with the energy conservation principle, the amount of heat absorbed or released during a phase change is proportional to the quantity of the material experiencing the phase transition. The enthalpy change (Δ
H) of the samples during freezing and thawing was measured using the DSC technique, and the amount of water or ice that experienced a phase change was determined by dividing the change in enthalpy by the latent heat associated with the phase transition, allowing us to assess the fluctuations in unfrozen water content within the samples. At a temperature of
T, the relationship is given by:
In Equation (3), Δm is the mass of water or ice undergoing phase change, g; ΔH is the actual heat effect produced by the phase change, J; L represents the latent heat of phase transition between ice and water, J/g.
The unfrozen water content was calculated by subtracting the ice content from the total water content:
In Equation (4), ms is the soil sample mass; wu represents the unfrozen water content; w0 denotes the initial water content.
2.2. Experimental Methods
In this study, the roadbed soil of the K161 + 300-K161 + 550 section of Beian to Heihe Expressway in China was selected, and the K161 + 440 section was chosen as the research object, and 5 survey holes were set up for sampling. The soil quality was powdery clay, and this section was located in the Little Xing’anling Terrace-like hilly area, which belongs to the tectonic and denuding hilly geomorphic area, and the permafrost was buried under the ground for many years.
The soil samples utilized in the experiment were silt loam, having a plastic limit water content of 19.5%, a liquid limit water content of 32.7%, and an ideal water content of 15.5%, with a maximum dry density of 1.86 g/cm3. The soil was remolded and sieved through a 0.075 mm sieve. The relative content of each particle group was determined by the hydrometer method. In the silt loam sample, the clay content (particles smaller than 0.05 mm) was 67.21%, and the volume-weighted average diameter of the sample was 0.0235 mm.
In this experiment, DSC froze and thawed samples at 0.5 K/min, recording the changes in temperature and heat flow to obtain the thermal data on characteristics during the freeze–thaw processes. The freezing process temperature was set at 15 °C~−20 °C; the melting process temperature was set at −20 °C~15 °C. The experimental steps were as follows:
- (1)
The soil sample, sifted through a 0.075 mm sieve, was poured into a tray, placed in a 105 °C oven for 24 h, and then removed after drying.
- (2)
The dried soil sample was spread evenly in a soil conditioning tray. The mass of added water was calculated from the required water content and the soil sample mass for specimen preparation. The sample was allowed to rest for 24 h before re-sampling.
- (3)
The standard volume of the sample container was a 50 mg aluminum crucible. The mass of the empty aluminum crucible was measured on an electronic balance with 0.0001 g precision. A small sample portion was cut and uniformly spread into the aluminum crucible. After weighing its mass, the mass of the soil particles
ms was calculated. The sample dish and the control dish were then placed into the Differential Scanning Calorimeter together. The software set the experimental temperature program, with the parameters in
Table 1.
4. Development and Verification of Frozen Soil Temperature–Unfrozen Water Content Model
4.1. Analysis of Unfrozen Water Variations in Freeze–Thaw Cycles
In accordance with the first and second thermodynamics laws, the heat balance and energy conservation during the phase-transition process were considered. Heat transfer and latent heat changes during the phase transition are crucial factors in the freeze–thaw process. The latent heat of the phase transition varied with temperature, which is reflected in Equation (5). In view of the connection between the phase-transition latent heat and temperature, the heat change produced by the phase transition was obtained, and the mass of water or ice generated by the phase transition during the freeze–thaw process of the sample was calculated. The latent heat of fusion of ice is known to decrease as temperature drops. According to experimental studies on phase-transition latent heat, the empirical formula to calculate the latent heat of water freezing between −41 °C and 0 °C is as follows:
In Equation (5), L(T) represents the latent heat during the phase transition, J/g; T is the temperature, °C.
The variation in unfrozen water content can be computed through comparing heat variations preceding and succeeding heat content shifts. The amount of water or ice undergoing phase transition can be calculated as the ratio of enthalpy change to the latent heat of phase transition, thereby obtaining the sample’s unfrozen water content change. The relationship at temperature
T is as follows:
In Equation (6), mi is the mass of water or ice undergoing the phase transition, g; Q(Ti) or ΔH is the actual heat effect produced by the phase transition, J; L(Ti) denotes the thermal energy involved in the phase change between ice and water, measured in joules per gram, J/g.
As water in frozen soil was in both liquid and solid states, we used the above equation to calculate the mass of water/ice from phase transition; the unfrozen water content in frozen soil can be divided into the freezing process and the thawing process. The calculation method for the freezing process is as follows:
The calculation formula for water content that remained unfrozen during thawing is as follows:
In Equations (7) and (8), Wu is the unfrozen water content in the soil at temperature, %; W0 is the initial water content, %; Wb is the residual water content after complete freezing, %; ms is dry soil mass (g), g.
4.2. Development and Formulation of the Temperature–Unfrozen Water Content Model for Freeze–Thaw Cycles
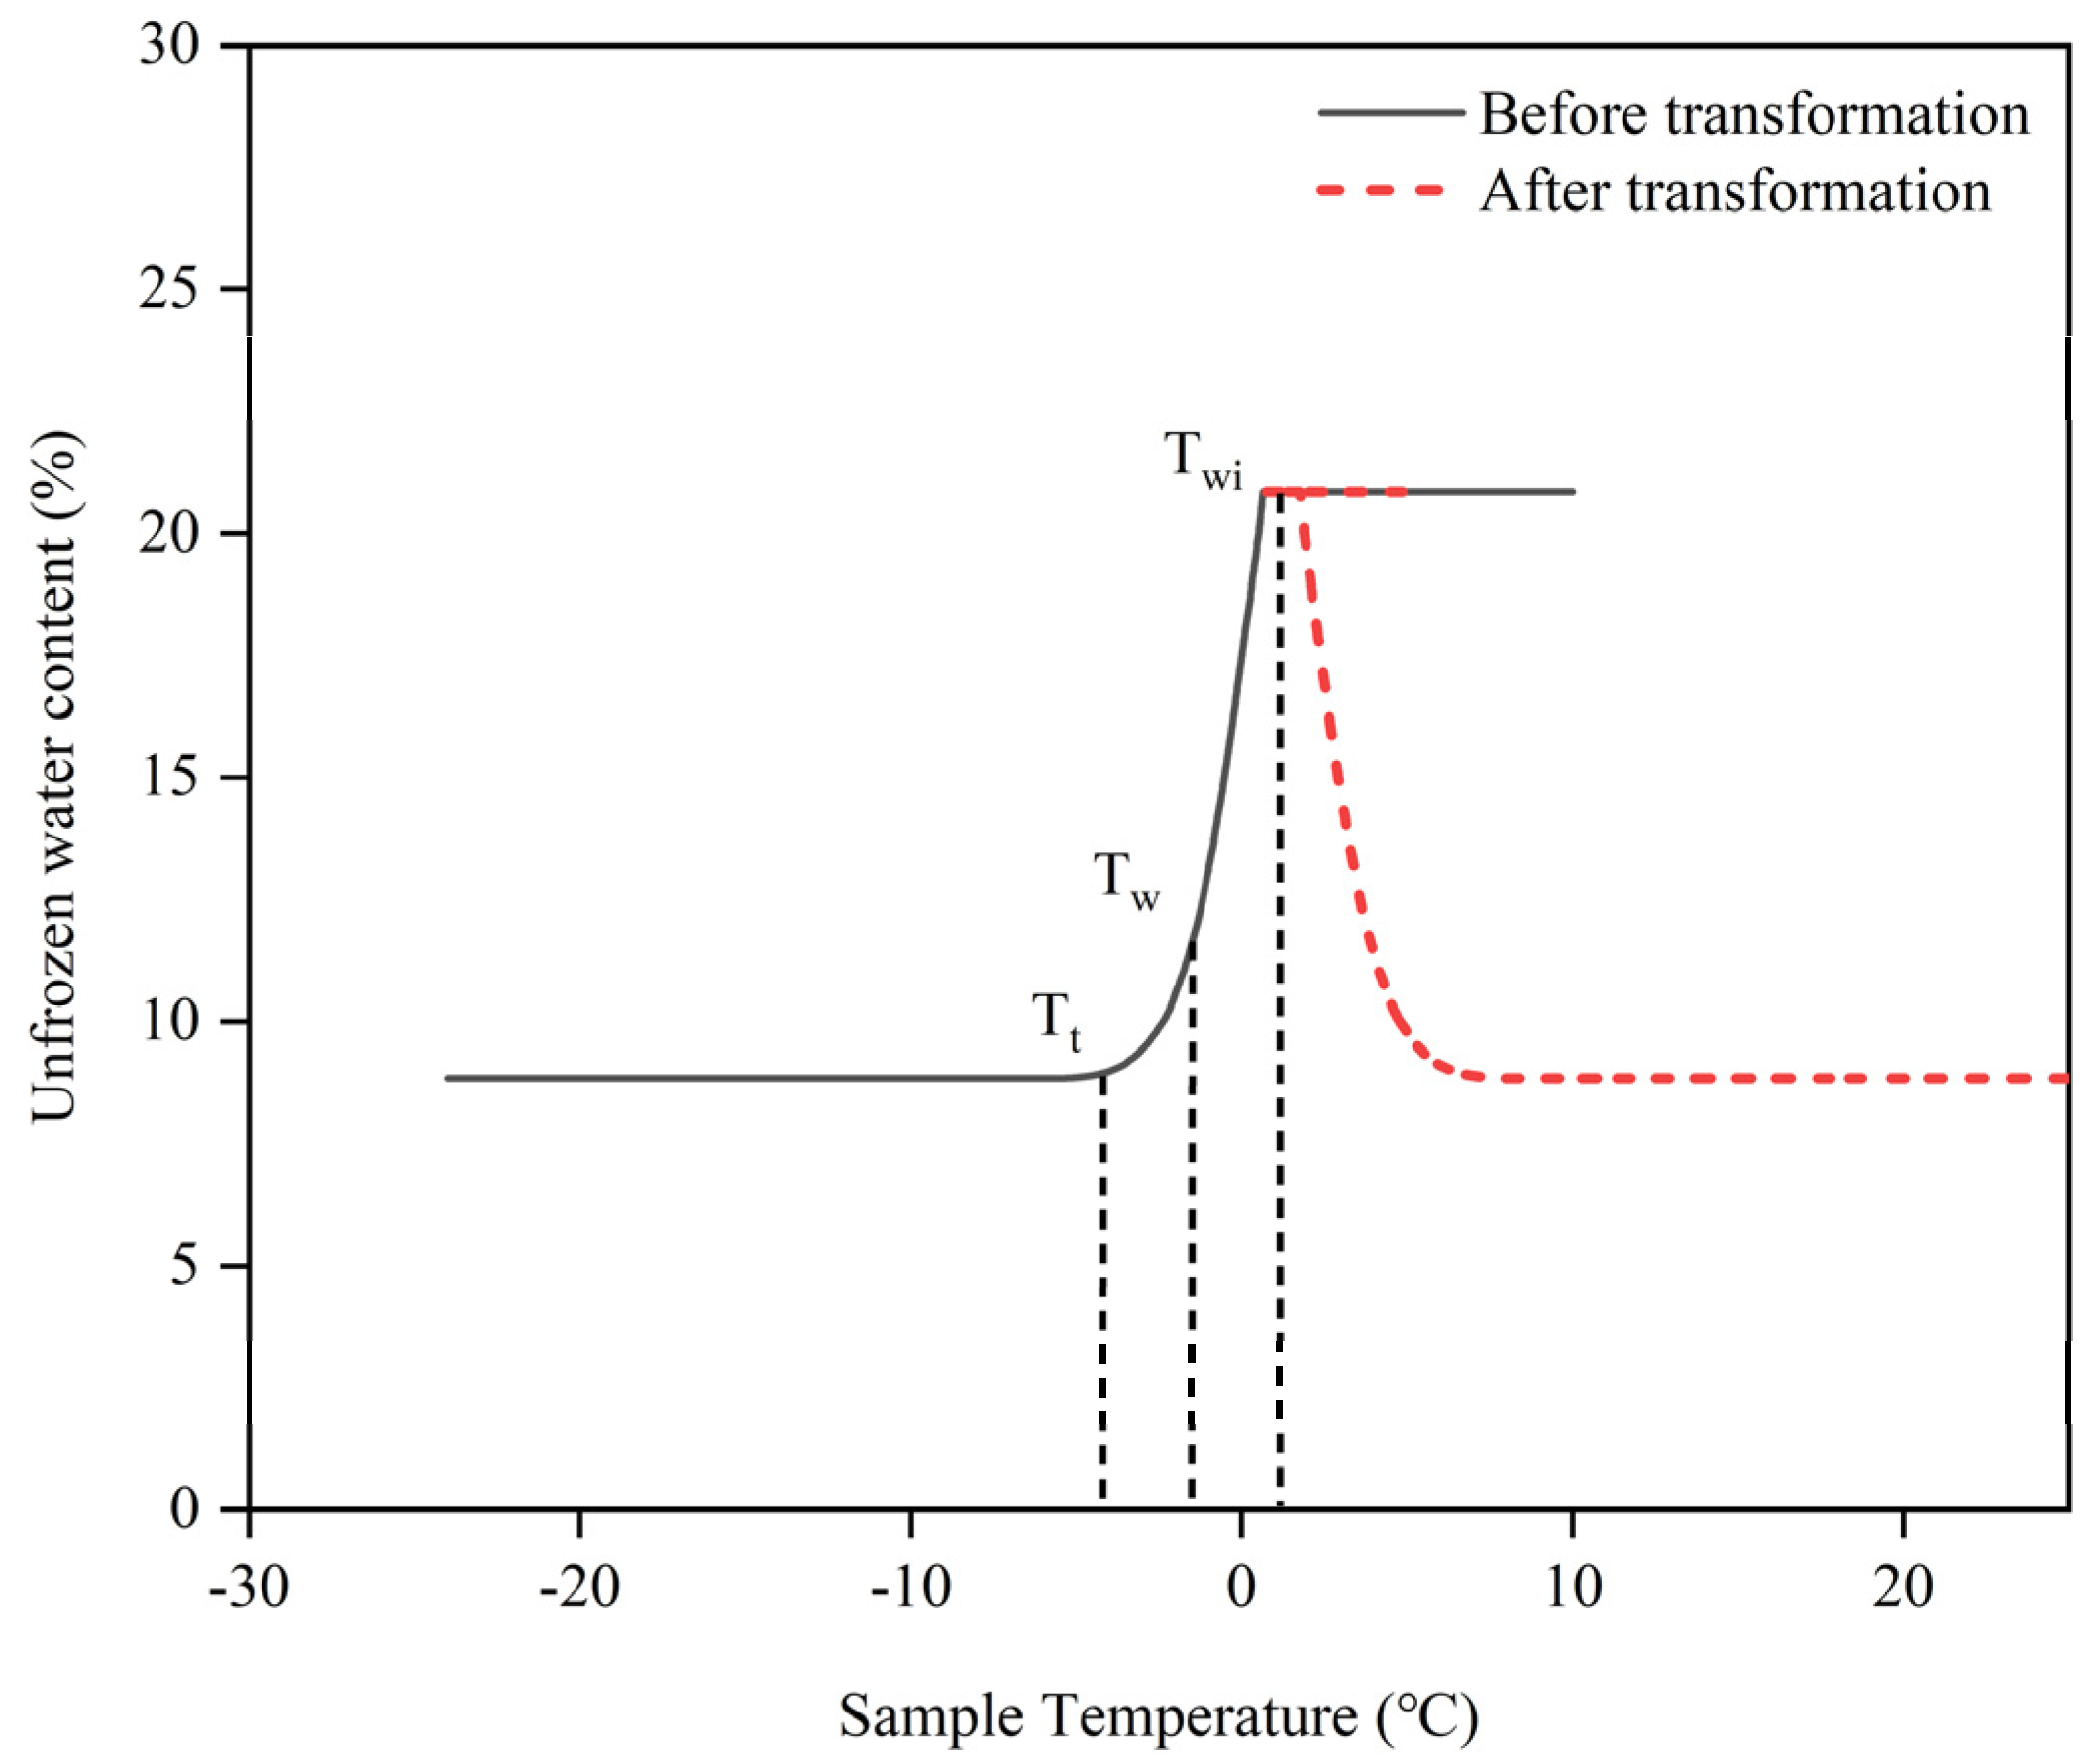
To develop a more accurate mathematical model depicting the unfrozen water content–temperature relationship in frozen soil, a transformation of the temperature–unfrozen water content relationship curve was performed. The unfrozen water content curve was shifted along the temperature axis by
Twi + 1 units in the negative direction. This transformation allowed us to fit the unfrozen water content curve with a power function, revealing the non-linear unfrozen water content–temperature relationship. First, the horizontal coordinate of the unfrozen water content image during the thawing process was transformed using Equation (9), and the transformed image is shown in
Figure 6. The key parameters of the soil sample were ascertained, including the soil sample’s starting water content
w, the unfrozen water content
wc at the interface of the transition zone and the intense phase-transition zone, and the constant unfrozen water content
wu at subzero temperatures, the complete thawing temperature
Twi of the frozen soil, and the temperature
Tt at which the unfrozen water content was stable at negative temperatures.
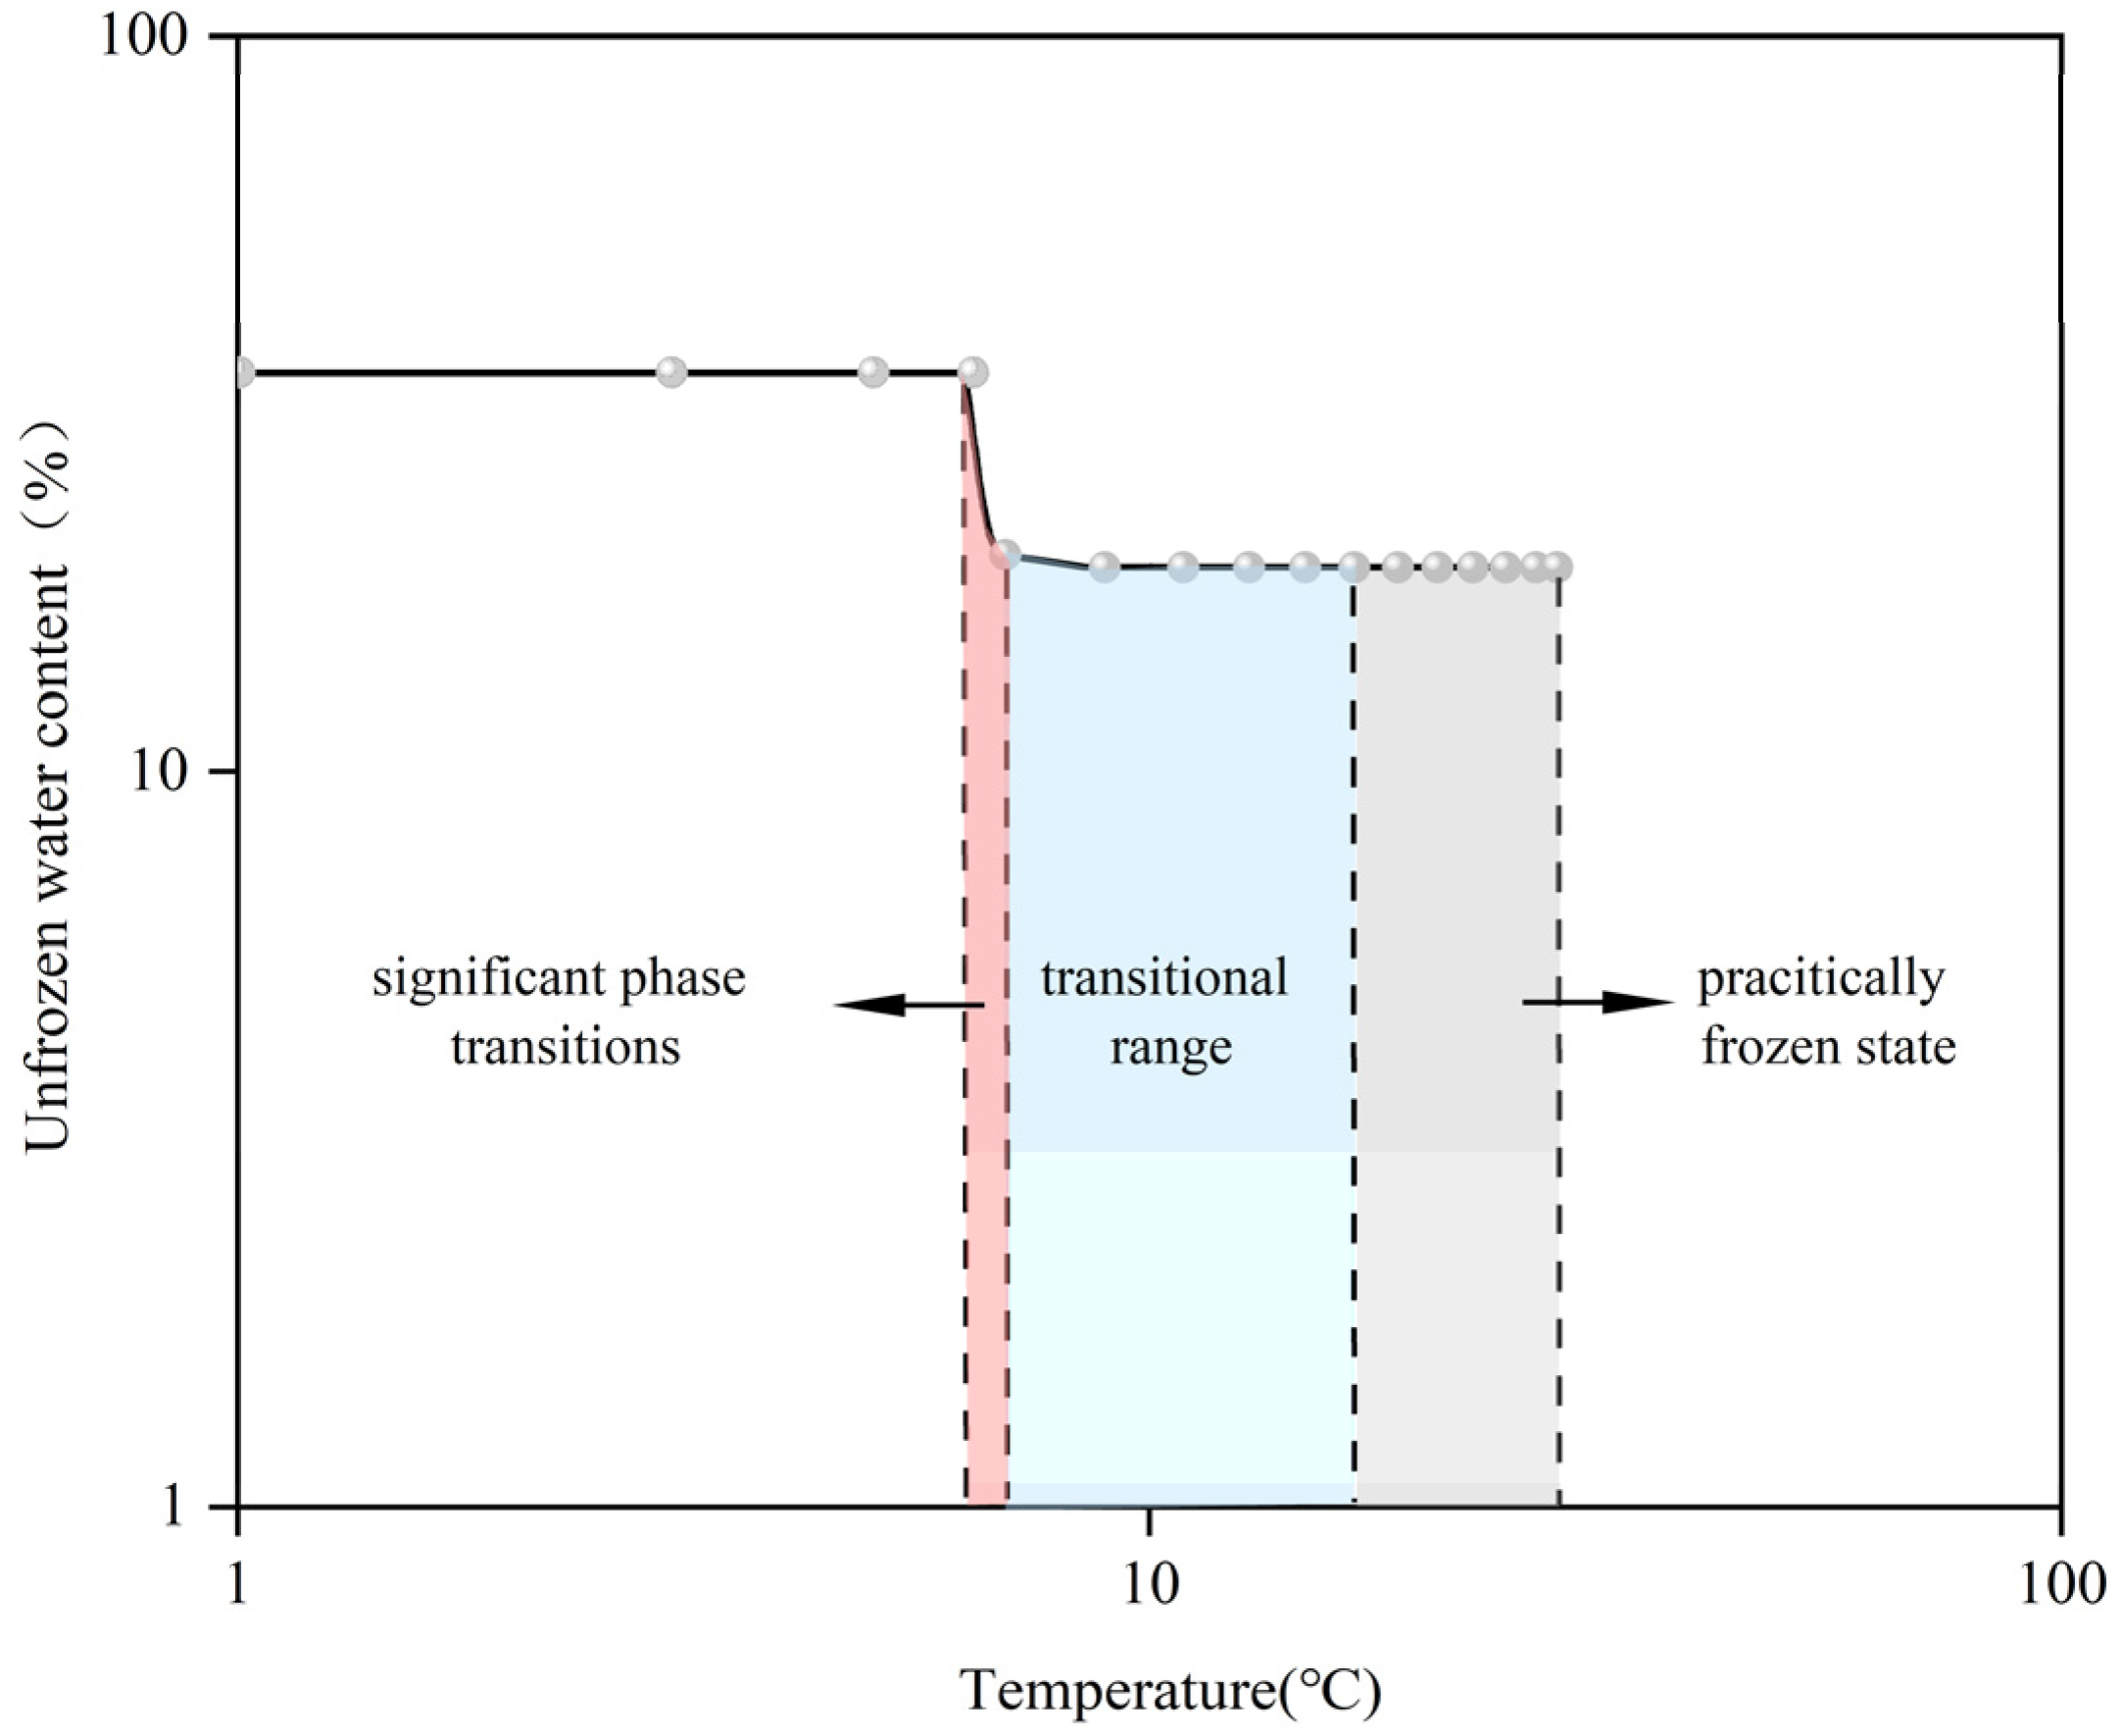
The unfrozen water content curve in
Figure 6 was transformed into a logarithmic coordinate system, resulting in
Figure 7. The analysis indicates that, throughout the freezing and thawing procedures, the connection between the unfrozen water content and temperature demonstrated diverse linear correlations within various temperature brackets:
The data on temperature and liquid water content were transformed into logarithmic coordinates. This transformation helped to reveal the underlying linear relationships of variations in the amount of unfrozen water across various temperature intervals. In the region of intense phase transition, there was a sharp decline in unfrozen water content with falling temperatures. In logarithmic coordinates, this zone may appear as a steep slope, indicating that the content of unfrozen water is particularly sensitive to temperature modifications within this zone. In the transition zone, the curve may appear as a linear segment with a smaller slope in logarithmic coordinates, indicating the rate at which the unfrozen water content changes with temperature is reduced compared to the intense phase-transition zone, but a certain linear relationship still exists. In the completely frozen area, the variation in unfrozen water content typically stabilizes, which may appear as an almost horizontal line in logarithmic coordinates, indicating that the unfrozen water content remains largely unaffected by temperature variations within this range.
During the thawing process, a mathematical model of the connection between unfrozen water content and temperature was defined in segments, and the model parameters for positive temperature thawing were calculated. In the temperature interval of the intense phase-transition area, characterized by a rapid variation in unfrozen water content, the model parameters are represented as:
In the transition zone of unfrozen water content variations, we incorporated new model parameters to more precisely depict the link between unfrozen water content and temperature. These parameters, considering the thermophysical traits and pore structure of the soil, can detect the nuanced alterations in unfrozen water content in the transition area.
The model for the relationship between temperature and unfrozen water content during the frozen soil thawing process is as follows:
To ensure the continuity of the data after logarithmic transformation, the image was shifted one unit in the negative temperature direction. The purpose of this transformation was to better represent the data in the logarithmic coordinate system, especially when addressing the influence of temperature variations on the amount of unfrozen water. During freezing, the unfrozen water image was transformed according to Equation (14), and the transformed image is shown in
Figure 8. The temperature coordinate was logarithmically transformed, and a power function was used for fitting. The unfrozen water content at the boundary between the transition zone and the intense phase-transition zone during the freezing process is
wce, the stable unfrozen water content at negative temperatures is
wmi, and the temperature at which freezing begins is
Tm;
Tce is the temperature that separates the intense phase-transition zone from the transition zone, and the demarcation temperature indicating the transition from the intermediate zone to the completely frozen zone is
Tmi. The modification in unfrozen water content crossed the intense phase conversion zone, the phase shift zone, and the completely frozen zone in turn.
Through an in-depth analysis of the relationship between unfrozen water content and temperature, we have established a more comprehensive model that can describe the tendency of variations in the volume of unfrozen moisture when temperatures are below zero. This model not only takes into account linear relationships but also incorporates non-linear factors to more accurately display the evolution of the measure of unfrozen water within the freezing process.
In the course of freezing, the model parameters for the unfrozen water content in the intense phase-transition zone are as follows:
The parameters of the slope model for the stable phase of unfrozen water content in the freezing process are as follows:
After rearrangement, the temperature–unfrozen water reserve model for the freezing process of frozen soil is stated below:
4.3. Validation of the Frozen Soil Temperature–Unfrozen Water Content Model
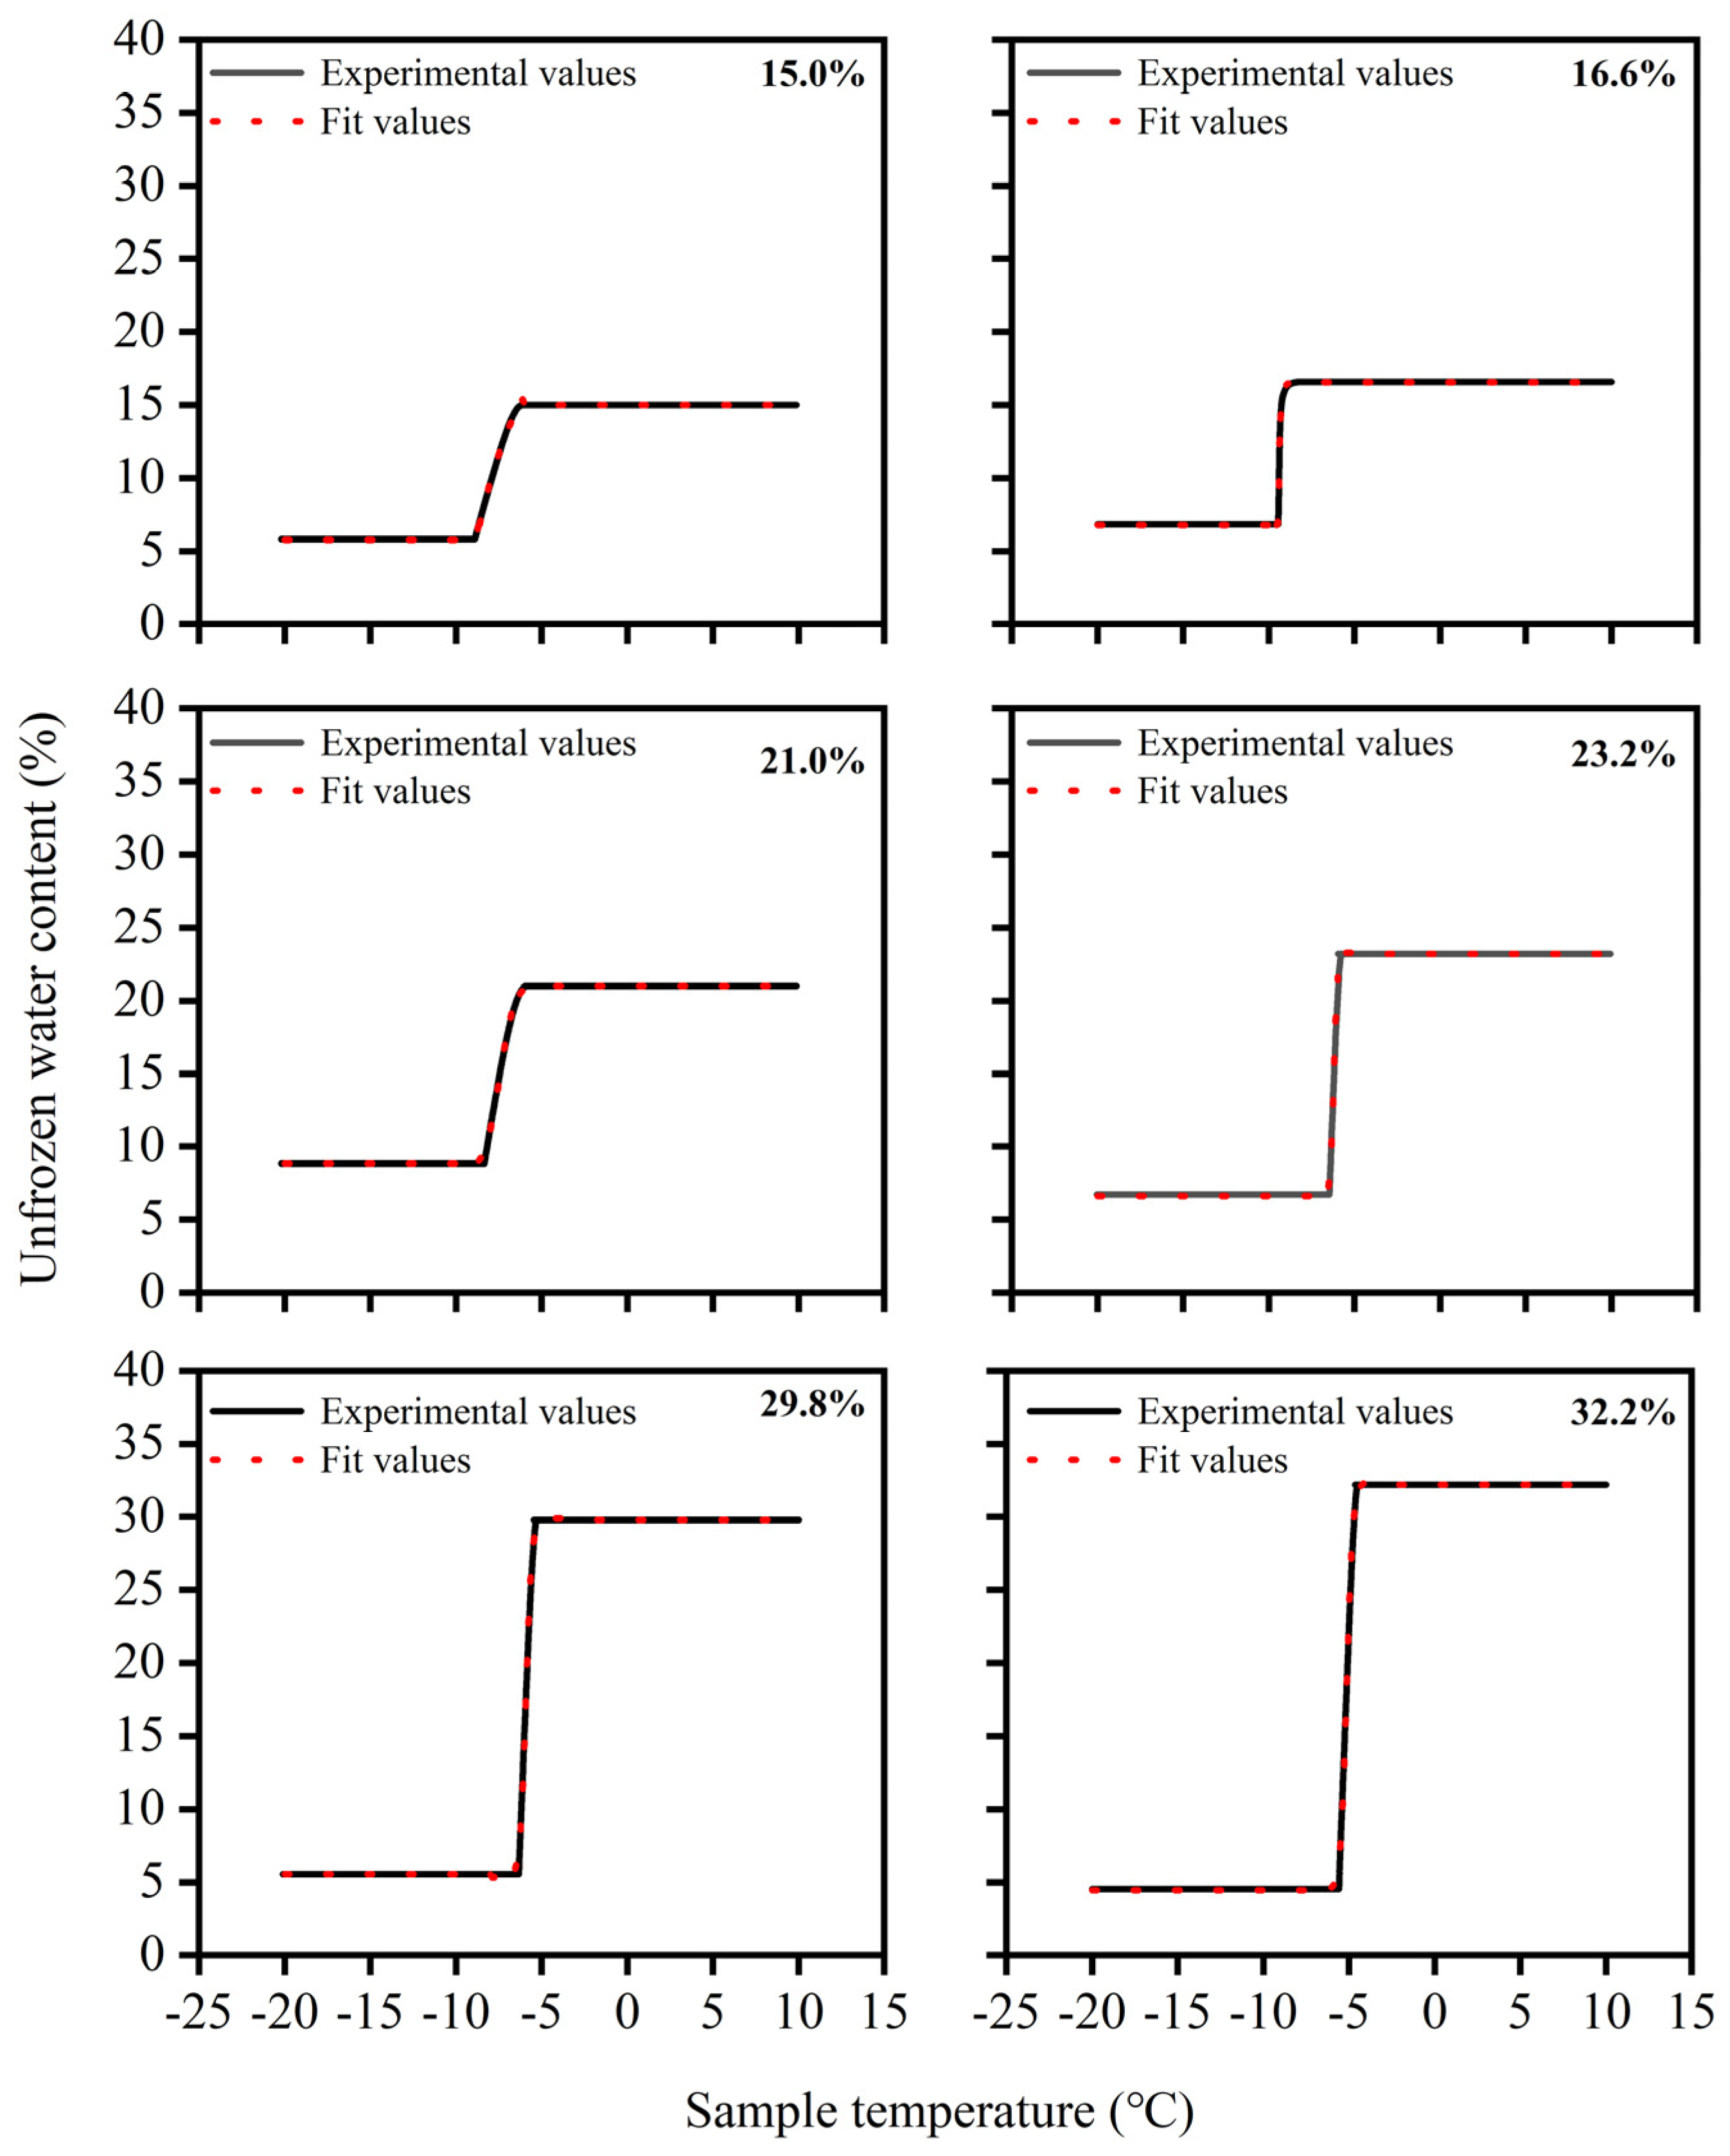
Six soil samples with varying initial water contents from the experiments were chosen for calculation, employing the pre-established temperature-of frozen water content model for the thawing process.
Figure 9 displays a comparison between the experimental unfrozen water content values during thawing and the model predictions. This comparison assisted in assessing the model’s correctness and relevance. The temperature–unfrozen water content model categorized the variations in unfrozen water content throughout the thawing procedure into four phases: the intense phase-transition zone, the transitional zone, the fully frozen region, and the completely thawed area. It generally fit the intense modification zone and the change interval, so the selection of temperatures within these intervals significantly affected the precision of model fitting.
In the transition zone, the model fitting performed well, but there was some error within the scope of temperatures experiencing intense phase changes. There was a pronounced relationship between this and the soil samples’ pore network. After undergoing the freezing process, the pore structure of the soil samples may undergo minor changes. Because of the expansion in volume of pore water upon freezing, small pores may decrease while larger pores increase. Therefore, during the thawing of the soil samples, with less ice in small pores, the process of transitioning between phases occurs at a slower rate. This strengthens the unfrozen water content–temperature change pattern in the transition segment, improving model fitting accuracy.
Correspondingly, using the temperature–unfrozen water content model for the freezing process, six soil samples with varying initial water contents from the experiments were chosen for fitting. The correlation between the model fitting outcomes and experimental assessments is illustrated in
Figure 10. The temperature–unfrozen water content model had a more precise fit during the freezing process’s intense phase-transition stage; nevertheless, the model’s computed figures were not entirely precise in the transition stage. The fitting accuracy of the freezing process model was affected by two factors: the connection between the arrangement of pores in soil and the supercooling response. Regarding pore structure influence, on the one hand, the soil samples contained a small amount of water in large pores, which led to concentrated phase transitions, while a larger amount of water in small pores led to dispersed phase transitions. After freezing, the pore structure may change, with small pores decreasing and large pores increasing. This results in less ice content in small pores and a slower phase-transition process. It underscores the connection between temperature shifts and changes in unfrozen water content during the transitional period, resulting in higher model fitting accuracy. In contrast, the supercooling phenomenon has a marked influence on the crystallization process of water in small pores. The freezing temperature of unfrozen water changes in different pores, which leads to certain errors in the calculation of the temperature range in the transition stage. This results in a weaker fitting effect in the transition stage compared to the intense phase-transition stage.
5. Discussion
5.1. Analysis of Model Parameters During Thawing Process
The thawing process was analyzed by examining temperature changes and unfrozen water content in soil samples with varying water levels. Based on unfrozen water content change curves in frozen soil, three phase-transition zones were identified, and the temperature ranges for the fully frozen zone, transition zone, and intense phase-transition zone were determined. The model parameters for the unfrozen water content of clay samples at various water levels during thawing were obtained, and the specific temperature of 2.5 °C was determined for the stabilization of unfrozen water content. The starting water content
W of soil samples and the unfrozen water content
Wc at the interface of the transition zone and the intense phase-transition zone, the stable liquid water content W
u at subzero temperatures, the overall melting temperature
Twi of the frozen ground, and the temperature
Tt, at which the unfrozen water content stabilizes at negative temperatures were determined through experiments or the relevant literature. The constants
k1 and
k2 were computed by inserting the parameters into Equations (10) and (11), and the unfrozen water quantity in the thawed condition could be assessed using Equation (13). The values of
k1 and
k2 were calculated, and the curves for unfrozen water content were modeled. The parameters of the fitted model are presented in
Table 2.
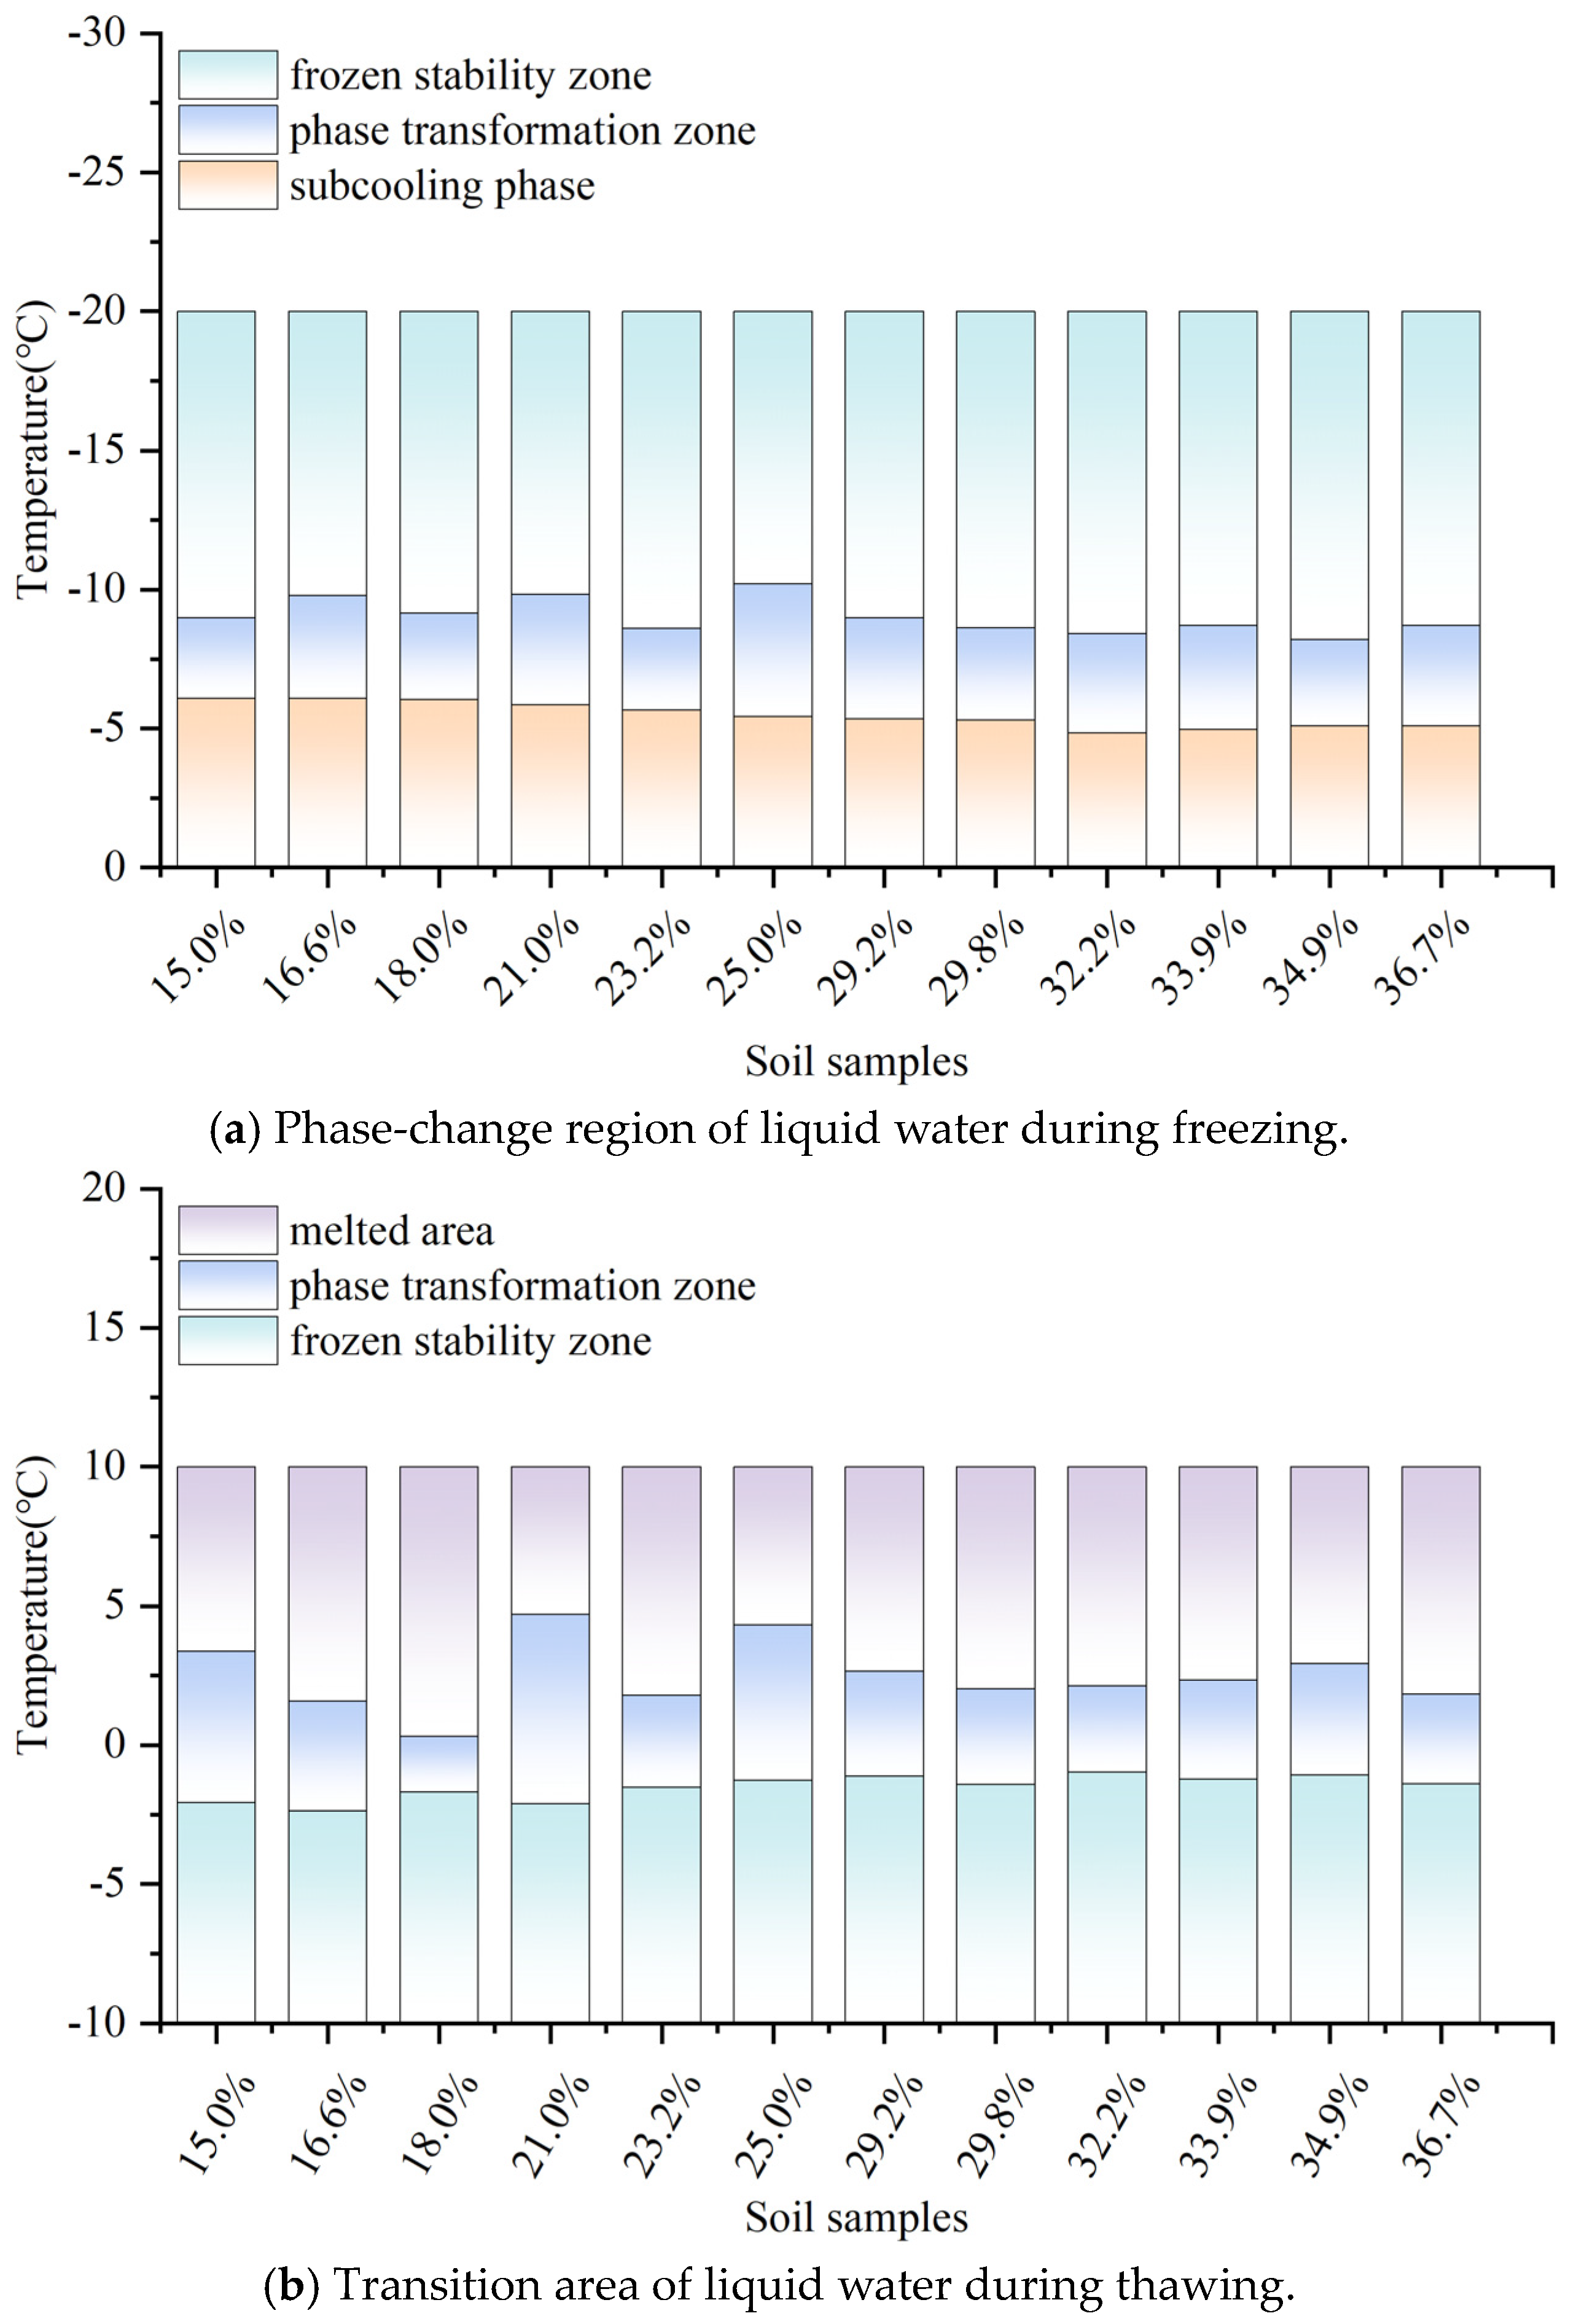
The thawing process involved analyzing temperature variations and unfrozen water content in soil samples with varying moisture levels. The thawing phase-transition process of silt loam in the northeast region had the following characteristics: The thawing temperature of the soil samples was around −1.52 °C, at which the amount of unfrozen water in the soil was the same as the non-freezable unfrozen water amount at approximately 6.34%. This indicates that at this temperature, the soil samples began to undergo ice phase transition, with some of the liquid water beginning to freeze, leading to changes in the unfrozen water content. Between −1.52 °C and −1.31 °C, there was a transition temperature range for the phase transition of unfrozen water, during which trace amounts of ice in the soil pores began to melt. Upon reaching −1.31 °C, there was a 4.79% increase in the content of unfrozen water, indicating that within this temperature range, the ice in the soil’s tiny pores began to thaw, raising the amount of unfrozen water. Across the temperature spectrum from −1.31 °C to 2.5 °C, the ice inside the soil samples underwent an intense phase transition, rapidly melting into water, resulting in the unfrozen water content rising to 98.96% of its original amount. This indicates that within this temperature range, the ice contained within the extensive pores of the soil began to melt, taking in latent heat during this phase change. As a result, a significant portion of the ice converted swiftly into liquid water, causing a notable rise in the amount of water that remained unfrozen.
5.2. Analysis of Model Parameters During Freezing Process
While the soil samples were undergoing the freezing process, an analysis was carried out on the variations in temperature and the amount of unfrozen water within soil samples featuring diverse water contents. Through experiments or by referring to the relevant literature, the initial water content W of the soil samples, the unfrozen water content
Wce at the interface between the transition zone and the intense phase-transition zone, the stable unfrozen water content
Wmi at sub-zero temperatures, and the freezing temperature
Tm were ascertained. The distinct temperature
Tce between the intense phase-transition zone and the transitional phase zone, and the distinct temperature
Tmi between the transitional phase zone and the fully frozen zone, were also recognized. The constants
k3 and
k4 were computed by inserting the parameters into Equations (15) and (16). The unfrozen water content in the frozen state could be estimated by Equation (17). The model parameters for the temperature–unfrozen water content model, obtained from the unfrozen water content curves in the experiments, are shown in
Table 3.
The temperature variations and unfrozen water content during freezing were examined for soil samples with varying water contents. The freeze–thaw process affected the characteristic curve of unfrozen water content, and the freezing and thawing curves differed. When analyzing the freezing process of silt loam from the permanent way, we observed several key phase-transition characteristics:
Firstly, the soil samples’ average freezing temperature was −5.49 °C, which was the critical point at which large pore water began to freeze, resulting in a substantial reduction in unfrozen water content. Between −8.72 °C and −8.66 °C, the unfrozen water content showed little change, indicating that small pore water gradually froze in this range. At −8.72 °C, the unfrozen water content stabilized at around 6.34%, which was the unfrozen water content that could not be frozen, meaning that about 75.9% of the water had already frozen. Therefore, we can consider −8.72 °C as the average fully frozen temperature of the soil samples. With ongoing temperature drops, the content of unfrozen water stayed largely the same.
This study was based on laboratory Differential Scanning Calorimetry (DSC) experiments, which provide a detailed analysis of the thermal properties of frozen soil and the changes in unfrozen water content, as well as the development of a corresponding mathematical model. However, there are certain limitations in this study, particularly the lack of validation through field monitoring data. While the experimental approach allowed for precise control of the experimental conditions and the acquisition of high-quality data, there may be discrepancies between the behavior of frozen soil in a laboratory setting and that in natural conditions. Therefore, integrating field monitoring data is an important direction for future research. By comparing long-term monitoring data from permafrost regions with laboratory data, we can further validate the applicability of the model and optimize its parameters.
5.3. Examination of the Hysteresis Impact of Unfrozen Water Amount and Its Affecting Elements During Freeze–Thaw Cycles
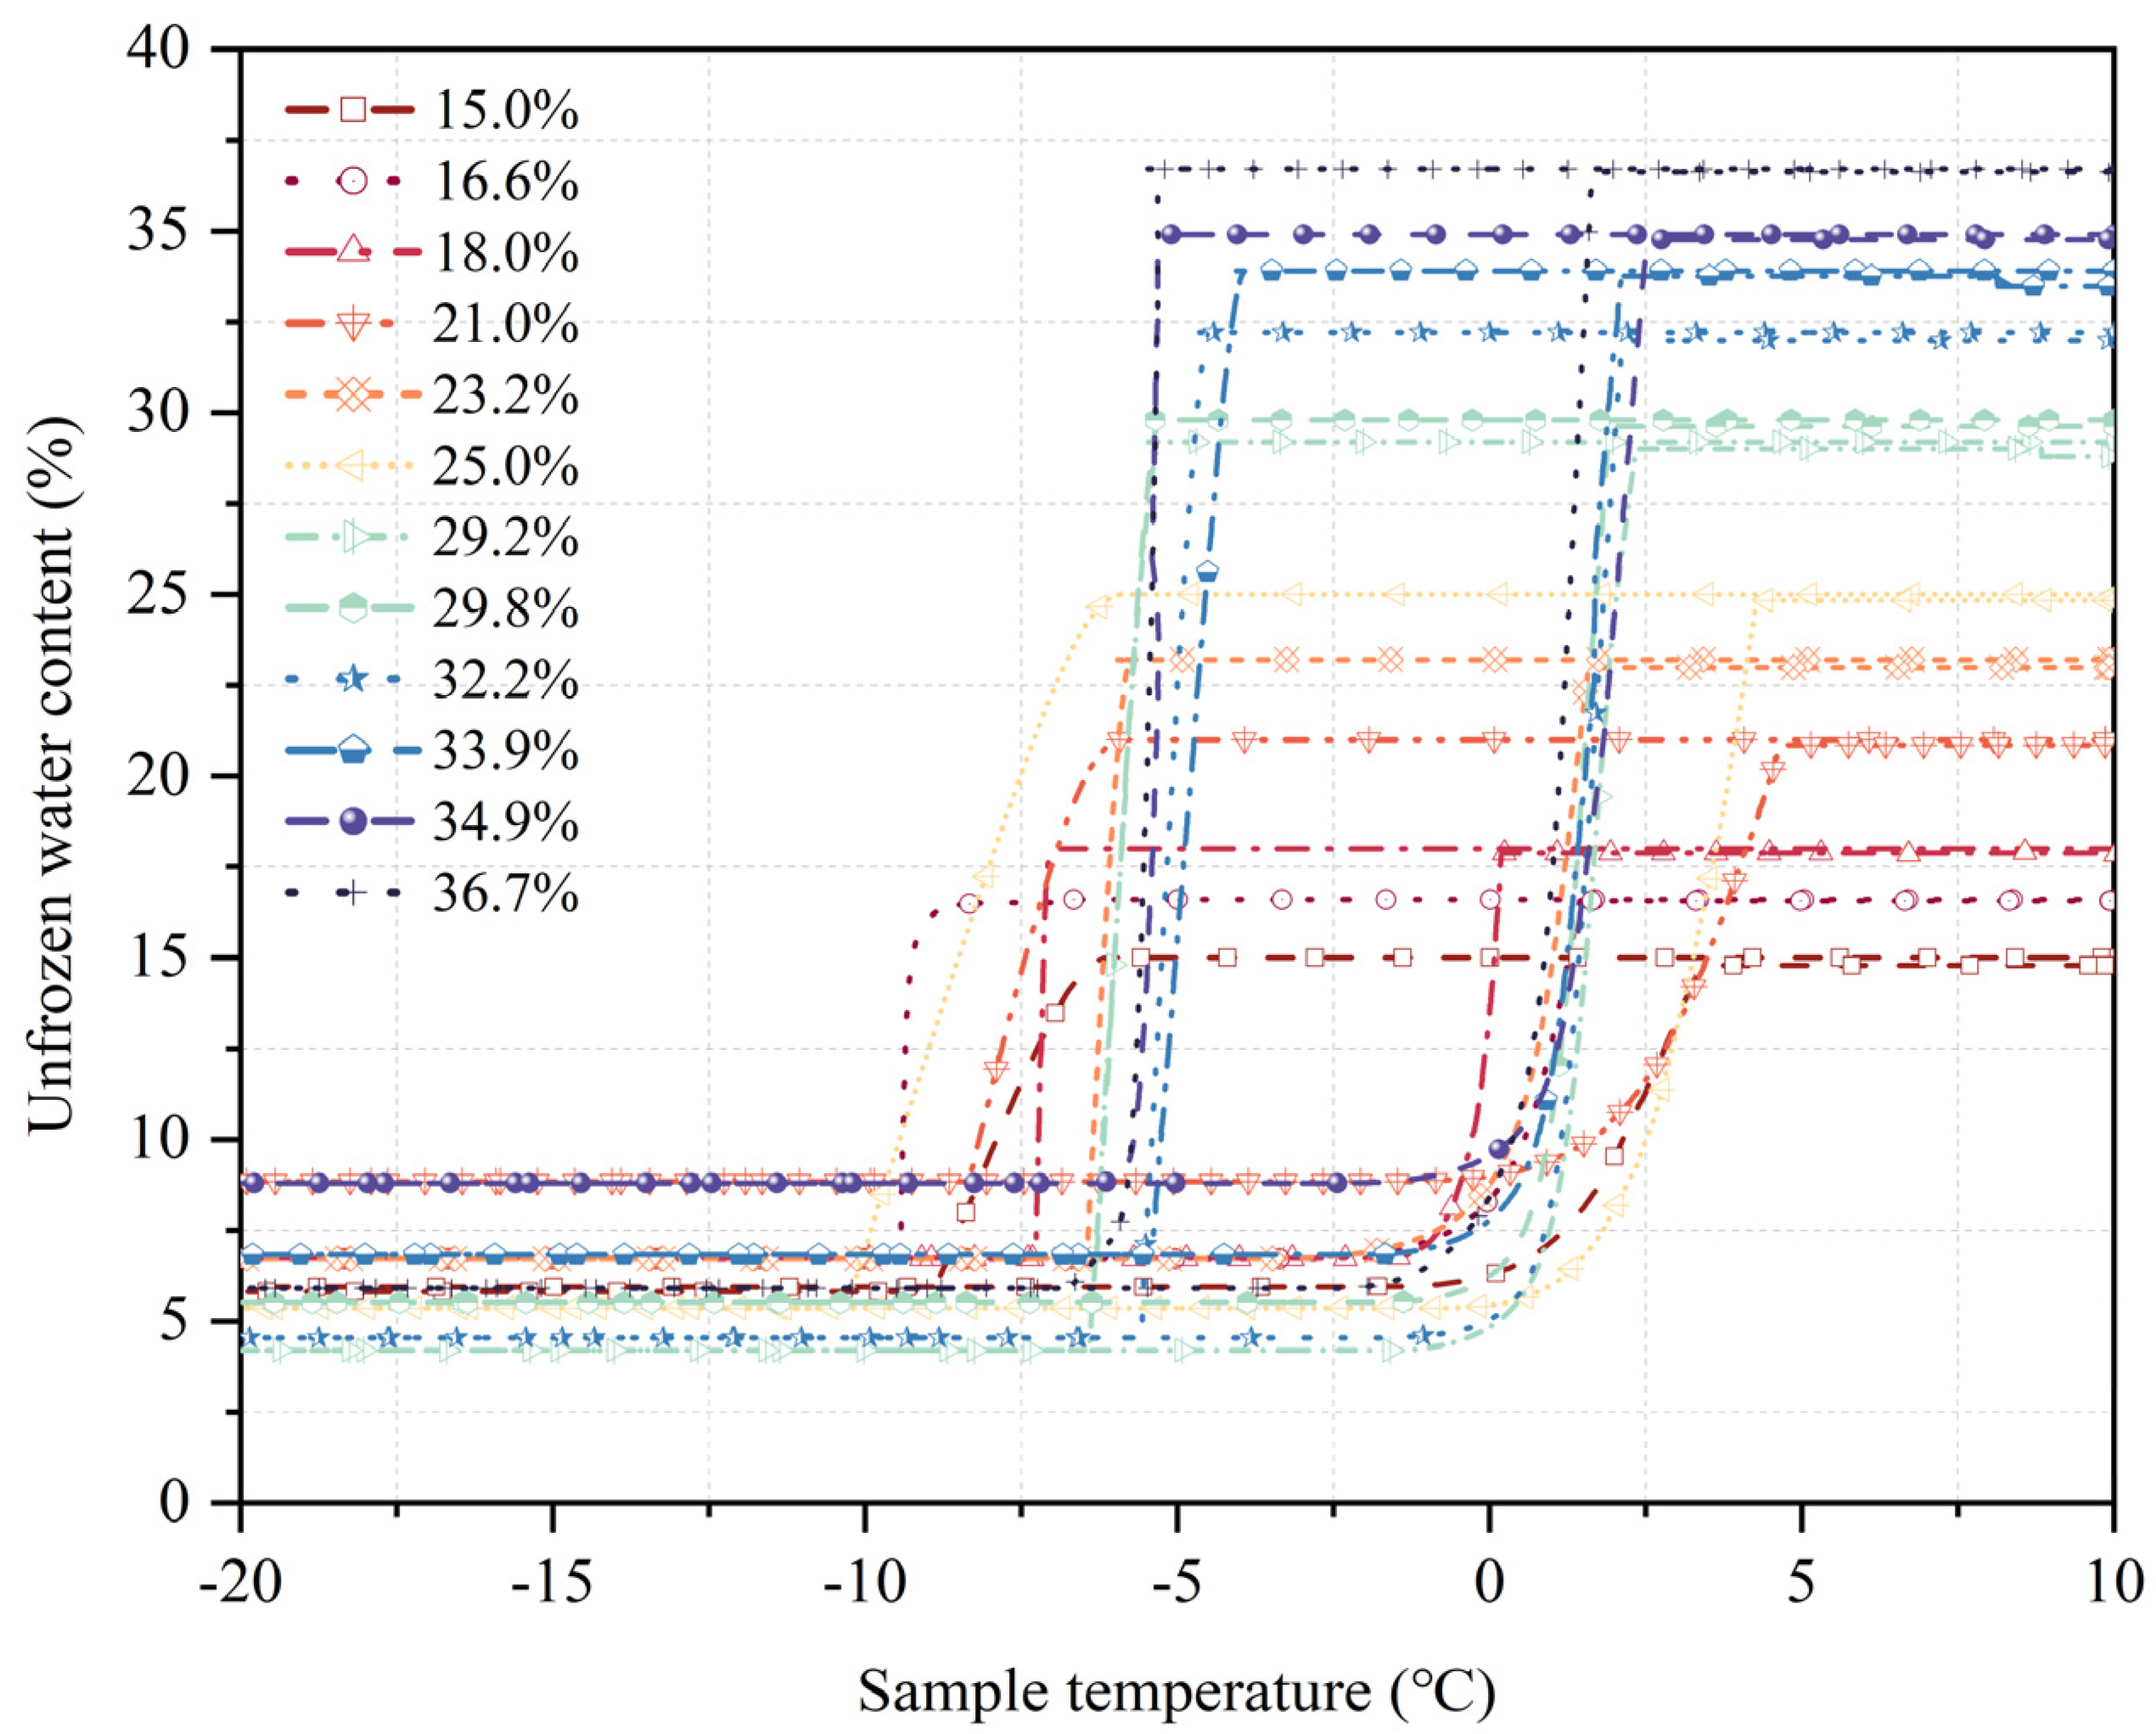
An examination of the variations in the characteristic curves of unfrozen water content throughout the freezing and thawing processes (see
Figure 5) revealed that the temperature range in which unfrozen water content altered during freezing was quite limited. The rate of decrease in unfrozen water content during freezing was generally faster than the rate of increase during thawing, especially in the intense phase-transition stages of both processes. However, within the same experimental temperature range, the decrease in unfrozen water content during freezing was more pronounced than the increase during thawing. This indicates that soil responds differently to temperature changes during freezing and thawing processes, showing a distinct hysteresis phenomenon, which is mainly caused by supercooling and the irregular pore geometry between soil particles. Freeze–thaw cycles significantly altered the size and shape of soil pores, affecting how water moved and the formation mechanisms of ice crystals; this had a direct impact on the distribution of unfrozen water content.
As the temperature rises, the differences between the freezing and thawing curves gradually decreased, especially during the thawing process between −1 °C and 0 °C, where this hysteresis phenomenon was most evident. Moreover, soil with higher initial water content exhibited a more pronounced hysteresis effect during thawing. During freezing, variations in unfrozen water content were concentrated over a narrower temperature span, and the total change was comparable to that during thawing. However, the temperature range for the intense phase transition during freezing was shorter than that during thawing, demonstrating that the decrease in unfrozen water content was especially marked during freezing. Specifically, the overall change in the unfrozen water content during the thawing process was 72.5%, whereas during freezing, it stood at 73.5%. This suggests that the unfrozen water content tends to be marginally reduced during thawing compared to freezing. In the initial cooling stage of the freezing process, the soil experienced supercooling, during which the pore water hardly froze, resulting from the metastable nucleation phenomenon, causing the unfrozen water content to remain temporarily unchanged. In contrast, during thawing, ice crystals in large pores rapidly transformed into water, resulting in a significant rise in unfrozen water content. Despite supercooling, the freezing curve stayed higher than the thawing curve, enhancing the hysteresis effect in freeze–thaw cycles.
Freeze–thaw cycles considerably influence the development of the soil microstructure; especially when there is an increase in the contact area between particles, reconfiguration of the allocation of water content which is not solidified could occur. In freeze–thaw cycles, alterations in adhesion and friction forces between soil particles affect the stability of unfrozen water content and the overall mechanical behavior of the soil. These changes in mechanical behavior may either exacerbate or hinder water migration, thereby influencing changes in unfrozen water content. During freezing, water tends to migrate towards the freezing front, while during thawing, water migrates from the frozen area to the thawed area. This migration pattern can lead to significant variations in the amount of unfrozen water across diverse temperature intervals. For instance, water migration during freezing may cause a rapid decrease regarding the unfrozen water content within a specific temperature span, while during thawing, water migration has the potential to cause a sudden surge in the presence of unfrozen water across a spectrum of temperatures. This dynamic change in water migration is also an important factor causing the persistence effect in the levels of unfrozen water during freeze–thaw cycles. These research findings are crucial for understanding the thermal response and hydrological behavior of frozen soil, revealing new findings on the heat responses of frozen soil during the freeze–thaw cycle and having important guiding significance for design and construction in frozen soil regions. Future research can further explore how these factors collectively influence the thermo-hydrological characteristics of frozen soil, as well as methods of predicting and calculating these characteristic indicators via experiments and models.


