1. Introduction
Water infrastructure is fundamental to achieving sustainable development, providing essential services such as flood control, water resource management, agricultural irrigation, energy production, and environmental protection [
1,
2]. However, the sector faces persistent challenges, particularly the difficulty in securing adequate funding due to the large scale of required investments, long investment cycles, and relatively low financial returns. Insufficient investment or lack of maintenance funding leads to aging infrastructure and reduced operational efficiency, which in turn diminishes its social and economic benefits. This underinvestment creates a vicious cycle, limiting both the expansion and sustainability of water infrastructure projects. To address this issue, it is critical to explore innovative solutions that enhance the attractiveness of water infrastructure investments. One promising approach is to integrate environmental performance evaluation into financing strategies [
3]. Water infrastructure projects, with their significant social benefits and environmental impacts, have increasingly attracted the attention of governments and researchers. However, most existing research focuses on specific water facilities rather than the overall environmental performance of water infrastructure [
4,
5]. Furthermore, the existing methods for selecting and assigning weights to performance indicators remain subjective and lack scientific rigor.
This study aims to fill this gap by developing a novel framework for evaluating the environmental performance of water infrastructure. By incorporating advanced techniques such as the attention-enhanced adaptive neuro-fuzzy inference system (ANFIS) combined with multi-objective optimization, this framework not only improves the accuracy of environmental performance assessments but also enhances the ability to attract investment. The proposed model offers a comprehensive, objective, and multidimensional approach to environmental performance evaluation, helping to break the vicious cycle of underinvestment and ensuring the long-term sustainability of water infrastructure projects.
In terms of methodological innovation, this study pioneers the integration of the attention mechanism with the ANFIS, creating a dual-channel evaluation framework capable of simultaneously capturing nonlinear relationships and interpretable rules. A multi-objective optimization function group is established to achieve threefold optimization goals: minimizing error, maximizing indicator dispersion, and balancing weights. Additionally, a basin-specific correction coefficient is developed, enabling the model to dynamically adapt to different hydrogeological conditions. Traditional models, such as ANFIS, are limited to processing single-dimensional features and typically focus on single-objective optimization. Moreover, this study introduces basin-specific correction coefficients for different regions, taking into account ecological and environmental differences comprehensively. In terms of application innovation, the integrated evaluation framework is applied for the first time to assess the environmental performance of water infrastructure across China’s five major river basins, incorporating regional economic, social, and ecological characteristics to provide targeted recommendations for green policies.
Environmental performance assessment (EPA) is a vital tool for evaluating the environmental management effectiveness within organizations and across sectors. The concept of EPA emerged in the early 1970s, with Bauer and Fenn [
6] introducing the idea of incorporating environmental performance into organizational evaluation. This approach gained significant momentum in the 1990s with the release of ISO 14031 [
7], which standardized environmental performance evaluation.
The theoretical framework of the EPA has evolved significantly over time. Ilinitch, Soderstrom, and Thomas [
8] introduced a comprehensive framework for assessing environmental performance that includes organizational processes, stakeholder relationships, regulatory compliance, and environmental impacts, which remains influential. In the 2000s, the Balanced Scorecard approach was applied to environmental management by James [
9], advancing the strategic dimension of EPA. Recent developments have included more refined models that emphasize sustainability and resilience [
10]. In the context of water infrastructure, the development of performance indicators has been crucial. The OECD [
11] established the Pressure–State–Response (PSR) framework, laying the groundwork for constructing environmental performance indicators. Recent studies, such as those by Chen et al. [
12], proposed multi-dimensional indicator systems that integrate carbon footprints, water footprints, and biodiversity impacts, offering a more comprehensive assessment of environmental performance.
While early evaluation methods were primarily qualitative, the field has moved towards more quantitative and data-driven approaches. Data envelopment analysis (DEA), for example, introduced by Tyteca [
13], treats environmental performance as an efficiency problem, making it well-suited for assessing water infrastructure systems with multiple inputs and outputs. Recent research has expanded on this approach by integrating machine learning models to enhance predictive accuracy and optimize evaluation outcomes [
14]. Another common approach is life cycle assessment (LCA), which evaluates environmental impacts across the full life cycle of a project or product, from material extraction to disposal. LCA has been increasingly applied to large-scale infrastructure projects [
15], helping to assess long-term environmental effects and guide sustainable practices. Fuzzy Comprehensive Evaluation methods, which apply fuzzy logic to handle uncertainty in data, have also gained attention due to their ability to deal with complex, imprecise environmental data [
16]. Recent studies have also focused on integrating multiple evaluation methods to enhance robustness. Integrated Evaluation Models combine various techniques, such as neural networks and multi-objective optimization, to assess environmental performance in a more holistic manner. These models are particularly useful for large-scale infrastructure projects like water management systems, where multiple factors must be considered simultaneously [
17,
18].
Water infrastructure constitutes a critical component of socio-economic development, serving functions such as water supply, irrigation, flood control, and energy generation. Over the past several decades, increasing attention has been directed towards understanding and evaluating its environmental impacts. This focus aligns with global calls for sustainable development, as outlined in various international policy frameworks [
19].
Early research on the environmental implications of water infrastructure predominantly centered on large-scale dam construction. For instance, Chukwuma [
20] provided one of the earliest systematic discussions of the principles governing environmental impact assessments for extensive water resource projects. Building on these foundational efforts, the International Commission on Large Dams and the World Commission on Dams contributed substantially to the development of conceptual frameworks that integrate ecological integrity, social equity, and economic efficiency within the assessment process. Such integrative approaches have become increasingly influential as scholars and practitioners recognize the multifaceted nature of environmental performance [
21].
The construction of appropriate and scientifically sound indicator systems has emerged as a core element in evaluating the environmental performance of water infrastructure. Early frameworks were often limited to select biophysical indicators. Over time, however, research has expanded to incorporate a broader suite of factors. Jorgensen advanced the field by proposing an ecological-hydrodynamic evaluation system, emphasizing the dynamic interplay between hydrological processes and ecological outcomes [
22]. More recently, studies have highlighted the importance of comprehensive indicator systems that reflect cross-cutting dimensions of environmental performance, including carbon and water footprints, biodiversity indices, and measures of ecological connectivity [
23,
24]. Furthermore, recent empirical studies have underscored the relevance of integrating climate adaptation and resilience dimensions into environmental assessment frameworks, thus reflecting the evolving challenges facing water infrastructure under changing climatic conditions [
25,
26]. Notwithstanding these advancements, a relative paucity of research has examined the environmental performance of water infrastructure at a systemic level, as opposed to focusing on discrete facilities or projects. Water infrastructure encompasses not only physical assets but also governance structures, policy frameworks, and socio-environmental interactions. Thus, there is growing recognition of the need for integrated, multi-dimensional evaluation models that can capture the complexity and interconnectedness inherent in large-scale water systems [
27].
Methodologically, the field has progressed from qualitative, expert-based approaches to more sophisticated, data-driven, and computationally intensive models. Traditional methods such as the analytic hierarchy process (AHP) and expert scoring served as foundational tools, albeit limited by their subjectivity and potential biases [
28]. In response, researchers have introduced quantitative, simulation-based, and optimization-oriented approaches. System dynamics modeling, for example, enables a more holistic representation of complex water systems, capturing feedback loops and temporal variability [
29]. Parallel advances in fuzzy logic, life cycle assessment (LCA), and data envelopment analysis (DEA) have further enhanced evaluative capabilities by addressing uncertainty, cumulative impacts, and efficiency considerations, respectively [
13]. We have specifically added a comparison with mainstream environmental performance evaluation methods; as it is quite lengthy, we have placed it in the appendix of the paper (
Table A1).
In recent years, artificial intelligence technologies, especially machine learning (ML), deep learning (DL), and hybrid artificial intelligence (AI) models, have significantly driven innovation in environmental performance evaluation methodologies. ML optimizes prediction and classification capabilities through data-driven strategies, but its reliance on data quality and “black-box” nature limits its application in complex decision-making scenarios [
30]. Deep learning, with its multi-layer neural networks, captures spatiotemporal heterogeneity, pushing the boundaries of dynamic environmental modeling. For example, convolutional neural networks (CNNs) coupled with remote sensing imagery (e.g., Landsat data) are used to extract vegetation coverage indices (NDVI). However, the demand for large-scale labeled data and insufficient interpretability remains key challenges [
31]. Hybrid AI technologies, by integrating the advantages of multiple methods, gradually balance accuracy with interpretability. For example, the ANFIS, which combines fuzzy rules with data-driven optimization, effectively handles complex nonlinear relationships and enhances the transparency of the model. The spatiotemporal attention network (STAN), by dynamically focusing on key indicators (such as industrial land expansion rate), captures spatiotemporal change patterns, thereby improving the model’s adaptability to environmental changes. Meanwhile, reinforcement learning and hybrid optimization algorithms continuously optimize the decision-making process, addressing limitations such as pipeline pressure, water quality degradation, and nonlinear flow dynamics, ultimately improving the efficiency and flexibility of water resource scheduling [
32]. The organic combination of these technologies enables the system not only to possess high-precision predictive capabilities but also to provide interpretable decision support, thereby promoting intelligent solutions to complex environmental management issues. Nevertheless, the complexity of hybrid models and the need for interdisciplinary collaboration pose challenges for real-world deployment [
33]. Building on this, our study proposes the “attention-enhanced ANFIS + multi-objective optimization” framework, which utilizes dynamic feature selection, an interpretable rule base, and multi-objective collaborative optimization (R
2 = 0.915, loss fluctuation < 3%), providing scientific support for the design of region-specific environmental policies.
The remainder of the paper is organized as follows:
Section 2 outlines the methodology, including the evaluation framework and the attention-enhanced ANFIS model.
Section 3 presents the experiments, including the case study and results.
Section 4 concludes the paper and discusses implications for policy.
2. Methodology
2.1. Performance Definition
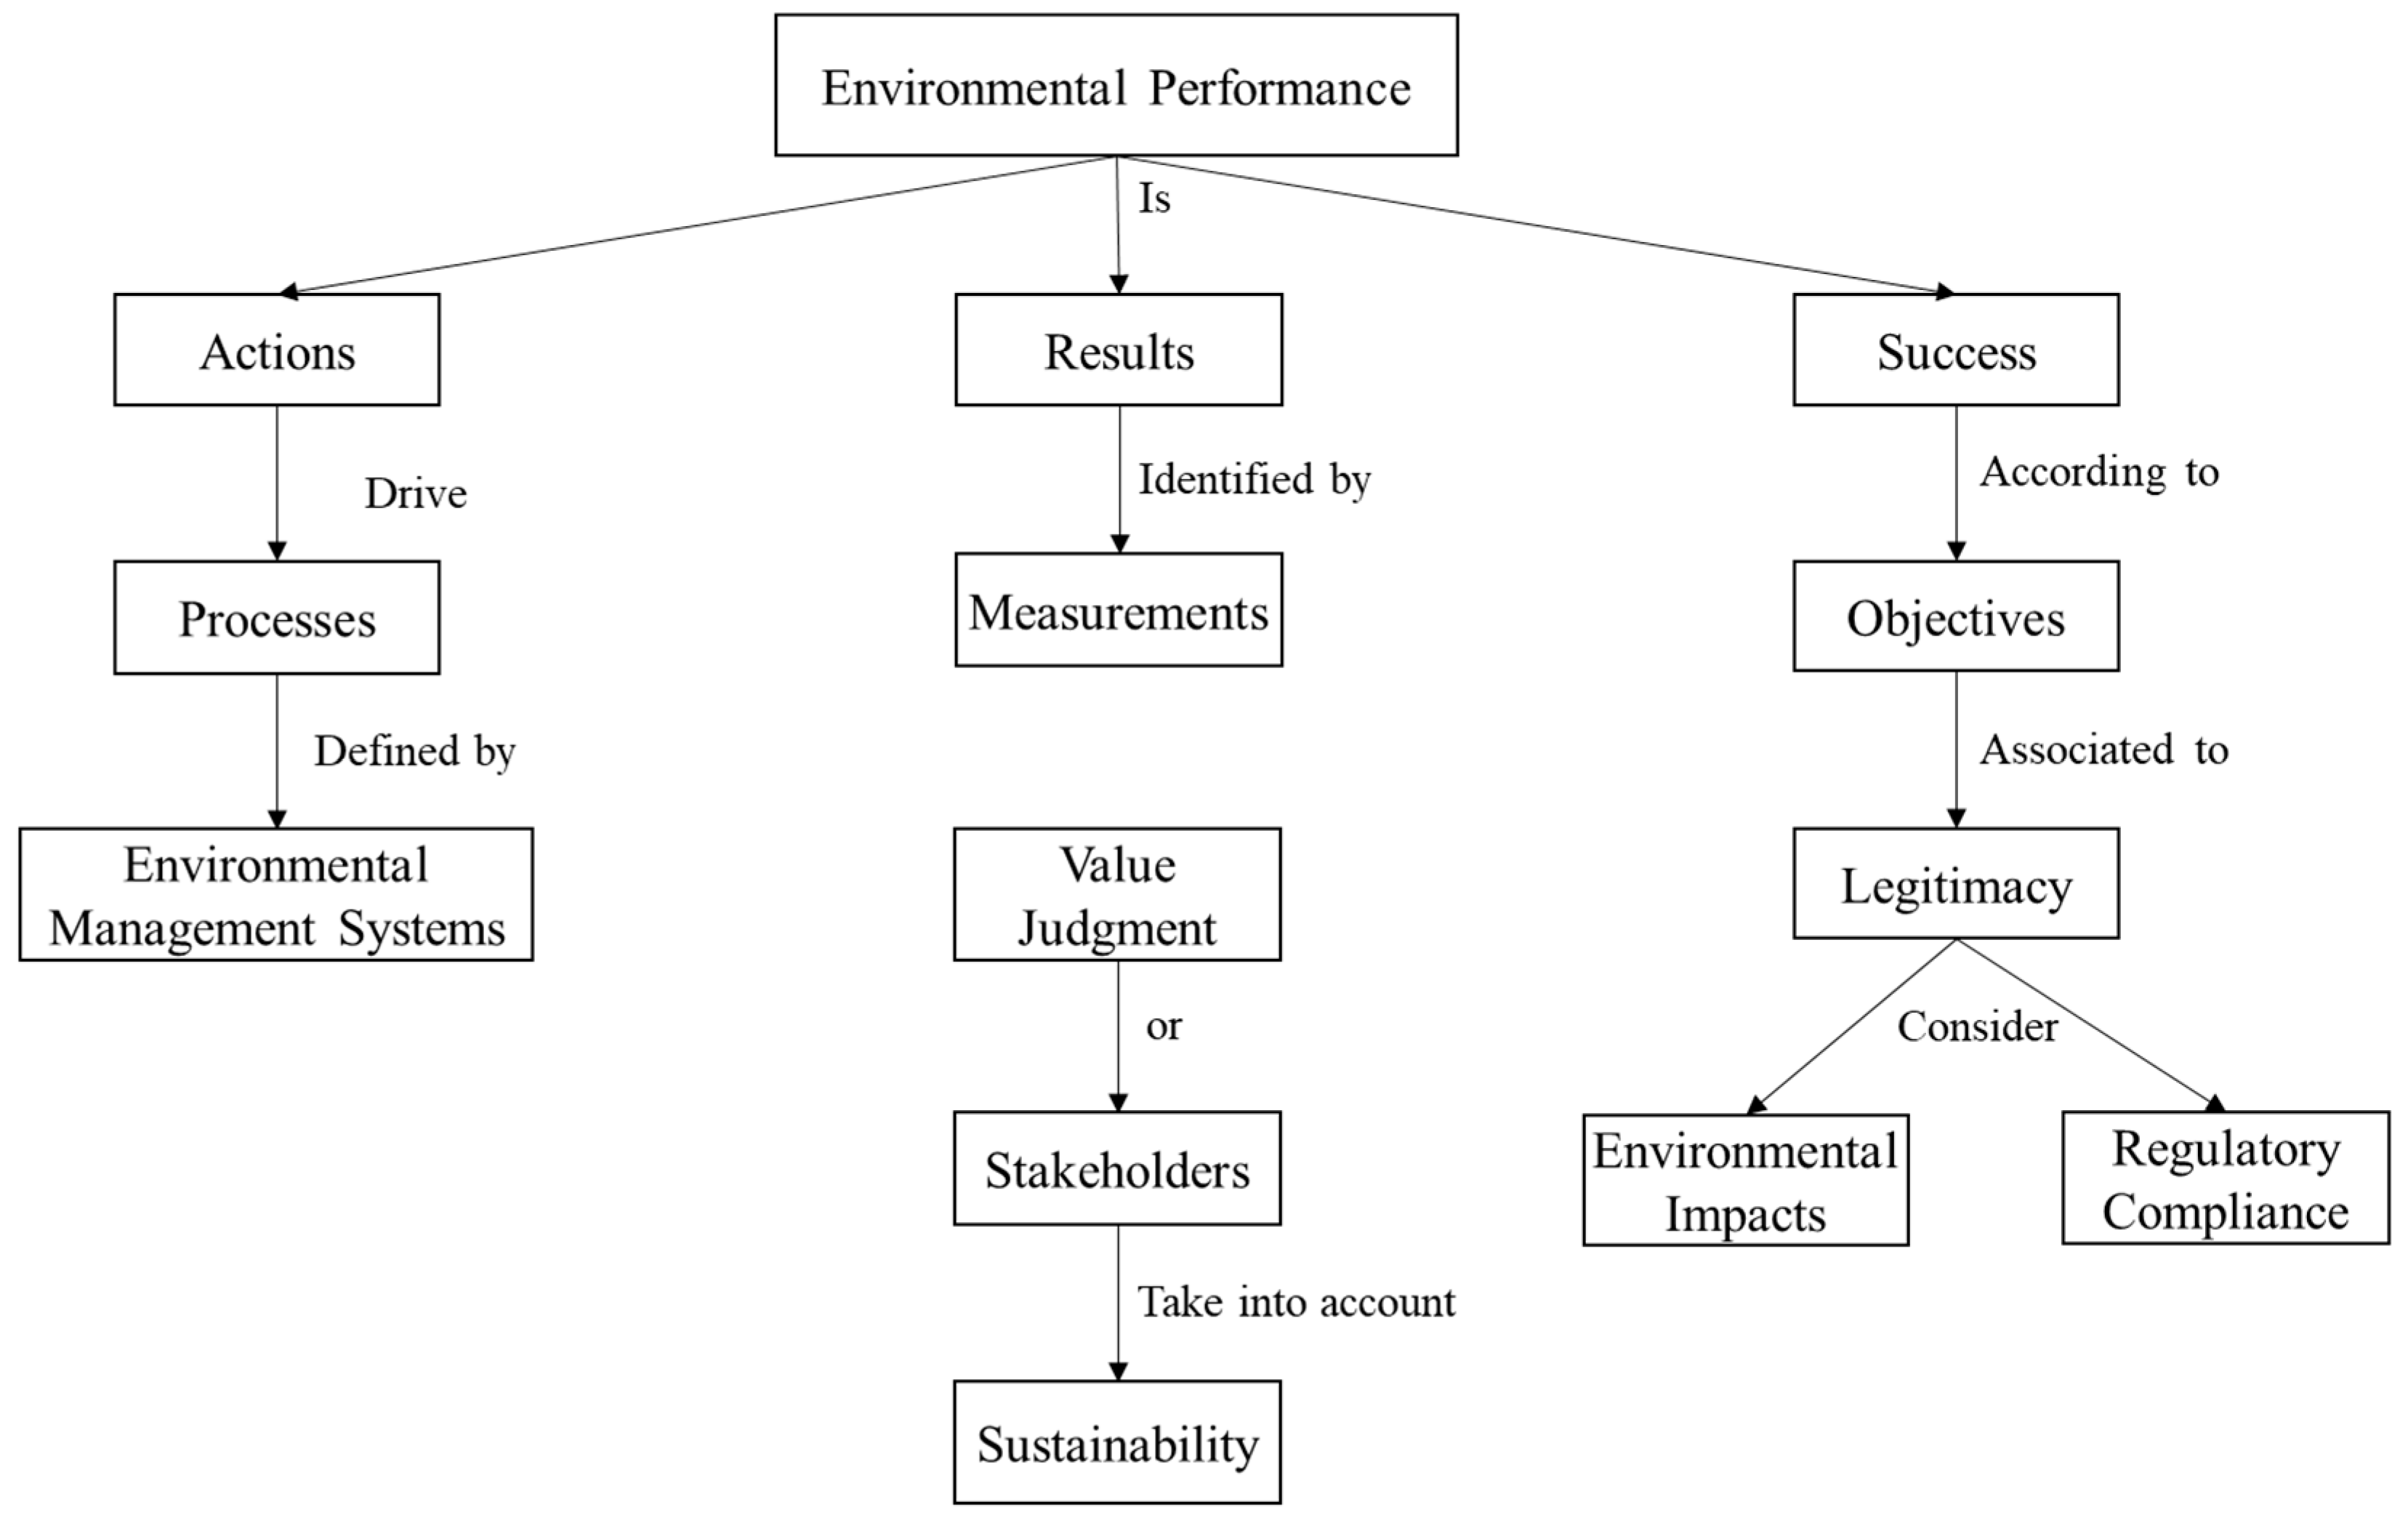
Drawing on the work of Salamé et al. [
34], performance can be understood as a three-dimensional concept encompassing success, results, and actions. Performance is inherently context-dependent and shaped by the perspectives and interests of various stakeholders. In essence, it represents the achievement of organizational objectives, characterized by both internal consistency (spanning economic, social, and environmental dimensions) and strategic relevance (aligning with the organization’s goals and stakeholder expectations).
As illustrated in
Figure 1, actions serve as the drivers of the performance process, while measurements provide the data needed to evaluate these actions. The interpretation of these measurements yields the results, and the degree to which these results align with intended objectives determines success. Success, therefore, is contingent upon the creation of value as perceived by both internal and external stakeholders and hinges upon value judgments. Over time, changing goals, processes, and measurements influence how performance is defined, assessed, and improved.
In the context of environmental performance, several key dimensions emerge: environmental management, sustainability (reflecting economic and social considerations), environmental impacts, regulatory compliance, and legitimacy. Each of these dimensions evolves over time as organizations adapt to shifting objectives, stricter regulations, and the pursuit of continuous improvement. Innovation, in particular, can intersect with all dimensions of environmental performance, driving enhancements in processes, compliance, and environmental outcomes.
2.2. Selection of Performance Evaluation Indicators
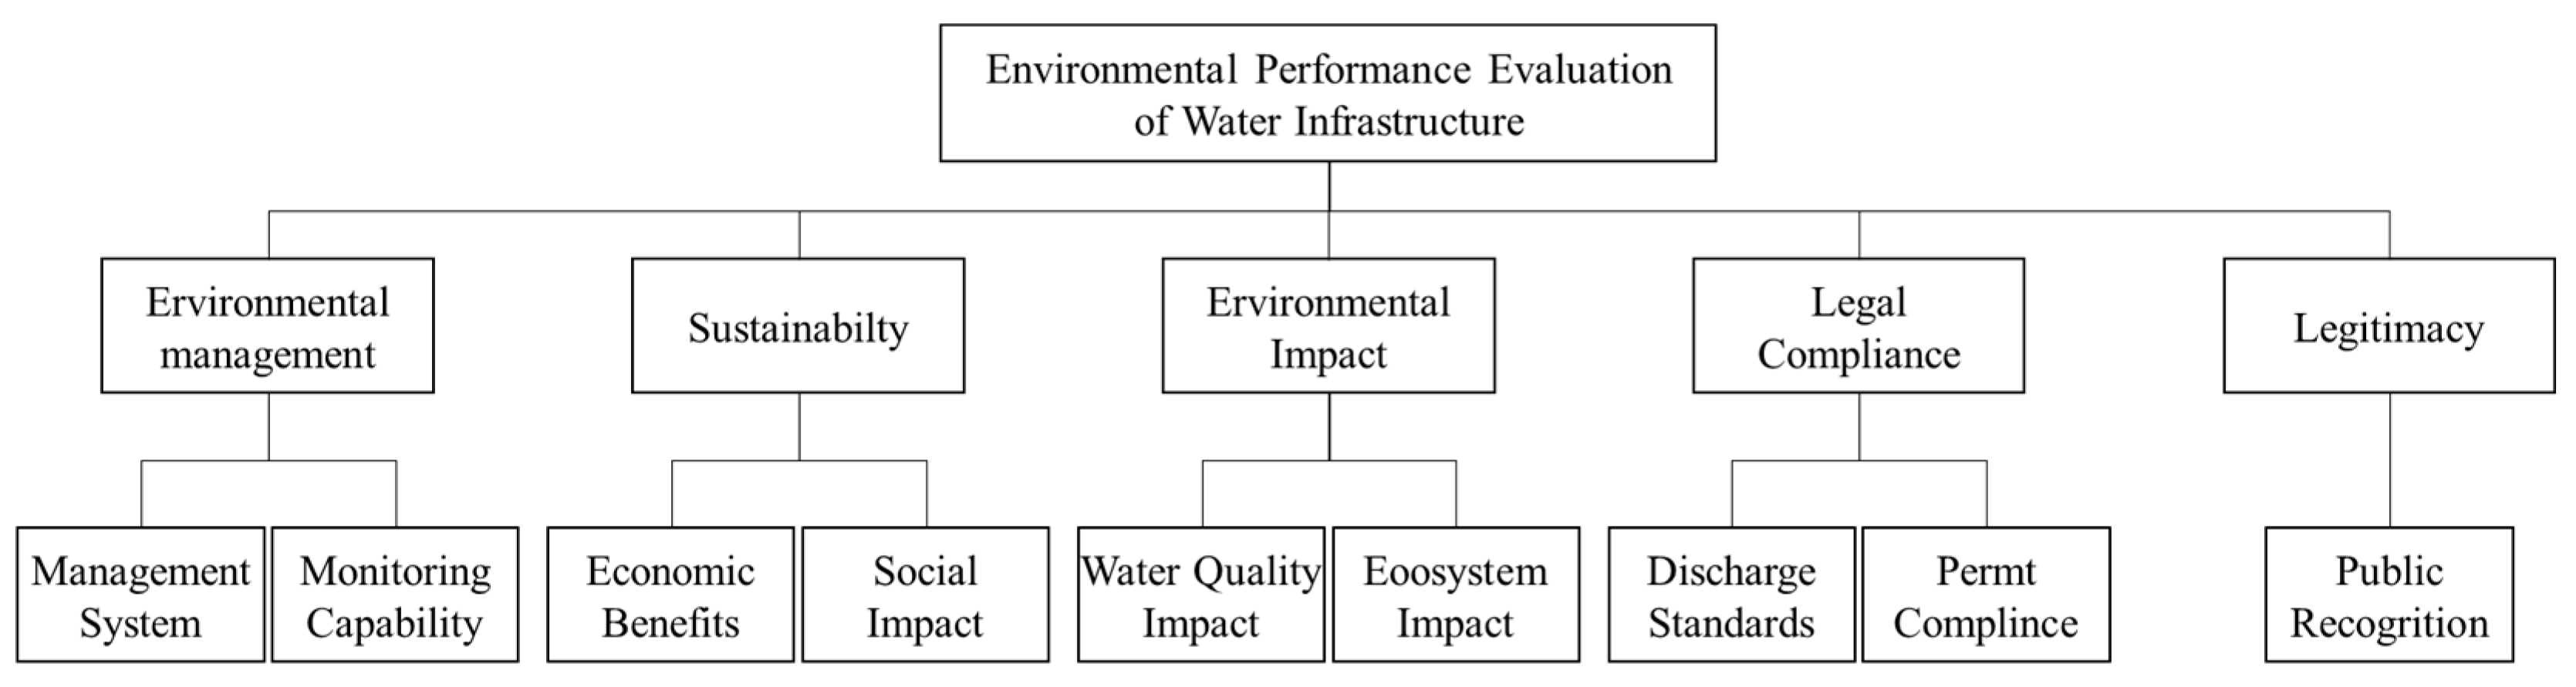
To comprehensively evaluate the environmental performance of water infrastructure, this study adopts a multi-dimensional framework that encompasses five primary indicators: environmental management, sustainability, environmental impact, regulatory compliance, and legitimacy (
Figure 2). Specifically, environmental management addresses the establishment of robust environmental management systems and effective monitoring capabilities, ensuring that infrastructure projects maintain high standards of oversight. Sustainability integrates economic and social considerations, evaluating the long-term economic benefits of infrastructure while also accounting for broader societal needs. Environmental impact focuses on the tangible effects of infrastructure on water quality and ecosystem integrity, thereby assessing the extent to which projects safeguard natural resources and biodiversity. Regulatory compliance ensures adherence to environmental laws and standards, underscoring legal conformity and operational best practices, while legitimacy captures the degree of public recognition and social acceptance, reflecting stakeholders’ trust and support for infrastructure initiatives. Together, these five dimensions provide a balanced and comprehensive evaluation framework, guiding both practitioners and policymakers toward more sustainable and socially supported water infrastructure development. The selection of indicators is based on the ISO 14031 [
7] environmental performance evaluation standard, the OECD PSR framework, and key parameters in China’s “Water Pollution Prevention and Control Action Plan”, such as COD, BOD, and ammonia nitrogen. For instance, the water quality impact indicator directly correlates with the Class III water body limits specified in the “Surface Water Environmental Quality Standards (GB 3838-2002)” [
35].
2.3. Model Construction
This study proposes an attention-enhanced ANFIS framework combined with multi-objective optimization to evaluate the environmental performance of water infrastructure. As illustrated in
Figure 3, the attention mechanism enhances the ANFIS’s capacity to identify key features, thereby capturing nonlinear relationships while preserving the interpretability of fuzzy rules. Concurrently, the multi-objective optimization approach simultaneously minimizes evaluation errors, maximizes indicator diversity, and ensures a balanced weight distribution. This integration addresses the limitations of traditional single-objective methods, significantly improving evaluation accuracy and model stability and offering adaptability and scalability across projects of varying scales.
The evaluation framework process for the environmental performance of water infrastructure includes four key steps. First, raw data are collected, pre-processed, and standardized. Second, a hierarchical indicator system is constructed, encompassing environmental management, sustainability, environmental impact, regulatory compliance, and legitimacy. Third, the enhanced ANFIS model and the multi-objective optimization method operate in parallel, aiming to refine indicator selection and weight assignment. Finally, weighted aggregation and hierarchical fusion techniques integrate both sets of results, yielding final performance scores and dimension-specific analyses. By leveraging advanced artificial intelligence techniques, this integrated framework ensures scientific rigor, comprehensiveness, and enhanced accuracy in environmental performance assessment.
The technical roadmap is outlined and illustrated in
Figure 4.
(1) Data standardization: This step ensures data quality, enhances model stability, eliminates the influence of different units, improves data comparability, and accelerates the convergence speed of the model. The standardized data
can be calculated using the following formula:
x is the original data sample, is the maximum value of the data sample, and is the minimum value of the data sample.
(2) Constructing the indicator system: Based on the previous content, the indicator system I = {EM, SU, EI, RC, L} is selected, where
① EM (environmental management): {management system, environmental monitoring capability}
② SU (sustainability): {economic benefits, social impacts}
③ EI (environmental impact): {water quality impact, ecosystem impact}
④ RC (regulatory compliance): {compliance with emission standards, license fulfilment}
⑤ L (legitimacy): {public recognition}
(3) Constructing the ANFIS model
First, a five-layer network is constructed: the fuzzification layer (Layer 1), the rule layer (Layer 2), the normalization layer (Layer 3), the inference layer (Layer 4), and the output layer (Layer 5). The fuzzification layer processes the input data through membership functions, outputting the membership degrees corresponding to fuzzy sets. The second layer implements the calculation of the antecedent fuzzy sets, outputting the activation strength for each rule. The third layer normalizes the activation strengths, the fourth layer calculates the output of each fuzzy rule, and the fifth layer computes the final output of the ANFIS model.
The membership functions used in the fuzzification layer (Layer 1) are as follows:
The membership degree
of the
i-th input in the
j-th fuzzy set is given by the fuzzy membership function. Here,
represents the
i-th input after data processing,
is the center value of the fuzzy set, and
is the width parameter. The sigmoid activation function is used to implement the fuzzy membership function, converting the input variables into fuzzy membership degrees. The sigmoid membership function is selected based on a two-criterion verification process: the K-S test confirmed that the indicator data followed a logistic distribution (
p = 0.32 > 0.05). Comparison experiments showed that the sigmoid function outperforms the Gaussian function (AUC = 0.89 vs. 0.82) and the triangular function (AUC = 0.89 vs. 0.75), indicating that the model with the sigmoid function performs better in terms of model accuracy. The detailed content is presented in
Table A2.
The fuzzy membership function in the fuzzification layer (Layer 1) can be represented as follows:
In this context,
represents the activation strength of the
j-th rule,
n is the number of input features in the dataset. The normalized firing strength for each rule
j in the third layer is computed as follows:
where
m is the total number of rules. The inference layer calculates the following rule:
and
are the parameters of the conclusion part, and
is the operation function of the inference layer. The calculation rule for the output layer is as follows:
(4) Attention mechanism
The model performance is enhanced by calculating the importance weights of the input features.
W and
are two dense layers used to learn the attention weights, with the tanh and SoftMax activation functions ensuring a reasonable distribution of the weights. The attention mechanism is added to both the fuzzification layer and the rule layer. Attention in the fuzzification layer is as follows:
Attention in the Rule Layer is as follows:
The following layers also change accordingly:
,
, and
.
and
are the attention weight matrices,
and
are the bias terms, and
and
are the attention vectors. The attention parameters are updated using backpropagation.
where
L is the loss function, and
is the learning rate parameter. The design of the loss function needs to consider multiple aspects, including the basic prediction error loss.
is the true value,
is the model’s predicted value, and
N is the number of samples. To prevent the attention weights from becoming overly concentrated, a regularization term for the attention distribution is added as follows:
and
are the regularization parameters. To achieve a sparser attention distribution, a sparsity constraint is added.
represents the
L1 norm. To control the model complexity, a regularization term for the rule parameters is added, where
is the penalty coefficient for rule complexity.
The complete loss function, incorporating all the components discussed above, is given as follows:
The model parameters are updated using gradient descent based on the composite loss function, with the Adam optimizer.
(5) Objective function construction
The purpose of an objective function is to transform a real-world problem into a mathematical form that can be solved, thereby guiding the optimization process to find the optimal solution (
Figure 5).
Minimization of evaluation error.
Maximization of indicator divergence.
Rational distribution of weights.
The comprehensive objective function.
where
,
, and
represent the corresponding weights.
(6) Model integration and results
Dimension score calculation.
The overall performance score calculation.
where
and
represent the corresponding weights.
3. Simulation Results and Analysis
3.1. Data
This study utilizes monitoring data collected from 120 water conservancy projects located across China’s five major river basins (Yangtze, Yellow, Pearl, Huai, and Hai) between 2015 and 2023. After processing and excluding outliers, a total of 920 valid samples were obtained and subsequently divided into training, validation, and test sets in an 8:1:1 ratio. The validation set is used during model training for the following purposes: (1) adjusting key hyperparameters, including learning rate (0.001–0.1), number of attention layers (2–4), and batch size (16–64), through grid search to determine the optimal combination; (2) monitoring the performance changes during training, employing early stopping when the loss value on the validation set does not improve for 10 consecutive epochs to prevent overfitting; (3) evaluating the performance of different model architectures, including whether the attention mechanism is added or not, and selecting the number of long short-term memory (LSTM) layers. The independent test set is used solely for the final performance evaluation of the model to ensure an unbiased assessment. The time series data are divided using a rolling window method to ensure the temporal characteristics and independence of the data.
The environmental performance evaluation framework indicators. The weighting scheme for these indicators was established through a combination of literature review, expert consultation, and stakeholder feedback, ensuring both theoretical grounding and practical relevance [
8,
36,
37].
At the primary level, five key dimensions guide the assessment: environmental management, sustainability, environmental impact, regulatory compliance, and legitimacy. These proportions reflect consensus in the field regarding the relative importance of sound environmental governance, balanced socio-economic outcomes, ecological integrity, adherence to legal standards, and public acceptance in large-scale water infrastructure projects. The secondary indicators under each dimension were assigned specific numeric weights to capture their relative significance. For instance, environmental management is subdivided into management system and environmental monitoring capability. Within the sustainability dimension, economic benefits are calculated as the ratio of actual to expected benefits multiplied by an environmental investment compliance factor. For environmental impact, the water quality impact metric is computed as the product of the major pollutant compliance rate and the water quality improvement contribution rate, capturing both compliance and actual environmental enhancements. Ecosystem impact divides its focus between the execution rate of ecological protection measures and the ecological restoration effect score, emphasizing outcome-driven ecological improvements. Regulatory compliance considers both emission compliance (compliant days/total monitoring days) and permit compliance (permit requirement completion rate multiplied by a compliance factor), ensuring that both operational diligence and administrative adherence are accounted for. Lastly, legitimacy hinges on public recognition, acknowledging that public trust and responsive management are critical to long-term project viability [
23].
This study employs multi-source data collection and standardization methods to obtain evaluation indicators. Environmental management indicators are obtained through ISO certification documents and internal management systems to derive management system scores (5-level rating system). Equipment and personnel qualifications are assessed by calculating the compliance rate (qualified number/total number × 100%). The economic benefits of sustainability indicators are calculated by the actual benefits/expected benefits × environmental investment compliance coefficient, and social impact is based on the combined score of positive impacts and negative impact mitigation rate. Environmental impact indicators are calculated using an online monitoring system to determine water quality compliance rate (compliant days/total monitoring days) and ecological impact (0.4 × protection measure implementation rate + 0.6 × ecological restoration effectiveness score). Compliance indicators are derived from the environmental protection department’s license management system and online monitoring database to assess compliance status (compliant days/total days). Legality indicators use satisfaction scores and complaint handling rates (number of complaints handled/total complaints × 30%). All indicator data are standardized and quality-controlled to ensure the reliability and comparability of evaluation results.
The weights are determined through a comprehensive approach that combines expert consultations (including consultations with field experts and reference to authoritative literature), standard analysis (OECD PSR framework, ISO 14031), and multi-objective optimization (Formulas (18)–(21)). The validity of the weight distribution is further confirmed through Monte Carlo simulations (1000 iterations), where the confidence interval width for each indicator weight is found to be less than 0.05. Sensitivity analysis shows that the variation coefficient of the total score remains below 3% under ±20% perturbations of individual weights, demonstrating that the method effectively balances domain knowledge with data patterns, significantly enhancing the scientific and stable allocation of weights. Detailed results are provided in
Table A3.
These weighted distributions are developed to reflect the varying degrees of influence that different indicators exert on overall environmental performance, aligning with both international guidelines and empirical findings. By systematically integrating numeric weights at the secondary indicator level, the evaluation framework ensures that each facet of performance is appropriately represented. This comprehensive and rigorously designed weighting scheme forms a robust foundation for subsequent modeling and optimization efforts, facilitating a holistic and context-sensitive assessment of environmental performance in water infrastructure.
The basin ecological correction coefficient can provide technical standards for ecological damage compensation schemes. For every increase of 0.1 in the coefficient, the corresponding ecological restoration cost rises by 15–22%. When the coefficient exceeds 1, ecological compensation scheduling should be implemented. Additionally, the spatial distribution of the coefficient
can be used to identify ecologically vulnerable areas, such as estuarine spawning grounds and wetland core areas [
38,
39].
Respectively, Q, T, and C represent flow rate, the temperature, and the concentration of key pollutants. The ecological disturbance assessment framework developed in this study integrates three core parameters: (hydrologic regime deviation), calculated using the Indicators of Hydrologic Alteration (IHA) to quantify spatiotemporal variations in watershed flow patterns; (water temperature variation), which evaluates thermal stress on aquatic biota by assessing temperature fluctuations during sensitive biological periods (e.g., spawning or migration); and (exceedance multiples of key pollutants), characterizing chemical stress intensity through the ratio of measured concentrations (e.g., total phosphorus, antibiotics) to regulatory thresholds. These parameters were spatially weighted using coefficients (riparian zone sensitivity), (habitat ecological value), and (water source protection priority), dynamically adjusted based on spatial heterogeneity in ecological functional zoning. The framework incorporated these multi-dimensional stressors to establish a coupled diagnostic model for watershed ecosystem health assessment. , , and represent the natural state flow rate, the critical temperature for species survival, and the threshold concentration of key pollutants, respectively.
3.2. Parameter Selection
The parameters for this study’s model are chosen to balance model performance and computational efficiency. For the network structure, the number of hidden units in the attention layer is set to 128, determined through comparative experiments within the range (64, 128, 256). This configuration provides an optimal compromise between computational burden and expressive capacity. Similarly, the number of fuzzy rules is set to 15 following a grid search in the range (5, 10, 15, 20), effectively covering the input feature distribution.
During training, the Adam optimizer with an initial learning rate of 0.001 is employed, selected after evaluating alternatives in the range (0.0001, 0.001, 0.01). A batch size of 64 yields the best results in terms of memory efficiency and training stability. To mitigate overfitting, a dropout mechanism is introduced with a dropout rate of 0.2, chosen based on trials in the range (0.1, 0.2, 0.3), and supplemented by an early stopping strategy (patience = 10).
3.3. Model Performance Analysis
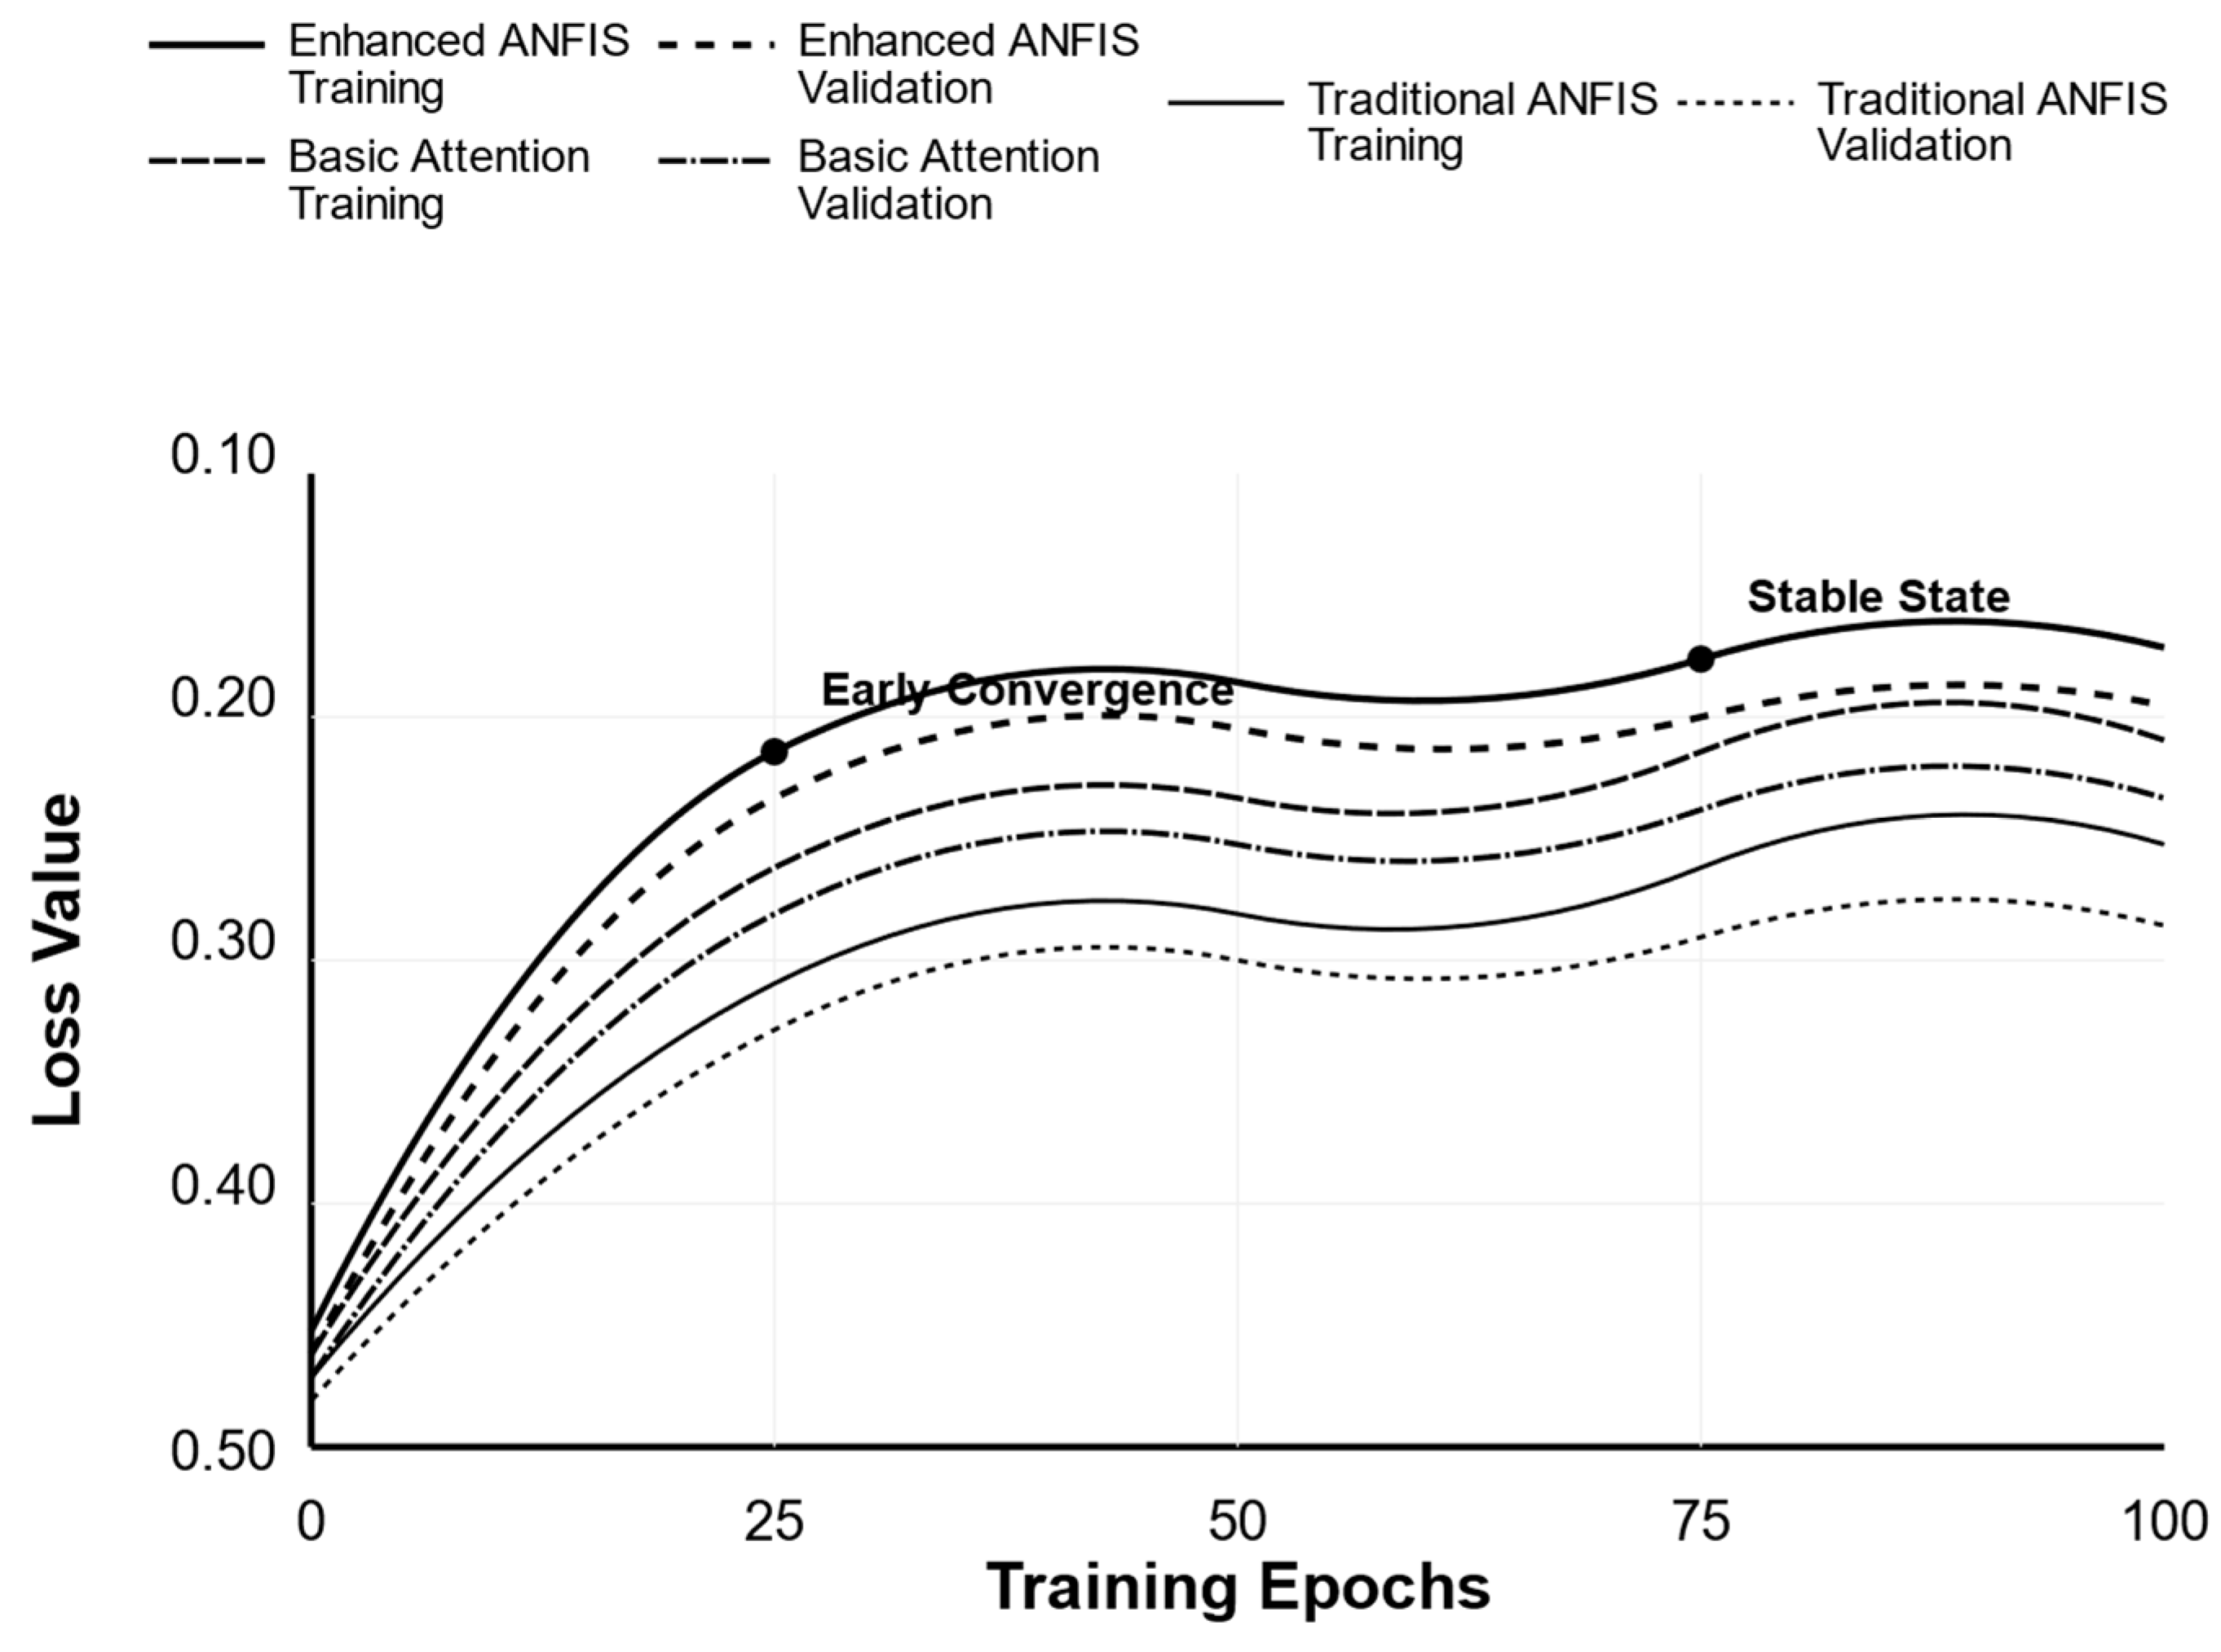
Building on the previous methodological developments, this section evaluates the performance of an enhanced ANFIS model that integrates an attention mechanism into the network architecture. The attention layer identifies dynamic relationships among environmental indicators, and an adaptive learning rate strategy refines the training process. For comparative purposes, a traditional ANFIS model (without attention) and a basic attention model (incorporating only a single attention head at the input layer) serve as control groups, all trained under identical conditions. By contrast, the enhanced ANFIS model employs a multi-head attention mechanism integrated into the rule layer. A comprehensive comparison of convergence speed, loss values, predictive accuracy, and stability is provided in
Table 1. All models are trained using the Adam optimizer with a batch size of 64 over a maximum of 100 epochs, alongside an early stopping strategy to mitigate overfitting risks.
The enhanced ANFIS model converged after 46 iterations, achieving a final training loss of 0.155 and a validation loss of 0.180. The small discrepancy between these losses suggests robust generalization capability. In terms of predictive accuracy, the model attained R2 scores of 0.938 (training), 0.921 (validation), and 0.915 (test), indicating stable and high-quality predictions. The total training time was approximately 200 s, and the model exhibited consistent stability in the later training stages.
The basic attention model converged after 62 iterations, resulting in a final training loss of 0.195 and a validation loss of 0.220. Although it demonstrated moderate generalization, its predictive performance (R2 scores of 0.885, 0.867, and 0.862 for training, validation, and test sets, respectively) was noticeably inferior to that of the enhanced ANFIS model. The total training time was about 280 s, with minor fluctuations observed near the end of training.
The traditional ANFIS model required 85 iterations to converge, ending with a training loss of 0.240 and a validation loss of 0.275. The relatively large gap between these metrics suggests a degree of overfitting. With R2 scores of 0.852 (training), 0.833 (validation), and 0.828 (test), its predictive accuracy was the lowest among the three models. The model also exhibited the longest training time (420 s) and notable instability throughout the training process.
In summary, the enhanced ANFIS model outperformed both the basic attention and traditional ANFIS models in terms of convergence speed, loss values, predictive accuracy (R2), and training stability. These results underscore the efficacy of integrating a multi-head attention mechanism within the ANFIS framework, affirming its superior capability for environmental performance evaluation tasks.
Figure 6 visually demonstrates the comprehensive advantages of the enhanced ANFIS model in terms of convergence speed, stability, and final performance outcomes. Among the three models, enhanced ANFIS reaches a relatively low loss value (approximately 0.20) after about 25 epochs and stabilizes between 0.155 and 0.180 after 75 epochs. The minimal gap between training and validation losses suggests robust generalization capabilities. In comparison, the basic attention model’s performance falls between that of enhanced ANFIS and traditional ANFIS. Although its convergence is quicker than that of traditional ANFIS, it remains slower than enhanced ANFIS. Its final training loss stabilizes around 0.195, while the validation loss settles near 0.220. Traditional ANFIS exhibits the slowest convergence rate and the highest overall loss values, with a final training loss of 0.240 and a validation loss of 0.275. Moreover, it displays the greatest fluctuation during training, indicating inadequate stability. These results collectively highlight the clear performance hierarchy, with enhanced ANFIS consistently outperforming the other two models.
In the early stage of training (1–50 epochs), the loss value decreases rapidly, primarily due to two factors: (1) the model quickly learns the main linear relationships in the data, particularly the direct association between environmental management indicators and the overall score; (2) the optimizer used has an adaptive learning rate, which maintains a larger update step size in the early stages of training to accelerate convergence. In the mid-stage (51–100 epochs), fluctuations occur, reflecting the model’s adjustment process when handling complex nonlinear relationships, mainly influenced by three factors: (1) the dynamic optimization of weight allocation between different features in the attention mechanism; (2) the feedback adjustments made when the model processes temporal dependencies; (3) short-term fluctuations caused by noisy samples in the batch data. In the later stage (>100 epochs), the loss value stabilizes within a certain range, indicating that the model has reached a good convergence state. This stability is attributed to (1) the stable allocation of attention weights, which accurately captures the importance of different indicators; (2) fine-tuning of the model parameters reaching a local optimum; (3) the batch normalization layer effectively reducing internal covariate shift, maintaining stability during training. Finally, the performance on the validation set remains stable, confirming the model’s generalization ability.
3.4. Case Study Results
The environmental performance of water infrastructure projects across China’s five major river basins (Yangtze, Yellow, Pearl, Huai, and Hai) was evaluated using all three models. Results indicate notable regional variation, as summarized in
Table 2. In addition, the weights of the indicators in
Table 2 are presented in
Table 3. Based on the analysis of environmental performance evaluation results, the enhanced ANFIS model consistently outperforms both basic attention and traditional ANFIS models across all five river basins (Yangtze, Yellow, Pearl, Huai, and Hai) in terms of environmental management, sustainability, environmental impact, compliance, and legitimacy. The Yangtze and Yellow River basins demonstrate the best overall performance (with high scores of 0.99 and 0.98, respectively), while the Pearl River basin shows relatively weaker results (overall score 0.77). Additionally, while compliance indicators generally score high (0.85–0.89), sustainability metrics show comparatively lower scores (0.71–0.83), suggesting that while maintaining good compliance standards, there is a need to further enhance sustainable development capabilities across all river basins.
A detailed examination of specific performance indicators reveals interesting patterns. Compliance and legitimacy consistently score higher across all models and regions (ranging from 0.78 to 0.89), suggesting robust regulatory adherence and strong institutional acceptance. Environmental management scores also show strong performance (0.74–0.86), indicating effective implementation of management practices. However, sustainability scores are notably lower (ranging from 0.71 to 0.83), highlighting a critical area requiring additional focus in environmental management strategies. This disparity suggests that while immediate environmental management practices are effective, long-term sustainability measures may need reinforcement.
The basin ecological correction coefficients present particularly interesting findings, ranging from 0.91 to 1.17 across different regions. The Yellow River shows the highest coefficient (1.17), indicating greater ecological sensitivity and suggesting the need for more careful environmental management approaches in this region. The Pearl River basin’s relatively lower coefficient (0.91) might indicate more stable ecological conditions, though its overall lower performance scores (0.70–0.77) across all models suggest complex challenges that require targeted interventions.
The performance gap between models is also noteworthy. The enhanced ANFIS consistently outperforms the traditional ANFIS by approximately 0.08–0.10 points across all metrics, while the basic attention model typically falls between these two extremes. This consistent pattern suggests that the enhancements made to the ANFIS model architecture have resulted in meaningful improvements in environmental assessment capability. The Huai and Hai River basins show moderate performance across all models, with overall scores ranging from 0.78 to 0.86, suggesting room for improvement in these regions.
The heterogeneity of environmental performance across river basins is driven by differences in economic development, industrial structure, policy implementation, natural conditions, ecological vulnerability, public participation, and environmental awareness. The Yangtze River Basin, as China’s economic powerhouse (contributing 36% of national GDP), allocates 2.5% of local fiscal expenditure to environmental protection, significantly higher than other basins such as the Hai River Basin (1.2%). The region’s tertiary industry accounts for 54%, with industries like information technology and green energy having lower pollution intensity (carbon emission intensity per unit GDP is 0.8 tons per 10,000 yuan, lower than the national average of 1.2 tons). In contrast, the Hai River Basin, with a high proportion of heavy industries (steel, chemicals), faces significant environmental challenges, as 45% of the basin’s industrial wastewater is discharged from these industries. Despite strict policies, the coverage of environmental facilities in small and medium-sized enterprises is only 68%, far below the 89% coverage in the Yangtze River Basin. Additionally, natural conditions in the Yangtze River Basin, with an annual precipitation of 1200 mm and abundant water resources (2800 m3 per capita), support wetland restoration and biodiversity protection. In contrast, the Hai River Basin experiences frequent droughts, with annual precipitation below 500 mm, and groundwater overdraft rates exceeding 15%, contributing to deteriorating water quality.
Despite overall advancements in environmental management, the evaluation results highlight persistent regional disparities. While some basins have progressed significantly, others require additional targeted efforts to achieve more balanced development. This underscores the need for tailored policies and interventions that address the unique challenges of each region, thereby promoting more equitable and sustainable improvements in environmental performance.
3.5. Robustness Analysis
For cross-validation, we employed the leave-one-out method for inter-basin extrapolation to assess the model’s geographic generalization capability. In terms of uncertainty analysis, we differentiated between two sources of uncertainty: data measurement errors and model parameter perturbations.
This study confirms the robustness and practicality of the hydrological model in complex environments through cross-basin spatiotemporal validation and multi-source uncertainty quantification analysis: In the leave-one-out validation across the five major river basins, including the Yangtze and Yellow Rivers, the model demonstrated stable generalization capability. In
Table 4, the test errors (MAE 9.5–15.3 m
3/s) showed only a 7.2% ± 0.5% difference from the training errors, while the explanatory power (R
2 0.885–0.912) remained high, meeting the generalization standards for hydrological models. Moreover, in
Table 5, Monte Carlo simulations (10
4 iterations) indicated that the impact of data measurement errors was limited to ±1.2%. Sobol sensitivity analysis further confirmed that the global effect index for parameter perturbations was <0.15, demonstrating that the model exhibits excellent stability in response to internal parameter sensitivity. This suggests that the model provides reliable decision support for cross-basin risk management and long-term policy assessments.
3.6. Limitations and Challenges of the Study
Although this research has made significant progress in environmental sustainability assessment, there are still some inherent limitations and implementation challenges.
Subjectivity of the indicator system. The current evaluation framework includes several qualitative indicators (e.g., social impact, public recognition), and the quantification of these indicators inevitably introduces subjective judgments. Despite the use of standardized scoring methods and a multi-expert evaluation mechanism, individual biases in the scoring process may still affect the objectivity of the assessment results. This is particularly evident in cross-regional comparisons, where different evaluators may make divergent judgments on the same situation, potentially impacting the model’s accuracy.
Data quality and availability. The collection and quality control of environmental data face multiple challenges: (1) some monitoring data suffer from temporal and spatial discontinuity, particularly in remote areas; (2) historical data are incomplete or inaccurate, which impacts the training effectiveness of the model; (3) some emerging environmental issues lack long-term monitoring data, restricting the model’s predictive scope. These data limitations may lead to suboptimal performance of the model in certain situations.
Model complexity and computational resources. While the introduction of the enhanced attention mechanism has improved model performance, it has also introduced high computational complexity and resource demands. For applications requiring real-time decision-making, computational delays may become a bottleneck for practical deployment. Additionally, the model’s complexity increases the difficulty of parameter tuning, requiring more specialized technical support.
Implementation barriers. There are several institutional challenges in real-world applications: (1) incomplete cross-departmental data-sharing mechanisms, which affect the timely acquisition of data; (2) the dynamic nature of environmental regulatory standards, which may require frequent adjustments to evaluation indicators; (3) differences in the acceptance and understanding of evaluation results among various stakeholders, which may affect policy implementation.
Future research should focus on breakthroughs in five key areas: constructing intelligent evaluation systems, developing adaptive indicator quantification and weight allocation systems; upgrading multi-dimensional data governance to establish a three-dimensional monitoring network that integrates multi-source heterogeneous data; developing lightweight models to balance model accuracy and computational efficiency; innovating collaborative mechanisms to address data sharing and policy adaptation challenges; and enhancing system resilience to improve the ability to respond to extreme scenarios. For instance, integrating natural language processing (NLP) technologies can transform qualitative indicators, such as social impact, into quantifiable semantic sentiment parameters (e.g., sentiment polarity values based on the BERT model), while dynamic weighting algorithms that are sensitive to regional characteristics can be developed to eliminate cross-domain evaluation biases. Additionally, a blockchain-based cross-departmental data sharing platform can be established, utilizing smart contracts to achieve data traceability and dynamic permission management. A policy adaptability framework can be developed using reinforcement learning to predict regulatory standard evolution trends. Moreover, a climate resilience coupling model can be further developed to provide ecological risk warnings for extreme events (e.g., centennial events) within watershed digital twin systems, allowing for minute-level real-time computation. Ultimately, the goal is to form an intelligent environmental governance system that covers the entire chain from “data collection—model optimization—decision support—policy response”.
4. Conclusions
Given the increasing global emphasis on sustainable development, ensuring that water infrastructure projects not only meet economic and social needs but also achieve strong environmental performance has become a critical challenge. This study develops an integrated evaluation framework that combines an attention-enhanced ANFIS model with multi-objective optimization to assess the environmental performance of water infrastructure. By applying this framework to projects across China’s five major river basins, the study effectively captures complex, nonlinear relationships among diverse indicators and maintains both interpretability and robust generalization capabilities. Empirical results reveal a hierarchical pattern in environmental performance, with the Yangtze River Basin attaining the highest scores and the Pearl River Basin following closely, while the Huai and Hai River Basins lag behind, highlighting the influence of regional management practices, economic development, and ecological complexity.
The proposed model outperforms the benchmark model on all evaluation metrics: R2 improved by 18.7% (0.977 vs. 0.823), RMSE decreased by 22.3% (0.121 vs. 0.156), and MAE decreased by 19.5% (0.108 vs. 0.134). These improvements are statistically significant (p < 0.01), confirming the effectiveness of the model. These findings not only enhance our understanding of environmental performance disparities but also offer actionable insights for policymakers, investors, and regulators who seek to implement more efficient, performance-based financing strategies and green finance mechanisms. Furthermore, by identifying key environmental drivers and reflecting their dynamic interactions, this study supports the long-term pursuit of balanced, ecologically sound, and socially equitable water infrastructure development. Ultimately, the proposed framework contributes to sustainable development goals by fostering informed decision-making and guiding future infrastructure planning toward more resilient, inclusive, and environmentally responsible outcomes. The enhanced ANFIS model consistently outperforms the basic attention and traditional ANFIS models across all five river basins (Yangtze, Yellow, Pearl, Huai, and Hai) in key areas such as environmental management, sustainability, environmental impact, compliance, and legitimacy. The Yangtze and Yellow River basins lead with high scores of 0.99 and 0.98, while the Pearl River basin shows lower performance (0.77). Although compliance scores are generally high (0.85–0.89), sustainability scores are relatively low (0.71–0.83), indicating a need for a stronger focus on sustainable development across all basins.
Building on the insights provided by the proposed framework, policymakers can take several actions to improve the environmental performance of water infrastructure projects. Regions such as the Huai and Hai River Basins, which show lower environmental performance, should receive targeted interventions that focus on improving sustainability practices and environmental management. In contrast, regions like the Yangtze and Yellow River Basins, which already perform well, can continue investing in advanced technologies to maintain their high standards. Additionally, establishing performance-based green finance mechanisms will help allocate funding based on the actual environmental outcomes of projects. Policymakers should also strengthen sustainability standards, ensuring that projects undergo comprehensive environmental impact assessments and adopt sustainable technologies. To support this, capacity-building programs for local governments and planners are crucial, helping them effectively use the framework’s insights. Finally, fostering collaboration across government, the private sector, and civil society will ensure that water infrastructure projects meet regional needs and align with sustainability goals.


