Article

Compound Flood Risk Assessment of Extreme Rainfall and High River Water Level

1
Key Laboratory of Urban Stormwater System and Water Environment, Ministry of Education, Beijing University of Civil Engineering and Architecture, Beijing 100044, China
2
Collaborative Innovation Center of Energy Conservation & Emission Reduction and Sustainable Urban-Rural Development in Beijing, Beijing 100044, China
3
Shanghai Municipal Engineering Design Institute (Group) Co., Ltd., Shanghai 200092, China
*
Author to whom correspondence should be addressed.
Water 2025, 17(6), 841; https://doi.org/10.3390/w17060841
Submission received: 19 February 2025 / Revised: 10 March 2025 / Accepted: 13 March 2025 / Published: 14 March 2025
(This article belongs to the Special Issue Urban Drainage Systems and Stormwater Management)

Abstract

:
Urban flooding is typically caused by multiple factors, with extreme rainfall and rising water levels in receiving bodies both contributing to increased flood risks. This study focuses on assessing urban flood risks in Jinhua City, Zhejiang Province, China, considering the combined effects of extreme rainfall and high river water levels. Using historical data from Jinhua station (2005–2022), the study constructed a joint probability distribution of rainfall and water levels via a copula function. The findings show that the risk probability of combined rainfall and high water levels is significantly higher than considering each factor separately, indicating that ignoring their interaction could greatly underestimate flood risks. Scenario simulations using the Infoworks ICM model demonstrate that flood areas range from 0.67% to 5.39% under the baseline scenario but increase to 8.98–12.80% when combined with a 50a return period water level. High river water levels play a critical role in increasing both the extent and depth of flooding, especially when low rainfall coincides with high water levels. These findings highlight the importance of considering compound disaster-causing factors in flood risk assessment and can serve as a reference for urban drainage and flood control planning and risk management.

1. Introduction

In recent years, rapid urbanization and the impacts of extreme weather have led to frequent urban flooding disasters. The Sixth Assessment Report by the Intergovernmental Panel on Climate Change (IPCC) indicates that heavy precipitation and flooding will intensify and become more frequent in many regions worldwide throughout the 21st century [1]. Urban flooding has already caused significant economic losses, casualties, and other severe social consequences [2,3]. Urban areas facing extreme high tide levels, river flooding, and intense rainfall may experience the coupling and concurrent occurrence of these disaster factors in both spatial and temporal dimensions, leading to compound flooding events. Compared to flooding events caused by individual disaster factors, compound flooding events involve the interactions of multiple disaster factors and various combinations of their occurrences, making the associated risks and impacts more complex and highly unpredictable [4,5].
Compound events refer to the combination of multiple processes or disaster factors with certain spatiotemporal correlations that can lead to significant social and environmental risks [6]. For example, during heavy rainfall seasons, prolonged precipitation in upstream areas can cause river flooding, with water levels exceeding warning thresholds. When combined with localized intense rainfall, this can raise local river water levels, increasing the likelihood of dike breaches or overtopping, ultimately resulting in flooding. Most inland cities are located along major rivers, with urban drainage and flood control infrastructure connected to these rivers, making them vulnerable to the dual threats of river flooding and internal urban flooding. Both extreme rainfall and rising river water levels are key drivers of urban flooding, and their compound effects exacerbate flood risks [7,8,9]. For example, from 17 to 22 July 2021, Zhengzhou, China, experienced daily rainfall that surpassed the historical maximum since the establishment of meteorological records. Floods caused by the combined effects of reservoir discharge and inadequate drainage overwhelmed low-standard river sections, resulting in overtopping. The overlap of river flooding and urban rainfall further exacerbated flooding in the city.
Most current research is shifting from a “single hazard” to a “multiple hazards” approach. The study of the interactions and coupled disaster processes of multiple hazards has become a key focus in integrated risk assessment research. This area mainly explores the formation mechanisms, compound effects, and joint probabilities of such events [10,11,12,13,14].
Joint probability models have advanced rapidly, emerging as the primary statistical approach for analyzing compound disasters. Among these models, the copula model stands out as the most widely used and representative method. Copulas link multivariate joint distributions with their marginal distributions, providing a flexible and robust framework for nonlinear correlation analysis [15,16]. Copula functions have been widely utilized in disaster risk assessments due to their ability to accurately estimate risk probabilities across various combinations of variables. This approach is particularly relevant in coastal cities, where the compounded effects of typhoons, storm surges, and extreme rainfall contribute to significant flood risks. Previous studies have applied copula functions to quantify joint disaster risks in these regions. For example, Ghanbari et al. [17] incorporated sea level rise (SLR) and variations in peak river flow into the marginal distributions of flood-driving factors, using a copula-based approach to estimate the joint return period (JRP) of compound floods. Lin et al. [18] performed a copula-based analysis on observational data from coastal urban areas in Taiwan, collected between 2001 and 2022, and developed an empirical formula to calculate early warning thresholds for compound flooding events caused by intense rainfall and storm surges. Li et al. [19] analyzed the joint probability of storm surges and rainfall using copula functions, and, in conjunction with a hydrodynamic model, assessed the risk of loss of life due to compound flooding in the coastal areas of the Macau Peninsula.
Urban pluvial flood simulation and risk assessment are crucial non-structural measures in urban flood management systems. Hydrological/hydrodynamic models are widely acknowledged as effective tools for studying urban flooding [20,21,22,23]. These models can quantify flood characteristics, such as inundation depth and area, through simulations and are extensively used in flood risk assessments. Kumbier et al. [24] examined the contributions of river flooding and storm surge flooding during coastal compound events in Australia using a hydrodynamic model. The results showed that considering only the impact of storm surges leads to an underestimation of the flood extent and depth. Wei et al. [25] utilized the InfoWorks ICM coupled 1D–2D urban flood model to simulate scenarios across various rainfall return periods and durations, identifying pluvial flood risk levels in the study area. Similarly, Zhu et al. [26] developed a numerical analysis model to estimate indoor flooding and accurately simulate the entire flooding process. They assessed flood risks and the effectiveness of flood control measures in three extreme rainfall scenarios with return periods of 10a, 50a, and 100a. Zhong et al. [27] analyzed the impacts of extreme compound flooding events, including storm surges, rainfall, and river flooding, in various scenarios using an integrated model based on Delft3D-FLOW and HEC-RAS. Xue et al. [28], using a hydrodynamic model and the entropy weight method, proposed a composite index to enhance flood risk assessments and identified the flood risks associated with the combination of rainfall and river water levels. With the development of big data technology, various data-driven machine learning techniques have been gradually applied to flood disaster research [29]. Di Bacco et al. [30] introduced a machine learning framework to model tropical cyclone-induced compound floods and optimized the prediction results of flood inundation depth.
So far, research on the simulation and risk assessment of compound flooding scenarios in inland cities has been limited, particularly in scenarios involving high river water levels and intense rainfall. Extreme rainfall often raises river water levels within the catchment, reducing the effectiveness of stormwater drainage into rivers and increasing the risk of urban flooding [31,32]. To address these gaps, this study focuses on Jinhua City, located in southern Zhejiang Province, China. The objective is to analyze the compound disaster risk arising from the combined effects of extreme rainfall and high river water levels. A framework integrating multivariate statistical analysis and numerical hydrodynamic modeling is proposed to quantitatively assess urban compound flood risk.

2. Materials and Methods

2.1. Study Area and Datasets

Jinhua City is located in central Zhejiang Province, China. The city is symmetrically arranged in a terraced pattern on the northern and southern sides, with a central region comprising basins, hills, and plains. Jinhua lies within the subtropical monsoon zone, characterized by a mild climate and abundant rainfall, with distinct winter and summer monsoons. The city receives an average annual rainfall of 1528.2 mm, with higher precipitation occurring in late spring and early summer. This seasonal pattern often leads to flooding during the plum rain season, while frequent heavy rainfall events contribute to a high risk of urban flooding.
The central urban area of Jinhua City was selected as the study region (Figure 1). This area is located at the confluence of the Dongyang, Wuyi, and Jinhua rivers and encompasses 15 internal tributary water systems. Due to incomplete flood control infrastructure, certain areas are at considerable risk regarding flood prevention and drainage safety, making it a representative region for urban water system studies. The central urban area covers 280 km2, with a built-up area of 112.98 km2 as of the end of 2021. The terrain is elevated in the north and south, with lower elevations in the center. The combined effects of flash floods from the northern mountains, basin-wide floods from the three rivers, and localized rainfall make the central urban area particularly vulnerable to significant flood impacts.
To analyze the joint risk of rainfall and river water levels, daily rainfall and water level data from Jinhua City between 2005 and 2022 were used to evaluate the combined impacts of rainfall and the Jinhua River water level on flooding in the central urban area. The Jinhua Station, located downstream in the Jinhua River Basin, serves as a control station with dual monitoring functions for both rainfall and water level. Historical rainfall and water level data from Jinhua Station were primarily obtained from observation records provided by the Zhejiang Provincial Department of Water Resources. The annual maximum value method is commonly used in rainfall and flood frequency design sampling [33]. To ensure that significant rainfall events are not overlooked during years of heavy rainfall, this study identifies the corresponding daily maximum water level based on the maximum 24 h rainfall series from 2005 to 2022. Since the highest water level often occurs a few days after the maximum rainfall event, a three-day window following the maximum rainfall date was applied to adjust the daily water level and capture the highest value. This method was used to construct the rainfall and water level event series.
To simulate the runoff generation and concentration processes in the study area, the researchers established long-duration rainfall patterns. The model selects 24 h storm events corresponding to rainfall return periods of 2a, 5a, 10a, 20a, and 50a as the design rainfall. Based on local standards, the mean point rainfall values and the coefficient of variation (Cv) for different durations (10 min, 60 min, 6 h, and 24 h) were determined. Using a 10 min time step, rainfall distributions were calculated to derive the design rainfall for different return periods (Figure 2).
Terrain elevation data, including spatial coordinates and elevation information, form the foundation for analyzing urban pluvial flooding and water accumulation. This study utilized high-resolution digital elevation data (10 m) of Jinhua City’s central urban area, provided by the local surveying department. Both rivers and tributaries were incorporated into the model to enable coupled calculations of the drainage and river networks. Cross-sectional data in DWG files (AutoCAD, 2022 version) were used for modeling. Due to data limitations for certaintributaries, missing river sections were simplified as open channels or pipes during model construction.

2.2. Copula-Based Joint Distribution Model

2.2.1. Marginal Distribution Function and Joint Distribution Function

The marginal distribution function describes the univariate distribution characteristics of each variable. In this study, seven distribution functions—gamma, generalized extreme value, generalized Pareto, logistic, lognormal, normal, and Weibull—were utilized to fit the marginal distributions of historical rainfall and water level data.
After identifying the optimal marginal distribution functions for rainfall and water level, a joint probability distribution function was constructed. A copula function effectively integrates the correlation strength and dependency structure between random variables, allowing for accurate risk probability evaluation under various combinations of variables. A copula function is not constrained by the form of the marginal distributions.
A copula function is a multivariate joint distribution function defined on the domain [0,1] with uniform marginal distributions [34]. According to Sklar’s theorem, if F x 1 , , x n is an n-dimensional joint distribution function and F 1 x 1 , , F n x n are its corresponding univariate marginal distribution functions, and if these marginal distribution functions F 1 , , F n are continuous, then there exists a unique copula function C u 1 , , u n such that F x 1 , , x n = C F 1 x 1 , , F n x n , where u i = F i x i represents the cumulative distribution function value of the univariate marginal distribution. Conversely, if C u 1 , , u n is an n-dimensional copula function, then F x 1 , , x n becomes the n-dimensional joint distribution function [35,36].

2.2.2. Goodness-of-Fit Criterion

The validation and evaluation of the joint distribution model involve assessing the marginal distribution models and the goodness-of-fit of the copula function being used. Marginal distribution validation focuses on evaluating the fitting performance of the selected model for individual variables, which serves as the foundation for constructing the copula function.
In this study, the Akaike Information Criterion (AIC) and Bayesian Information Criterion (BIC) were used to assess the goodness-of-fit of the marginal distribution functions, and the Kolmogorov–Smirnov (K-S) test was applied to compare the sample distribution with the theoretical distribution [37,38,39]. Additionally, root mean square error (RMSE), Nash–Sutcliffe efficiency (NSE), AIC, and BIC metrics were applied to evaluate the goodness-of-fit of the copula function. The AIC and BIC consist of two components: the deviation of the joint distribution fit and the instability introduced by the number of parameters in the joint distribution function [15]. Lower AIC and BIC values indicate better model performance (Equations (1) and (2)). RMSE and NSE are commonly used metrics in model evaluation [40]. RMSE measures the deviation between predicted and observed values, with a smaller RMSE indicating higher accuracy. NSE ranges from −∞ to 1, with values closer to 1 indicating better model performance (Equations (4) and (5)).
The AIC is defined as [39]:
A I C = 2 k 2 ln L
The BIC is defined as [41]:
B I C = k ln n 2 ln L
where k is the number of model parameters, n is the sample size, and L is the likelihood function.
For the sample X1, X2, …, Xn, the K-S statistic Dn is defined as per Equation (3):
D n = max 1 i n | F ( X i ) i n |
where F X i is the theoretical cumulative distribution function value at the sample point X i , and i n is the empirical distribution function value at the ordered sample point X i . If D n exceeds a critical value, the null hypothesis is rejected, indicating a significant difference between the sample and the theoretical distribution.
The RMSE formula is:
R M S E = 1 n i = 1 n ( y i y ^ i ) 2
The NSE formula is:
N S E = 1 i = 1 n ( y i y ^ i ) 2 i = 1 n ( y i y ¯ ) 2
where y i is the observed value, y ^ i is the predicted value, y ¯ is the mean of the observed values, and n is the sample size [9].

2.2.3. Flood Risk Probability Calculation

The risk probability model, based on a copula function, enables a quantitative and intuitive evaluation of the probability distribution for multiple disaster-causing factors exceeding specific thresholds, or for a single disaster-causing factor exceeding a specific threshold [42]. By calculating the joint risk probability and co-occurrence risk probability of rainfall and river water level, the compound disaster risk of rainfall–flood coincidence in the central urban area of Jinhua City can be quantitatively assessed. Joint risk probability refers to the probability that either the rainfall or the water level exceeds a specific threshold, while the co-occurrence risk probability represents the probability that both the rainfall and the water level simultaneously exceed specific thresholds.
According to the definition of the copula function, the formula for the two-dimensional joint distribution is expressed as Equation (6):
F x , y = P X x , Y y = C F X x , F Y y = C u , v
The joint risk probability is defined as Equation (7):
P X > x Y > y = 1 C F X x , F Y y = 1 C u , v
The co-occurrence risk probability is defined as Equation (8):
P X > x Y > y = 1 F x x F y y + C F x x , F y y = 1 u v + C u , v
where X is the rainfall; Y is the water level; x and y are the pre-specified threshold values of the rainfall and water level, respectively; u represents the marginal distribution function of the rainfall ( u = F x x ) ; v represents the marginal distribution function of the river water level ( v = F y y ) ; and C u , v is the joint distribution copula function of the rainfall and the river water level [43].

2.3. Urban Inundation Model

2.3.1. InfoWorks ICM

InfoWorks ICM (ICM) is a highly integrated modeling software developed by Wallingford Software in the UK. It includes various modules, such as rainfall–runoff, sewer network hydraulics, river hydraulics, 2D urban flood inundation, real-time control, and structures [44]. ICM utilizes GPU parallel computing technology to enhance the performance of the 2D hydrodynamic module. Moreover, it offers robust data pre-processing and post-processing capabilities and integrates seamlessly with mainstream software such as ArcGIS and AutoCAD.
Urban flood simulation in ICM typically involves hydrological and hydrodynamic modeling, similar to other software such as SWMM, PCSWMM, and MIKE. The study area is divided into multiple subcatchments, and runoff calculations are performed based on their spatial division and distinct runoff generation characteristics. ICM offers a variety of runoff models, including Horton, Green-Ampt, SCS, and PDM, as well as flow routing models such as SWMM, SCS Unit, and Wallingford. The version of the ICM model used in this study is 2021.

2.3.2. Model Setup

The ICM software was used to construct a one-dimensional river model, a two-dimensional surface model, and an underground pipe network drainage model for the central urban area of Jinhua. These models were coupled to analyze the distribution of waterlogging and flooding risks in the basin. In ICM, the pipe network model was coupled with the river model primarily through the pipe network outlets to simulate the river water level’s top support or backflow effects on the pipe network. The pipe network model was coupled with the surface model through check wells and surface units to simulate the drainage performance of the pipe network and the overflow inundation process. Additionally, the river model was coupled with the surface model via embankments to simulate the embankment flooding process. Furthermore, it was essential to define the hydraulic calculation boundaries for the river model. In this study, the upstream boundary primarily represents the flood volume from northern mountain runoff, while the downstream boundary conditions correspond to the terminal water level under various return periods.
Based on the characteristics of drainage facilities and the requirements for modeling data, pipelines and manholes were simplified. The final model consisted of 18,781 nodes and 18,290 pipe connections. Drainage zones were manually delineated by integrating the distribution of simplified pipelines and manholes with flow convergence, roads, rivers, and terrain. Additionally, Thiessen polygons were generated from the manholes to define subcatchments, resulting in 18,186 subcatchment units. The river modeling requirements in the ICM model were addressed by importing river terrain data, cross-sectional data, and riverbank data to construct the foundational river flow-routing model.
Using terrain elevation data (Figure 3a), a triangulated irregular network (TIN) model was constructed to analyze and simulate urban flood risks, including waterlogging locations and inundation depths. A more refined grid approach was applied to roads when constructing the surface inundation model, while also accounting for the obstructive effects of buildings on stormwater runoff (Figure 3b). In summary, a coupled 1D–2D inundation model for the central urban area of Jinhua was developed (Figure 3c). This model enables the simulation of flood events under various combinations of rainfall and water level.

2.4. Compound Impact of Rainfall and River Water Level

2.4.1. Regional Division of Disaster Factors

To determine the contribution of disaster-causing factors in the study area, the flood-prone region can be divided into different zones. In studies focused on coastal areas, regions are often classified into hydrological zones, transitional zones, and tidal zones [45,46,47], with a water level difference of 0.01 m used as the classification threshold [48]. To evaluate the spatial distribution characteristics of the disaster effects caused by rainfall and river water level, this study used simulation results under the 50a return period for both rainfall and water level as an example (Table 1). Regions where rainfall is the primary hydrological factor causing disasters are defined as rainfall-affected zones, regions where river water level dominates are defined as water level-affected zones, and regions jointly influenced by both factors are defined as compound-affected zones (Equations (9)–(11)).
Rainfall-affected zone:
D e p t h 3 D e p t h 1 < 0.01
Water level-affected zone:
D e p t h 3 D e p t h 2 < 0.01
Compound-affected zone:
D e p t h 3 D e p t h 1 0.01 D e p t h 3 D e p t h 2 0.01
where D e p t h refers to the maximum water depth obtained from the model simulation.

2.4.2. Amplification Factor

Different combinations of rainfall and river water level may lead to unique flood risk amplifications [49]. To characterize the extent of flood amplification caused by these combinations, this study references and extends the concept of flood amplification factors proposed by Gao et al. [50]. The amplification effects on inundation extent and depth are measured using A F a r e a and A F d e p t h , respectively (Equations (12) and (13)). The formulas are as follows:
A F d e p t h = D r a i n + w a t e r / D r a i n
where D r a i n + w a t e r represents the maximum inundation depth under the combined effects of rainfall and river water level, and D r a i n represents the maximum inundation depth under the influence of rainfall alone.
A F a r e a = A r a i n + w a t e r / A r a i n
where A r a i n + w a t e r represents the inundation area under the combined effects of rainfall and river water level, and A r a i n represents the inundation area under the influence of rainfall alone.

3. Results and Discussion

3.1. Joint Probability Distribution Model Fitting

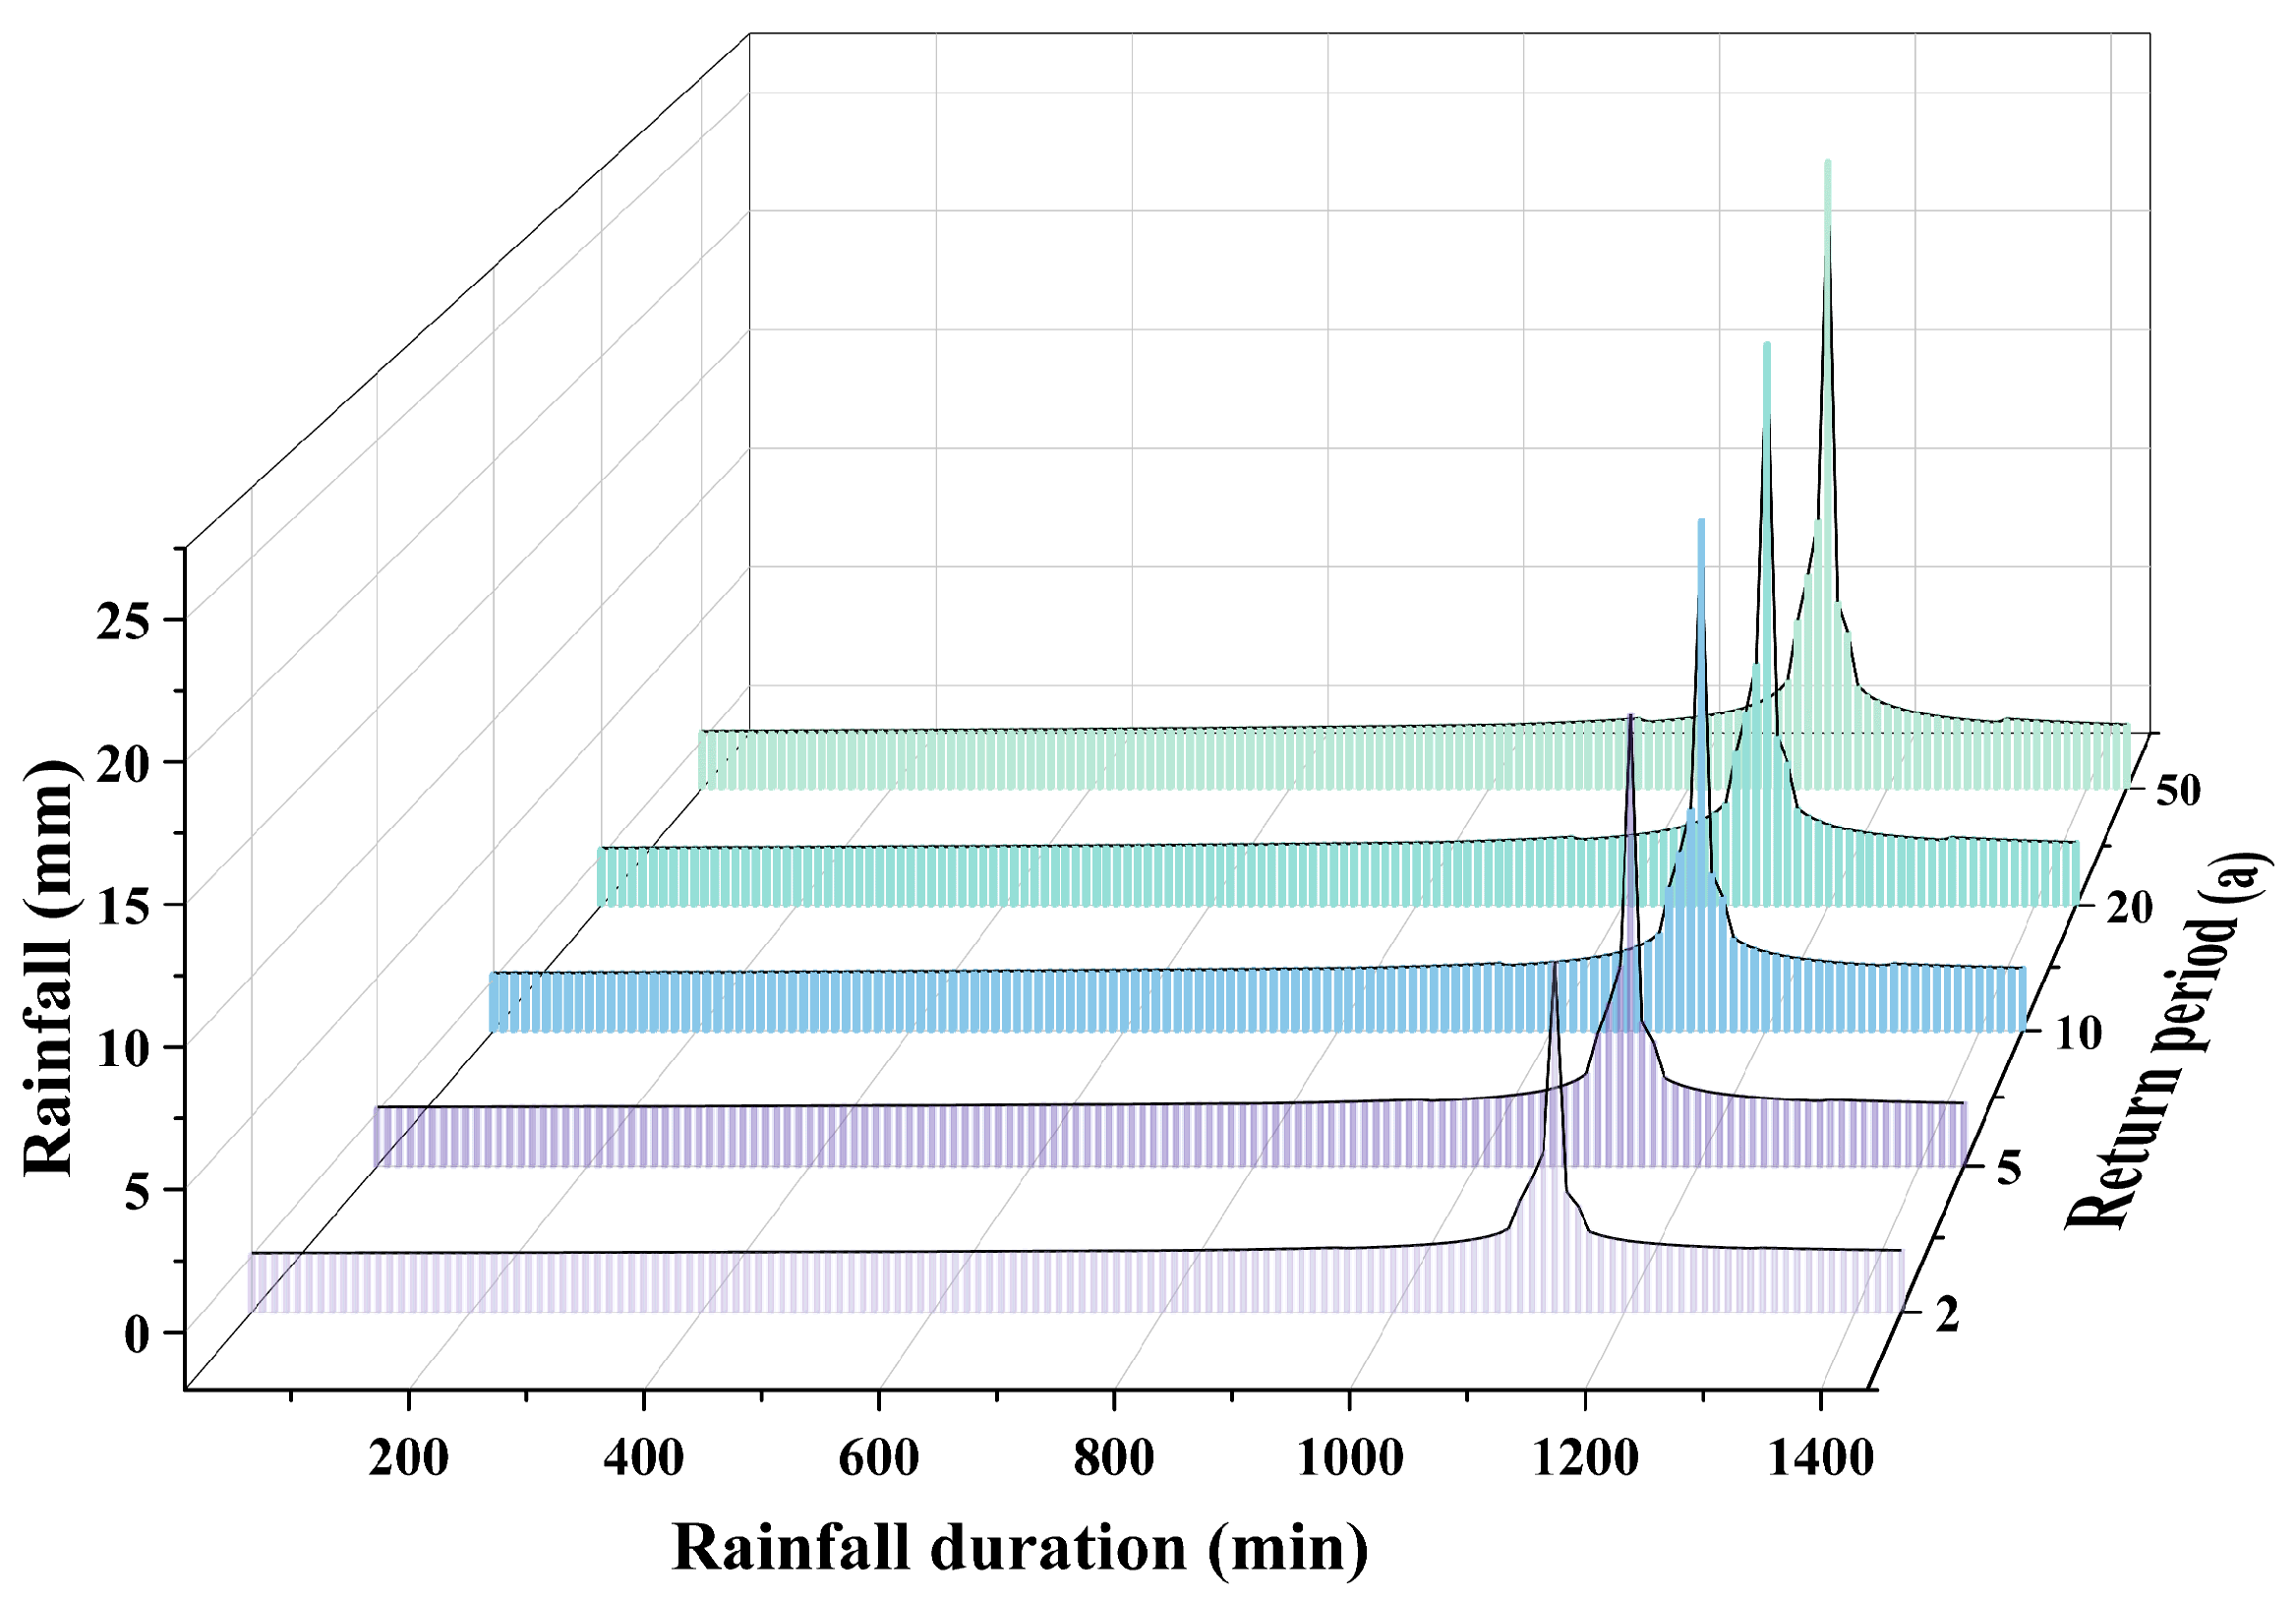
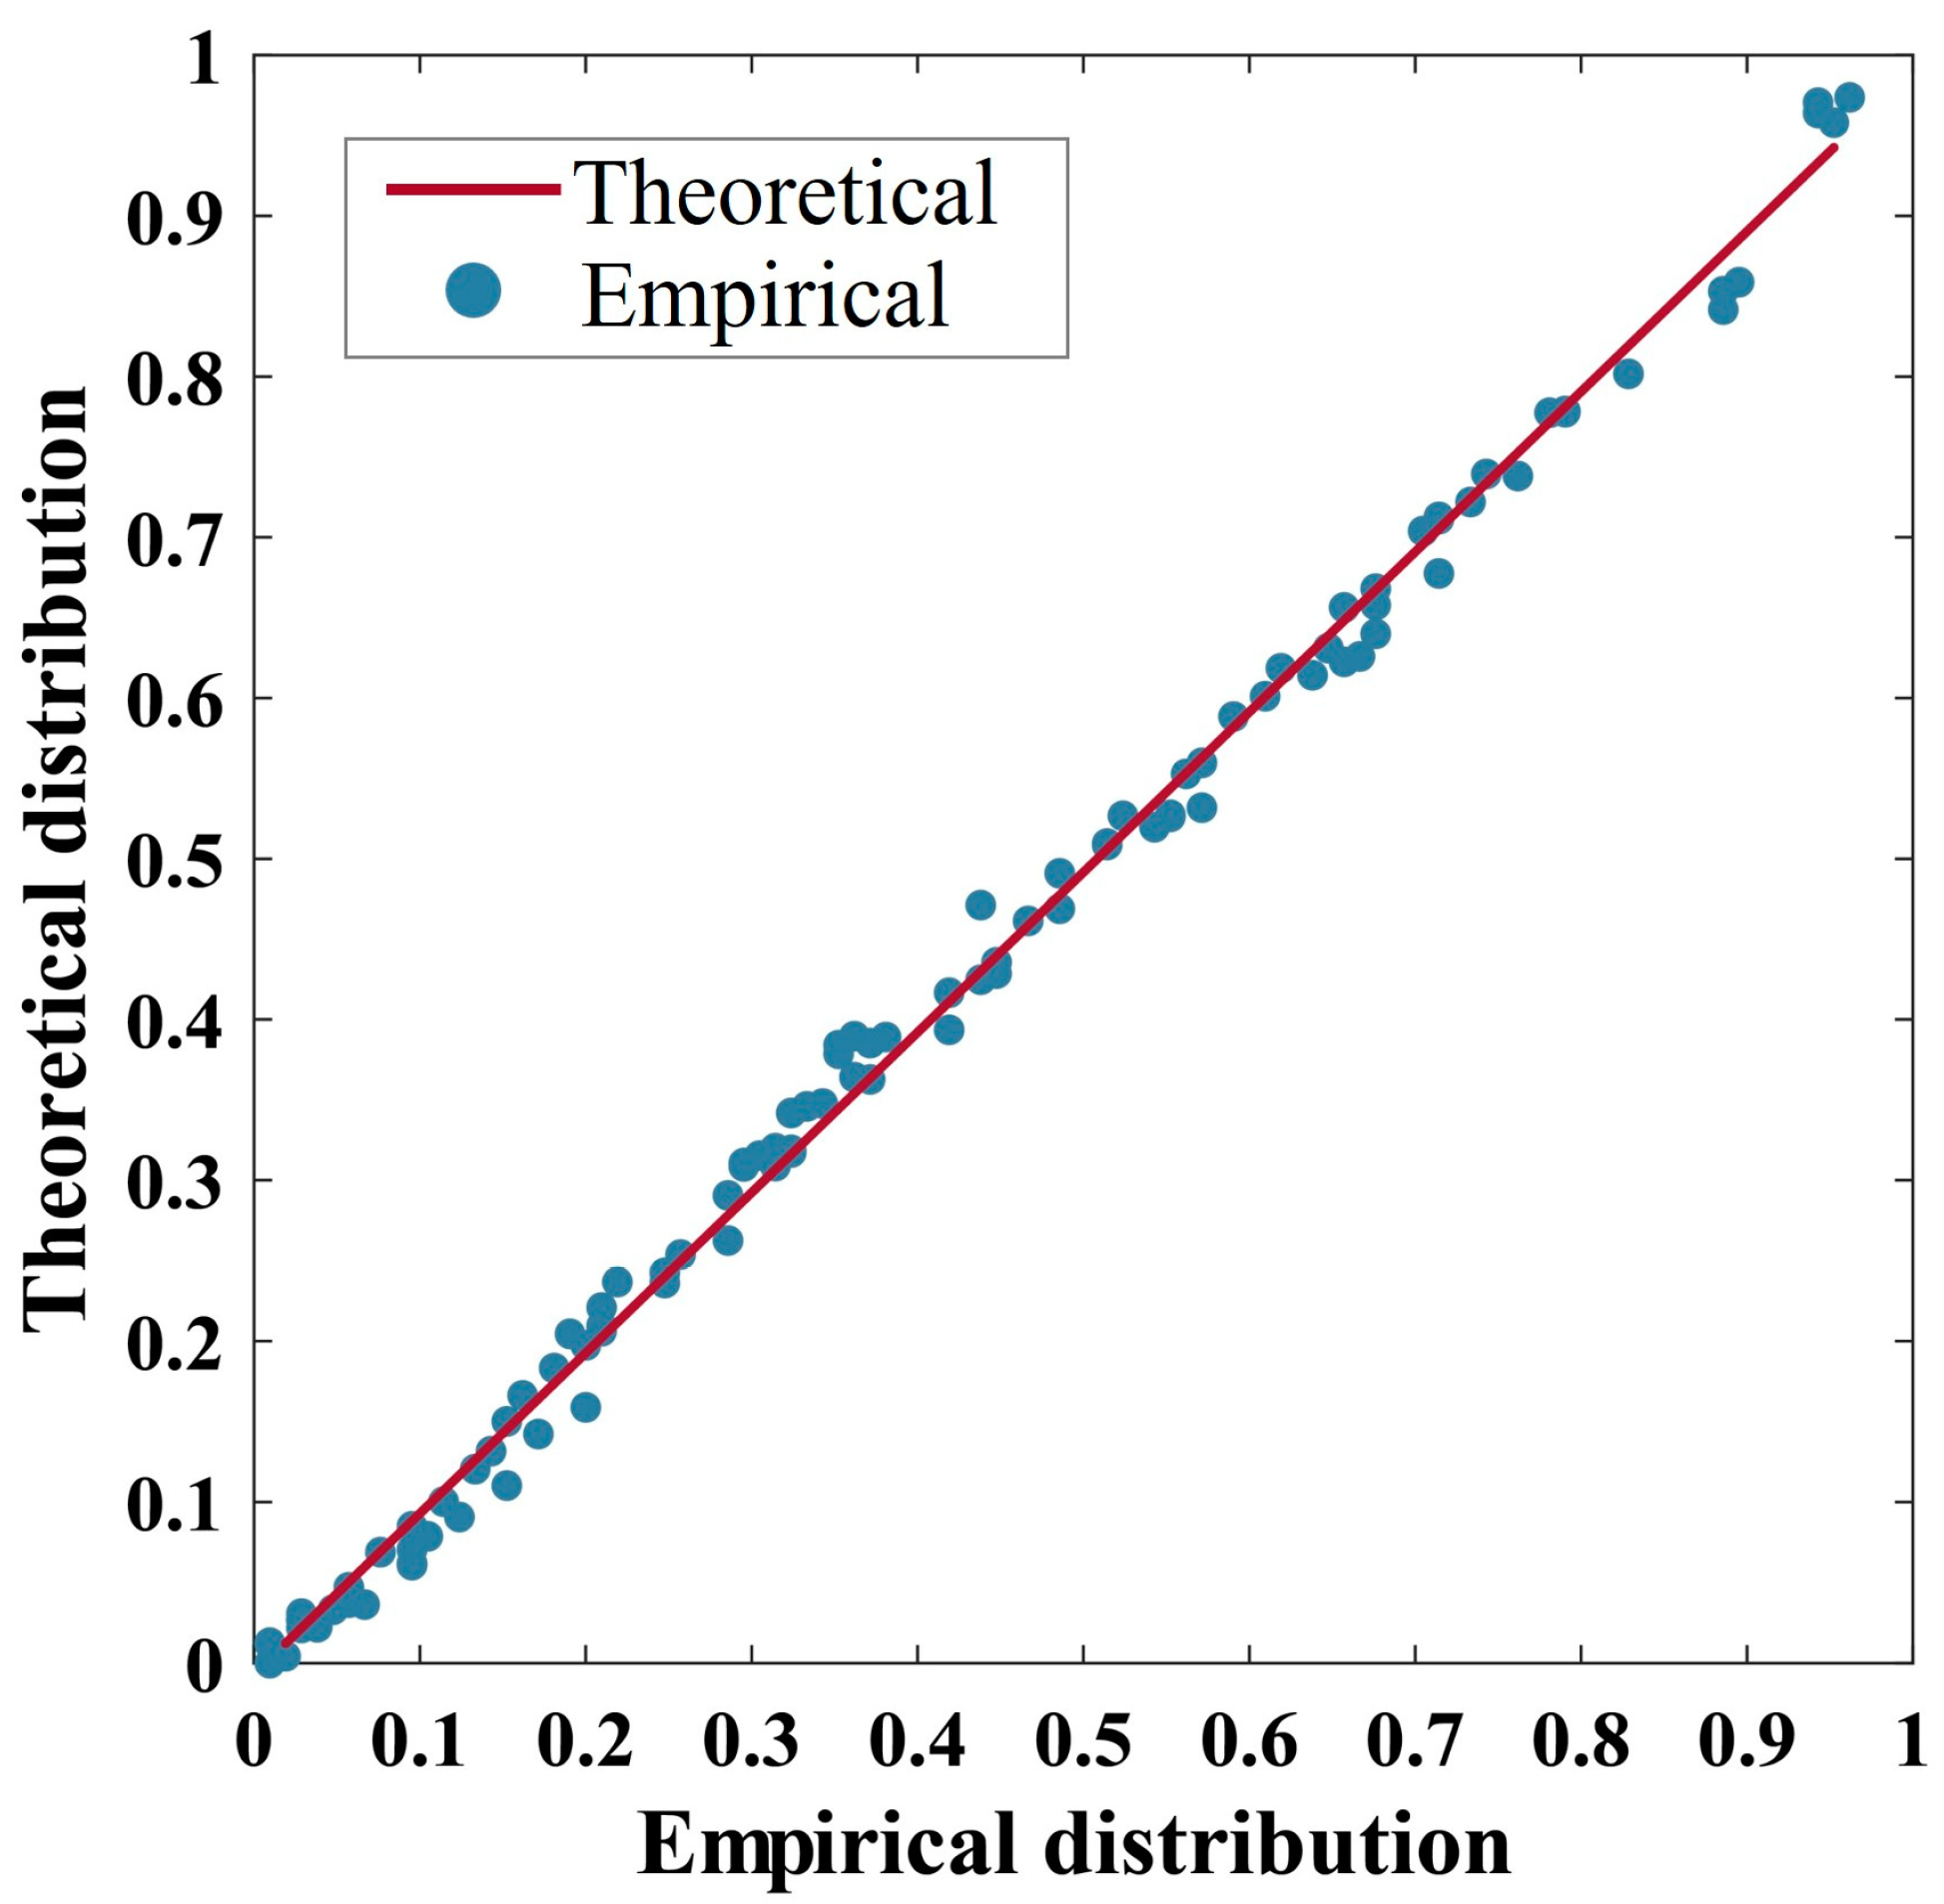
3.1.1. Marginal Probabilities

A correlation analysis of the rainfall and water level series from 2005 to 2022 yielded a Kendall rank correlation coefficient of 0.58, which is significant at the p < 0.05 level. This indicates a positive correlation between rainfall and water level, where an increase in rainfall is typically accompanied by a rise in water level. These findings emphasize that analyzing the disaster-causing effects of rainfall or water level individually cannot accurately assess the probability of flood disasters.
Before constructing the joint distribution of rainfall and extreme water levels, the marginal distribution functions were first optimized and established. In this study, seven marginal distribution functions—gamma, generalized extreme value, generalized Pareto, logistic, lognormal, normal, and Weibull—were applied to fit the rainfall and water level series.
The results are presented in Table 2. For the rainfall series, the gamma distribution demonstrates the best goodness-of-fit based on AIC and BIC values. For the water level series, the generalized Pareto distribution exhibits the best performance in terms of AIC and BIC, and the K-S statistic for these two marginal distribution functions is minimized. Consequently, the gamma distribution was selected as the marginal distribution function for rainfall, while the generalized Pareto distribution was chosen as the marginal distribution function for water level.

3.1.2. Best-Fit Copula Selection

After determining the optimal marginal distribution functions for rainfall and water level, this study employed nine copula functions—Plackett, Frank, Gumbel, t, AMH, Gaussian, Joe, FGM, and Clayton—to construct the joint distribution of rainfall and water levels (Table 3). By comparing four evaluation metrics across the nine copula functions, the results revealed that the Plackett copula performed best, with AIC and BIC values of −96.7726 and −94.1187, respectively, which were significantly lower than those of the other candidate copula functions. This indicates that the Plackett copula model achieved an optimal balance between model complexity and fit accuracy. In contrast, although the Clayton copula, t copula, and Gaussian copula showed a slight advantage in terms of RMSE and NSE, their higher AIC and BIC values suggest greater model complexity, which could increase the risk of overfitting.
Figure 4 presents a comparison between the empirical and theoretical frequencies. The blue scatter points are predominantly aligned along the red 45° line, indicating a strong consistency between the theoretical distribution and the observed data. This further supports the conclusion that the marginal distribution function provides an excellent fit for the marginal distributions of each feature variable. As a result, the Plackett copula effectively captures the joint distribution characteristics of the rainfall–water level series from 2005 to 2022.

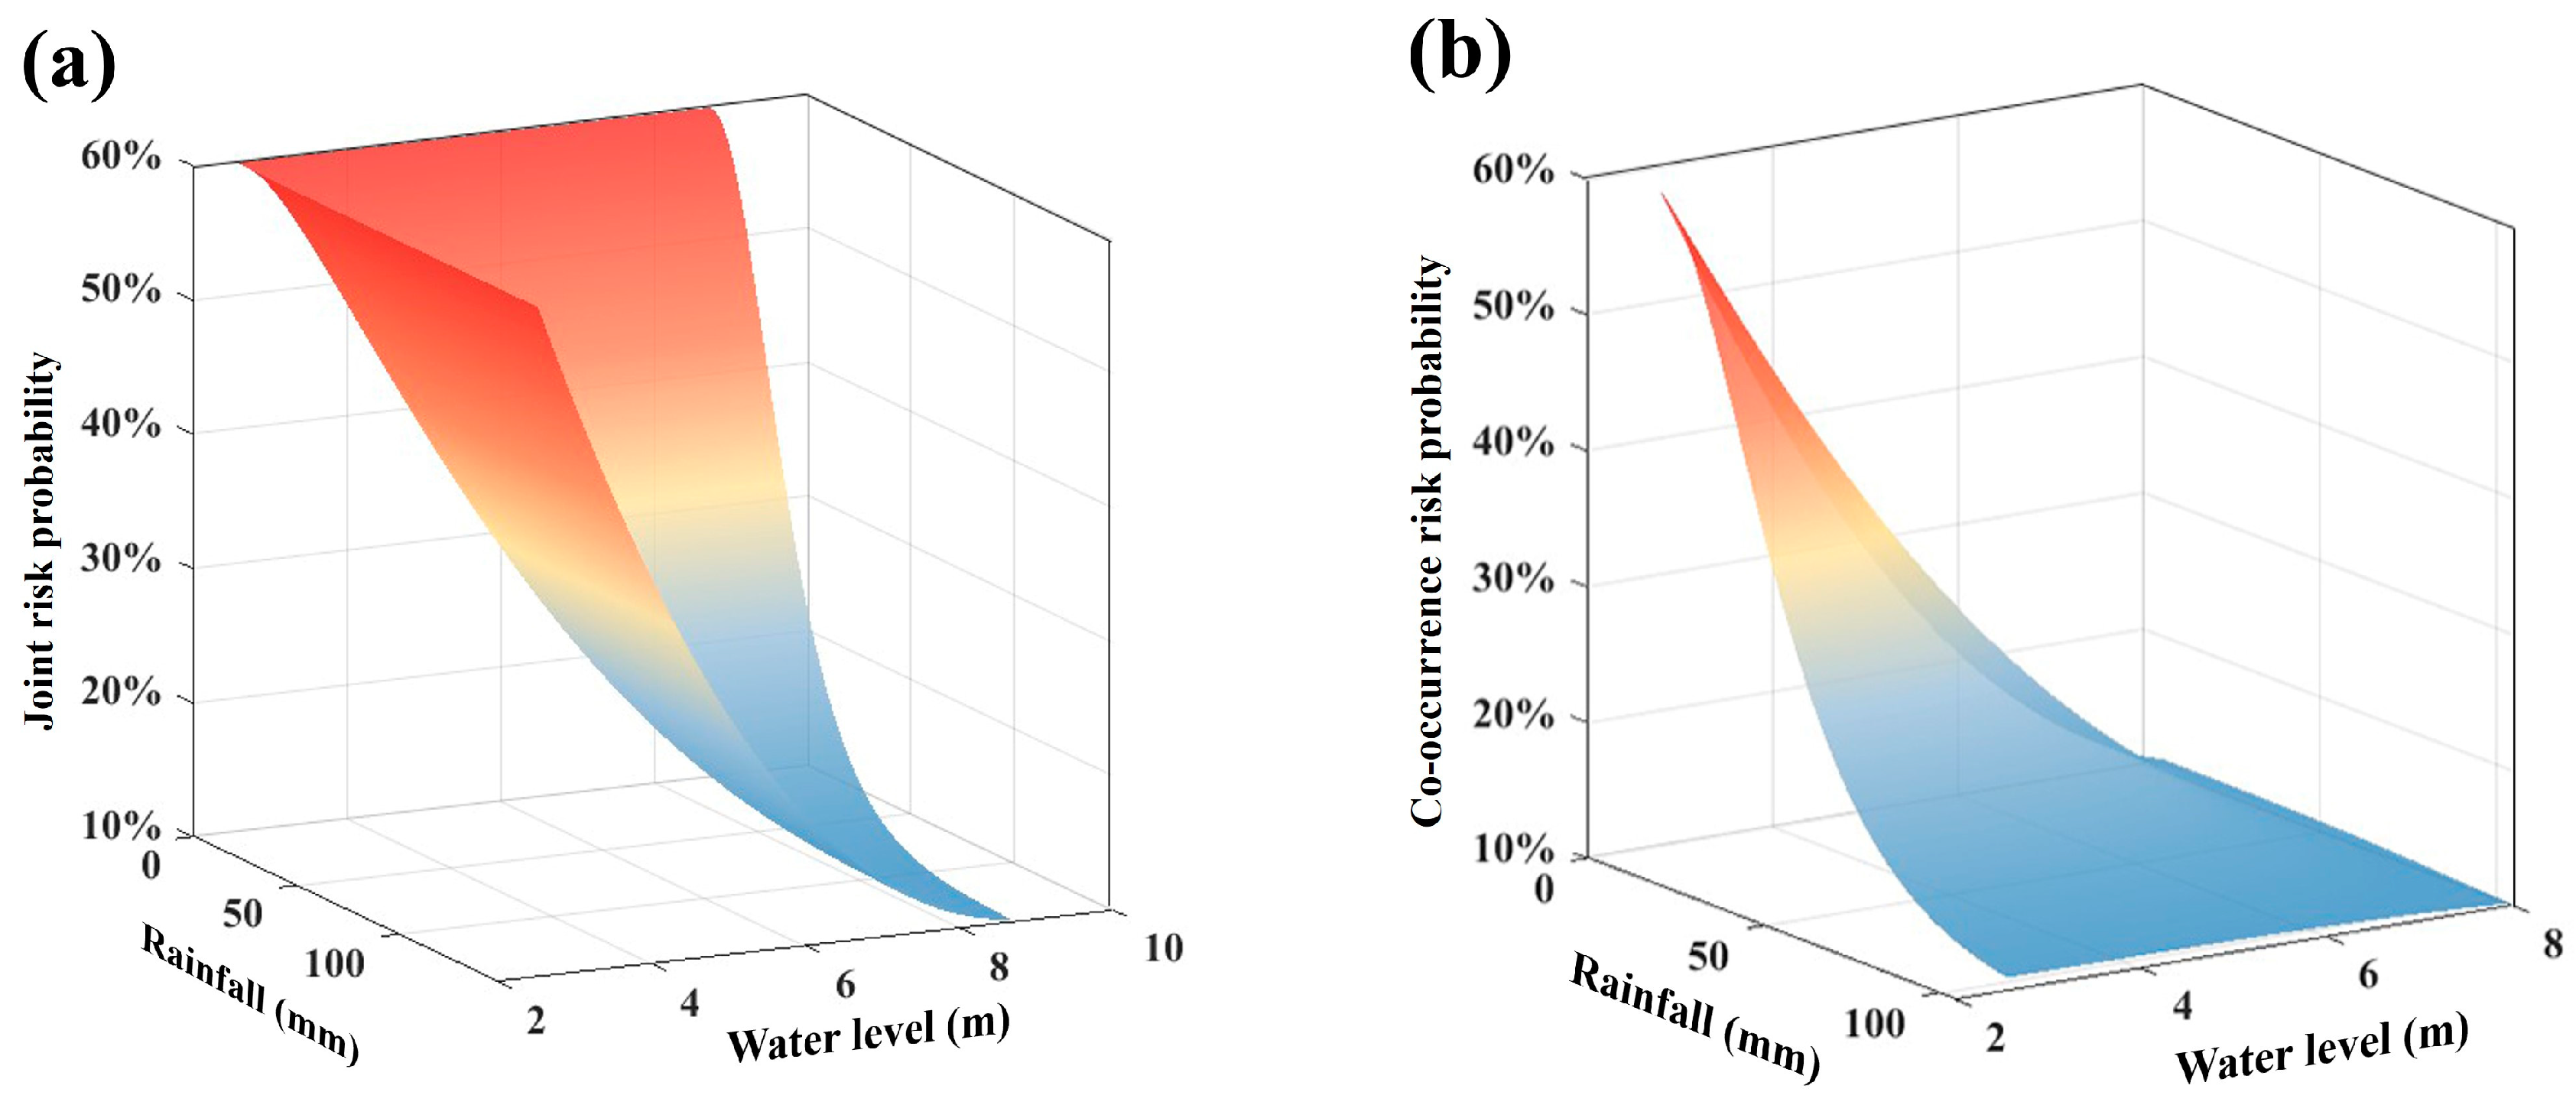
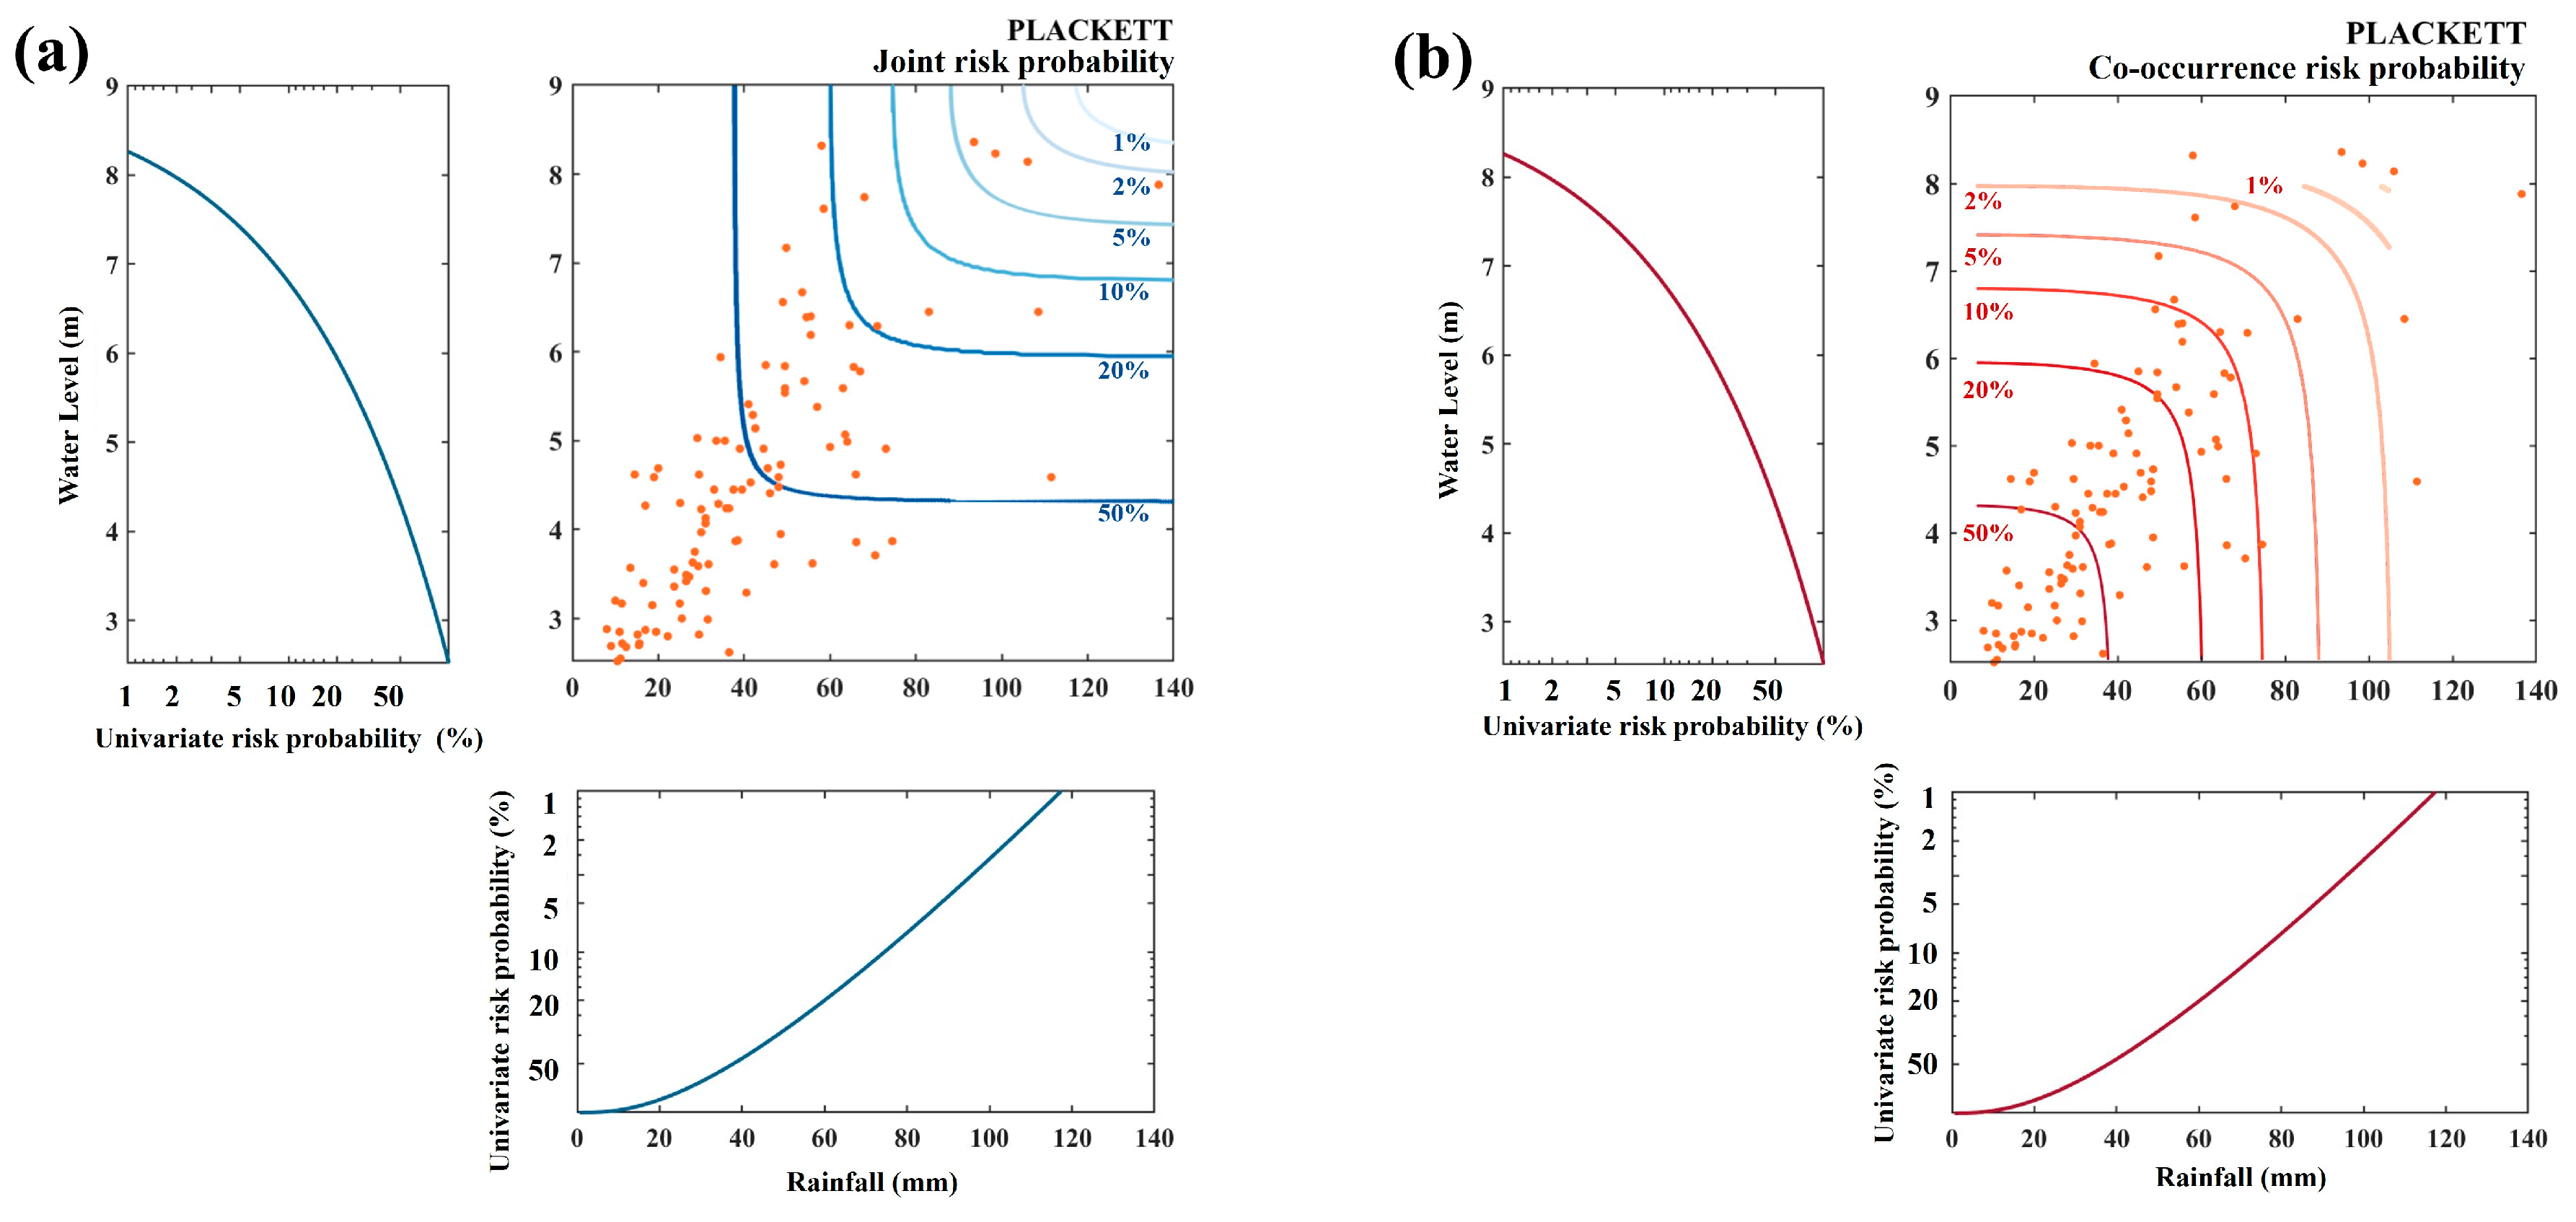
3.2. Joint Flood Risk Probability Analysis

From the 3D view of the risk probability distribution (Figure 5), the red areas represent higher risk rates, while the blue areas indicate lower risk rates. It can be observed that both the joint risk probability and the co-occurrence risk probability are higher under scenarios of low rainfall and low water level, with the high-risk range for joint events being more extensive. Figure 6 presents the distributions of univariate risk probabilities for rainfall and water level, as well as the joint and co-occurrence risk probabilities. When the risk probability is 2%, the univariate rainfall and water level are 105.0 mm and 8.0 m, respectively. The joint risk probability corresponds to rainfall and water level values of 115.9 mm and 8.2 m, respectively, while the co-occurrence risk probability corresponds to rainfall and water level values of 80.3 mm and 7.6 m, respectively. Alternatively, when rainfall and water level are 105.0 mm and 8.0 m, respectively, the univariate risk probability is 2%, the joint risk probability is 3.55%, and the co-occurrence risk probability is 0.45%.
The joint risk probability increases the likelihood of danger under the same design value combinations, resulting in an overestimation of the calculated risk probability. Under the same risk probability level, the design values based on the joint risk probability are higher. Conversely, the co-occurrence risk probability decreases the likelihood of danger for the design values, leading to an underestimation of the calculated risk probability. The analysis reveals that for designs based on the joint risk probability derived from the copula function, the design values for rainfall and water level are both higher than those obtained through univariate analysis. In contrast, for designs based on the co-occurrence risk probability, the design values for rainfall and water level are both lower than those obtained through univariate analysis.
As shown in Figure 7, the co-occurrence risk probability for rainfall and water level combinations is significantly smaller than the joint risk probability. Under scenarios with univariate risk probabilities of 20%, 10%, 5%, 2%, and 1%, the corresponding joint risk probabilities are 2.11, 2.91, 4.25, 7.83, and 13.47 times greater than the co-occurrence risk probabilities, respectively. Although both the co-occurrence and joint risk probabilities for rainfall and water level combinations decrease, the gap between them continues to widen.
Based on the analysis presented above, it can be concluded that the joint distribution expands the hazardous event region. Specifically, the range of events that meet the condition of “rainfall or water level exceeding dangerous thresholds” is wider, leading to an increased probability of hazard occurrence for the same design value combinations. As a result, the calculated risk probability is likely to be overestimated. At the same risk probability level, the design values derived from the joint risk probability are larger, ensuring a higher level of safety in the design. In contrast, the co-occurrence risk probability focuses on the simultaneous occurrence of two events, resulting in a smaller hazardous event region compared to the joint risk probability, which leads to a lower estimated probability of hazard occurrence. Therefore, under equivalent risk conditions, the design values derived from the co-occurrence risk probability are comparatively smaller.
The analyses of the joint risk probability and the co-occurrence risk probability clearly demonstrate the significant impact of interactions between flood-driving factors on design values. Ignoring the interaction between rainfall and water level could lead to engineering structures designed using univariate design values failing to meet the expected safety standards. Similar findings have been reported in previous studies, suggesting that analyses based solely on univariate data may underestimate the probability of hazardous events [28,51,52,53]. Therefore, in practical engineering design, it is essential to fully account for the interdependence among various flood-causing factors. Neglecting any variable may compromise flood risk management and negatively impact flood control engineering planning and design.

3.3. Simulations of the Compound Impact of Rainfall and Water Level

3.3.1. Model Calibration and Validation

The calibration and validation of the ICM model were primarily conducted using hydraulic simulations of the pipe network and 2D surface models. Simulated ponding locations were compared with observed ponding points, and key parameters affecting the accuracy of the hydraulic model were systematically adjusted. Two representative rainfall events, measured in Jinhua City on 22 July 2023 and 16 August 2023, were used for 2D urban waterlogging simulations and model calibration. The simulated results were compared with field-investigated waterlogging points to assess and verify the model’s accuracy.
Parameter calibration was conducted using the short-duration, heavy rainfall event of 22 July 2023, which recorded a total rainfall of 129.5 mm. Model validation was performed using the persistent rainfall event of 16 August 2023, which recorded a total rainfall of 72.5 mm (Figure 8).
The validation process in this study aims to reveal the overall trends of the simulation results, with the objective of identifying patterns that can be universally applied to different scenarios in this research, rather than providing precise predictions. By comparing the simulated waterlogging points with actual waterlogging points, the model identifies the main flooded areas as pond surfaces, waterfront zones, and low-lying roads. Overall, the simulated waterlogged areas align well with the current waterlogging points (Figure 9), indicating that the model can realistically reflect the stormwater flooding process in various districts and can be used for further simulation and analysis. The parameters determined through calibration and verification are shown in Table 4.

3.3.2. Compound Flood Risk Assessment

Based on the 2D simulation results of the refined model, the surface inundation depth and extent were extracted. Figure 10 presents the maximum inundation depth maps for rainfall return periods of 2a, 5a, 10a, 20a, and 50a, with the rainfall return period being the sole variable and serving as the baseline scenario for subsequent analysis. Figure 11 shows the maximum inundation depth maps under different combinations of rainfall and water level return periods.
From the spatial distribution of waterlogging under the baseline scenario (Figure 10), the inundation extent increases as rainfall intensity rises; however, the maximum water depth caused by rainfall changes remains limited, primarily staying below 0.15 m. Areas with water depths exceeding 1.0 m are concentrated in the low-lying northern region of the study area. As the joint return period increases (Figure 11), both the inundation extent and depth exhibit a significant upward trend. Waterlogging in the southern part of Jinhua becomes more severe, and as the water level of the Jinhua River rises, the area with water depths exceeding 1.0 m continues to expand. The regions surrounding the water systems are the most severely affected, with waterlogging predominantly distributed along the southern bank of the Jinhua River and the banks of several tributaries. The findings of Gao et al. [50] also indicate that areas surrounding rivers are the most severely impacted due to overtopping and overflow. The uneven distribution of floodwaters near river channels is influenced by factors such as topography, proximity to the river channel, and the condition of levees. However, Ding et al. [54] concluded through model simulations and principal component analysis (PCA) that areas farther from water bodies are at a higher risk of urban flooding. The primary reason for this discrepancy lies in the fact that, in their studies, water bodies were considered the final outlet for rainfall. In areas farther from water bodies, rainwater must travel longer distances for discharge, leading to an increased surface retention time, which subsequently elevates the risk of urban flooding. Additionally, their model simulations did not set a higher flood level as a boundary condition, which means their results were less sensitive to changes in water levels.
Figure 12 illustrates the results of the disaster-affected area division presented in Section 2.4.1. The rainfall-affected zone encompasses an inundation area of 9.07 km2, the water level-affected zone spans 10.99 km2, and the compound-affected zone covers 15.79 km2. The rainfall-affected zone is located farther from water bodies, where rainwater must be discharged into rivers through multiple drainage pipelines. Due to the extended length of the drainage system and its relatively low design standards, the drainage network is prone to overloading under heavy rainfall conditions. Additionally, the absence of flood retention facilities in this zone further exacerbates urban flooding disasters. The water level-affected zone is primarily distributed along the Jinhua River, where the rise in the river’s water level significantly restricts the drainage capacity of inland areas. The backwater effect and reverse flow from the river exacerbate waterlogging in certain local areas. The compound-affected zone lies between the rainfall-affected zone and the water level-affected zone. This zone is influenced by both rainfall and the river water level, resulting in the largest inundation area. As shown in Figure 11, the regions with the greatest inundation depth are primarily concentrated in the compound-affected zone. Due to the combined effects of external flooding and heavy rainfall, the risk of water accumulation in this zone is significantly amplified.
Figure 13 quantifies the variation in inundation area. Under the baseline scenario, the inundation area ranges from 0.67% to 5.39%. However, when the 50a return period river water level is superimposed, the inundation area increases significantly, ranging from 8.98% to 12.80%. For different rainfall return periods (2a, 5a, 10a, 20a, 50a), compared to the baseline scenario, the inundation area increases by 1.57%, 2.08%, 2.23%, 2.24%, and 2.31%, respectively, when the 10a return period river flood level is added. When the river flood level increases from the 10a to the 20a return period, the inundation area further expands, with increments of 5.18%, 5.88%, 6.63%, 7.57%, and 8.80%, respectively. Overall, the inundation area exhibits a significant growth trend as the water level return period increases, although the growth rate remains relatively stable. Furthermore, the 10a return period river water level already causes significant obstruction at drainage outlets, impeding the smooth discharge of rainwater into the river. When the water level exceeds the 10a return period, the drainage capacity becomes further constrained, resulting in rapid surface runoff accumulation and a significant increase in the inundation area. This highlights that the combined impact of high river water level and rainfall substantially amplifies the regional waterlogging risk.
The AF is used to evaluate the increased flood risk under combined scenarios of rainfall and river water level. Using the method outlined in Section 2.4.2, two indicators, A F a r e a and A F d e p t h were calculated, and the results are presented in Figure 14. Coefficients close to 1 indicate that the contribution of the river water level is relatively small. Both A F a r e a and A F d e p t h reached their maximum values under the scenario of a 2a return period rainfall combined with a 50a return period water level, at 13.40 and 2.04, respectively. Conversely, the minimum values occurred under the scenario of a 50a return period rainfall combined with a 10a return period water level, at 1.13 and 1.49, respectively. The combined effect of rainfall and water level demonstrates a significant nonlinear amplification effect on the extent of inundation. As the rainfall return period increases, the amplification factors decrease. However, when comparing different water level return periods, the amplification factors under the 50a return period water level were generally higher than those under the 10a return period water level. This suggests that an increase in the water level return period significantly enhances the combined effect of rainfall and water level, indicating that high water level events contribute more prominently to the amplification effect. The study by Gao et al. [50] also indicates that, under certain river water level conditions, the flood amplification factor decreases as rainfall intensity increases. This is because the relative contribution of rainfall increases with higher rainfall intensity. However, even when heavy rainfall predominates, the threat posed by high water levels should not be overlooked. Compared to the maximum inundation depth, the amplification effect on the inundation extent demonstrates a more noticeable variation trend.
The findings of this study indicate that the impact of river water level on flooding exceeds that of rainfall. However, in previous studies, Wang et al. [9] demonstrated that urban flooding is primarily influenced by heavy rainfall rather than river water level. The primary reason for these differences in research conclusions can be attributed to variations in datasets. Due to differing flood control and drainage standards across regions, the design rainfall used in Wang et al. [9] was larger than that in this study, making the impact of rainfall more pronounced in their simulations. Furthermore, the outcomes of this study are also closely related to the geographic location and hydrological conditions of the study area. Situated downstream, Jinhua’s central urban area is significantly affected by backwater effects from the Jinhua River during flooding events. The combined effect of upstream inflow and high downstream water level results in water accumulation that exceeds the carrying capacity of the inner river system. During external flooding of the Jinhua River, the water levels of the internal urban waterways rise significantly due to the surging floodwaters, creating a complex scenario where ’external flooding and internal waterlogging’ are intertwined. Rainwater from local heavy rainfall must be discharged through the inner river system. However, during periods of high river level, the backwater effect significantly reduces the drainage capacity of the inner rivers. Additionally, according to the current survey of the study area, the urban stormwater drainage system is inadequate, and the flow capacity of some inland rivers does not meet the five-year return period flood protection standard. As a result, these areas are more susceptible to becoming high-risk zones during compound flood events.
The integration of risk probabilities with the urban flood model reflects the risk characteristics of compound flooding in the study area. In future urban planning, the design of drainage systems and flood control infrastructure should also consider the combined effects of rainfall and river water levels.

3.4. Limitations and the Future Work

This study has certain limitations that can be overcome in future research. Given the uncertainties surrounding future rainfall patterns and urban development trajectories, urban spatial planning is increasingly recognized as a critical component of urban risk management. Hydraulic structures, such as dams, may have dual effects on flood propagation. While they can prevent floods from spreading to neighboring areas, they may also increase flood risks downstream. Green infrastructure and permeable facilities can also alleviate flooding by storing and infiltrating rainwater [30,55,56]. Future research could incorporate the effects of hydraulic structures into models and, through layout optimization and engineering scheduling, implement effective disaster mitigation measures. Additionally, combining socio-economic vulnerability assessments with flood numerical models would help identify high-risk and priority control areas, supporting the implementation of refined disaster mitigation measures in inland cities.

4. Conclusions

This study focuses on the inland city of Jinhua, China, employing a framework that integrates copula-based multivariate statistical analysis with ICM numerical hydrodynamic modeling to assess the compound flooding risks arising from extreme rainfall and high river water level. Furthermore, the study investigates the mechanisms and impacts of the combined effects of these two disaster-causing factors. The main conclusions are as follows:
(1) The combined effects of extreme rainfall and high water levels amplify flood risks. When the univariate risk probabilities for both rainfall and water level are 2%, the joint risk probability increases to 3.55%. Although the probability of heavy rainfall and high water levels occurring simultaneously is relatively low, neglecting their combined effects can lead to an underestimation of flood hazards.
(2) The compound effects of high water levels and extreme rainfall significantly increase the regional flooding risks. The influence of disaster-causing factors exhibits clear spatial variation. Moreover, a high water level has a greater impact on regional flooding than rainfall, making it the primary disaster-causing factor in the study area.
(3) The contribution of disaster-causing factors was evaluated using amplification factors. As the return period of rainfall increases, the amplification factor decreases. However, the contribution of high water level events to the amplification effect becomes more pronounced. Compared to the maximum inundation depth, the amplification effect on inundation extent is more pronounced.
The framework and conclusions of this study provide valuable insights for other inland cities with similar hydrological characteristics, assisting in the assessment and management of compound flood risks.

Author Contributions

W.L.: conceptualization, methodology, formal analysis, writing—original draft. C.W.: methodology, data curation, formal analysis. Y.G. and J.M.: methodology, writing—review & editing. S.H.: data curation, formal analysis. X.D.: conceptualization, methodology. H.S.: conceptualization, methodology. All authors have read and agreed to the published version of the manuscript.

Funding

This research was funded by the National Natural Science Foundation of China (No. 52270085) and the Project of Construction and Support for High-Level Innovative Teams of Beijing Municipal Institutions (BPHR20220108).

Data Availability Statement

The data presented in this study are available on request from the corresponding author.

Conflicts of Interest

Author Junfeng Mo was employed by the company Shanghai Municipal Engineering Design Institute (Group) Co., Ltd. The remaining authors declare that the research was conducted in the absence of any commercial or financial relationships that could be construed as a potential conflict of interest.

References

  1. IPCC. Climate Change 2021: The Physical Science Basis; Cambridge University Press: Cambridge, UK, 2021. [Google Scholar]
  2. Escobar Carias, M.S.; Johnston, D.W.; Knott, R.; Sweeney, R. Flood disasters and health among the urban poor. Health Econ. 2022, 31, 2072–2089. [Google Scholar] [CrossRef] [PubMed]
  3. Ding, W.; Wu, J.; Tang, R.; Chen, X.; Xu, Y. A review of flood risk in China during 1950–2019: Urbanization, socioeconomic impact trends and flood risk management. Water 2022, 14, 3246. [Google Scholar] [CrossRef]
  4. Fang, J.; Wahl, T.; Fang, J.; Sun, X.; Kong, F.; Liu, M. Compound flood potential from storm surge and heavy precipitation in coastal China: Dependence, drivers, and impacts. Hydrol. Earth Syst. Sci. 2021, 25, 4403–4416. [Google Scholar] [CrossRef]
  5. Zhao, Z.; Huo, A.; Liu, Q.; Yang, L.; Luo, C.; Ahmed, A.; Elbeltagi, A. Assessment of urban inundation and prediction of combined flood disaster in the middle reaches of Yellow river basin under extreme precipitation. J. Hydrol. 2024, 640, 131707. [Google Scholar] [CrossRef]
  6. Zscheischler, J.; Westra, S.; Van Den Hurk, B.J.; Seneviratne, S.I.; Ward, P.J.; Pitman, A.; AghaKouchak, A.; Bresch, D.N.; Leonard, M.; Wahl, T. Future climate risk from compound events. Nat. Clim. Change 2018, 8, 469–477. [Google Scholar] [CrossRef]
  7. Chan, F.; Wang, Z.; Chen, J.; Lu, X.; Nafea, T.; Montz, B.; Adekola, O.; Pezzoli, A.; Griffiths, J.; Peng, Y. Selected global flood preparation and response lessons: Implications for more resilient Chinese Cities. Nat. Hazards 2023, 118, 1767–1796. [Google Scholar] [CrossRef]
  8. Tanaka, T.; Tachikawa, Y.; Ichikawa, Y.; Yorozu, K. Impact assessment of upstream flooding on extreme flood frequency analysis by incorporating a flood-inundation model for flood risk assessment. J. Hydrol. 2017, 554, 370–382. [Google Scholar] [CrossRef]
  9. Wang, X.; Xia, J.; Zhou, S.L.; Deng, S.; Li, Q. Assessment of the joint impact of rainfall and river water level on urban flooding in Wuhan City, China. J. Hydrol. 2022, 613, 128419. [Google Scholar] [CrossRef]
  10. Huang, W.; Ye, F.; Zhang, Y.J.; Park, K.; Du, J.; Moghimi, S.; Myers, E.; Pe’eri, S.; Calzada, J.R.; Yu, H. Compounding factors for extreme flooding around Galveston Bay during Hurricane Harvey. Ocean Model. 2021, 158, 101735. [Google Scholar] [CrossRef]
  11. Hsiao, S.-C.; Chiang, W.-S.; Jang, J.-H.; Wu, H.-L.; Lu, W.-S.; Chen, W.-B.; Wu, Y.-T. Flood risk influenced by the compound effect of storm surge and rainfall under climate change for low-lying coastal areas. Sci. Total Environ. 2021, 764, 144439. [Google Scholar] [CrossRef]
  12. Shi, P.; Ye, T.; Wang, Y.; Zhou, T.; Xu, W.; Du, J.; Wang, J.A.; Li, N.; Huang, C.; Liu, L. Disaster risk science: A geographical perspective and a research framework. Int. J. Disaster Risk Sci. 2020, 11, 426–440. [Google Scholar] [CrossRef]
  13. Wang, Z.; Chen, Y.; Zeng, Z.; Li, R.; Li, Z.; Li, X.; Lai, C. Compound effects in complex estuary-ocean interaction region under various combination patterns of storm surge and fluvial floods. Urban Clim. 2024, 58, 102186. [Google Scholar] [CrossRef]
  14. Zeng, Z.; Lai, C.; Wang, Z.; Chen, Y.; Chen, X. Future sea level rise exacerbates compound floods induced by rainstorm and storm tide during super typhoon events: A case study from Zhuhai, China. Sci. Total Environ. 2024, 911, 168799. [Google Scholar] [CrossRef]
  15. Sadegh, M.; Moftakhari, H.; Gupta, H.V.; Ragno, E.; Mazdiyasni, O.; Sanders, B.; Matthew, R.; AghaKouchak, A. Multihazard scenarios for analysis of compound extreme events. Geophys. Res. Lett. 2018, 45, 5470–5480. [Google Scholar] [CrossRef]
  16. Hao, Z.; Hao, F.; Singh, V.P.; Xia, Y.; Shi, C.; Zhang, X. A multivariate approach for statistical assessments of compound extremes. J. Hydrol. 2018, 565, 87–94. [Google Scholar] [CrossRef]
  17. Ghanbari, M.; Arabi, M.; Kao, S.C.; Obeysekera, J.; Sweet, W. Climate change and changes in compound coastal-riverine flooding hazard along the US coasts. Earth’s Future 2021, 9, e2021EF002055. [Google Scholar] [CrossRef]
  18. Lin, M.Y.; Sun, M.H.; Sun, W.Y.; Fu, H.S.; Chen, W.B.; Chang, C.H. Formulating a warning threshold for coastal compound flooding: A copula-based approach. Ecol. Indic. 2024, 162, 111994. [Google Scholar] [CrossRef]
  19. Li, Y.; Zhou, W.; Shen, P. Flood risk assessment of loss of life for a coastal city under the compound effect of storm surge and rainfall. Urban Clim. 2023, 47, 101396. [Google Scholar] [CrossRef]
  20. Chen, W.; Huang, G.; Zhang, H. Urban stormwater inundation simulation based on SWMM and diffusive overland-flow model. Water Sci. Technol. 2017, 76, 3392–3403. [Google Scholar] [CrossRef]
  21. Wu, X.; Wang, Z.; Guo, S.; Liao, W.; Zeng, Z.; Chen, X. Scenario-based projections of future urban inundation within a coupled hydrodynamic model framework: A case study in Dongguan City, China. J. Hydrol. 2017, 547, 428–442. [Google Scholar] [CrossRef]
  22. Löwe, R.; Urich, C.; Domingo, N.S.; Mark, O.; Deletic, A.; Arnbjerg-Nielsen, K. Assessment of urban pluvial flood risk and efficiency of adaptation options through simulations—A new generation of urban planning tools. J. Hydrol. 2017, 550, 355–367. [Google Scholar] [CrossRef]
  23. Tang, B.; Nederhoff, K.; Gallien, T. Quantifying compound coastal flooding effects in urban regions using a tightly coupled 1D-2D model explicitly resolving flood defense infrastructure. Coast. Eng. 2025, 199, 104728. [Google Scholar] [CrossRef]
  24. Kumbier, K.; Carvalho, R.C.; Vafeidis, A.T.; Woodroffe, C.D. Investigating compound flooding in an estuary using hydrodynamic modelling: A case study from the Shoalhaven River, Australia. Nat. Hazards Earth Syst. Sci. 2018, 18, 463–477. [Google Scholar] [CrossRef]
  25. Wei, H.; Wu, H.; Zhang, L.; Liu, J. Urban flooding simulation and flood risk assessment based on the InfoWorks ICM model: A case study of the urban inland rivers in Zhengzhou, China. Water Sci. Technol. 2024, 90, 1338–1358. [Google Scholar] [CrossRef]
  26. Zhu, W.; Cao, Z.; Kawaike, K.; Luo, P.; Yamanoi, K.; Koshiba, T. A novel urban flood risk assessment framework based on refined numerical simulation technology. J. Hydrol. 2024, 645, 132152. [Google Scholar] [CrossRef]
  27. Zhong, M.; Xiao, L.; Li, X.; Mei, Y.; Jiang, T.; Song, L.; Chen, X. A study on compound flood prediction and inundation simulation under future scenarios in a coastal city. J. Hydrol. 2024, 628, 130475. [Google Scholar] [CrossRef]
  28. Xue, W.; Wu, Z.; Xu, H.; Wang, H.; Ma, C.; Zhou, Y. A framework for amplification flood risk assessment and threshold determination of combined rainfall and river level in an inland city. J. Hydrol. 2024, 640, 131725. [Google Scholar] [CrossRef]
  29. Moradian, S.; AghaKouchak, A.; Gharbia, S.; Broderick, C.; Olbert, A.I. Forecasting of compound ocean-fluvial floods using machine learning. J. Environ. Manag. 2024, 364, 121295. [Google Scholar] [CrossRef]
  30. Di Bacco, M.; Contento, A.; Scorzini, A.R. Exploring the compound nature of coastal flooding by tropical cyclones: A machine learning framework. J. Hydrol. 2024, 645, 132262. [Google Scholar] [CrossRef]
  31. Chen, J.; Tian, Y.; Zhang, S.; Li, Y.; Guo, Z. Study of Urban Flooding Response under Superstandard Conditions. Water 2023, 15, 1492. [Google Scholar] [CrossRef]
  32. Ding, J.; He, W.; Wu, S.; Fan, L.; Zhang, G.; Yang, L.; Feng, Q. Effects of heavy rainfall and outer river level on urban waterlogging in hilly areas of South China: A case study of Nanhu Port, Changsha City. Desalination Water Treat. 2023, 302, 121–128. [Google Scholar] [CrossRef]
  33. Dodangeh, E.; Shahedi, K.; Solaimani, K.; Shiau, J.-T.; Abraham, J. Data-based bivariate uncertainty assessment of extreme rainfall-runoff using copulas: Comparison between annual maximum series (AMS) and peaks over threshold (POT). Environ. Monit. Assess. 2019, 191, 67. [Google Scholar] [CrossRef] [PubMed]
  34. Jiang, C.; Xiong, L.; Xu, C.Y.; Guo, S. Bivariate frequency analysis of nonstationary low-flow series based on the time-varying copula. Hydrol. Process. 2015, 29, 1521–1534. [Google Scholar] [CrossRef]
  35. Sklar, M. Fonctions de répartition à n dimensions et leurs marges. In Annales de l’ISUP; L’institut de Statistique de l’Université de Paris: Paris, France, 1959; pp. 229–231. [Google Scholar]
  36. Nelsen, R.B. An Introduction to Copulas; Springer: New York, NY, USA, 2006. [Google Scholar]
  37. Massey, F.J., Jr. The Kolmogorov-Smirnov test for goodness of fit. J. Am. Stat. Assoc. 1951, 46, 68–78. [Google Scholar] [CrossRef]
  38. Schwarz, G. Estimating the dimension of a model. Ann. Stat. 1978, 6, 461–464. [Google Scholar] [CrossRef]
  39. Akaike, H. A new look at the statistical model identification. IEEE Trans. Autom. Control 1974, 19, 716–723. [Google Scholar] [CrossRef]
  40. Nash, J.E.; Sutcliffe, J.V. River flow forecasting through conceptual models part I—A discussion of principles. J. Hydrol. 1970, 10, 282–290. [Google Scholar] [CrossRef]
  41. Wit, E.; Heuvel, E.v.d.; Romeijn, J.W. ‘All models are wrong…’: An introduction to model uncertainty. Stat. Neerl. 2012, 66, 217–236. [Google Scholar] [CrossRef]
  42. Reddy, M.J.; Ganguli, P. Bivariate flood frequency analysis of upper Godavari River flows using Archimedean copulas. Water Resour. Manag. 2012, 26, 3995–4018. [Google Scholar] [CrossRef]
  43. Lian, J.; Xu, K.; Ma, C. Joint impact of rainfall and tidal level on flood risk in a coastal city with a complex river network: A case study of Fuzhou City, China. Hydrol. Earth Syst. Sci. 2013, 17, 679–689. [Google Scholar] [CrossRef]
  44. Zang, W.; Zhao, X.; Li, M.; Xue, X. Research progress and development trend of urban flood simulation technology. China Flood Drought Manag. 2020, 30, 1–13. [Google Scholar]
  45. Gao, L.; Du, H.; Huang, H.; Zhang, L.; Zhang, P. Modelling the compound floods upon combined rainfall and storm surge events in a low-lying coastal city. J. Hydrol. 2023, 627, 130476. [Google Scholar] [CrossRef]
  46. Bilskie, M.V.; Hagen, S.C. Defining Flood Zone Transitions in Low-Gradient Coastal Regions. Geophys. Res. Lett. 2018, 45, 2761–2770. [Google Scholar] [CrossRef]
  47. Han, S.; Tahvildari, N. Compound flooding hazards due to storm surge and pluvial flow in a low-gradient coastal region. Water Resour. Res. 2024, 60, e2023WR037014. [Google Scholar] [CrossRef]
  48. Shi, S.; Yang, B.; Jiang, W. Numerical simulations of compound flooding caused by storm surge and heavy rain with the presence of urban drainage system, coastal dam and tide gates: A case study of Xiangshan, China. Coast. Eng. 2022, 172, 104064. [Google Scholar] [CrossRef]
  49. Liang, H.; Zhou, X. Impact of tides and surges on fluvial floods in coastal regions. Remote Sens. 2022, 14, 5779. [Google Scholar] [CrossRef]
  50. Gao, L.; Mei, J.; Li, J.; Zhang, W.; Lai, C. Effect of intense rainfall and high riverine water level on compound flood hazards in a river-valley city: A case study of Yingde, China. J. Hydrol. 2023, 625, 130044. [Google Scholar] [CrossRef]
  51. Zellou, B.; Rahali, H. Assessment of the joint impact of extreme rainfall and storm surge on the risk of flooding in a coastal area. J. Hydrol. 2019, 569, 647–665. [Google Scholar] [CrossRef]
  52. Song, M.; Zhang, J.; Liu, Y.; Liu, C.; Bao, Z.; Jin, J.; He, R.; Bian, G.; Wang, G. Time-varying copula-based compound flood risk assessment of extreme rainfall and high water level under a non-stationary environment. J. Flood Risk Manag. 2024, 17, e13032. [Google Scholar] [CrossRef]
  53. Liu, Z.; Cheng, L.; Hao, Z.; Li, J.; Thorstensen, A.; Gao, H. A Framework for Exploring Joint Effects of Conditional Factors on Compound Floods. Water Resour. Res. 2018, 54, 2681–2696. [Google Scholar] [CrossRef]
  54. Ding, Y.; Wang, H.; Liu, Y.; Chai, B.; Bin, C. The spatial overlay effect of urban waterlogging risk and land use value. Sci. Total Environ. 2024, 947, 174290. [Google Scholar] [CrossRef] [PubMed]
  55. Zhu, Z.; Gou, L.; Liu, S.; Peng, D. Effect of urban neighbourhood layout on the flood intrusion rate of residential buildings and associated risk for pedestrians. Sustain. Cities Soc. 2023, 92, 104485. [Google Scholar] [CrossRef]
  56. Machineni, N.; Sinha, V.S.; Singh, P.; Reddy, N. The impact of distributed landuse information in hydrodynamic model application in storm surge inundation. Estuar. Coast. Shelf Sci. 2019, 231, 106466. [Google Scholar] [CrossRef]
Figure 1. Sketch of the study area.
Water 17 00841 g001
Figure 2. Design rainfall event.
Water 17 00841 g002
Figure 3. (a) Ground elevation data; (b) Distribution of urban buildings and roads; (c) 1D–2D coupled inundation model.
Water 17 00841 g003
Figure 4. Comparison between the 2D copula function and the empirical function.
Water 17 00841 g004
Figure 5. Surface plots of risk probability. (a) Joint risk probability; (b) Co-occurrence risk probability.
Water 17 00841 g005
Figure 6. (a) Joint risk probability analysis; (b) Co-occurrence risk probability analysis.
Water 17 00841 g006
Figure 7. Probabilistic risk calculation results for various portfolios. (a) Joint risk probability analysis; (b) Co-occurrence risk probability analysis.
Water 17 00841 g007
Figure 8. Measured rainfall of two rainfall events. (a) 22 July 2023; (b) 16 August 2023.
Water 17 00841 g008
Figure 9. Comparison between simulated and actual waterlogging points. (a) 22 July 2023 calibration; (b) 16 August 2023 validation.
Water 17 00841 g009
Figure 10. Maximum inundation depth maps under the baseline scenario.
Water 17 00841 g010
Figure 11. Max inundation depth maps under different combined return period scenarios.
Water 17 00841 g011
Figure 12. Regional division of disaster factors.
Water 17 00841 g012
Figure 13. Changes in inundation area under different return periods.
Water 17 00841 g013
Figure 14. Amplification effect analysis (a) A F a r e a ; (b) A F d e p t h .
Water 17 00841 g014
Table 1. Scenario setting.
ScenarioReturn Period of RainfallReturn Period of Water Level
150anone
2none50a
350a50a
Table 2. Best-fit statistics for rainfall and water level.
Distribution TypeRainfallWater Level
AICBICK-S TestAICBICK-S Test
Gamma945.6234950.93130.0437367.7278373.03570.0650
Normal972.7642978.07210.0929381.1816386.48950.0882
Logistic966.5638971.87170.0773382.1771387.48500.0842
Lognormal948.6829953.99080.0660364.8406370.14850.0567
Generalized Pareto947.7451955.70700.0545350.9790358.94080.0510
Generalized Extreme Value950.2942958.25600.0508366.6013374.56320.0581
Weibull949.6653954.97320.0538381.1705386.47850.0929
Table 3. Evaluation index of best fit of copula functions.
CopulaAICBICRMSENSE
Plackett−96.7726−94.11870.21410.9940
Frank−94.4306−91.77670.21810.9938
Gumbel−78.4587−75.80470.24730.9920
t−75.4061−70.09820.20500.9945
AMH−63.1409−60.48690.48460.9692
Gaussian−61.0861−58.43210.20450.9945
Joe−57.7902−55.13630.32110.9865
FGM−39.0723−36.41830.65510.9437
Clayton−14.7418−12.08790.18940.9953
Table 4. Related parameters of different types of runoff surface.
Surface TypeLoss ModelFixed Runoff CoefficientRouting ModelRouting Parameter
RoadFIXED0.80SWMM0.013
Green0.150.050
Water1.000.050
Building0.850.012
Other0.450.030
Disclaimer/Publisher’s Note: The statements, opinions and data contained in all publications are solely those of the individual author(s) and contributor(s) and not of MDPI and/or the editor(s). MDPI and/or the editor(s) disclaim responsibility for any injury to people or property resulting from any ideas, methods, instructions or products referred to in the content.

