Abstract
Global urbanization has led to the overexploitation and pollution of groundwater resources, restricting the sustainable construction and development of cities. Groundwater environmental carrying capacity (GW-ECC) refers to the maximum total amount of pollutants that can be accommodated by a given groundwater system within a certain time period and under specified environmental goals. To better understand the changes in GW-ECC in the context of rapid urbanization, this study built a model of the urban GW-ECC driven by multiple factors. Taking the urban area of Zhengzhou as an example, rainfall infiltration and riverside seepage within the urban groundwater system were calculated considering the change in the impervious area over the past 20 years. The Mann–Kendall rank test was used to evaluate the varying trends of the two factors in the urbanization process. Based on this, the change in the GW-ECC in the current year was calculated, and the changes under different regulatory schemes after 10 years was calculated and evaluated. The results showed that the model constructed in this study could accurately simulate an urban groundwater system. With the acceleration of urbanization, the urban groundwater system recharges by precipitation, and rivers tend to decline. The GW-ECC of ammonia nitrogen in Zhengzhou exhibited an overall upward trend. By the end of 2030, the GW-ECC of ammonia nitrogen is expected to reach a maximum of 1964.5 t. Changes in groundwater resources caused by precipitation and extraction were the main factors driving variations in the urban GW-ECC. In areas with mature urbanization, measures such as increasing groundwater recharge and reducing groundwater extraction are more effective in improving the GW-ECC.
1. Introduction
Groundwater is a critical component of the water cycle system and serves as one of the primary sources of water resources for human society [1,2]. It is also considered a vital strategic reserve for the nation. Groundwater plays an essential role in ensuring safe drinking water for both urban and rural populations, supporting the stable and rapid development of the economy and society, and maintaining the healthy functioning of the ecological environment [3,4].
As an important component of environmental carrying capacity, groundwater environmental carrying capacity (GW-ECC) is greatly affected by industrial and agricultural production [5]. With rapid social and economic development in the past 30 years, groundwater exploitation has been increasing, resulting in problems such as a decline in groundwater levels [6] and water pollution [7]. These problems have led to a continuous decrease in available groundwater resources. With the rapid development of the social economy, urban expansion has accelerated in the 21st century. According to the Annual Report on Global Ecological Environment Remote Sensing Monitoring in 2020, the global urban area has increased from 23,900 km2 in 2000 to 519,800 km2 in 2020. The rapid expansion of cities has affected the hydrological cycle. For example, it reduces the infiltration capacity of urban precipitation and changes the balance between surface water and groundwater [7]. This reduces the function of river regulation and storage and increases the risk of urban flooding. This has led to the overexploitation of groundwater, land subsidence, and ecological degradation [6]. In recent years, the international community has recognized the significant impact of urbanization on the hydrological cycle and has promoted the exploration of relevant mechanisms and formulation of countermeasures through systematic studies. These include the International Hydrological Programme (IHP), Global Water Partnership (GWP), International Science Council (ISC), and the United Nations Sustainable Development Goals (SDGs) [8]. As an important part of the study of the hydrological cycle, the GW-ECC has been greatly affected by urbanization [9]. Therefore, it is necessary to calculate and analyze the environmental capacity of urban groundwater.
Water environmental carrying capacity refers to the capacity of a specific water body to accommodate pollutants while maintaining water quality standards and meeting established conditions [10,11]. Several studies have been conducted on water environmental capacity in recent years [12,13]. Currently, there are several methods for calculating environmental capacity, including system optimization [14,15], analytical formulas [16], and trial-and-error methods. Groundwater is an important component of the water cycle and has the capacity for dilution and self-purification. When pollutants enter groundwater, their concentration, which is influenced by the dilution effect of the water body, does not affect the usability of the groundwater as long as it remains under the water quality standards. This implies that the groundwater systems have a certain pollutant assimilation capacity. Owing to the specific characteristics of groundwater recharge and discharge and their environmental effects, there were significant differences in the methods used to calculate GW-ECC. The methods currently used to analyze and evaluate the groundwater environment include modeling, comprehensive combinations of numerical simulations and mathematical models, and empirical formulas. In 2017, Ma et al. [17] evaluated the GW-ECC in Nantong City under the influence of ground subsidence by constructing a finite-element numerical model coupling groundwater flow, ground subsidence, and fresh groundwater salinization. Xin [18] calculated the dynamic changes in the GW-ECC in Jinan by establishing an evaluation system consisting of six evaluation indicators and eleven constraint conditions in 2010. Qu et al. [19] used the differential evolution algorithm to solve a multi-objective quantitative evaluation model of emissions, including gross domestic product (GDP), grain production, population, and chemical oxygen demand. In 2010, they established and used an improved differential evolution algorithm to solve a multiobjective evaluation model. By analyzing the mechanism of pollutant migration in the vadose zone with infiltrating water, Soheila [20] used a k-means clustering method to comprehensively evaluate surface water and groundwater environmental capacities in the Zayandeh-Rood River Basin in 2022. The objects of these studies were cities. However, changes in the underlying surface of the city and the hardening of the riverbed were often ignored. This makes the model unable to accurately describe the changes in the GW-ECC during the urbanization process.
Impervious surfaces mainly refer to surfaces that do not allow water to permeate and typically include buildings, plazas, parking lots, and other hard surfaces. Green belts along roadsides and green spaces between buildings within urban areas should be treated as permeable surfaces [21]. However, in the process of urbanization, to meet the ecological base flow requirements of rivers and maintain their basic form and function, the riverbeds on both sides are often lined to reduce lateral seepage. This would also reduce the amount of groundwater recharged by rivers. These are rarely considered in existing GW-ECC calculation models.
To analyze the impact of urbanization on groundwater systems in more detail, this study built a model of an urban GW-ECC driven by multiple factors. Taking the urban area of Zhengzhou as an example, the change in impervious area over the past 20 years was analyzed, and the change trends of rainfall infiltration and riverside seepage in the urban groundwater system were calculated. The model was used to calculate the GW-ECC for the current year, and the GW-ECC for 2030 under different regulation schemes were calculated and evaluated. This study provides a reference for the control of urban groundwater pollution.
2. Materials and Methods
2.1. The Response Relationship Between Urbanization and GW-ECC
There are currently three main definitions of GW-ECC. The first definition considers the GW-ECC as an indicator system reflecting the comprehensive carrying capacity of groundwater [22]. The second definition considers GW-ECC as the ability to self-purify or assimilate pollutants. The third definition refers to the maximum pollutant emissions from a given pollution source [23]. In this study, we considered only the capacity of groundwater pollutants, and, therefore, GW-ECC was defined as the maximum total amount of pollutants that could be accommodated by a given groundwater system within a certain period and under specified environmental goals. The GW-ECC was mainly affected by the amount of groundwater resources and pollutant concentrations.
With the continuous acceleration of urbanization in urban areas, land use patterns are constantly changing, and the levels of groundwater extraction, lateral recharge from surrounding environments, precipitation infiltration, and evaporation have also changed, leading to variations in urban groundwater resources (Figure 1). Human activity can also alter the pollutant flux entering the groundwater aquifer from the surface, resulting in changes in pollutant concentrations in groundwater aquifers. The GW-ECC of urban areas changed under the combined influence of changing groundwater resources and pollutant concentrations.
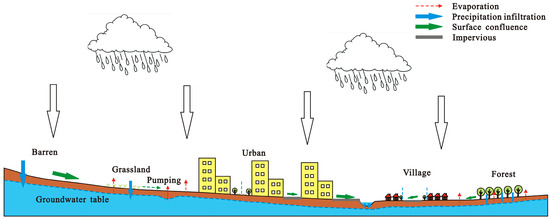
Figure 1.
Schematic diagram of precipitation infiltration on different underlying surfaces.
2.2. Source and Sink Items Calculation of the Urban Groundwater System
Factors influencing urban groundwater resources include precipitation infiltration, shallow water evaporation, riverbank infiltration recharge, and groundwater extraction. These four factors, as the main inflows and outflows of the urban groundwater system, were significantly influenced by urbanization.
To calculate these inflows and outflows, previous studies have often used overall lithological characteristics to estimate precipitation infiltration; riverbank infiltration has been calculated based on the hydraulic-head difference between the river and groundwater [24]. This is more applicable to study areas with minimal influence from human activity. However, in urban areas, with the rapid advancement of urbanization, impervious areas have increased dramatically. The implementation of riverbed hardening projects has also accelerated. Consequently, traditional methods for calculating the source and sink terms are no longer applicable. Moreover, these approaches could not provide a detailed characterization of the groundwater system in the study area. Therefore, satellite remote sensing interpretation tools were used to identify impermeable surface areas. After determining the specific characteristics of the underlying surface, each inflow and outflow was calculated.
Compared to confined groundwater, shallow groundwater is more susceptible to human activities. In this study, shallow groundwater in an urban area was the research object.
Precipitation Infiltration: The recharge of groundwater from precipitation was mainly influenced by factors such as the lithology and thickness of the vadose zone, precipitation intensity, topography, vegetation, and distribution of impermeable surfaces [25,26]. With the continuous acceleration of urbanization, the impact of the distribution of impermeable surfaces on the variation in precipitation infiltration in urban areas has increased.
In urban areas, precipitation primarily infiltrates the groundwater through non-building land around the city as well as green spaces within the city, such as green belts and parks. The impact of impermeable surfaces on precipitation infiltration is primarily manifested by changes in the importance value, shape, and uniformity of the impermeable patches, with the importance value having the greatest impact on precipitation infiltration [27]. According to indoor rainfall infiltration experiments conducted by Wang [28], the critical value of impermeable surfaces is linearly related to the rainfall infiltration coefficient. Moreover, the parameters of the linear equation vary depending on the lithology of the vadose zone. By substituting the different importance values of the impermeable patches into the corresponding linear relationship equation, the corresponding precipitation infiltration coefficient was obtained, and then the actual recharge volume of precipitation infiltration was calculated. The specific formula is as follows:
where α—coefficient of rainfall infiltration; x—importance value of impervious patches; Qprec—rainfall infiltration recharge (103 m3); P—annual precipitation (mm); F—area for rainfall infiltration calculation (km2); v—importance value of impervious; Aimp—area for impervious in rainfall infiltration calculation region (km2).
Groundwater Evaporation: As one of the main methods of groundwater discharge, evaporation is primarily influenced by the depth of the groundwater table, the lithology of the vadose zone, and climatic conditions. In urban areas, the presence of extensive impermeable surfaces prevents groundwater from evaporating into the atmosphere through the vadose zones. However, the decrease in precipitation infiltration recharge and the increase in groundwater extraction would cause the groundwater level to decline continuously. Once it exceeded the limit of evaporation, groundwater evaporation in urban areas would also decrease. Therefore, the shallow water evaporation flux in impermeable areas was ignored, and only groundwater evaporation in non-impermeable areas with higher groundwater levels was considered.
River infiltration: The relationship between groundwater and surface water is not static but is affected by many factors (such as groundwater recharge, leakage, flow path, riverbed permeability, river flow rate, duration of water flow, river water level, and groundwater level) [29,30]. As shown in Figure 1, when the groundwater level is higher than the elevation of the riverbed sediment bottom, the river exchanges water with the groundwater through the entire wet circumference of the riverbed. When the groundwater level is lower than the elevation of the riverbed sediment bottom, the river recharges the groundwater primarily through the bottom of the riverbed. The infiltration recharge of rivers into the groundwater was calculated using the following formula:
where Qr—exchange capacity between river and groundwater (m3/d); Kb—permeability coefficient of the riverbed sediment (m/d); Lr—length of river (m); Wr—width of river (m); M—thickness of the riverbed sediment (m); Hr—river water level (m); h—groundwater level (m); Cr—hydraulic conductivity between river and groundwater(m2/d); Ybot—elevation of the riverbed sediment bottom (m).
During urbanization, to meet the ecological base flow requirements of rivers, maintain their basic form and function, and create suitable habitats for flora and fauna, the riverbeds on both sides are often lined to reduce lateral seepage. Factors influencing the lateral seepage of the riverbed lining include the lining material and permeation time [31]. The most common lining material is cement soil, with the cement content typically ranging from 10% to 30%, and this is the main factor affecting the lateral seepage of rivers. The variation in permeation time also affects the lateral seepage of the rivers. Over time, the lateral seepage coefficient gradually decreased and tended to reach a stable state after approximately 20–80 h [32]. Because of the relatively short-term impact of temporal variation on lateral seepage, this study only considered the influence of the cement content in the lining material on river lateral seepage. The seepage was calculated as follows:
where t—infiltration time (d) and p—percentage of cement content (with a typical range of 10–30%).
Groundwater Extraction Intensity: In contrast, the increase in population would increase the demand for urban water resources, and in areas with poor surface water resources, the exploitation of groundwater would increase. However, considering the series of problems caused by the overexploitation of groundwater, the government usually makes planning policies related to groundwater pressure extraction, which could limit the increase in groundwater extraction. For example, China is implementing a plan for the treatment of over-exploitation areas, implementing the sealing of wells in the areas where there is groundwater over-exploitation, strictly controlling the high-pressure mining in deep layers, and reducing the amount of groundwater mined in shallow layers to below the allowable amount. Therefore, when setting the groundwater extraction intensity in the groundwater model, both the actual distribution of groundwater extraction wells and relevant groundwater exploitation plans should be considered.
The Mann–Kendall rank test is not affected by sample values and is widely used in trend analysis of meteorological and hydrological data [33]. In this study, the Mann–Kendall rank test is used to analyze the variation trend of each source and sink item. Suppose the sequence X = (x1, x2, …, xn), the standard normal distribution statistic Z is [34]
where Var(S) is the variance, S approximately follows a normal distribution, and tp is the amount of data, which is the same as group p.
Assume that the sequence has no trend. At the given significance level, if |Z| > Z1−α/2, the sequence has a significant change trend. If Z > 0, the order has a significant upward trend. If Z < 0, the sequence has a significant downward trend.
2.3. GW-ECC Model Considering the Impacts of Urbanization
The calculations in the above section were used as the driving conditions to construct a numerical model of the urban groundwater system and analyze the process of pollutant migration through the vadose zone, thus establishing a model for the urban GW-ECC. In this study, a shallow groundwater aquifer was used for the calculations. The groundwater flow system was a heterogeneous two-dimensional steady flow system.
where H—groundwater head (m); Kx, Ky—hydraulic conductivity in the x (horizontal) and y (vertical) directions (m/d); H0—initial water head of the aquifer (m); H1—water head at various boundary layers (m); q—algebraic sum of vertical recharge intensity of the shallow groundwater system (m/d); Ω—seepage area; B1—boundary with known water head, which is the first type boundary; B2—boundary with known flow, which is the second type boundary; and n—unit normal direction of the boundary of the seepage zone.
Considering the effects of dispersion, convection, adsorption, and biodegradation, the mathematical model for pollutant transport can be generalized as follows:
where θ—porosity; Ck—concentration of solute (mg/L); t—time (d); xi, xj—distances along each direction in the Cartesian coordinate system (m); Dij—hydrodynamic dispersion coefficient tensor (m2/d); vi—seepage velocity (m/d); qs—fluid volume per unit volume of the aquifer, giving or receiving fluid, representing the source and sink terms (s−1); Csk—concentration of solute in the source and sink terms (mg/L); and ΣRn—chemical reaction term (mg/L) (this term refers to the decay, degradation, and other transformations of solutes in aquifers). In this study, ammonia nitrogen was designated as the target pollutant; therefore, the nitrification process of ammonia nitrogen was the primary focus.
Ammonia nitrogen originates mainly from human activities and agricultural discharges and is greatly influenced by urbanization. Therefore, in this study, ammonia nitrogen was used as an example to analyze the impact of urbanization on GW-ECC. Under natural conditions, ammonia nitrogen in shallow groundwater mainly originates from atmospheric precipitation and soil water at generally low concentrations. However, with accelerated urbanization, anthropogenic sources have become the primary cause of elevated ammonia nitrogen concentrations in groundwater. The excessive application of agricultural fertilizers can lead to the entry of ammonia nitrogen into groundwater aquifers through irrigation and precipitation. Human activities also increase the ammonia nitrogen concentration in surface runoff, which infiltrates the groundwater aquifer through lateral seepage.
A regular grid was used to divide the calculation area, and each grid was used as a calculation unit. As a submersible aquifer, each unit can be considered a well-mixed groundwater reservoir. The overall GW-ECC of a region is equal to the sum of the capacities of all units. The GW-ECC of each unit primarily consists of the dilution capacity, self-purification capacity, and migration capacity. The calculation is as follows:
where Qtotal—total GW-ECC of the region (t); Qd, Qp, and Qt—dilution capacity, self-purification capacity, and migration volume, respectively (t); t—time (d); i—calculation number within the calculation area, with n representing the total number of calculation units; Csi—target pollutant concentration in the i unit (mg/L); C0i—initial concentration of the target pollutant in the i unit (mg/L); Vi—groundwater volume of the i unit (m3); Ki—degradation rate constant of the target pollutant in the i unit (d−1); Pi—groundwater extraction amount in the i unit (104 m3); qout—groundwater flow out of the unit (104 m3/d); and Cs—pollutant standard value in the unit where the outflow occurs(mg/L).
2.4. Evaluation of Regulatory Schemes for Improving Groundwater Environment Capacity
The factors influencing the changes in groundwater environment capacity were variations in groundwater sources and sinks as well as the standard concentrations of target pollutants. For urban areas, the constraints on sources and sinks mainly include the exploitable groundwater quantity in shallow aquifers and future urban development plans. The main constraints on the target pollutant concentrations were the groundwater quality standards for each calculation area. Therefore, the influencing factors were considered constraints, and the objective was to maximize the sum of the GW-ECC for each calculated unit in the study area when selecting and evaluating different groundwater environment management schemes. The constraints for each scheme are as follows:
where Qi—total GW-ECC of each calculation area (t); W—groundwater extraction (104 m3); W0—exploitable groundwater (104 m3); Cs—target pollutant concentration (mg/L); Ct—target pollutant water quality standard in the “Groundwater Environmental Quality Standard” (mg/L); A—impervious area of the city (km2); and A0—planned impervious area of the city in relevant urban development plans (km2).
3. Results and Discussion
3.1. Overview of the Study Area
The accuracy of the proposed model was verified. In this study, the urban area of Zhengzhou was used as an example to calculate the GW-ECC in urban areas.
The urban area of Zhengzhou City is located in the central part of the Henan Province (Figure 2), covering a total area of 993 km2. Its current population is 6.1167 million.
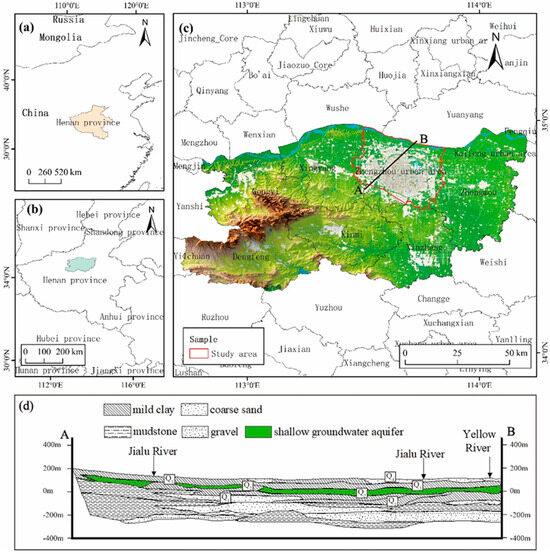
Figure 2.
Schematic of the study area: (a) location, (b) Henan province, (c) study area, and (d) hydrogeological profile in the study area.
Zhengzhou has a temperate continental climate with distinct seasons. There was a significant interannual variation in precipitation, which was unevenly distributed throughout the year. According to the Water Resources Bulletin, the average annual precipitation is 520.39 mm, with a maximum of 1070.6 mm and a minimum of 372.0 mm. Most of the precipitation occurs from June to September, accounting for 55.7% of the average annual total precipitation. The city has six rivers, with all except the Yellow and Jialu rivers being seasonal.
The urban area of Zhengzhou City is located in the transitional zone between the Funiu Mountains and Huanghuai Plain. It is bordered by the Yellow River to the north. Moving from southwest to northeast, the topography gradually changes from a loess tableland to the floodplain of the Yellow River. The Quaternary loose rock mass pore water aquifer is the main shallow aquifer in the study area. The thickness of the shallow groundwater aquifer was <25 m, with a burial depth of <80 m, and gradually deepened from west to east. The shallow aquifer in the eastern part of the Beijing–Guangzhou Railway is mainly composed of Holocene and Upper Pleistocene systems. The western plain between the tablelands consisted of Upper Pleistocene and Holocene systems, whereas the tableland area was mainly dominated by the Middle Pleistocene, with some Lower Pleistocene and Neogene systems.
The average shallow groundwater level in the study area was 85.62 m, showing a high trend in the south and a low trend in the north. Groundwater flows from southwest to northeast. The average water level of the Yellow River in the northern boundary of the study area was 87.94–93.08 m, which was higher than the groundwater level, so the groundwater received lateral recharge from the river. Two groundwater funnels were located on the east and west sides of the study area, with an area of 98.31 km2 and 280.31 km2, respectively.
3.2. Data Sources
In this study, the land use data are derived from China’s annual land cover dataset (CLCD) (2000–2019) [35]. The data of population, precipitation and groundwater exploitation are derived from the Water Resources Bulletin of Henan Province (2000–2019). The data of river level (2000–2019) are collected at hydrographic stations. The data of groundwater level (2019) are collected from the groundwater yearbook of Henan Province.
3.3. Urban Land Use Change Analysis
According to China’s annual land cover dataset (CLCD) (2000–2019), which was extracted from Landsat 5, 7, and 8 remote sensing images (resolution 30 m) (Figure 3), the land use transfer matrix and the change in the urban impervious surface area in the study area from 2000 to 2019 were calculated. As shown in Figure 3, it could be observed that within the 10-year period from 2000 to 2019, the impervious area in Zhengzhou increased from 350.81 to 638.99 km2, displaying an overall upward trend. The expansion of the impervious areas in Zhengzhou occurred primarily in the eastern and northern plains.
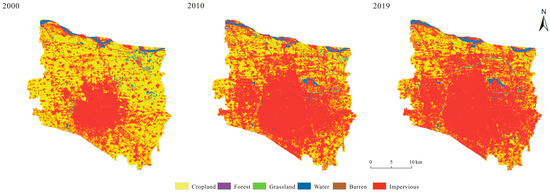
Figure 3.
Land use change in Zhengzhou from 2000 to 2019.
Combined with Figure 4, it can be seen that as of 2019, the largest land use change in the study area was the increase in the impervious area. In 2000, the impervious area was only 350.81 km2, but this increased to 638.99 km2 in 2019, approximately 1.82 times the size in 2000. Approximately 96.73% of the original urban area remains unchanged. The increase in the urban area (287.93 km2) was mainly due to the consumption of agricultural land and water bodies, which accounted for 45.79% and 1.07% of the total new urban area, respectively.
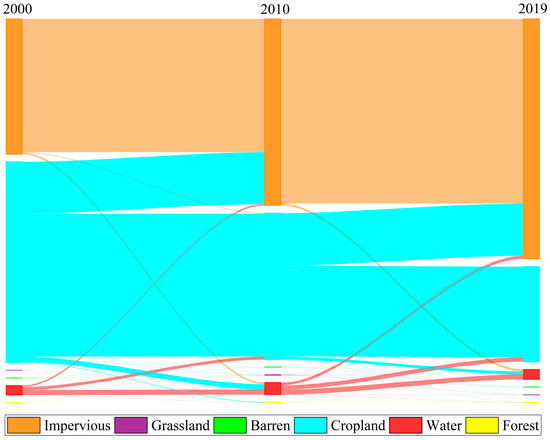
Figure 4.
Transfer directions between land use types from 2000 to 2019.
From 2000 to 2019, the cropland area within the study region decreased by 290.14 km2. Specifically, 42.22% of the cropland remained stable, 55.69% transitioned to impervious land, and the remaining 2.09% was converted to other land use classifications. Additionally, the water area diminished by 1.53 km2, with 40.74% of the water area persisting, 30.61% transforming into cropland, and 28.61% becoming impervious area. The changes in the areas of other land use classifications were relatively minor: the barren area decreased by 0.01 km2, the grassland area by 0.06 km2, and the forest area by 0.6 km2.
Based on the Water Resources Bulletins of Zhengzhou City in the past decade (Figure 5), groundwater extraction decreased from 2.44 × 10⁴ m3 in 2000 to 1.36 × 10⁴ m3 in 2019; it could be seen that groundwater exploitation was high before 2016. With urbanization and a continuous increase in population, the proportion of domestic water use has also increased from 27.56% in 2002 to 39.19% in 2019, becoming the main method of groundwater development and use in the study area [36]. After 2016, with the comprehensive implementation of groundwater overexploitation controls, most domestic and industrial water use has shifted to surface water sources, leading to a significant decrease in groundwater exploitation. Additionally, the expansion of urban areas has led to a reduction in agricultural land, resulting in a noticeable decrease in irrigation water use from 53.23% to 19.23% (Figure 5).
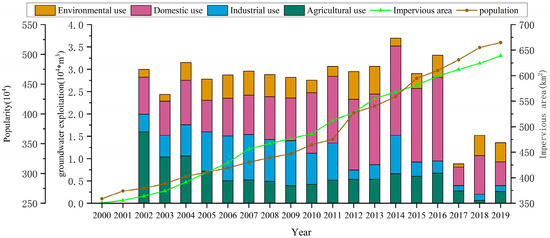
Figure 5.
Urban groundwater development (2000–2019). Annual groundwater use (bars) in terms of different water use sectors (104 m3), including domestic, agricultural, industrial, and environmental water use; and urban development index (lines), including impervious area (km2) and urban population. Data from the Water Resources Bulletin. Groundwater extraction data from 2000 to 2001 are not presented because of a lack of data.
3.4. Calculation of Groundwater Sources and Sinks
3.4.1. Generalization of the Groundwater Flow Field
In this study, for the flow field boundary conditions, except for the northern boundary of the Yellow River, which was delineated as a river boundary, the other boundary in the horizontal direction was generalized as a constant head boundary. According to the hydrogeological conditions in Zhengzhou, the urban area can be divided into 10 hydrogeological parameter zones based on their different permeability coefficients and specific yields. The results of the generalized flow field are shown in Figure 6.
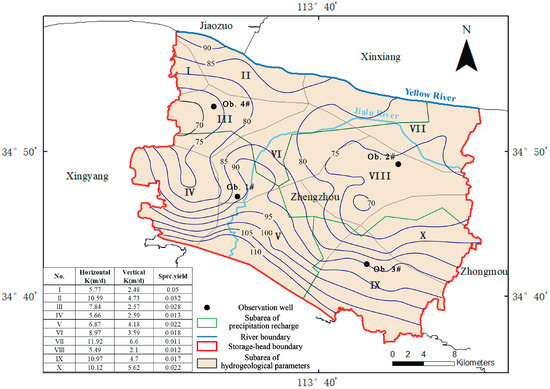
Figure 6.
Model generalization of the study area. Boundary setting (including river and storage-head boundaries) and parameter partitioning (including hydrogeological and precipitation infiltration). The groundwater table contours were obtained in June 2019.
3.4.2. Calculation of Sources and Sinks
According to the hydrogeological data, the infiltration coefficient for the permeable area in the study area was approximately 0.11–0.16. According to the land use extraction results, the important value of urban impervious area increased from 0.28 to 0.5 in 2000 to 0.5–0.8 in 2019. Equation 1 was employed to determine the urban precipitation coefficient within the study area, and the actual precipitation infiltration coefficient in this region shifted from a range of 0.08–0.11 in 2000 to 0.05–0.07 in 2019. The precipitation amounts for consecutive wet, consecutive dry, and normal years were calculated using the precipitation data from 1956 to 2016. By substituting the precipitation amounts and respective infiltration coefficients into Equation 1, the precipitation infiltration recharge in different periods and scenarios was obtained for the study area.
The main rivers in the study area were the Yellow and Jialu rivers, with water levels higher than the groundwater levels, which provided continuous recharge to the groundwater. The Jialu River runs through the urban area of Zhengzhou, and most sections of the river have undergone lining work. The Yellow River is located at the northern boundary of the model, and there is no significant lining work along its course. Based on the hydrogeological survey data, the hydraulic conductivity of the Yellow River’s riverbed sediments was set from 0.59 to 0.76 m2/d, exhibiting an increasing trend from west to east. The bottom elevation of sediments was set from 84.1 to 90 m, showing a decreasing gradient from west to east.
Data regarding artificial groundwater extraction between 2000 and 2019 were obtained from the Water Resources Bulletin of Zhengzhou. The extraction amounts for different regions were assigned based on the distribution of the extraction wells, using a combined approach of point-and-area source extraction.
The Mann–Kendall rank test was used to analyze the variation trends of precipitation infiltration recharge and surface water infiltration recharge from 2000 to 2019 (Figure 7). Most of the time, the UF value of precipitation infiltration recharge was less than zero. This indicates that the overall recharge of precipitation in the study area displayed a downward trend and was influenced by changes in precipitation and urban areas. Precipitation recharge decreased from 0.56 × 10⁴ m3 in 2000 to 0.33 × 10⁴ m3 in 2019. The variation trend in precipitation infiltration recharge before 2010 was similar to that of precipitation, indicating that precipitation had a significant influence on the precipitation infiltration recharge at this stage. After 2010, the change in precipitation infiltration recharge showed a downward trend, whereas precipitation showed an upward trend. In addition, the increase in impervious surfaces in the study area after 2010 was greater than before (Figure 4). In addition, the increase in impervious surfaces in the study area after 2010 was greater than before 2010 (Figure 4). This indicates an increase in the impact of changes in urban areas on precipitation infiltration.
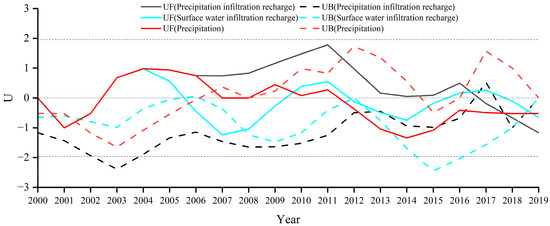
Figure 7.
Variation trend of groundwater source-sink items (2000–2019).
Surface runoff in the study area primarily originates from the Jialu and Yellow rivers. The UF value of surface water infiltration recharge was less than 0 most of the time. This indicates that the infiltration recharge of surface runoff in the study area displayed a downward trend (Figure 7). River infiltration recharge decreased from 0.38 × 10⁴ m3 in 2000 to 0.22 × 10⁴ m3 in 2019. This decline was more pronounced in 2011. This indicates that urbanization has prompted comprehensive riverbed lining work in urban areas, leading to a decrease in the permeability coefficient of riverbeds and a continuous decrease in the lateral recharge of rivers.
3.4.3. Pollution Factors and Initial Condition Settings
The target pollutant for calculating the GW-ECC in this study was ammonia nitrogen. The initial ammonia nitrogen concentrations in the two rivers were assigned based on monthly water quality monitoring data from 2019, with an initial concentration of 0.096 mg/L for the Yellow River and 0.32 mg/L for the Jialu River. The initial ammonia nitrogen concentration in the groundwater aquifer was set to 0.2–0.37 mg/L, according to water quality monitoring data from various wells in January 2019, with a first-order decay coefficient of 0.003.
The simulation was conducted for a period of 20 years using the hydraulic head measured in January 2019 as the initial water level. The simulation was divided into annual stress periods, with a daily time step used to capture the temporal variations and dynamics of the groundwater system.
3.4.4. Model Validation
In this simulation, the model parameters were validated using long-term groundwater monitoring data collected from four wells in 2019 (Figure 6). The Nash efficiency coefficient (NSE) and R2 were used to evaluate the degree of model fit. It could be seen that the NSE of the four observation wells is between 0.70 and 0.84, and the R2 was between 0.86 and 0.93. The numerical model had a strong modeling capability and a high level of computational accuracy, accurately representing the characteristics of the confined groundwater aquifer system in the study area (Figure 8). It can be used to predict variations in GW-ECC in the study area.
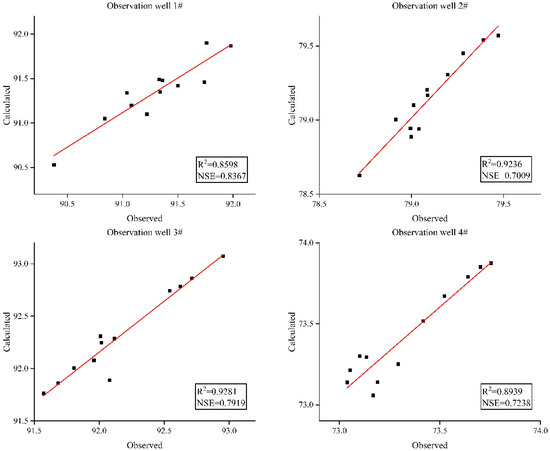
Figure 8.
The results of model validation. Monthly water level data from four observation wells were used to validate the model, and the NSE and R2 values were selected to evaluate the degree of fit of the model.
3.5. Calculation of GW-ECC
3.5.1. Changes in GW-ECC in the Present Year
Based on the results of the solute transport model in the study area, the GW-ECC for a set ammonia nitrogen concentration (0.5 mg/L), which represented a target pollutant concentration specified in the “Groundwater Environmental Quality Standards (GB/T 14848-2017)” [37], was simulated and calculated for the present year.
The simulation of environmental capacity in the study area for 2019 revealed that the distribution of environmental capacity gradually decreased from south to north (Figure 9). In the southern part of the study area, near the drinking water source, the GW-ECC remained relatively high because of the low groundwater extraction intensity and good lateral recharge conditions. In the northern part of the study area adjacent to the Yellow River, where water was heavily extracted, the GW-ECC in the areas other than the densely spaced pumping wells remained between 0.3–0.4 t due to the good lateral recharge conditions provided by the Yellow River. For areas with concentrated groundwater extraction, owing to high urban water demand, the extraction intensity was relatively high, resulting in localized drawdown cones. The GW-ECC in this region remains relatively low, largely below 0.2 t. During June to September, GW-ECC increases in most regions compared to March. But for areas with concentrated groundwater extraction, GW-ECC continues to decline. During December, the GW-ECC in most regions shows a downward trend compared with March.
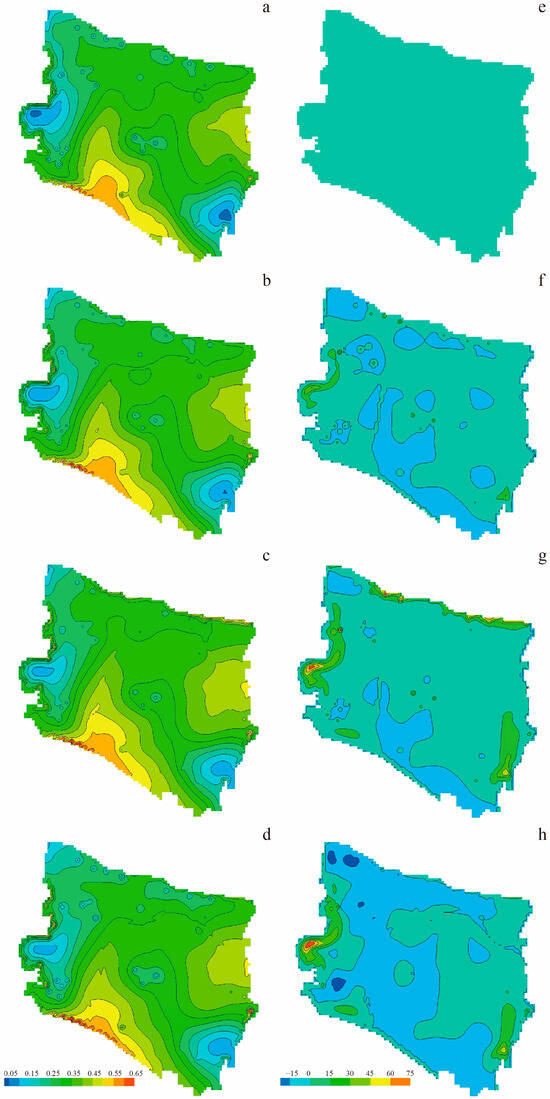
Figure 9.
Isoline of GW-ECC at the beginning of each season in 2019 (mg/L) (left); rate of GW-ECC change at the beginning of each season in 2019 (%) (right) for (a,e) March, (b,f) June, (c,g) September, and (d,h) December.
In terms of temporal changes (Figure 10), the GW-ECC in the study area displayed a trend of “decrease-rise-decrease” and reached its annual peak (1872.39 t) in August. Considering the variations in precipitation and river water levels, it was observed that the trend of GW-ECC was generally consistent with those of precipitation and river water levels. This indicates that with the onset of the flood season, the groundwater system in the study area received increased recharge from precipitation and lateral seepage from the river, leading to an increase in groundwater levels and groundwater resources. At the same time, the pollutant emission concentration remained unchanged, resulting in noticeable growth in the GW-ECC during the wet season. During the dry season, the city’s groundwater extraction volume increased compared to wet years, whereas precipitation and river recharge remained at lower levels. This ultimately leads to a decline in groundwater resources, resulting in a lower groundwater environmental capacity during the dry season than during the wet season.
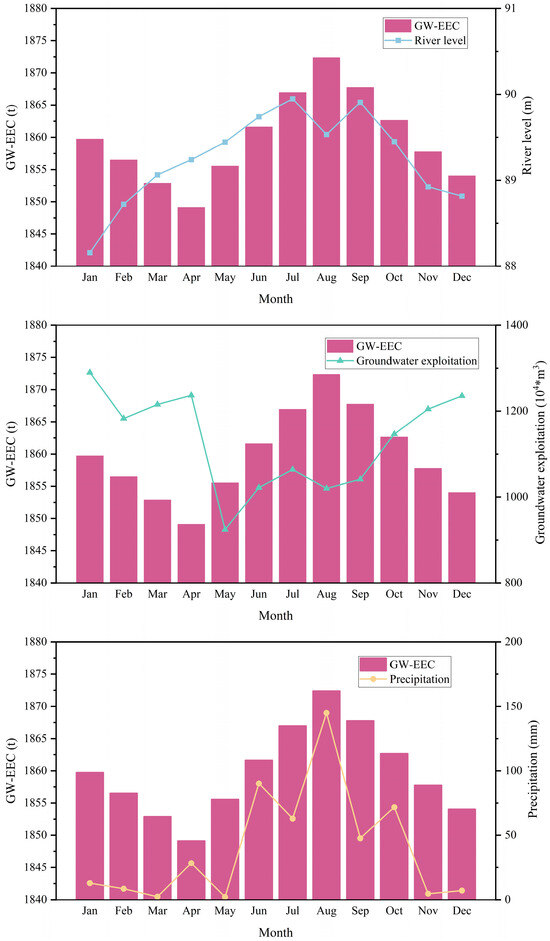
Figure 10.
Trend of GW-ECC change in the current year.
3.5.2. Evaluation of the Control Scheme
Different regulatory schemes have been established, with groundwater resources and ammonia nitrogen concentrations as constraints. The maximum GW-ECC was selected as the regulation objective to evaluate the effectiveness of each regulatory scheme.
Based on the available exploitable groundwater in the study area, a groundwater mining intensity was set. Considering likely future pollution control measures in the study area, the intensity of river pollution control was determined. Urban stormwater management optimization measures that change the precipitation infiltration coefficient were considered regulatory schemes, with an increased regulation intensity based on existing planning to evaluate the effectiveness of different schemes.
The GW-ECC calculation model was used to evaluate the capacity under different schemes. The specific schemes are listed in Table 1.

Table 1.
Evaluation of the Control Scheme.
According to Table 1, if there are no Control Schemes, the GW-ECC shows an upward trend under the scenarios of normal and consecutive wet. By the end of 2030, the GW-ECC will reach 1890.5 t and 1964.5 t, respectively, with the highest growth rate under the scenario of consecutive wet, showing an increase of 5% compared with 2019. The GW-ECC under the scenario of consecutive dry shows a general downward trend, which decreased by 2% compared with 2019. It may be due to the increase in precipitation infiltration recharge and river infiltration under the scenario of consecutive wet, and the corresponding increase in groundwater resources. Under the scenario of consecutive dry, the decrease in precipitation and river level will lead to the decrease in groundwater recharge [38]. These changes will be reflected in the GW-ECC.
Based on Table 1, it could be seen that the GW-ECC in 2030 under different regulatory schemes was higher than the capacity under the present conditions in 2030, indicating that future regulatory measures in the study area could improve the groundwater environment. In the regulatory schemes that included two types of control measures (Schemes 1 to 6), the combination of groundwater extraction measures and urban stormwater management optimization measures (Schemes 5 and 6) produced the best results, with 8% and 16% improvement in GW-ECC, respectively, compared to the conditions in 2030. The combination of surface water pollution control measures and urban stormwater management optimization measures (Schemes 3 and 4) produced poorer results, with only 4% and 9% improvement in GW-ECC compared to the present conditions in 2030. The regulatory schemes that included all three types of control measures (Schemes 7 and 8) performed best among all regulatory schemes, with a 9% and 18% improvement in GW-ECC, respectively, compared with the conditions in 2030. Overall, a combination of the three types of control measures yielded the best results. Regulatory schemes that included groundwater extraction measures generally outperformed other schemes, followed by schemes that included urban stormwater management optimization measures, whereas schemes that included surface water pollution control measures performed relatively poorly.
Over the past ten years, the groundwater environment in some rapidly urbanized areas has continuously improved [39]. In areas with more mature urbanization, the treatment and emissions of urban living and industrial pollutants have been more controlled owing to increased government supervision and environmental awareness. Most of the surface water and groundwater quality in the city has reached the relevant water quality standards. However, urban population growth has also led to an increase in water resource extraction. Therefore, the overexploitation of water resources has become a major challenge for most cities. Combined with the effects of the regulatory measures in this study, it can be seen that cities have high groundwater extraction intensity but low pollution levels. For ammonia nitrogen and other pollutants that are significantly affected by human activities, reducing groundwater exploitation and increasing urban groundwater resources are the most effective measures for improving urban GW-ECC. This is consistent with the conclusion of Wang et al. [40] regarding the impact of different urbanization stages on groundwater. Additionally, the intensity of supervision is an important factor affecting the effectiveness of the supervision mechanism. With an increase in regulations, improvements in groundwater environmental conditions will also increase.
4. Conclusions
This study built a model of the urban GW-ECC driven by multiple factors. Taking the urban area of Zhengzhou as an example, rainfall infiltration and riverside seepage within the urban groundwater system were calculated considering the change in the impervious area over the past 20 years. The Mann–Kendall rank test was used to evaluate the varying trends of the two factors in the urbanization process. Based on this, the change in the GW-ECC in the current year was calculated, and changes under different regulatory schemes after 10 years were also calculated and evaluated. The results show that the model constructed in this study can accurately simulate an urban groundwater system. By the end of 2030, the GW-ECC for ammonia nitrogen reached 1890.5 and 1964.5 t, respectively, with the highest growth rate observed in the “consecutive wet” scenario, increasing by 5% compared to 2019. In the “consecutive dry” scenario, the GW-ECC for ammonium nitrogen displayed an overall decreasing trend, decreasing by 2% compared to 2019.
From the evaluation results of the Control Scheme, it is evident that changes in groundwater extraction and the precipitation infiltration coefficient had a significant impact on the GW-ECC in the study area. The results of this study also further confirmed that for areas with more mature urbanized development, compared with relevant measures to improve water quality, improving groundwater resources is more conducive to the improvement of GW-ECC.
Author Contributions
Y.Z.: Writing—original draft preparation; M.D.: validation; conceptualization; T.G.: data curation; formal analysis; K.N.: investigation; supervision. All authors have read and agreed to the published version of the manuscript.
Funding
This work was supported by the Major Science and Technology Projects of Henan Province [No. 22110032200], the Science and Technology Research Projects of Henan Province [No. 2221023020211], and the Program for Key Science & Technology projects in Universities of Henan Province [No. 21A570008].
Data Availability Statement
The raw data supporting the conclusions of this article will be made available by the authors on request.
Conflicts of Interest
The authors declare no conflicts of interest.
Abbreviations
The following abbreviations are used in this manuscript:
| GW-ECC | Groundwater environmental carrying capacity |
References
- Döll, P.; Fiedler, K. Global-scale modeling of groundwater recharge. Hydrol. Earth Syst. Sci. 2008, 12, 863–885. [Google Scholar] [CrossRef]
- Mirdashtvan, M.; Najafinejad, A.; Malekian, A.; Sa’doddin, A. Sustainable water supply and demand management in semi-arid regions: Optimizing water resources allocation based on RCPs scenarios. Water Resour. Manag. 2021, 35, 5307–5324. [Google Scholar] [CrossRef]
- Velis, M.; Conti, K.I.; Biermann, F. Groundwater and human development: Synergies and trade-offs within the context of the sustainable development goals. Sustain. Sci. 2017, 12, 1007–1017. [Google Scholar] [CrossRef] [PubMed]
- Tan, L.; Zhang, X.; Qi, J.; Sun, D.; Marek, G.W.; Feng, P.; Li, B.; Liu, D.L.; Li, B.; Srinivasan, R.; et al. Assessment of the sustainability of groundwater utilization and crop production under optimized irrigation strategies in the North China Plain under future climate change. Sci. Total Environ. 2023, 899, 165619. [Google Scholar] [CrossRef] [PubMed]
- Dai, J.; Li, R.; Miao, Q.; Li, C.; Lu, Y.; Hua, Z. Shallow groundwater enhances water productivity of maize in arid area. Irrig. Sci. 2022, 40, 885–908. [Google Scholar] [CrossRef]
- Ramos, N.F.; Folch, A.; Fernàndez-Garcia, D.; Lane, M.; Thomas, M.; Gathenya, J.M.; Wara, C.; Thomson, P.; Custodio, E.; Hope, R. Evidence of groundwater vulnerability to climate variability and economic growth in coastal Kenya. J. Hydrol. 2020, 586, 124920. [Google Scholar] [CrossRef]
- Kazakis, N.; Voudouris, K.S. Groundwater vulnerability and pollution risk assessment of porous aquifers to nitrate: Modifying the DRASTIC method using quantitative parameters. J. Hydrol. 2015, 525, 13–25. [Google Scholar] [CrossRef]
- McGrane, S.J. Impacts of urbanisation on hydrological and water quality dynamics, and urban water management: A review. Hydrol. Sci. J. 2016, 61, 2295–2311. [Google Scholar] [CrossRef]
- Gao, X.; Huo, Z.; Xu, X.; Qu, Z.; Huang, G.; Tang, P.; Bai, Y. Shallow groundwater plays an important role in enhancing irrigation water productivity in an arid area: The perspective from a regional agricultural hydrology simulation. Agric. Water Manag. 2018, 208, 43–58. [Google Scholar] [CrossRef]
- Li, Y.; Qiu, R.; Yang, Z.; Li, C.; Yu, J. Parameter determination to calculate water environmental capacity in Zhangweinan Canal Sub-basin in China. J. Environ. Sci. 2010, 22, 904–907. [Google Scholar] [CrossRef] [PubMed]
- Tao, W.; Weihua, Z.; Mengchang, H. Study of the seasonal water environmental capacity of the Central Shaanxi reach of the Wei River. Procedia Environ. Sci. 2012, 13, 2161–2168. [Google Scholar] [CrossRef][Green Version]
- Ma, Q.; Pang, Y.; Mu, R. Water environmental capacity calculation based on control of contamination zone for water environment functional zones in Jiangsu section of Yangtze river, China. Water 2021, 13, 587. [Google Scholar] [CrossRef]
- Zhu, K.; Chen, L.; Chen, S.; Sun, C.; Wang, W.; Shen, Z. New framework for managing the water environmental capacity integrating the watershed model and stochastic algorithm. Sci. Total Environ. 2022, 816, 151659. [Google Scholar] [CrossRef]
- Feng, L.; Li, Q.; Zhang, L.; Wang, H.; Wang, W.; Han, J.; Li, B.L. Exploring the effect of floodgates operation systems on water environmental capacity in a regulated river network of Wuxi, China. J. Clean. Prod. 2021, 299, 126743. [Google Scholar] [CrossRef]
- Yue, Q.; Hou, L.; Wang, T.; Wang, L.; Zhu, Y.; Wang, X.; Cheng, X. Optimization of industrial structure based on water environmental carrying capacity in Tieling City. Water Sci. Technol. 2015, 71, 1255–1262. [Google Scholar] [CrossRef] [PubMed]
- Wang, L.; Yu, L.; Liu, C.; Sun, N.; Feng, M. Research on the water environment capacity of Qingyi River (Xuchang Section) with GIS technology. In Proceedings of the MATEC Web of Conferences, Zhengzhou, China, 28–30 November 2016; EDP Sciences: Les Ulis, France, 2017. [Google Scholar]
- Ma, Q.; Luo, Z.; Wang, Q. Evaluation of Groundwater Environmental Capacity in Nantong, China. Fresenius Environ. Bull. 2017, 26, 5236–5250. [Google Scholar]
- Xing, L.T.; Wu, Q.; Ye, C.H.; Ye, N. Groundwater environmental capacity and its evaluation index. Environ. Monit. Assess. 2010, 169, 217–227. [Google Scholar] [CrossRef]
- Qu, J.; Wang, H.; Yang, L. Multi-Objective Evaluation Model of Groundwater Carrying Capacity in Irrigation District. In Proceedings of the 2010 2nd International Conference on Information Engineering and Computer Science, Wuhan, China, 25–26 December 2010; IEEE: Piscataway, NJ, USA, 2010. [Google Scholar]
- Neysiani, S.N.; Roozbahani, A.; Javadi, S.; Shahdany, S.M.H. Water resources assessment of zayandeh-rood river basin using integrated surface water and groundwater footprints and K-means clustering method. J. Hydrol. 2022, 614, 128549. [Google Scholar] [CrossRef]
- Patra, S.; Sahoo, S.; Mishra, P.; Mahapatra, S.C. Impacts of urbanization on land use/cover changes and its probable implications on local climate and groundwater level. J. Urban Manag. 2018, 7, 70–84. [Google Scholar] [CrossRef]
- Chai, T. Management of Groundwater Basin: Theory and Practice; Wang, B.C., Translator; Geological Publ House: Beijing, China, 1981. [Google Scholar]
- Rassam, D.W.; Peeters, L.; Pickett, T.; Jolly, I.; Holz, L. Accounting for surface–groundwater interactions and their uncertainty in river and groundwater models: A case study in the Namoi River, Australia. Environ. Model. Softw. 2013, 50, 108–119. [Google Scholar] [CrossRef]
- Mushtaq, F.; Rehman, H.; Ali, U.; Babar, M.S.; Al-Suwaiyan, M.S.; Yaseen, Z.M. An investigation of recharging groundwater levels through river ponding: New strategy for water management in sutlej river. Sustainability 2023, 15, 1047. [Google Scholar] [CrossRef]
- Hsieh, P.-C.; Huang, J.-L.; Wu, M.-C. Response of groundwater levels in a coastal aquifer to tidal waves and rainfall recharge. Water 2020, 12, 625. [Google Scholar] [CrossRef]
- Bouimouass, H.; Fakir, Y.; Tweed, S.; Leblanc, M. Groundwater sustainability in a semiarid traditional irrigation piedmont supplied by high mountain streamflow. In Proceedings of the EGU General Assembly Conference Abstracts, Online, 19–30 April 2021. [Google Scholar]
- Chang, B.; Wherley, B.; Aitkenhead-Peterson, J.A.; McInnes, K.J. Effects of urban residential landscape composition on surface runoff generation. Sci. Total Environ. 2021, 783, 146977. [Google Scholar] [CrossRef] [PubMed]
- Wang, W.; Wang, Z.; Guan, L.; Dang, Y.; Zhang, Z.; Wang, H.; Duan, L.; Wang, Z.; Hou, R. Modes, hydrodynamic processes and ecological impacts exerted by river-groundwater transformation in Junggar Basin, China. Hydrogeol. J. 2018, 26, 1547. [Google Scholar] [CrossRef]
- Fetter, C.W. Applied Hydrogeology; Waveland Press: Long Grove, IL, USA, 2018. [Google Scholar]
- Schiavo, M. Quantile-Based Approach for Improving the Identification of Preferential Groundwater Networks. Water 2025, 17, 282. [Google Scholar] [CrossRef]
- Hu, H.; Mao, X.; Yang, Q. Impacts of Yongding River ecological restoration on the groundwater environment: Scenario prediction. Vadose Zone J. 2018, 17, 1–15. [Google Scholar] [CrossRef]
- Lu, L.; Zhu, S.; Liu, Z. Laboratory investigation of the permeability properties of cement mortar with different sand–cement ratios. Adv. Cem. Res. 2022, 34, 292–300. [Google Scholar] [CrossRef]
- Demir, V.; Uray, E.; Orhan, O.; Yavariabdi, A.; Kusetogullari, H. Trend analysis of ground-water levels and the effect of effective soil stress change: The case study of Konya Closed Basin. Avrupa Bilim Teknol. Dergisi. 2021, 24, 515–522. [Google Scholar] [CrossRef]
- Demir, V. Trend analysis of lakes and sinkholes in the Konya Closed Basin, in Turkey. Nat. Hazards 2022, 112, 2873–2912. [Google Scholar] [CrossRef]
- Yang, J.; Huang, X. The 30 m annual land cover dataset and its dynamics in China from 1990 to 2019. Earth Syst. Sci. Data 2021, 13, 3907–3925. [Google Scholar] [CrossRef]
- Zhao, Q.; Zhang, B.; Yao, Y.; Wu, W.; Meng, G.; Chen, Q. Geodetic and hydrological measurements reveal the recent acceleration of groundwater depletion in North China Plain. J. Hydrol. 2019, 575, 1065–1072. [Google Scholar] [CrossRef]
- GB/T14848-2017; Ministry of Ecology and Environment Groundwater Quality Standards. China Standards Publishing House: Beijing, China, 2017.
- D’Oria, M.; Balacco, G.; Todaro, V.; Alfio, M.R.; Tanda, M.G. Assessing the impact of climate change on a coastal karst aquifer in a semi-arid area. Groundw. Sustain. Dev. 2024, 25, 101131. [Google Scholar] [CrossRef]
- Lü, X.-L.; Liu, J.-T.; Han, Z.-T.; Zhu, L.; Li, H.-J. Characteristics and causes of high-manganese groundwater in Pearl River Delta during urbanization. Huan Jing Ke Xue 2022, 43, 4449–4458. [Google Scholar] [PubMed]
- Wang, L.; Zhang, Q.; Wang, H. Rapid Urbanization Has Changed the Driving Factors of Groundwater Chemical Evolution in the Large Groundwater Depression Funnel Area of Northern China. Water 2023, 15, 2917. [Google Scholar] [CrossRef]
Disclaimer/Publisher’s Note: The statements, opinions and data contained in all publications are solely those of the individual author(s) and contributor(s) and not of MDPI and/or the editor(s). MDPI and/or the editor(s) disclaim responsibility for any injury to people or property resulting from any ideas, methods, instructions or products referred to in the content. |
© 2025 by the authors. Licensee MDPI, Basel, Switzerland. This article is an open access article distributed under the terms and conditions of the Creative Commons Attribution (CC BY) license (https://creativecommons.org/licenses/by/4.0/).