Article

Assessing the Risk of Internal Loading of Phosphorus from Drinking Reservoir Sediments

1
School of Earth and Environmental Science, Cardiff University, Main Building, Museum Avenue, Cardiff CF10 3AX, UK
2
School of Bioscience, Cardiff University, Sir Martin Evans Building, Museum Avenue, Cardiff CF10 3AX, UK
3
Department of Architecture and Civil Engineering, University of Bath, Claverton Down, Bath BA2 7AY, UK
*
Author to whom correspondence should be addressed.
Water 2025, 17(6), 799; https://doi.org/10.3390/w17060799
Submission received: 4 February 2025 / Revised: 4 March 2025 / Accepted: 7 March 2025 / Published: 11 March 2025

Abstract

:
The natural process of lake and reservoir eutrophication through nutrient accumulation within sediments has been accelerated through anthropogenic sources of nitrogen and, especially, phosphorus (P). Stored nutrients can result in significant internal loading (during periods of low sediment redox potential or elevated pH), which may drive poor water quality despite best practices in catchment management. Internal P loading can promote proliferation of cyanobacterial and algal taxa responsible for harmful algal blooms (HABs), as well as taste and odour (T&O) and cyanotoxin events. Here, we investigate the sediment and water column P content of eight reservoirs by analysing iron-bound (Fe-P), calcium-bound (Ca-P), and labile P fractions. We find that all but one reservoir demonstrated high iron (Fe) content (27–52 g Fe/kg sediment), suggesting a high Fe-P binding capacity and hence a potentially high susceptibility to redox-mediated internal loading. However, we found no correlation between Fe-P and Fe content in sediments, suggesting the Fe pool was not saturated with P and thus has capacity for further storage. All sites had low levels of labile P (up to 0.14 mg P-PO4/g dry sediment), with the highest pool of P being Ca-bound, which would be expected based on catchment geology and the presence of Ca-minerals which bind P. Currently, within industry, emphasis falls on controlling the external loading of nutrients from the surrounding catchment, often ignoring the critical role of internal loading. However, here, we demonstrate the need to continually monitor sediment P content and potential internal loading as part of the standard monitoring regime used by water companies to inform reservoir management strategies.

1. Introduction

Eutrophication of water bodies due to phosphorus (P) loading is widespread and well documented [1], and this remains a huge challenge with regards to the ecological quality of freshwater systems and potable drinking water supplies [2]. It has been reported that the input of P into freshwater systems has increased globally by 75% since the industrial revolution, with P fluxes increasing from 8 to 22 million metric tonnes per year in the same period [3]. Historically, point source discharges of P into surface water systems was due to the prolific use of domestic and industrial P-rich detergents and other chemicals; however, these sources have reduced in recent years. Phosphorus, which has been widely used within agriculture to improve crop production [4,5], now predominantly enters waterways from diffuse sources, e.g., following the leaching of agricultural fertilizer [6]. Importantly, P is readily stored in reservoir sediments bound to Fe- and Ca-rich minerals [7]; hence, historical sources of P have combined to result in a legacy of stored P within lake and reservoir sediments. This legacy effect of stored P is a significant contributor to the risk of eutrophication and decreased water quality within lakes and reservoirs, despite improvements in catchment management and reductions in anthropogenic P emissions.
Abstracted river inputs, rich in P, are largely responsible for external loading of P from rivers into drinking water supply reservoirs. As a limiting factor, P distribution and availability directly affects the biomass, biodiversity, and productivity of aquatic plants and phytoplankton [8]. As such, shifts in the concentrations of P within freshwater systems can trigger cyanobacterial bloom events, including harmful algal blooms (HABs), as well as supporting the proliferation of cyanobacterial taxa responsible for the production of taste and odour (T&O) metabolites and cyanotoxins. Such water quality events are of great concern to the water industry as, in drinking water supply reservoirs, the presence of such water-quality issues not only trigger customer complaints but require high-cost drinking reservoir management programmes and water treatment processes. This is of significant concern regarding water-supply security, where climate change influences the quality and quantity of water resources are increasing stressors that already results in high costs and, arguably, over-stressed water-treatment systems within the water-supply industry. To quote one UK water company, “every drop counts”, and therefore, water quality is now almost as important as water quantity.
Due to the issues surrounding excessive P within the UK, as well as across Europe, regulations are in place to monitor and control the input of P into rivers and lakes [9], and there has been a notable reduction in external P loading in recent years [10]. However, attention also needs to be paid to the potential for internal loading from sediments, which may harbour decades of stored P [11]. A reduction in externally sourced P through management can increase the significance of internal P loading from the sediment [12], with the underlying processes influencing P release from sediments having been extensively reviewed [13]. Under suitable pH and redox conditions, P released from sediments can render waterbodies eutrophic [7,14,15,16]. The fraction bound to Fe (Fe-P) is highly susceptible to redox potential [13,17]. Stratification of a water body and/or high bacterial metabolic rates in sediments can induce a low redox state in which ferrous Fe3+ is reduced to ferric Fe2+, in turn reducing the binding capacity of P as phosphate (OP). This increases the amount of labile P which can be released across the sediment-water interface [17]. Increased temperature is typically linked to reduced P adsorption by sediments [18]. In sediments with high levels of calcium (Ca), calcium-bound P (Ca-P) is more susceptible to changes in pH, which results in hydroxyl ions competing with OP for binding capacity. Due to the presence of a chemical gradient and/or sediment resuspension (characteristic of shallow water bodies), high concentrations of P in sediment can lead to P release into overlying water [19,20] found that more than 50% of externally loaded P can be stored within sediment, and, under the right conditions, the effects of internal P loading from sediments to the water column can be seen for decades after the external P loading has ceased [21,22]. It is therefore imperative that lake and reservoir managers know the nutrient storage capacity and mineral composition of the sediments at their sites to ultimately maintain and preserve water quality, something which is not currently implemented into standard monitoring procedure.
Here, we investigate the sediment and water column P content of eight British reservoirs, belonging to four British water companies, by analysing iron-bound (Fe-P), calcium-bound (Ca-P), and labile P fractions. This approach was taken as the methods for such analysis are simplistic and could easily be undertaken through sediment sampling and standard laboratory processes by water companies or their subcontractors. The overarching aim is to demonstrate the value of sediment P characterisation to better evidence reservoir management such as engineered approaches, e.g. forced mixing or catchment management to reduce external loading.

2. Methods

2.1. Sampling Sites

Between April 2023 and February 2024, 60 cm3 sediment cores (with an internal core diameter of 9 cm, taken at a 3 cm depth) were collected from eight drinking water supply reservoirs, belonging to four British water companies, using a UWITEC USC 06000 gravity corer. Reservoirs are anonymised at the request of the water company partners. Additional smaller, unquantified samples were also collected from some reservoir sites for sediment surface samples. Sample collection dates and sampling depths are summarised in Table 1. Note that sampling dates spanned different seasons and hence different sediment conditions; we stress the aim of this study was not to compare sites but to utilise sediment sampling opportunities to demonstrate the extent of P storage in reservoirs and, ultimately, the need for routine sediment analysis in lake and reservoir management. Sediment samples were stored at 4 °C while in transit, whereby a subsample of 2 to 20 g was shipped to Cardiff University and stored at −20 °C until analysis (within 2 to 3 days), and the remaining sample volume was shipped to Envirolab (Hattersley, UK) for analysis. Note that Reservoir E was treated with copper sulphate during July 2022 and 2023 [23].

2.2. Sediment Composition

Iron content analysis was performed by Envirolab using an in-house method, i.e. A-T-024 using acid digestion of the sediment samples, followed by ICP-OES. Extraction of iron-bound (Fe-P), calcium-bound (Ca-P), and labile P fractions was conducted at Cardiff University in May 2023. Sediment samples were thawed at 4 °C in the dark overnight and homogenised prior to analysis. Triplicate 0.5–2 g subsamples of each sediment were dried at 85 °C for 24 h and water content was determined as mass lost as a percentage of the initial weight. Paired wet sediment samples were incubated with 0.1 M sodium hydroxide, 0.5 M hydrochloric acid, or 1 M ammonium chloride, respectively, to determine Fe-P, Ca-P, and labile P fractions stored in the sediment [17]. The samples were mixed with 20 mL of extractant and incubated at room temperature, with slight agitation. Fe-P samples were incubated with hydrochloric acid for 24 h, Ca-P samples were incubated for 17 h with sodium hydroxide. Labile P measured as OP (orthophosphate) was extracted with ammonium chloride and twice incubated for 2 h. At the end of the incubation, sediment was removed by centrifugation (4000 rpm for 15 min), the sodium hydroxide supernatant neutralised with 4 mL 0.5 M hydrochloric acid, and the hydrochloric acid supernatant neutralised with 3 mL of 3 M sodium hydroxide.
Each supernatant was analysed for orthophosphate (OP) using the ascorbic acid method [24], adapted to a 96-well plate and read using a BMG SPECTROstar NANO plate reader [1,2]. A neutralised blank of each of the incubation solutions was used to prepare the standards (with KH2PO4) and dilute samples where required. Each sample was analysed in triplicate with these methods. The amount of OP per dry sediment (mg P-PO4/g sediment) was calculated for each individual analysis.

2.3. Phosphate Absorption Capacity

Phosphate absorption capacity (PAC) was assessed by incubating sediment samples exposed to a range of phosphate concentrations and determining the amount absorbed at equilibrium [3]. Wet sediment equivalent to a known dry weight of 0.1–0.2 g dry weight was weighed into five 50 mL plastic centrifuge tubes. Phosphate (KH2PO4) solutions of 0, 0.05, 0.5, 1, and 5 mg/L P-PO4 were prepared, and 20 mL of each concentration was added to a tube. In some cases, where there was insufficient sediment due to small sample volume, 10 mL of solution was added. Tubes were agitated and incubated for 24 h. At 1, 2, 4, 6, and 24 h; the samples were mixed by inversion; and a 1-mL aliquot was taken. The aliquots were centrifuged for 10 min at 4000 rpm and then analysed for OP (see above) using phosphate standards prepared with KH2PO4 in ultrapure water for the calibration curve.
The equilibrium phosphorus capacity (EPC) is calculated by plotting the final phosphate concentration, mg/L P-PO4 (C), and the amount of phosphate absorbed per gram of dry sediment at equilibrium, mg/g P-PO4 (E). The logarithmic trend was calculated in R [25]. The standard error for the EPC was calculated by adding the standard errors from the output to the equation below for c and m and determining the difference between the two. Data were fitted to the Freundlich equation which expresses the rate and capacity of the absorption. The output determined the intercept (c) and gradient (m) along with the standard error (se), from the trendline:
E = cse) + mse) ln (C).
The EPC was calculated when E = 0, thus,
E P C = 1 e ( c m ) .
Data were also fitted to the Freundlich equation which expresses the rate and capacity of the absorption. The Freundlich adsorption equation is as follows [26]:
E = k.C1/n,
where k and 1/n are constants depending on absorbent, solute, contact time, type of mixing, and temperature.
A logarithmic plot of E and C was used to determine the constants for each sediment from the following:
l o g E = l o g k + 1 n .   l o g   C ,
where k = E when C = 1 and the gradient equals 1/n.
A higher EPC suggests a higher risk of internal loading and can be compared to site OP concentrations in the water column. In simplistic terms, there is a risk of internal loading when OP is less than the EPC.

2.4. Orthophosphate in Overlying Water

Between June 2022 and December 2023, between 0.5 and 1L of accompanying reservoir water was collected from multiple locations within each reservoir (except Reservoir F) at different depths (surface water, a mid-point in the water column, and the bottom of water column near the sediment). The samples were stored at 4 °C prior to analysis. A 1-mL aliquot of each sample was filtered through a 0.45-µm nylon filter before being analysed for OP (as above). For Reservoir F, total phosphate (TP) data were provided by Company 3.

3. Results

3.1. Sediment Composition

Total Fe and water content for sediment samples taken from the eight reservoirs are summarised in Table 2. All sediments had high Fe content, ranging from approximately 27 to 52 g Fe/kg sediment. The exception was Reservoir A, which had only ~6 g Fe/kg sediment. This would suggest a high Fe-P binding capacity, though with a potentially high susceptibility to redox-mediated internal loading, for a majority of the sites (with the exception of Reservoir A).

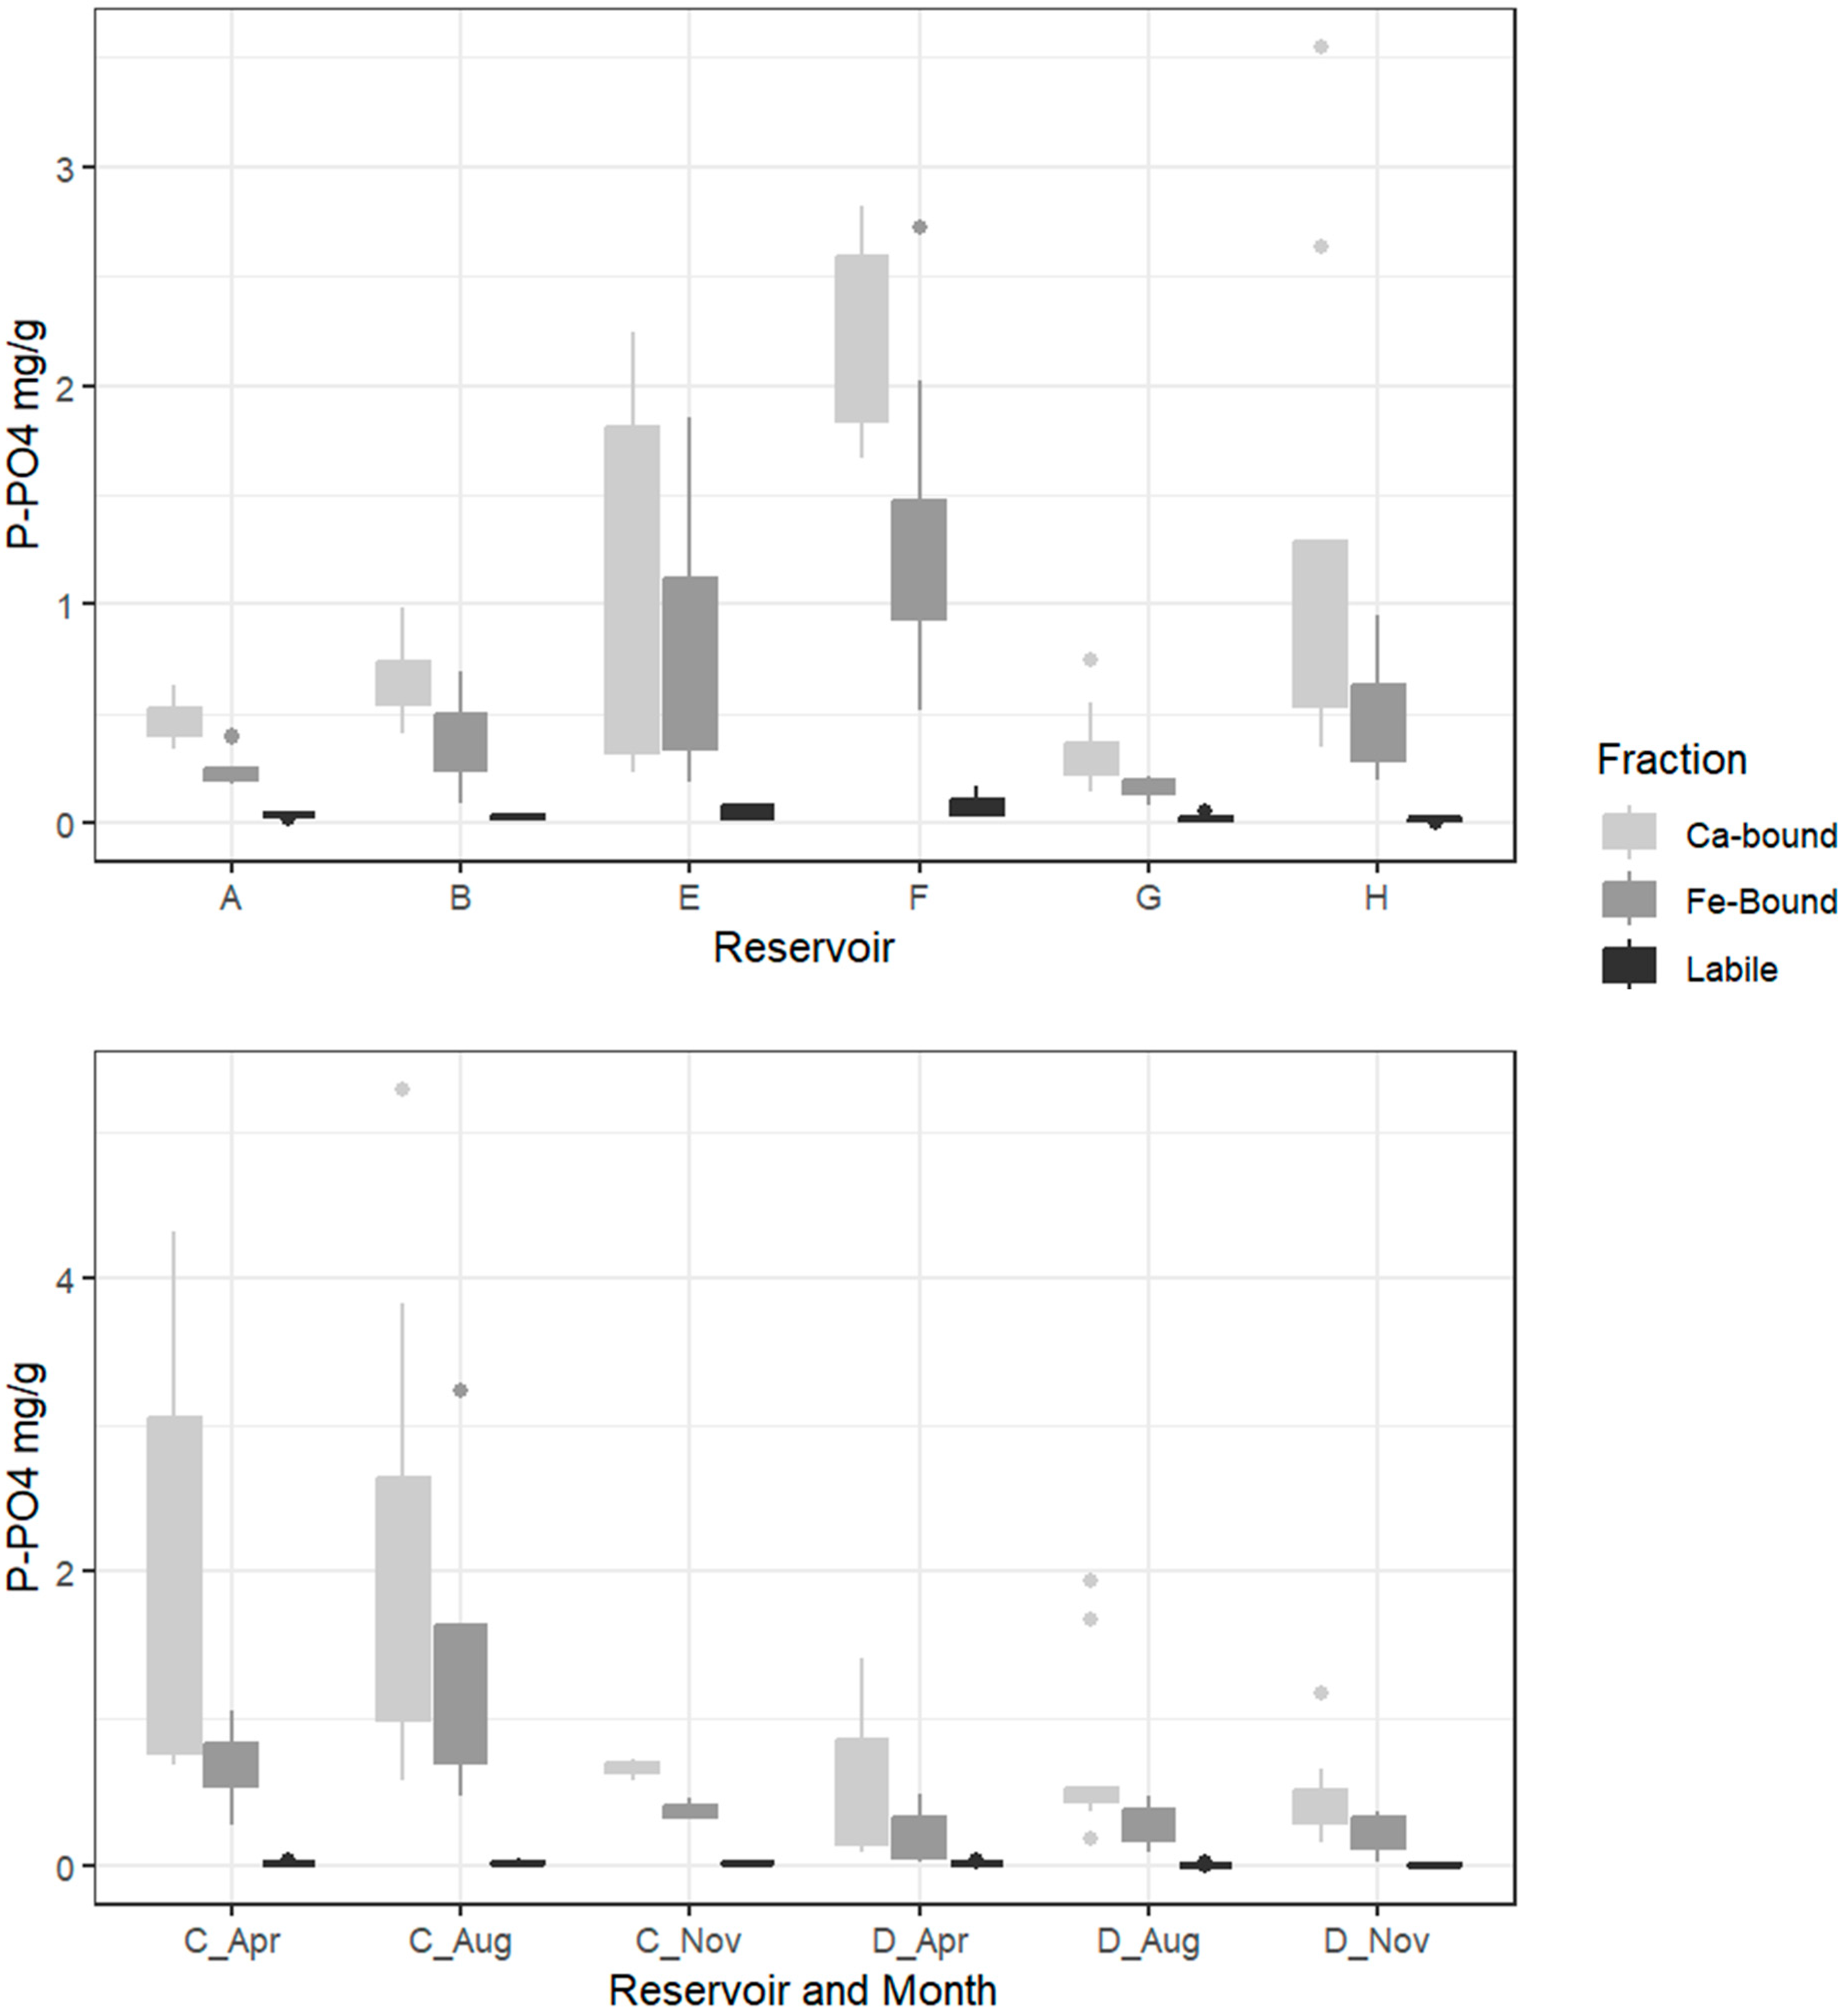
3.2. Phosphorus Fractions

All reservoirs showed P storage in the form of Fe-P (Figure 1). Reservoirs A, B, and G had lower levels of Fe-P (0.1–0.5 mg/g), while Reservoirs E, F, and H had a higher range of Fe-P (0.3–1.8 mg/g). Reservoir C had higher Fe-P in April and August (0.5–1.6 mg/g), and moderate levels in November (0.5 mg/L). Reservoir D had 0.2–1.9 mg/L Fe-P throughout the year. There was no correlation between Fe-P and iron content in the sediments. In comparison, all sites had lower levels of labile phosphate (up to 0.14 mg P-PO4/g dry sediment; Figure 1). For all reservoirs the highest pool of P was Ca-bound. Reservoir A, B, and G had lower levels of Ca-P at 0.2–0.7 mg/g, while Reservoirs E, F, and H had higher levels of Ca-P (0.3–2.6 mg/g). Reservoir C had the highest range in Ca-P (0.7–5.1 mg/g). Reservoir D had moderate levels of Ca-P throughout the year (0.8–1.1 mg/L).

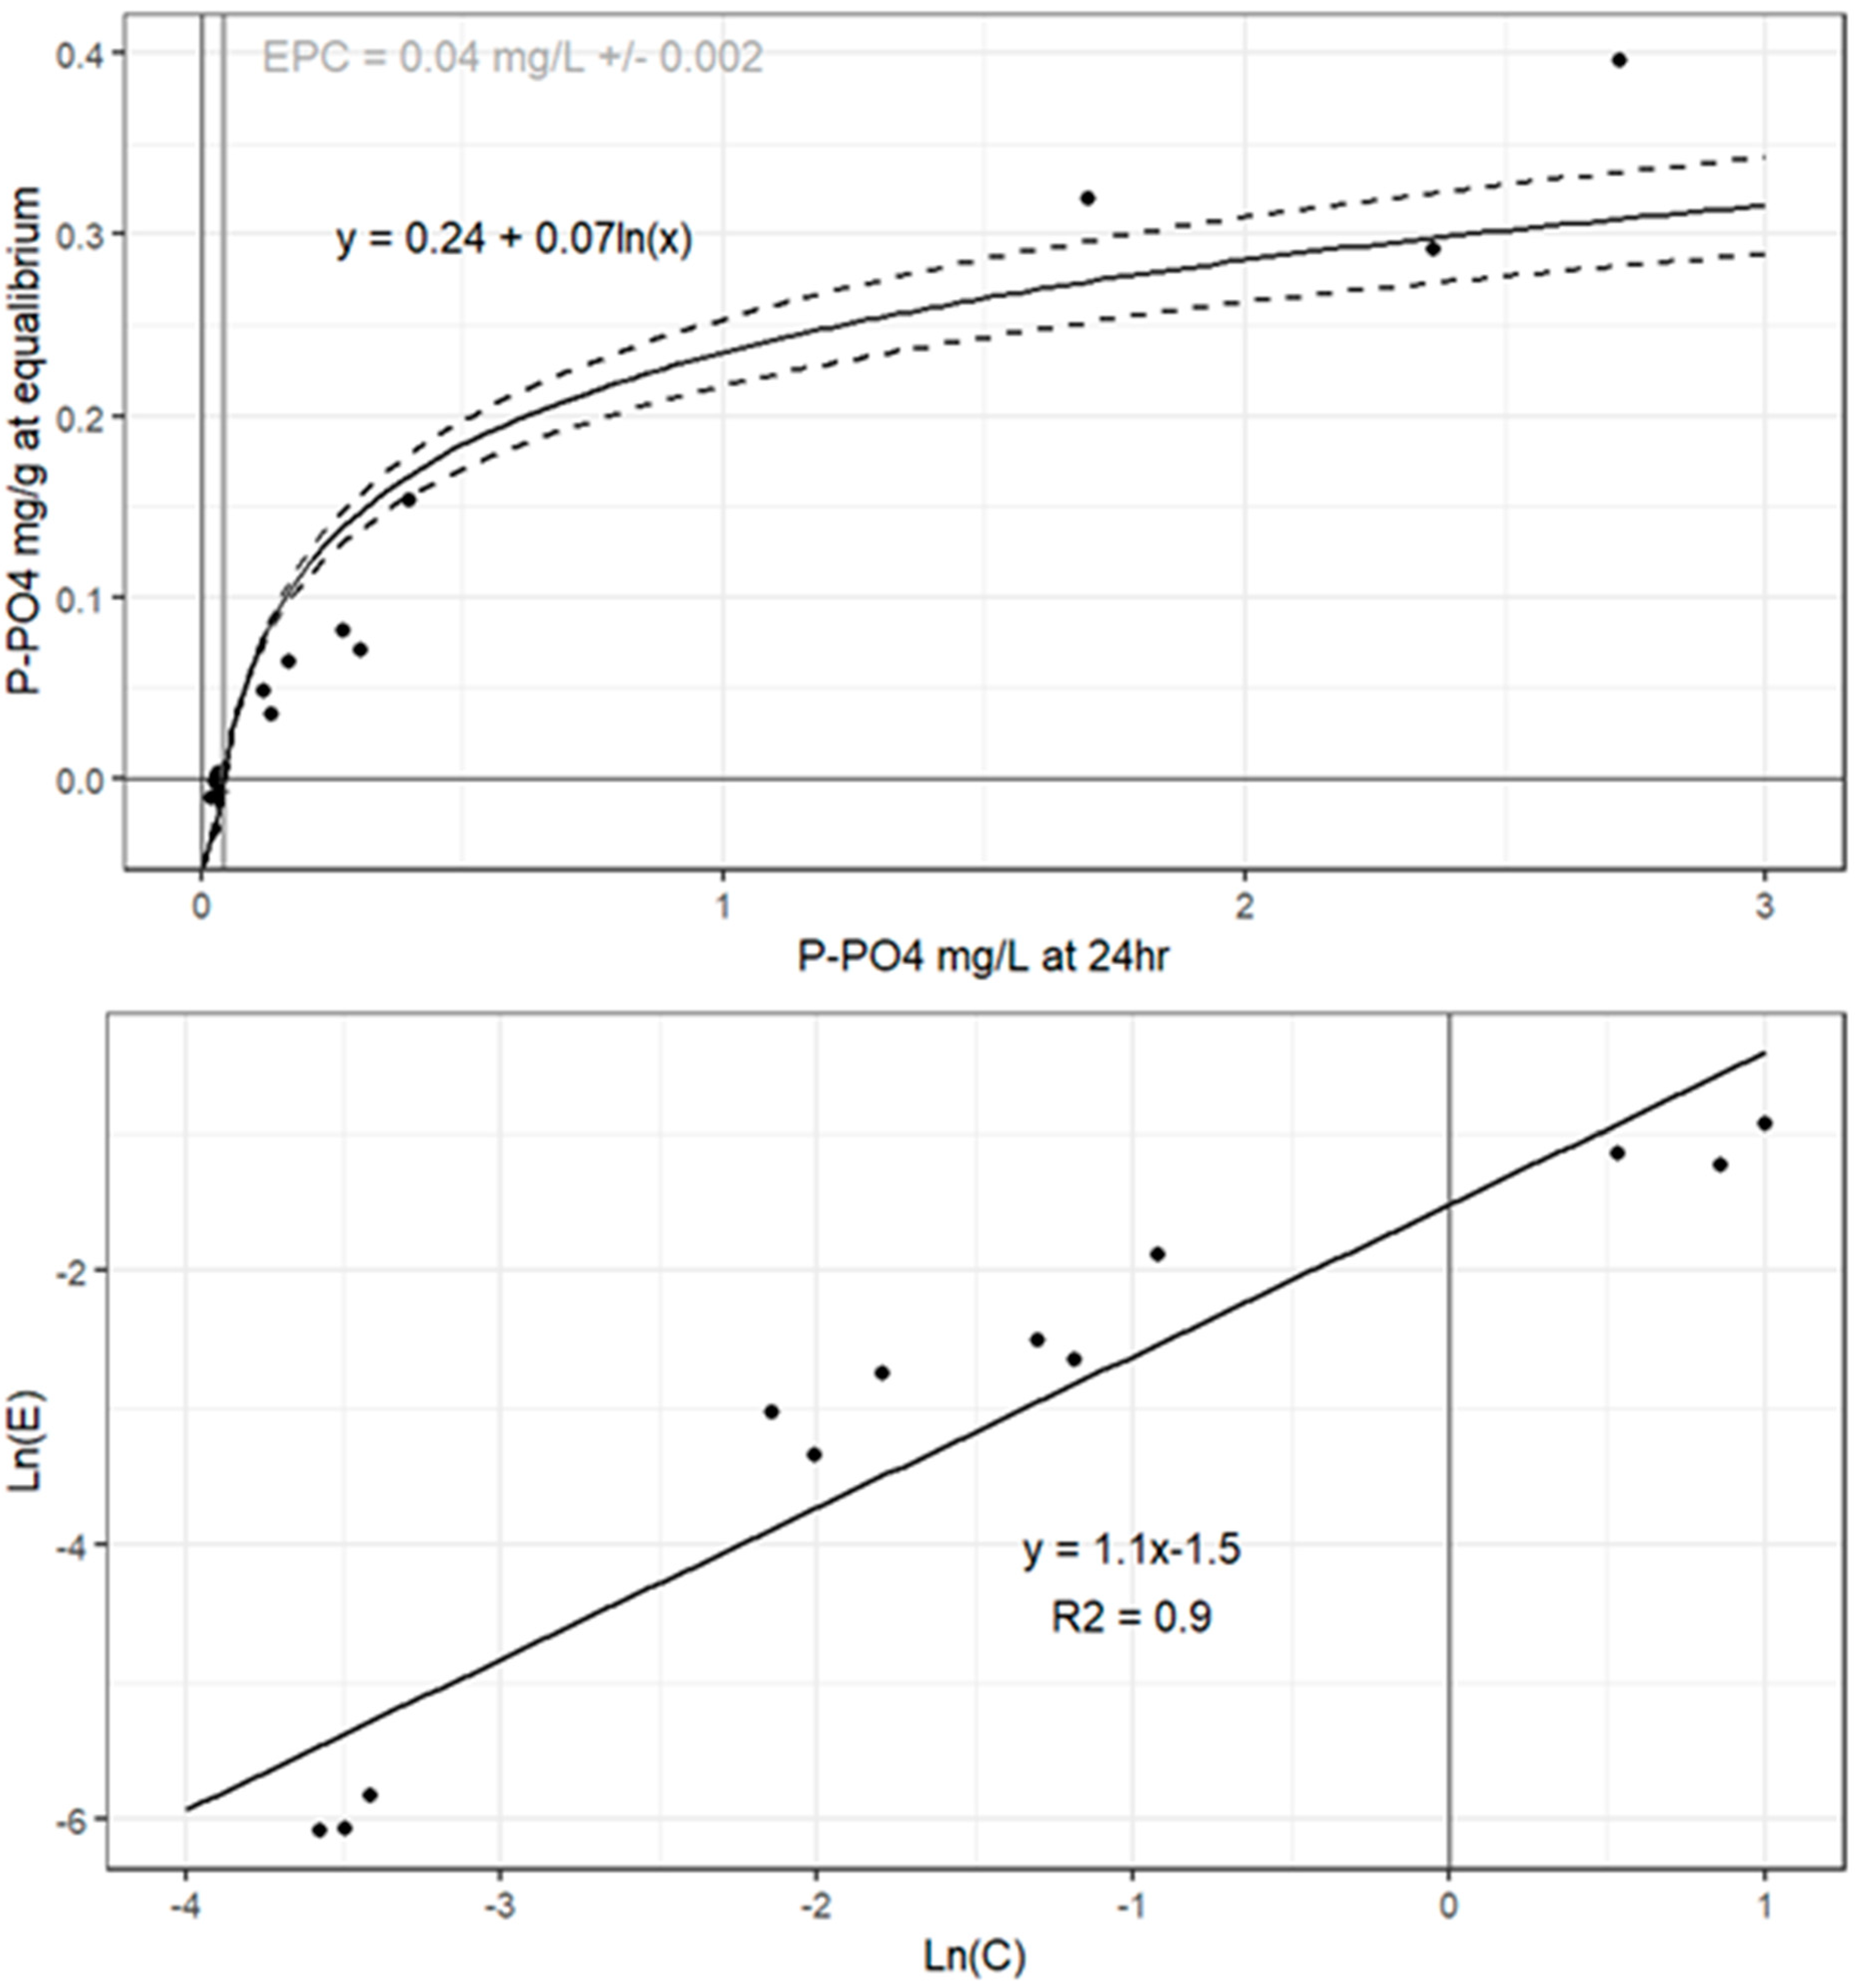
3.3. Phosphorus Absorption Capacity (PAC)

The phosphorus absorption capacity (PAC) was assessed by calculating the EPC with data fitted to the Freundlich and Langmuir equations; however, the latter equation did not show a significant fit for any of the reservoir data. Figure 2 shows examples of the EPC and Freundlich plots and Table 3 summarises these results. Reservoirs A, B, C, E, and F showed significant linear Freundlich plots (r2 > 0.6, p < 0.05), and Reservoirs G and H also had significant Freundlich plots (r2 > 0.8, p < 0.05), but with n > 1. Reservoir D had poor Freundlich plots with r2 < 0.6 (p > 0.05). The most notable result in analysing EPC for the 8 reservoirs (Table 3) is the very high values for Reservoirs E and F (0.44 and 0.49 mg P-PO4/L), which are the two sites regularly dosed with copper sulfate. Reservoir C had lower EPC in August, with similar values reported for sites G and H (0.013–0.18 mg/L). Reservoirs A, B, and C in November had higher EPC (0.03–0.06 mg/L), suggesting more likelihood for internal loading of P. Reservoir D had very low EPC values (0.007 mg/L).

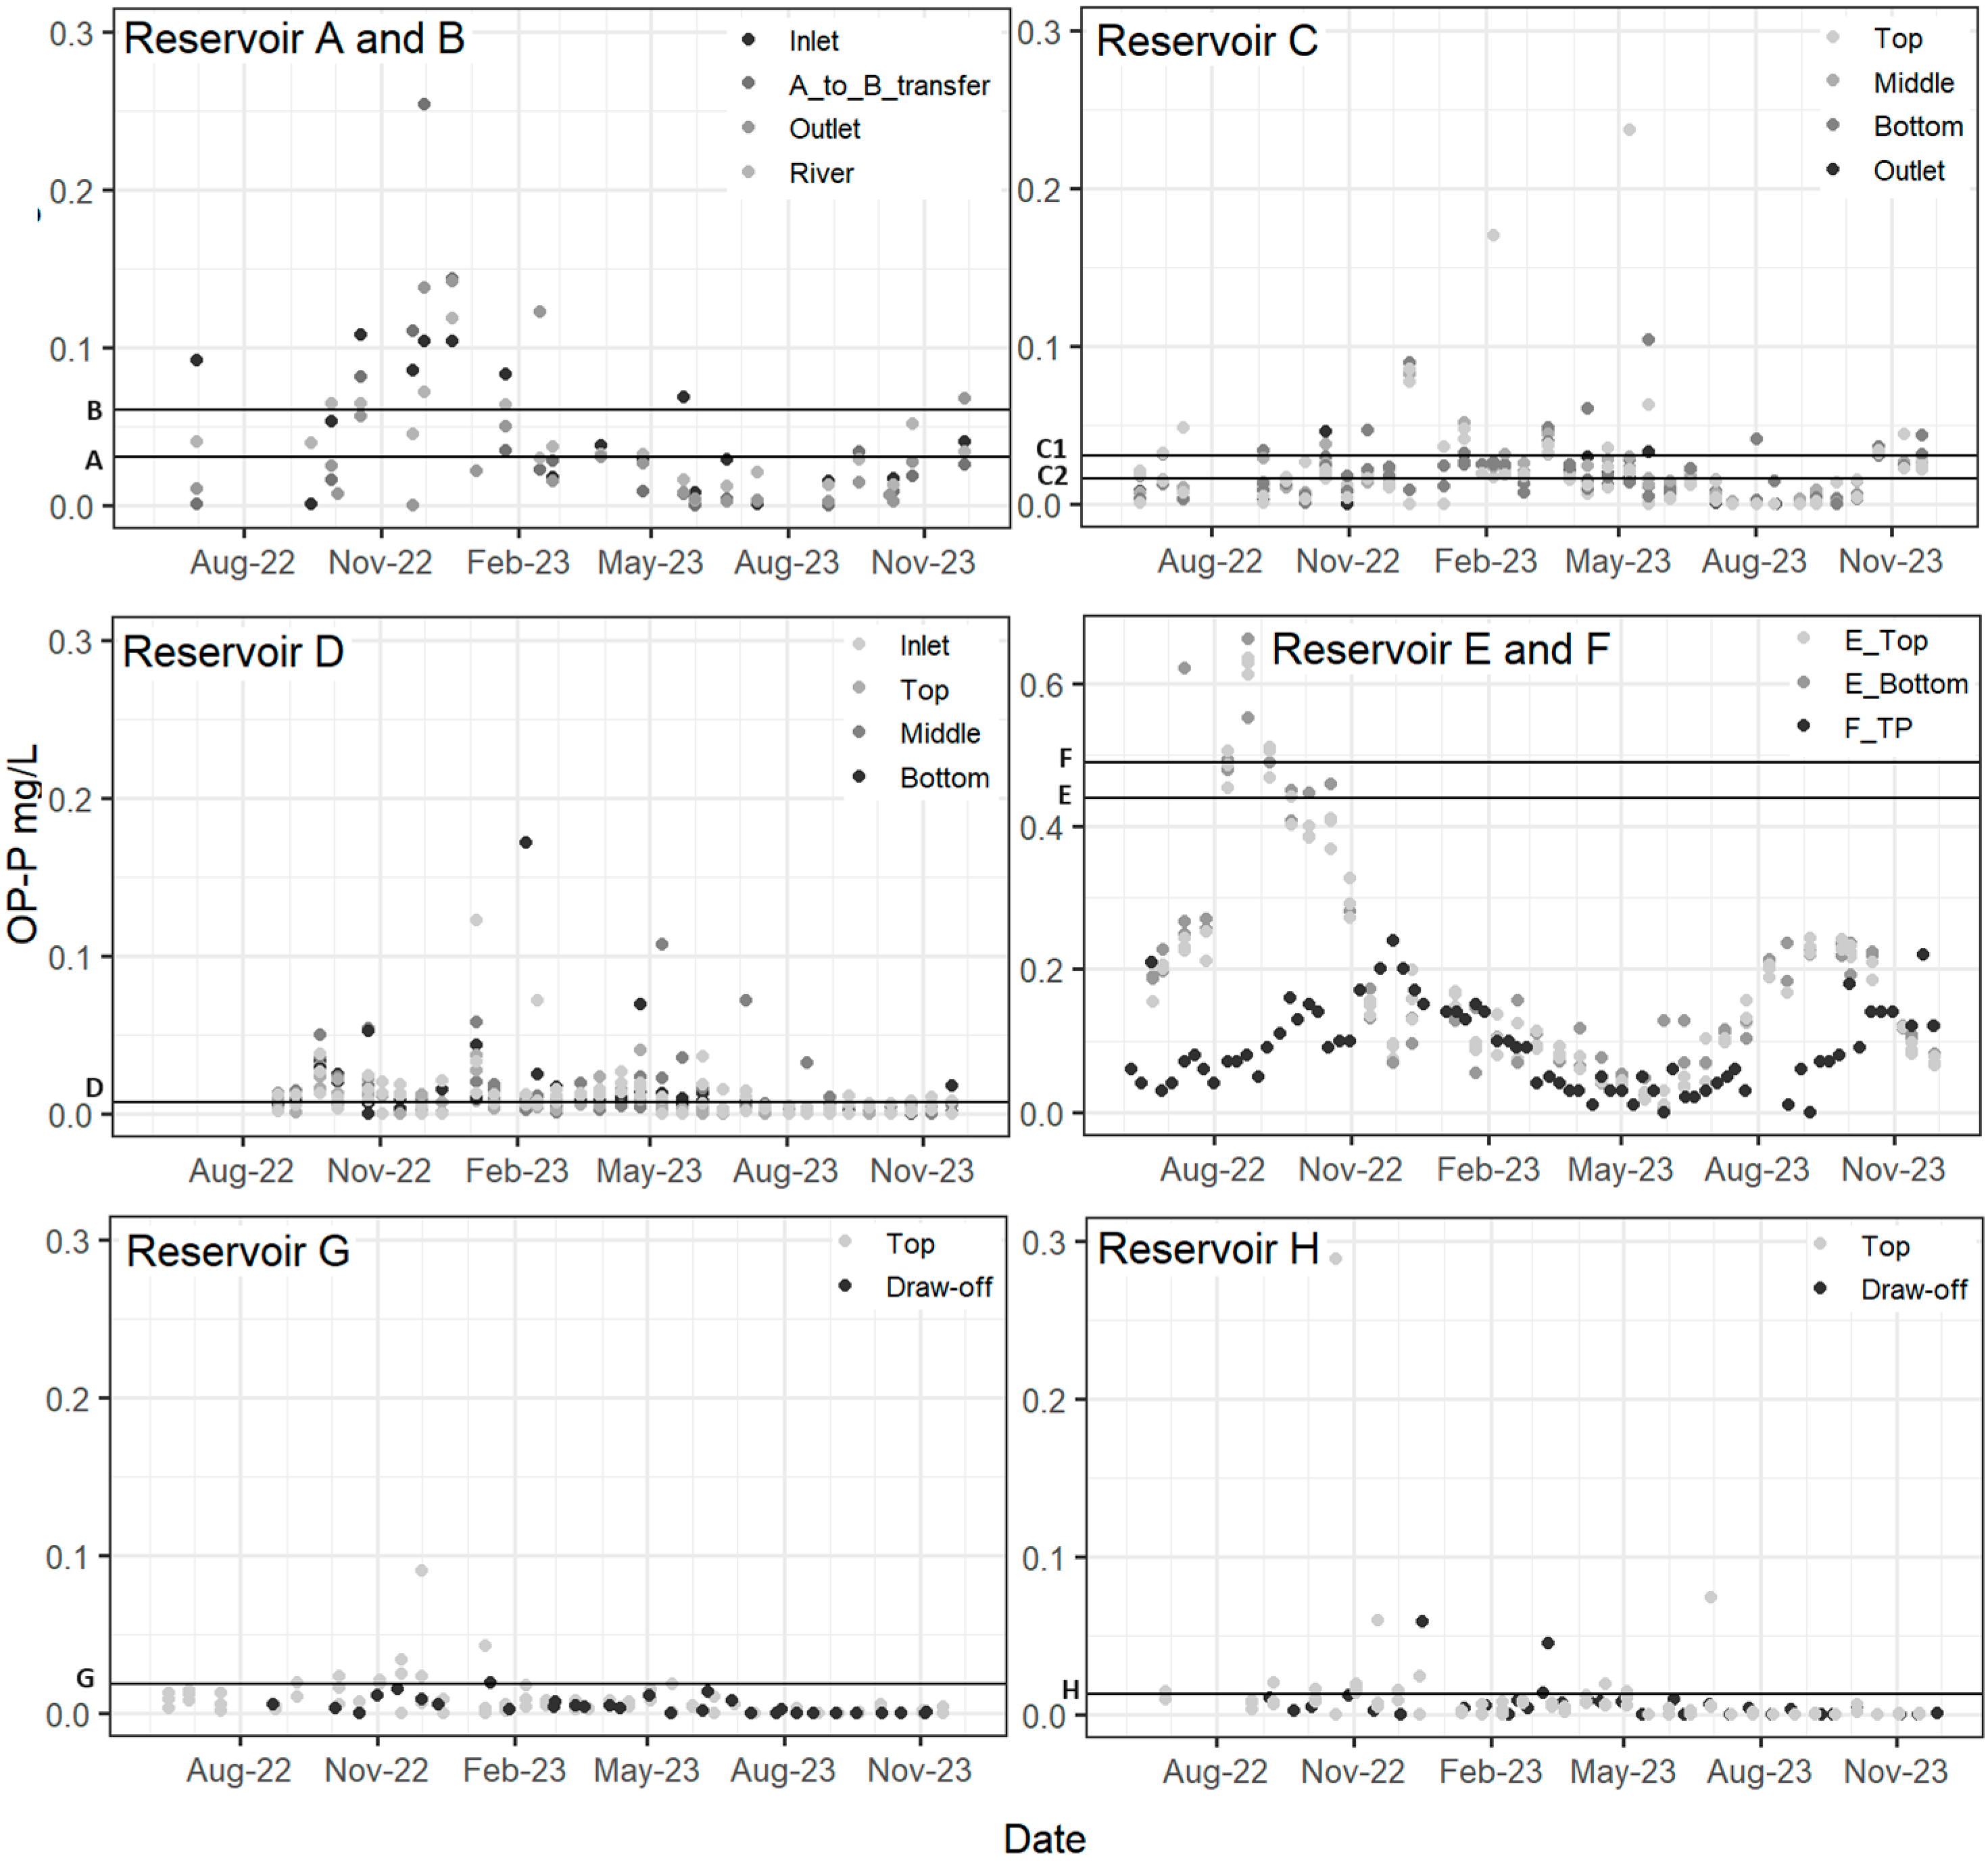
3.4. Orthophosphate (OP) and EPC

When comparing the calculated EPC with the OP concentrations in the overlying water column between June 2022 and December 2023, all reservoirs showed some OP readings below the corresponding EPC (Figure 3). It should be noted that different reservoirs were sampled at different locations and/or water depths as a function of different water company monitoring programmes; however, as data were limited, further analysis of spatial and depth concentrations relative to the calculated reservoir EPC values was not undertaken. Reservoirs A and B water sample OP concentrations were mostly below EPC (0.06 mg/L) from March to October 2023. Reservoir C OP levels were generally below the EPC (0.03 mg/L), particularly May to October. In Reservoir D, OP levels were mostly below the EPC (0.007 mg/L) after July 2023. The OP in Reservoir E was below the EPC (0.44 mg/L) except from August to October 2022. Reservoir F had TP below the EPC (0.49 mg/L) throughout the whole sampling period. Reservoir G typically had OP lower than EPC (0.018 mg/L), except for some samples between November 2022 and February 2023. The OP in Reservoir H was generally lower than EPC (0.013 mg/L), although there were some readings above the EPC. Overall, these data suggest a high likelihood for internal P loading based on the calculated EPCs, notably with high likelihood for internal loading in summer months when algal and cyanobacterial poor water quality risk is high.

4. Discussion

The aim of this study was to determine the extent of P storage from historical legacy inputs within a range of water-supply reservoirs. Results highlight the importance of studying reservoir sediments to evidence reservoir management. The experimental approach focused on determining the extent of P storage using simple sampling and laboratory techniques and demonstrating how relatively limited sampling can still be informative for management. Findings showed Ca-P to be the most abundant form of sediment P; however, all sites had a significant amount of P bound as Fe-P. In comparison, labile P was at a much lower sediment content, possibly due to release into the water column along diffusional gradients across the sediment-water interface. Findings indicated potential for pH, temperature, and redox-mediated processes to induce internal loading. Furthermore, comparing EPC with water-column OP concentrations, it would appear that these reservoirs would all have significant internal P loading. This is highly important when considering lake and reservoir management approaches to reduce the effects of biological water quality risk, e.g., HABs and T&O risk. These findings indicate that reducing external loading of P through catchment management may be ineffective as this will not address internal P loading from sediment.
With the exception of Reservoir A, all sampled reservoirs demonstrated high Fe content; this suggests a high Fe-P binding capacity and thus a potentially high susceptibility to redox-mediated internal loading [13,17,27]. There was no correlation between Fe-P and Fe content in the sediments, which indicates that the Fe pool was not saturated with P and therefore has further storage capacity. We also detected elevated EPC values (where a higher EPC suggests a higher risk of internal loading) [28] for Reservoirs A-C, as well as E and F (the two reservoir sites dosed each year with copper sulphate), indicating an increased likelihood for the internal loading of P into the reservoir water column. Further, we demonstrate that all reservoirs sampled had some OP measurements below EPC which again indicates a risk of internal loading, although perhaps expected based upon the Fe and Fe-P content of the sediment. Finally, in all reservoirs, we found that the highest pool of P storage was Ca-bound; however, this is not unexpected based upon catchment geology, hence the presence of Ca-minerals that can bind P [29,30].
The finding that reservoir water column OP concentrations were often below the EPC is important as many water companies work with stakeholders and land users within the catchment to reduce P in the form of external inputs to surface waters. This is, of course, critical; however, measuring the success of this management approach will be masked if internal loading of P results in sufficient nutrients to support biological processes (e.g., HABs, T&O events) and, ultimately, persistently poor water quality. Historical evidence of the failure to restore water quality through decreased external loading is established through work on the Norfolk Broads in the UK [31]. Here, external loading was significantly reduced but nutrient levels remained high through internal loading, requiring sediment dredging at some sites [31]. Additional studies also highlight such failures where, despite external loading limitations, biomanipulation of fish stocks and establishment of macrophytes were required to achieve lake recovery through more nature-based solutions [31,32,33]. These results demonstrate the complexities of lake and reservoir management and the need to consider bottom-up nutrient controls alongside top-down trophic cascade biological controls.
Another approach to reservoir management which has become increasingly popular is to prevent stratification of deeper sites through forced mixing, particularly for nutrient-related issues like surficial HAB. Destratification utilises engineered mixing/aeration via, e.g., turbines such as ResMix, water-lift aerators, or bubble plumes [34]. The general aim is to prevent surficial algal blooms whilst simultaneously mixing oxygen-rich surface waters into the deeper parts of the water column [35,36]. Ideally, this facilitates a higher redox potential in the benthic region and, in turn, decreased anoxia-driven sediment release of nutrients and other soluble chemical species. If these engineered aeration approaches are able to establish a higher redox potential in the sediment as well; then, ferric Fe3+ will not be reduced to ferrous Fe2+ and hence binding capacity of OP is preserved [37]. Alternatively, aeration mixers may simply maintain water-column redox and facilitate re-oxidation of reduced forms of compounds released from the sediment; this strategy has been used for mitigation of manganese and iron released from the sediment as soluble Mn2+ and Fe2+, oxidising these back to insoluble forms that precipitate out and settle back to the bottom sediment of the reservoir [38,39,40]. There are mixed opinions in the literature on the effectiveness of aeration for controlling internal P loading; however, it has been shown in some cases to be a successful approach for sediment P retention, e.g., as Fe-P complexes [41,42]. Combining in-reservoir aeration strategies with management of external P loading has been recommended [43].
An important aspect of reservoir management in the current study is that four of our study sites, Reservoirs C, D, E, and H, had forms of engineered mixing (i.e., ResMix or bubbler systems; information supplied by each water company), yet these sites still had a significant likelihood of internal P loading. It is suggested based on the results of this study that, as part or any engineered solution being considered by a water company, sediment analysis to characterise the extent of redox-susceptible P storage in the reservoir should be undertaken to determine the likelihood of success. Concomitant mass balance analyses can determine the relative importance of external and internal P loadings.
Our finding that all sampled reservoirs demonstrated high Fe content, suggesting increased Fe-P binding capacity, indicates a potentially high susceptibility for redox-mediated internal P loading from the sediment. Whilst higher Fe-P content would suggest increased potential for internal loading from this pool, this is dependent upon redox-mediated processes, which, in turn, are affected by carbon loading to the sediment. Hence, risk is elevated when there is increased sediment input of carbon (e.g., from algal deposition) alongside storage of Fe-P. High benthic bacterial metabolism can cause a decline in redox potential, inducing ferric to ferrous reduction and subsequent release of bound P. This is typically paralleled by increases in soluble Fe2+ and Mn2+ in the overlying water [37,44].
Two other key findings of this study highlight complexities in understanding sediment internal loading of P. First, when water column OP concentrations were less than EPC, this often coincided with comparatively low sediment labile P content. This finding strongly suggests that there is internal release of P from the labile pool across the sediment-water interface, facilitated by simple diffusional gradients (i.e., high concentrations in the sediment to lower concentrations in the water column) or through sediment disturbance (e.g., wind-induced resuspension or bioturbation). Released P from the sediment would be mixed into the water column where biological uptake would contribute to dilution effects; hence, spikes in water column OP concentrations are not likely to be characterised without high temporal resolution of monitoring. It is important to realise that even with a mixed water column, high rates of bacterial metabolism can result in increased biological oxygen demand (BOD), especially if warmer water is mixed downwards in the water column and warms the sediment [13,27]. This will potentially reduce sediment redox and cause reduction of ferrous Fe2+ and release of P into the labile pool, thereby increasing the diffusion gradient across the sediment-water interface and contributing to internal P loading even within a mixed reservoir.
Secondly, the high EPC and sediment P concentrations of the reservoir sites with copper sulphate dosing highlights the need for more holistic management strategies. Copper sulphate is an efficient means of HAB termination [23,45,46,47] via killing of the algae and cyanobacteria. However, the dead cells then precipitate and settle out of the reservoir, increasing the storage of nutrients once the organic matter has been mineralised. Results indicate that it is highly likely that this management approach increases eutrophication rates and, correspondingly, longer term processes influence internal nutrient loading in these reservoirs.
In conclusion, this simple study of reservoir sediments from eight UK drinking water supply reservoirs is a reminder that reservoir and lake managers must consider sediment analysis as essential for understanding nutrient dynamics and must integrate such methods into standard monitoring procedures and management impact assessments. The fact that all study sites showed significant risk of internal P loading, despite four of these sites having aeration mixers to prevent stratification, indicates the potentially significant and prevalent influence of internal loading within water-supply reservoirs. The study also demonstrates (i) a simple monitoring approach for evaluating reservoir sediment P storage and (ii) a straightforward management approach for using sediment EPC and water-column OP concentration comparisons to establish if internal P loading is likely to occur. The methods outlined here would complement, and inform on the successes or failures of, potential approaches for managing the internal loading of P in reservoir sediments, which may include (i) sediment dredging; (ii) biomanipulation of fish stocks and the establishment of macrophytes to facilitate recovery through nature-based solutions (i.e., bottom-up nutrient control); and (iii) prevention of the stratification of deeper sites through the engineered mixing or aeration to facilitate a higher redox potential in the benthic region and decrease the anoxia-driven sediment release of nutrients. Overall, findings emphasise the critical importance of knowledge of sediment nutrient storage and internal loading potential to successful lake and reservoir management and sustainable water resources.

Author Contributions

Conceptualization, R.G.P.; methodology, V.B. and J.M.R.; formal analysis, V.B., S.E.W. and R.G.P.; investigation, S.E.W., V.B. and R.G.P.; data curation, S.E.W. and V.B.; writing—original draft preparation, S.E.W., R.G.P. and V.B.; writing—review and editing, S.E.W., V.B., P.K., J.M.R., L.D.B. and R.G.P.; visualization, V.B.; supervision, R.G.P.; project administration, S.E.W., V.B. and R.G.P.; funding acquisition, S.E.W., P.K. and R.G.P. All authors have read and agreed to the published version of the manuscript.

Funding

This study was kindly funded privately by a consortium of UK water industry partners: Jersey Water, United Utilities, Dŵr Cymru Welsh Water, and Yorkshire Water.

Data Availability Statement

The data from this study are stored on Zonodo and can be found at doi: https://doi.org/10.5281/zenodo.14163478.

Conflicts of Interest

We declare that the authors have no conflicts of interest that might be perceived to influence the results and/or discussion that are reported in this article.

References

  1. Oliveira, M.; Machado, A.V. The Role of Phosphorus on Eutrophication: A Historical Review and Future Perspectives. Environ. Technol. Rev. 2013, 2, 117–127. [Google Scholar] [CrossRef]
  2. Johnes, P.J.; Louise Heathwaite, A.; Spears, B.M.; Brownlie, W.J.; Elser, J.J.; Haygarth, P.M.; Macintosh, K.A.; Withers, P.J.A. Phosphorus and Water Quality. In Our Phosphorus Future; Brownlie, W.J., Sutton, M.A., Heal, K.V., Reay, D.S., Spears, B.M., Eds.; UK Centre for Ecology & Hydrology: Edinburgh, UK, 2022; pp. 1–23. [Google Scholar]
  3. Rittmann, B.E.; Mayer, B.; Westerhoff, P.; Edwards, M. Capturing the Lost Phosphorus. Chemosphere 2011, 84, 846–853. [Google Scholar] [CrossRef]
  4. Cordell, D.; Drangert, J.O.; White, S. The Story of Phosphorus: Global Food Security and Food for Thought. Glob. Environ. Change 2009, 19, 292–305. [Google Scholar] [CrossRef]
  5. Ashley, K.; Cordell, D.; Mavinic, D. A Brief History of Phosphorus: From the Philosopher’s Stone to Nutrient Recovery and Reuse. Chemosphere 2011, 84, 737–746. [Google Scholar] [CrossRef]
  6. Powers, S.M.; Tank, J.L.; Robertson, D.M. Control of Nitrogen and Phosphorus Transport by Reservoirs in Agricultural Landscapes. Biogeochemistry 2015, 124, 417–439. [Google Scholar] [CrossRef]
  7. Huang, Q.; Wang, Z.; Wang, C.; Wang, S.; Jin, X. Phosphorus Release in Response to PH Variation in the Lake Sediments with Different Ratios of Iron-Bound P to Calcium-Bound P. Chem. Speciat. Bioavailab. 2005, 17, 55–61. [Google Scholar] [CrossRef]
  8. Hu, A.; Choi, M.; Tanentzap, A.J.; Liu, J.; Jang, K.S.; Lennon, J.T.; Liu, Y.; Soininen, J.; Lu, X.; Zhang, Y.; et al. Ecological Networks of Dissolved Organic Matter and Microorganisms under Global Change. Nat. Commun. 2022, 13, 3600. [Google Scholar] [CrossRef]
  9. WFD UKTAG River Phosphorus UKTAG Method Statement; Water Framework Directive (WFD) United Kingdom Technical Advisory Group (UKTAG): Stirling, UK, 2013.
  10. Environment Agency. Phosphorus and Freshwater Eutrophication Pressure Narrative; Environment Agency: London, UK, 2009. [Google Scholar]
  11. Rippey, B.; Campbell, J.; McElarney, Y.; Thompson, J.; Gallagher, M. Timescale of Reduction of Long-Term Phosphorus Release from Sediment in Lakes. Water Res. 2021, 200, 117283. [Google Scholar] [CrossRef]
  12. van der Molen, D.T.; Boers, P.C.M. Influence of Internal Loading on Phosphorus Concentration in Shallow Lakes before and after Reduction of the External Loading. Hydrobiologia 1994, 275–276, 379–389. [Google Scholar] [CrossRef]
  13. Boström, B.; Andersen, J.M.; Fleischer, S.; Jansson, M. Exchange of Phosphorus across the Sediment-Water Interface. Hydrobiologia 1988, 170, 229–244. [Google Scholar] [CrossRef]
  14. Penn, M.R.; Auer, M.T.; Doerr, S.M.; Driscoll, C.T.; Brooks, C.M.; Effler, S.W. Seasonality in Phosphorus Release Rates from the Sediments of a Hypereutrophic Lake under a Matrix of PH and Redox Conditions. Can. J. Fish. Aquat. Sci. 2000, 57, 1033–1041. [Google Scholar] [CrossRef]
  15. Moore, A.; Reddy, K.R. Role of Eh and PH on Phosphorus Geochemistry in Sediments of Lake Okeechobee, Florida. J. Environ. Qual. 1994, 23, 955–964. [Google Scholar] [CrossRef]
  16. Tammeorg, O.; Nürnberg, G.; Horppila, J.; Haldna, M.; Niemistö, J. Redox-Related Release of Phosphorus from Sediments in Large and Shallow Lake Peipsi: Evidence from Sediment Studies and Long-Term Monitoring Data. J. Great Lakes Res. 2020, 46, 1595–1603. [Google Scholar] [CrossRef]
  17. Perkins, R.G.; Underwood, G.J.C. The Potential for Phosphorus Release across the Sediment-Water Interface in an Eutrophic Reservoir Dosed with Ferric Sulphate. Water Res. 2001, 35, 1399–1406. [Google Scholar] [CrossRef] [PubMed]
  18. Redshaw, C.J.; Mason, C.F.; Hayes, C.R.; Roberts, R.D. Factors Influencing Phosphate Exchange across the Sediment-Water Interface of Eutrophic Reservoirs. Hydrobiologia 1990, 192, 233–245. [Google Scholar] [CrossRef]
  19. Ding, Y.; Sun, L.; Qin, B.; Wu, T.; Shen, X.; Wang, Y. Characteristics of Sediment Resuspension in Lake Taihu, China: A Wave Flume Study. J. Hydrol. 2018, 561, 702–710. [Google Scholar] [CrossRef]
  20. Carey, C.C.; Rydin, E. Lake Trophic Status Can Be Determined by the Depth Distribution of Sediment Phosphorus. Limnol. Ocean. 2011, 56, 2051–2063. [Google Scholar] [CrossRef]
  21. Yang, C.; Yang, P.; Geng, J.; Yin, H.; Chen, K. Sediment Internal Nutrient Loading in the Most Polluted Area of a Shallow Eutrophic Lake (Lake Chaohu, China) and Its Contribution to Lake Eutrophication. Environ. Pollut. 2020, 262, 114292. [Google Scholar] [CrossRef]
  22. Wang, M.; Xu, X.; Wu, Z.; Zhang, X.; Sun, P.; Wen, Y.; Wang, Z.; Lu, X.; Zhang, W.; Wang, X.; et al. Seasonal Pattern of Nutrient Limitation in a Eutrophic Lake and Quantitative Analysis of the Impacts from Internal Nutrient Cycling. Environ. Sci. Technol. 2019, 53, 13675–13686. [Google Scholar] [CrossRef]
  23. Watson, S.E.; Taylor, C.H.; Bell, V.; Bellamy, T.R.; Hooper, A.S.; Taylor, H.; Jouault, M.; Kille, P.; Perkins, R.G. Impact of Copper Sulphate Treatment on Cyanobacterial Blooms and Subsequent Water Quality Risks. J. Environ. Manag. 2024, 366, 121828. [Google Scholar] [CrossRef]
  24. Rice, E.; Baird, R.; Eaton, A.; Clesceri, L. Standard Methods for the Examination of Water and Wastewater; Water Environment Federation: Alexandria, VA, USA, 2012. [Google Scholar]
  25. R Core Team. R: A Language and Environment for Statistical Computing; R Foundation for Statistical Computing: Vienna, Austria, 2022. [Google Scholar]
  26. Hwang, C.P.; Lackie, T.H.; Huang, P.M. Adsorption of Inorganic Phosphorus by Lake Sediments. J. Water Pollut. Control Fed. 1976, 26, 2754–2760. [Google Scholar]
  27. Spears, B.M.; Meis, S.; Anderson, A.; Kellou, M. Comparison of Phosphorus (P) Removal Properties of Materials Proposed for the Control of Sediment p Release in UK Lakes. Sci. Total Environ. 2013, 442, 103–110. [Google Scholar] [CrossRef]
  28. Zhou, A.; Tang, H.; Wang, D. Phosphorus Adsorption on Natural Sediments: Modeling and Effects of PH and Sediment Composition. Water Res. 2005, 39, 1245–1254. [Google Scholar] [CrossRef] [PubMed]
  29. von Gunten, K.; Trew, D.; Smerdon, B.; Alessi, D.S. Natural Controls on Phosphorus Concentrations in Small Lakes in Central Alberta, Canada. Can. Water Resour. J. 2023, 48, 1–17. [Google Scholar] [CrossRef]
  30. Alam, M.S.; Barthod, B.; Li, J.; Liu, H.; Zastepa, A.; Liu, X.; Dittrich, M. Geochemical Controls on Internal Phosphorus Loading in Lake of the Woods. Chem. Geol. 2020, 558, 119873. [Google Scholar] [CrossRef]
  31. Moss, B.; Stansfield, J.; Irvine, K.; Perrow, M.; Phillips, G. Progressive Restoration of a Shallow Lake: A 12-Year Experiment in Isolation, Sediment Removal and Biomanipulation. J. Appl. Ecol. 1996, 33, 71. [Google Scholar] [CrossRef]
  32. Wright, D.I.; Shapiro, J. Nutrient Reduction by Biomanipulation: An Unexpected Phenomenon and Its Possible Cause. SIL Proc. 1922–2010 1984, 22, 518–524. [Google Scholar] [CrossRef]
  33. Duncan, A.; Kubečka, J. Land/Water Ecotone Effects in Reservoirs on the Fish Fauna. Hydrobiologia 1995, 303, 11–30. [Google Scholar] [CrossRef]
  34. Bryant, L.D.; Brockbank, N.; Austin, D. To Mix or Not to Mix? A Holistic Approach to Stratification-Preserving and Destratification Aeration of Drinking-Water Supply Reservoirs. Water Res. 2024, 261, 121974. [Google Scholar] [CrossRef]
  35. Slavin, E.I.; Wain, D.J.; Bryant, L.D.; Amani, M.; Perkins, R.G.; Blenkinsopp, C.; Simoncelli, S.; Hurley, S. The Effects of Surface Mixers on Stratification, Dissolved Oxygen, and Cyanobacteria in a Shallow Eutrophic Reservoir. Water Resour. Res. 2022, 58, e2021WR030068. [Google Scholar] [CrossRef]
  36. Lehman, J.T. Understanding the Role of Induced Mixing for Management of Nuisance Algal Blooms in an Urbanized Reservoir. Lake Reserv. Manag. 2014, 30, 63–71. [Google Scholar] [CrossRef]
  37. Santschi, P.; Höhener, P.; Benoit, G.; Buchholtz-ten Brink, M. Chemical Processes at the Sediment-Water Interface. Mar. Chem. 1990, 30, 269–315. [Google Scholar] [CrossRef]
  38. Zhou, S.; Sun, Y.; Zhang, Y.; Huang, T.; Zhou, Z.; Li, Y.; Li, Z. Pollutant Removal Performance and Microbial Enhancement Mechanism by Water-Lifting and Aeration Technology in a Drinking Water Reservoir Ecosystem. Sci. Total Environ. 2020, 709, 135848. [Google Scholar] [CrossRef] [PubMed]
  39. Austin, D.; Scharf, R.; Chen, C.F.; Bode, J. Hypolimnetic Oxygenation and Aeration in Two Midwestern USA Reservoirs. Lake Reserv. Manag. 2019, 35, 266–276. [Google Scholar] [CrossRef]
  40. Li, N.; Huang, T.; Mao, X.; Zhang, H.; Li, K.; Wen, G.; Lv, X.; Deng, L. Controlling Reduced Iron and Manganese in a Drinking Water Reservoir by Hypolimnetic Aeration and Artificial Destratification. Sci. Total Environ. 2019, 685, 497–507. [Google Scholar] [CrossRef]
  41. Kirol, A.P.; Morales-Williams, A.M.; Braun, D.C.; Marti, C.L.; Pierson, O.E.; Wagner, K.J.; Schroth, A.W. Linking Sediment and Water Column Phosphorus Dynamics to Oxygen, Temperature, and Aeration in Shallow Eutrophic Lakes. Water Resour. Res. 2024, 60, e2023WR034813. [Google Scholar] [CrossRef]
  42. Pavoni, E.; Floreani, F.; Petranich, E.; Crosera, M.; Marussi, G.; Acquavita, A.; Pisoni, C.; Klun, K.; Faganeli, J.; Covelli, S. Effect of Forced Aeration on the Biogeochemical Cycle of Nutrients and Metal (Loid) s as a Remedy for Hypoxia in a Permanently Stratified Estuary (Gulf of Trieste, Northern Adriatic Sea). Mar. Pollut. Bull. 2024, 205, 116632. [Google Scholar] [CrossRef]
  43. Tammeorg, O.; Nürnberg, G.; Niemistö, J.; Haldna, M.; Horppila, J. Internal Phosphorus Loading Due to Sediment Anoxia in Shallow Areas: Implications for Lake Aeration Treatments. Aquat. Sci. 2020, 82, 54. [Google Scholar] [CrossRef]
  44. Müller, B.; Bryant, L.D.; Matzinger, A.; Wüest, A. Hypolimnetic Oxygen Depletion in Eutrophic Lakes. Env. Sci. Technol. 2012, 46, 9964–9971. [Google Scholar] [CrossRef]
  45. Albay, M.; Akcaalan, R.; Aykulu, G.; Tufekci, H.; Beattie, K.A.; Codd, G.A. Occurrence of Toxic Cyanobacteria before and after Copper Sulphate Treatment in a Water Reservoir, Istanbul, Turkey. Arch. Hydrobiol. Suppl. Algol. Stud. 2009, 109, 67–78. [Google Scholar] [CrossRef]
  46. Le Jeune, A.H.; Charpin, M.; Deluchat, V.; Briand, J.F.; Lenain, J.F.; Baudu, M.; Amblard, C. Effect of Copper Sulphate Treatment on Natural Phytoplanktonic Communities. Aquat. Toxicol. 2006, 80, 267–280. [Google Scholar] [CrossRef]
  47. Liu, H.; Chen, S.; Zhang, H.; Wang, N.; Ma, B.; Liu, X.; Niu, L.; Yang, F.; Xu, Y.; Zhang, X. Effects of Copper Sulfate Algaecide on the Cell Growth, Physiological Characteristics, the Metabolic Activity of Microcystis Aeruginosa and Raw Water Application. J. Hazard. Mater. 2023, 445, 130604. [Google Scholar] [CrossRef] [PubMed]
Figure 1. Phosphorus (P-PO4) fractions in eight British reservoirs. (Top) Reservoir A and Reservoir B (collected February 2024); Reservoir E and F (collected May 2023); Reservoir G and H (collected June 2023). (Bottom) Reservoir C and D (collected April, August, and November 2023).
Water 17 00799 g001
Figure 2. PAC plots for a British reservoir, here named Reservoir C (collected November 2023). (Top): EPC plot. Dashed lines show the standard error of the curve; the grey vertical line marks the EPC (0.04 mg/L). (Bottom): Freundlich plot. C = final concentration, OP mg/L; E = phosphate absorbed at equilibrium, OP mg/g.
Water 17 00799 g002
Figure 3. Orthophosphate (PO4-P, mg/L) in water column of eight British reservoirs, grouped by sampling level or point. EPC for each reservoir is indicated by a horizonal line. Note that the scale of the y-axis is different for Reservoirs E and F to the other plots and that Reservoir F uses total phosphate (TP) data. For each reservoir location points and water depths of samples are indicated where they varied between reservoirs as a function of different water company monitoring programmes.
Water 17 00799 g003
Table 1. Summary collection dates and water column sampling depths for sediment samples collected between April 2023 and February 2024 from eight British reservoirs, belonging to four different water companies.
Water CompanyReservoirSediment Sampling DatesWater Column
Sampling Depth, m
Company 1Reservoir AFebruary 241.4–1.8
Company 1Reservoir BFebruary 245.9–6.0
Company 1Reservoir CApril, August, November 237.0–14.0
Company 2Reservoir DApril, August, November 238.5–11.5
Company 3Reservoir EMay 234.0–10.0
Company 3Reservoir FMay 234.0–16.0
Company 4Reservoir GJune 239.0–23.0
Company 4Reservoir HJune 2312.0–24.0
Table 2. Iron (Fe) and water content for sediment samples (±standard error (se)) taken from eight British reservoirs.
ReservoirFe, mg/kg, ±seWater Content, %w/w, ±se
Reservoir A6600 ± 120065 ± 0.66
Reservoir BNot measured62 ± 2.71
Reservoir C35,700 ± 150080 ± 1.28
Reservoir D33,400 ± 205083 ± 1.41
Reservoir E52,700 ± 155082 ± 0.31
Reservoir F27,200 ± 210086 ± 0.34
Reservoir G27,950 ± 195081 ± 0.44
Reservoir H36,450 ± 265077 ± 0.20
Table 3. Equilibrium phosphorus concentration (EPC) with standard error (se); Freundlich equations with r2, for eight British reservoirs.
ReservoirMonthEPC, mg P-PO4/L ± seFreundlich, E Freundlich, r2
Reservoir AFebruary0.03 ± 0.0020.13C0.890.88
Reservoir BFebruary0.06 ± 0.0020.09C1.090.80
Reservoir CApril0.03 ± 0.0010.22C0.950.78
Reservoir CAugust0.016 ± 0.0030.94C1.040.63
Reservoir CNovember0.03 ± 0.0010.22C1.100.90
Reservoir DApril0.007 ± 0.00040.37C0.810.46
Reservoir DAugustNot well defined0.59C0.470.22
Reservoir DNovember0.007 ± 0.000050.79C0.820.52
Reservoir EMay0.44 ± 0.020.03C0.990.67
Reservoir FMay0.49 ± 0.020.07C1.110.68
Reservoir GJune0.018 ± 0.0030.095C0.620.86
Reservoir HJune0.013 ± 0.00060.28C0.720.88
Disclaimer/Publisher’s Note: The statements, opinions and data contained in all publications are solely those of the individual author(s) and contributor(s) and not of MDPI and/or the editor(s). MDPI and/or the editor(s) disclaim responsibility for any injury to people or property resulting from any ideas, methods, instructions or products referred to in the content.

